Dietary Interventions and Changes in Cardio-Metabolic Parameters in Metabolically Healthy Obese Subjects: A Systematic Review with Meta-Analysis

Abstract
:
1. Introduction
2. Experimental Section
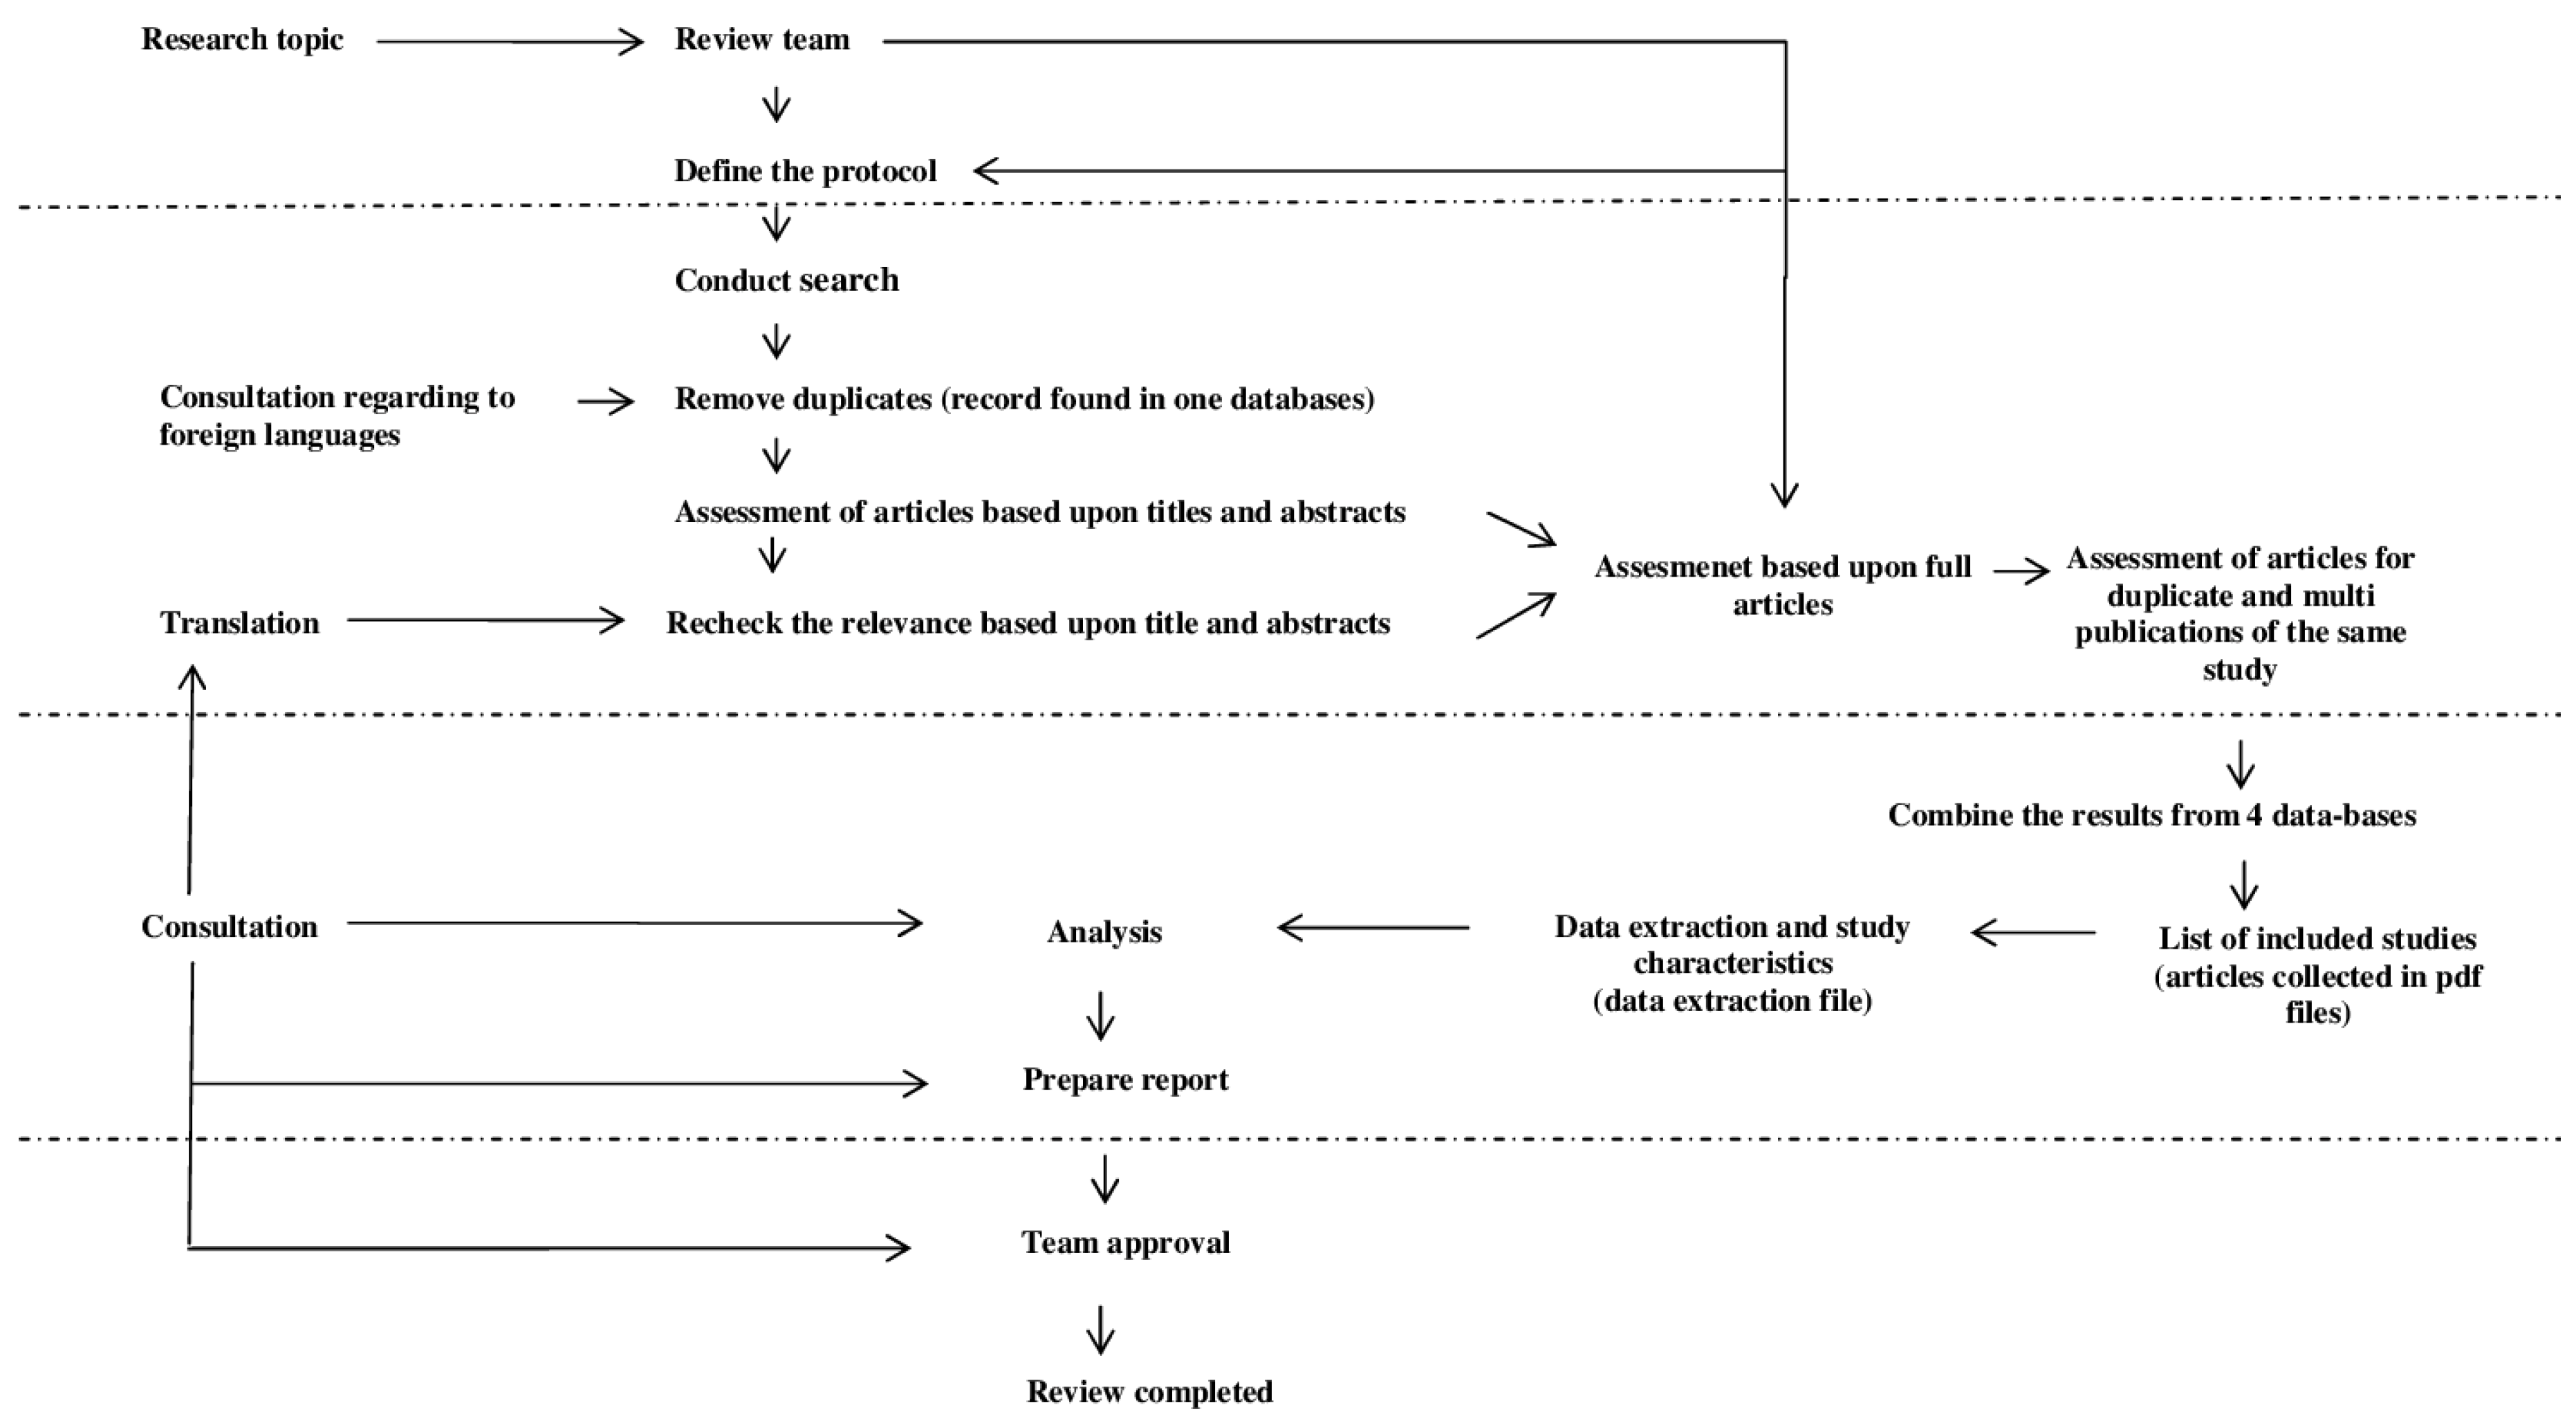
2.1. Search Strategy
2.2. Metabolically Healthy Obese—Definition
2.3. Inclusion and Exclusion Criteria
2.4. Data Extraction and Analysis
3. Results
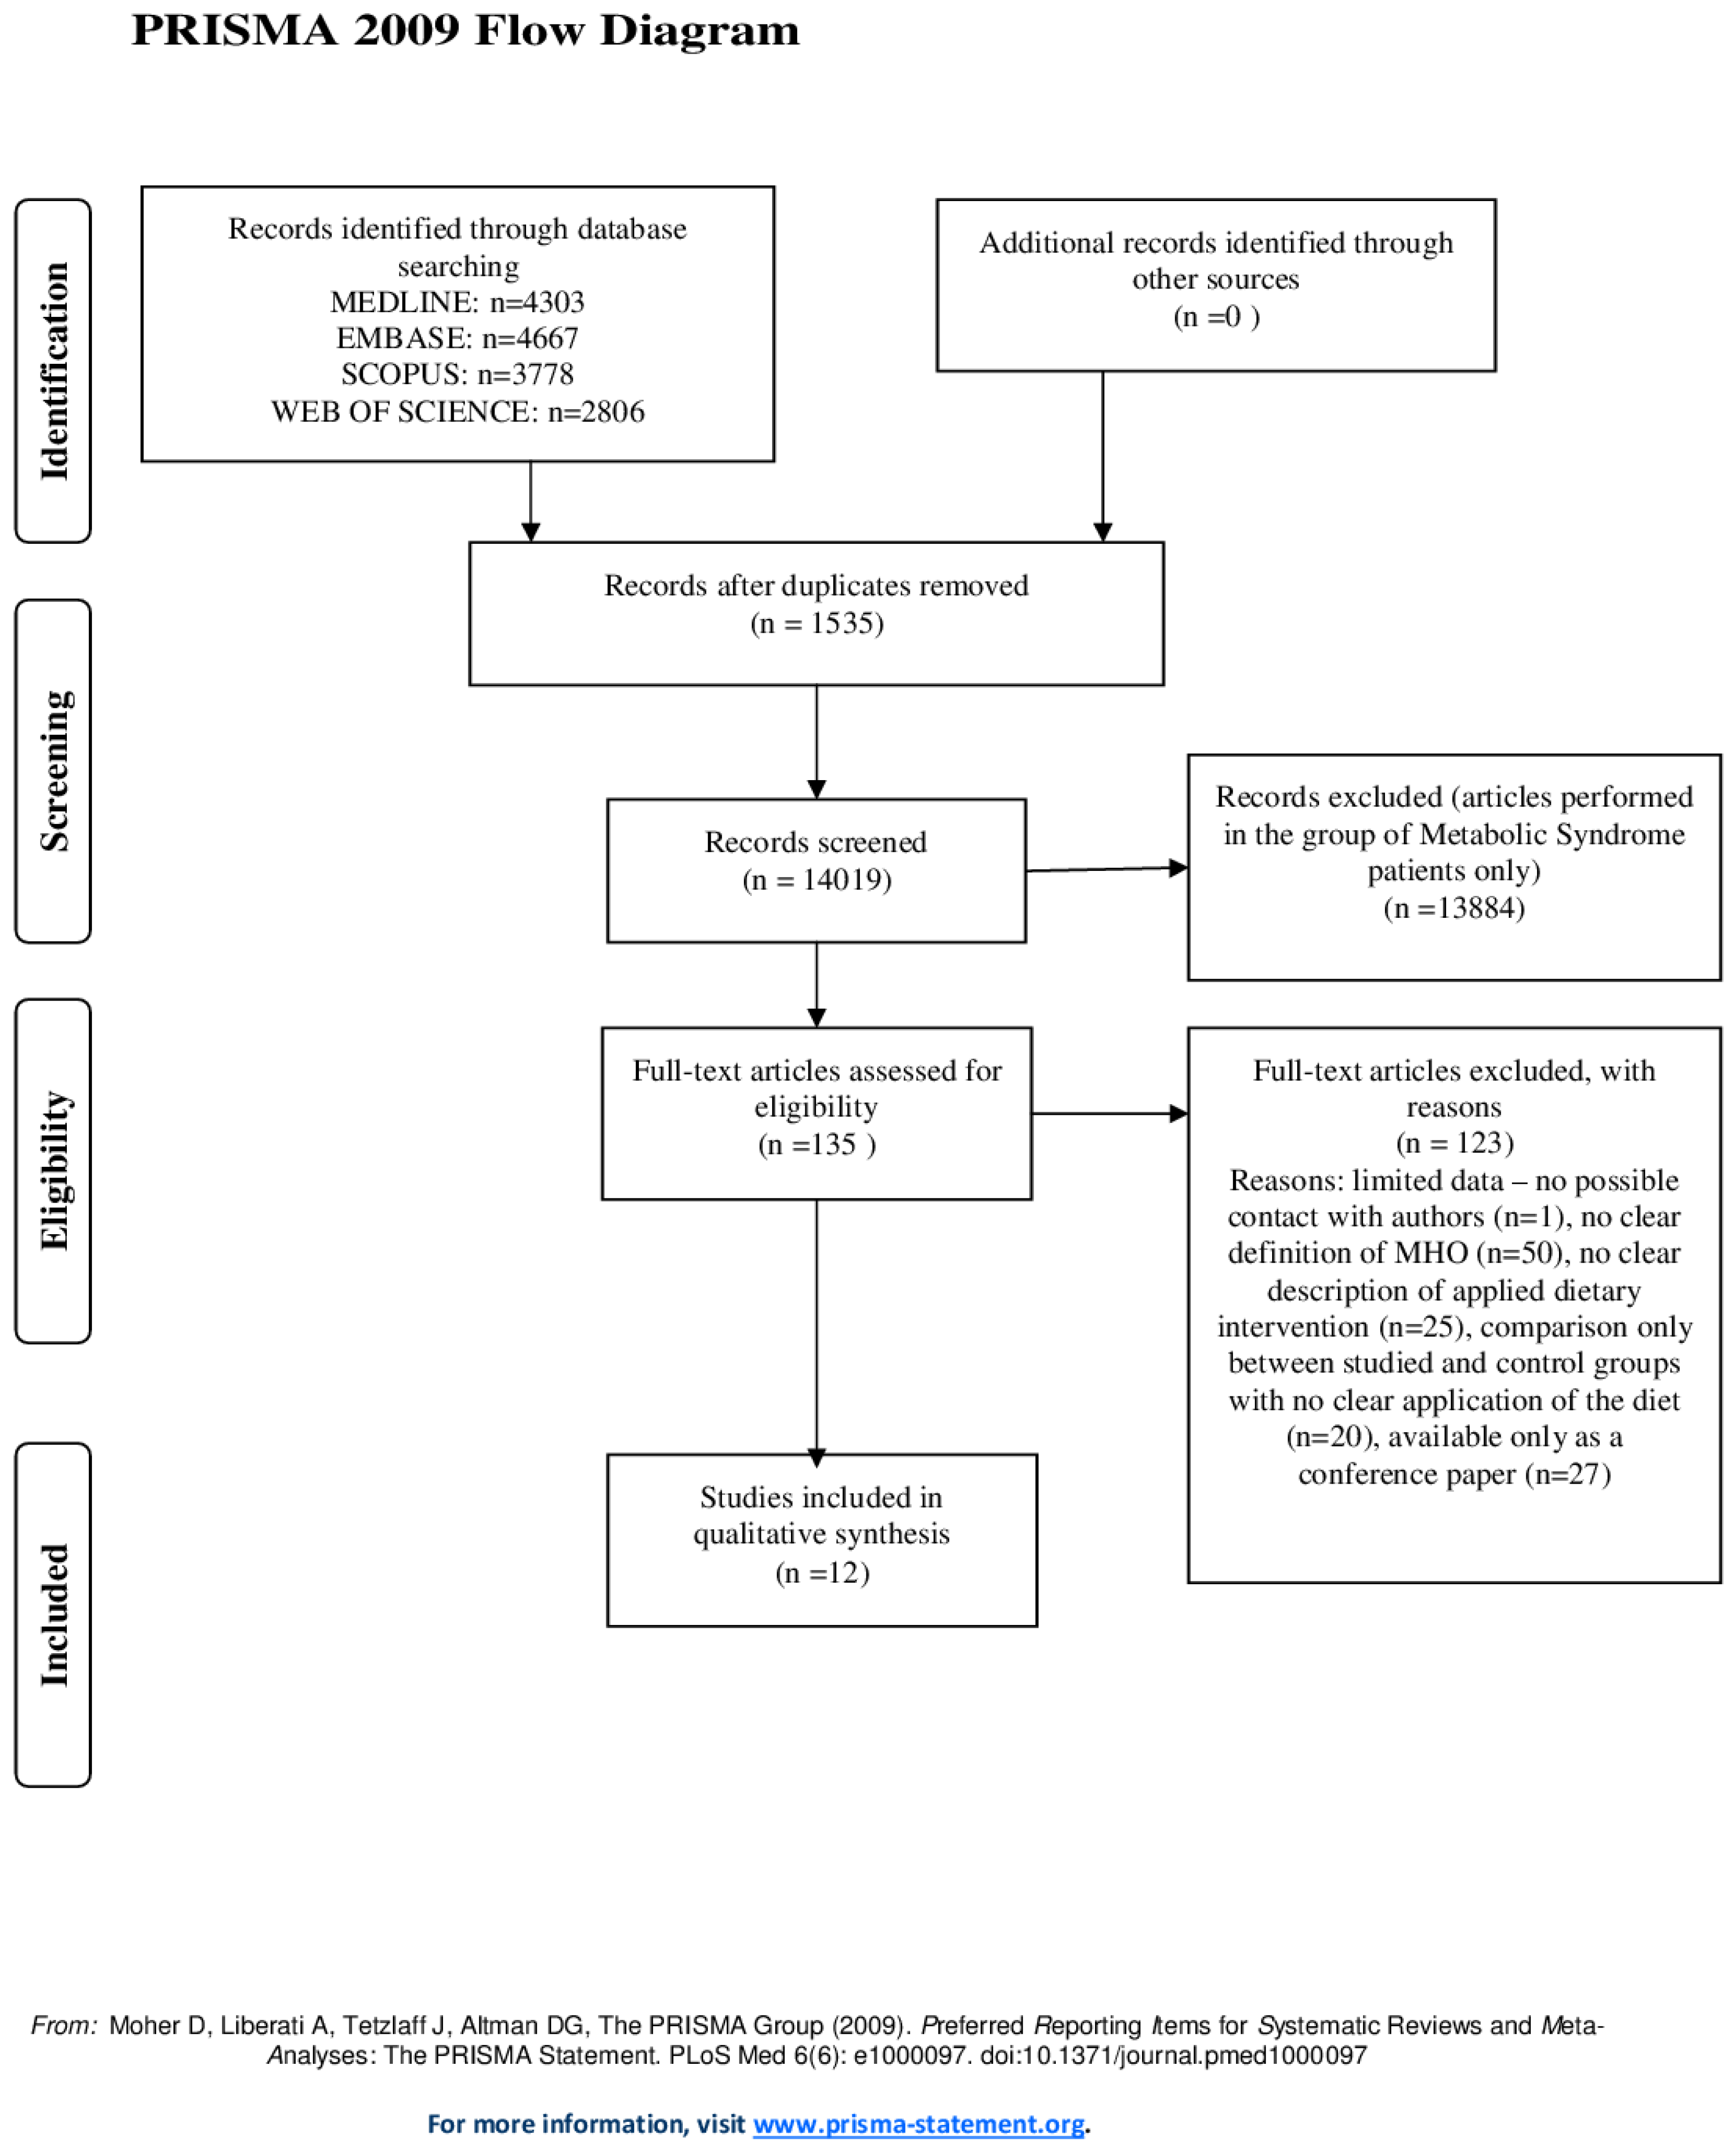
3.1. Search Results
3.2. Studies and Populations Characteristics
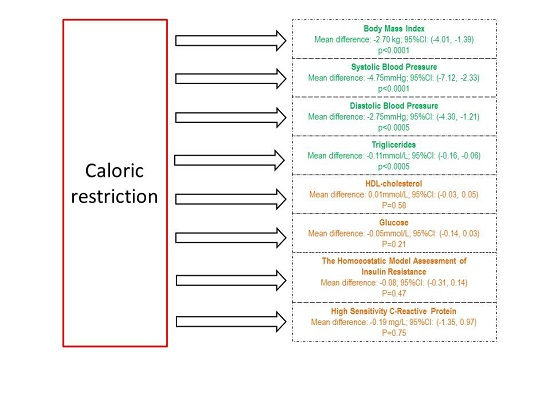
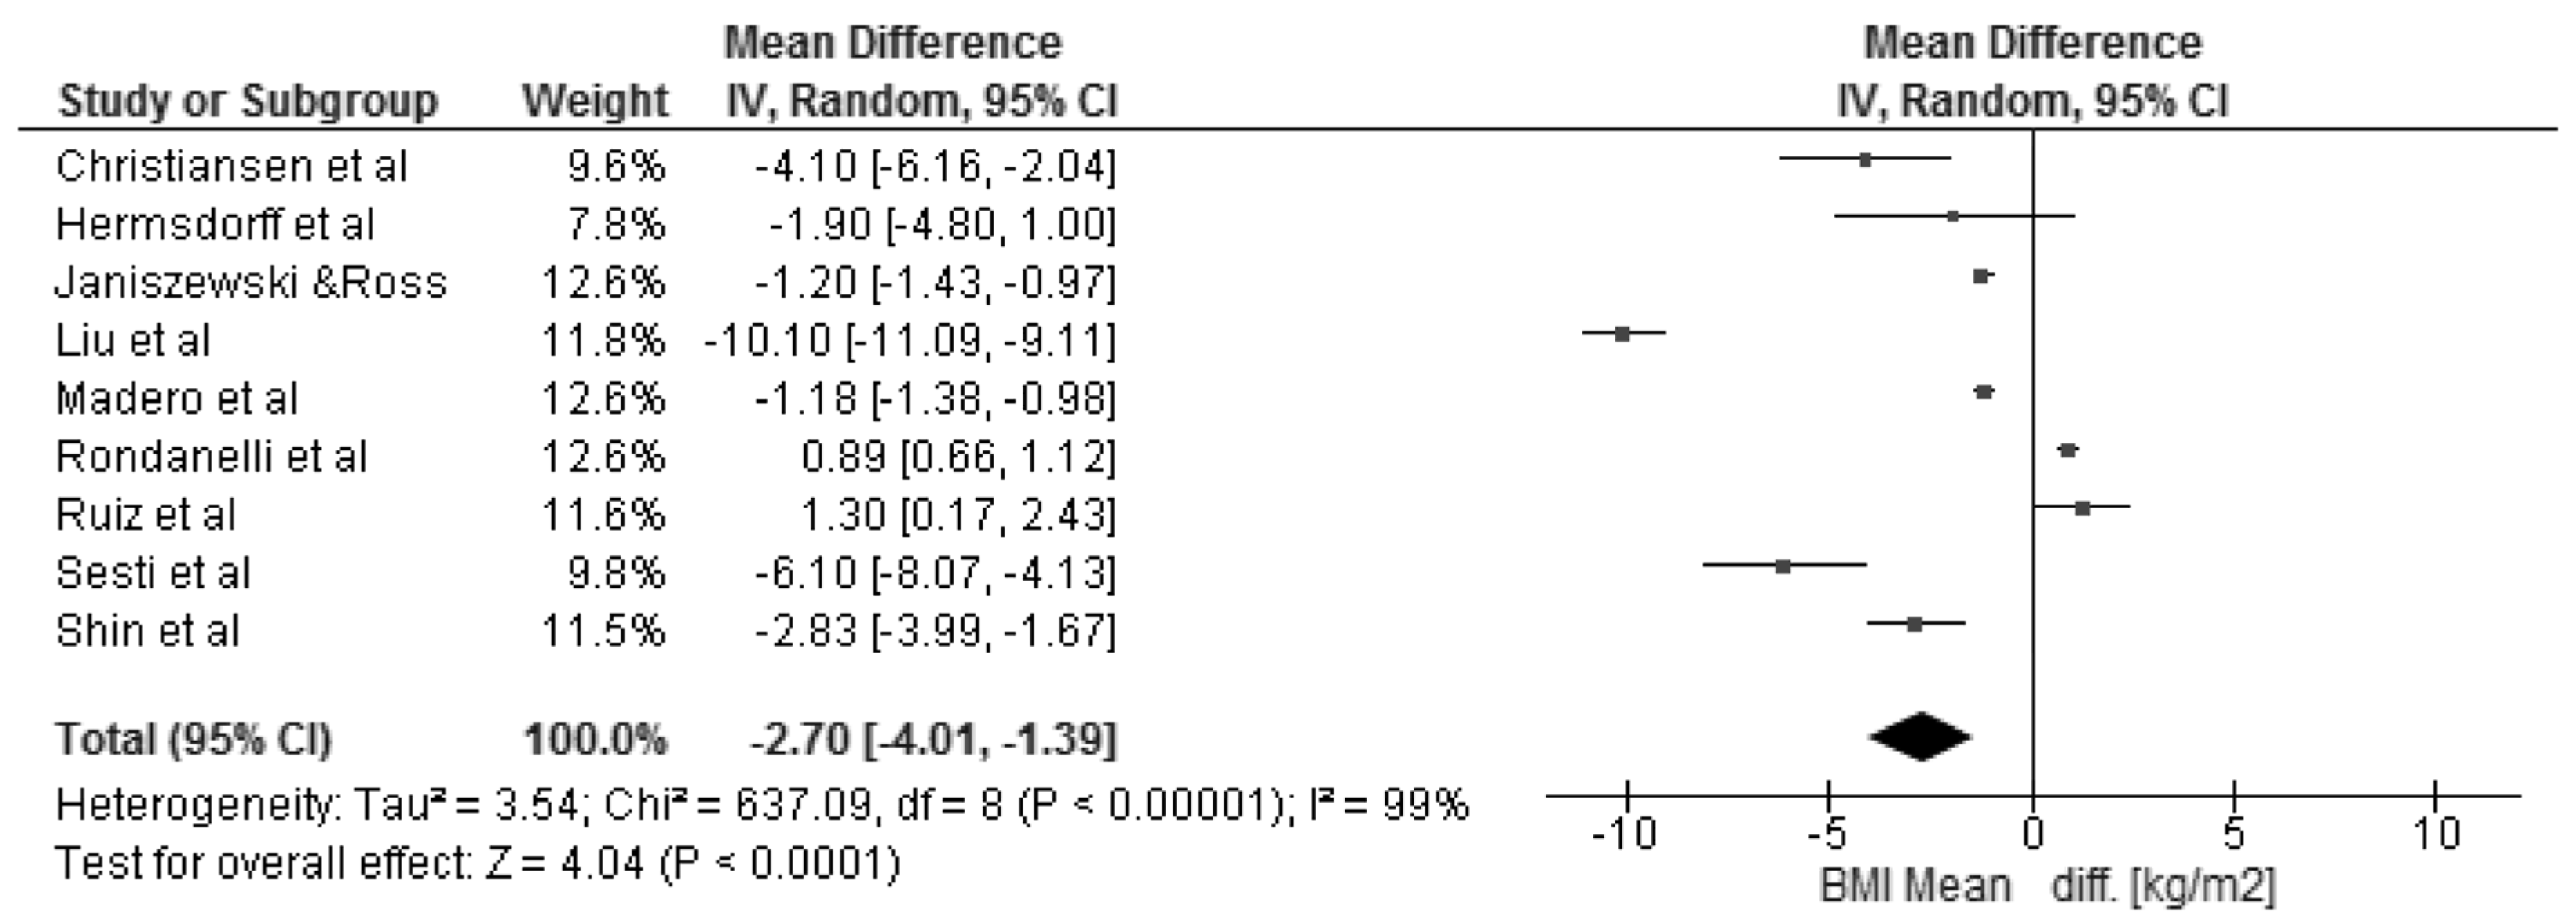
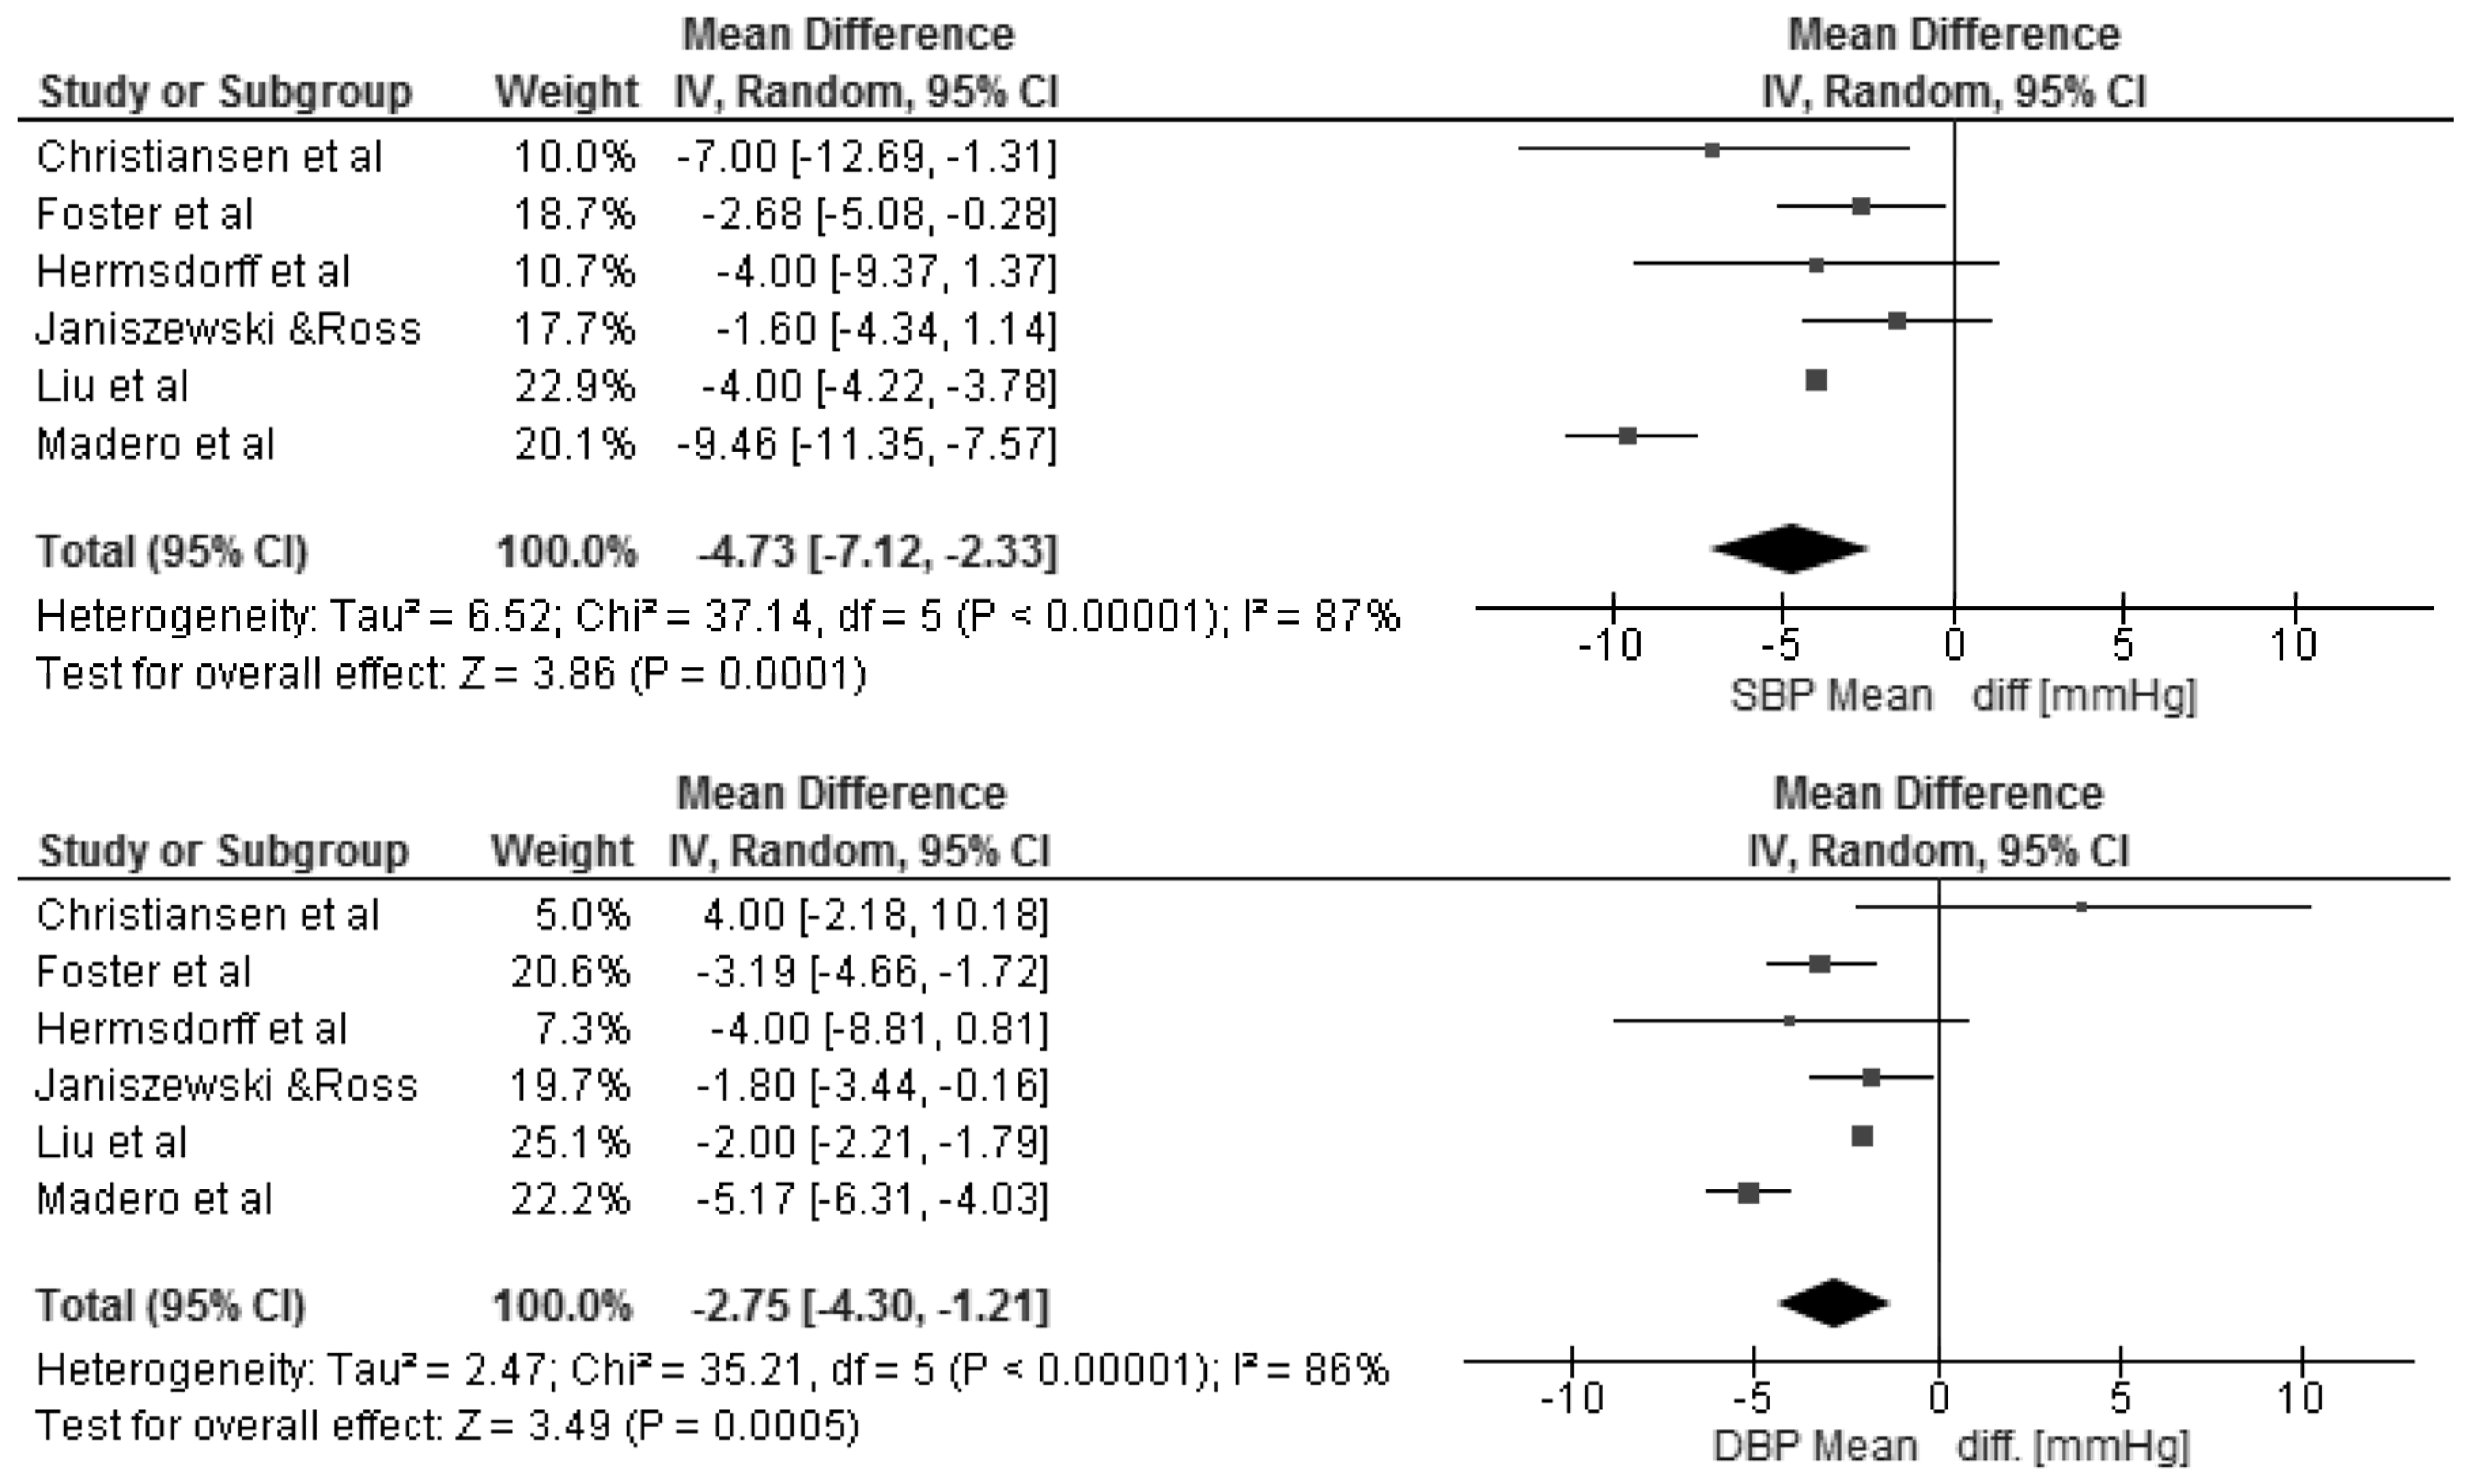
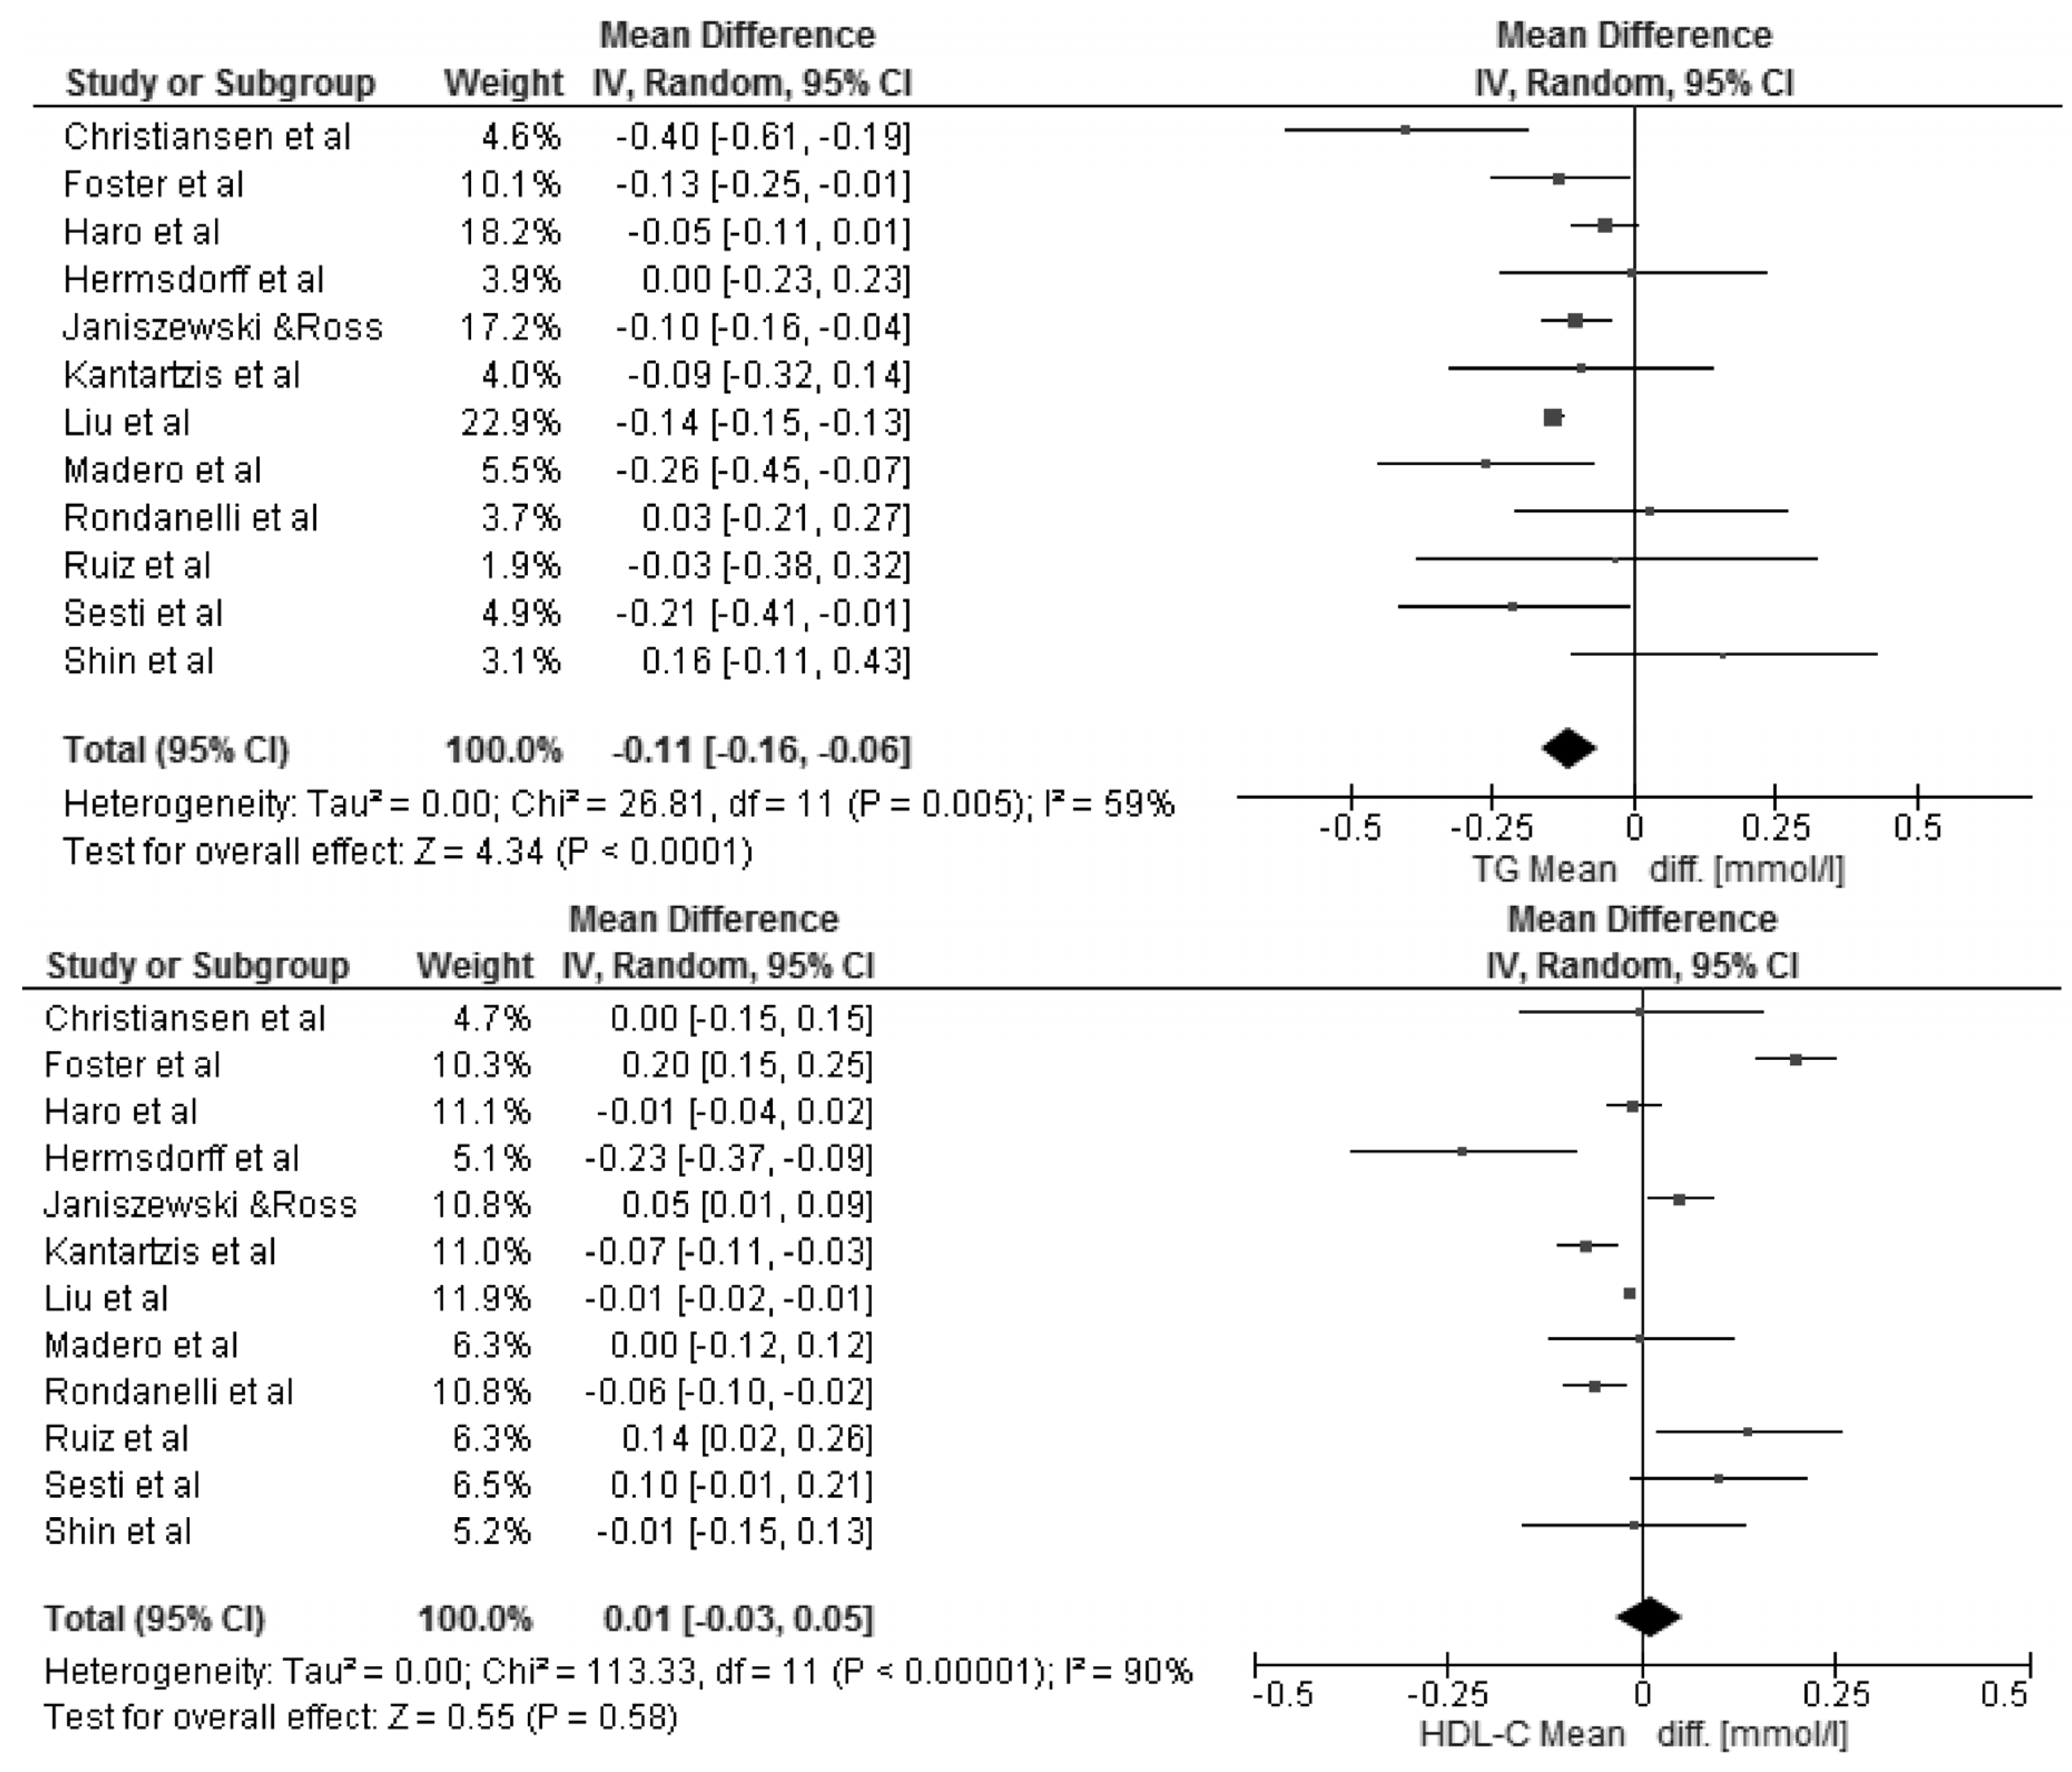
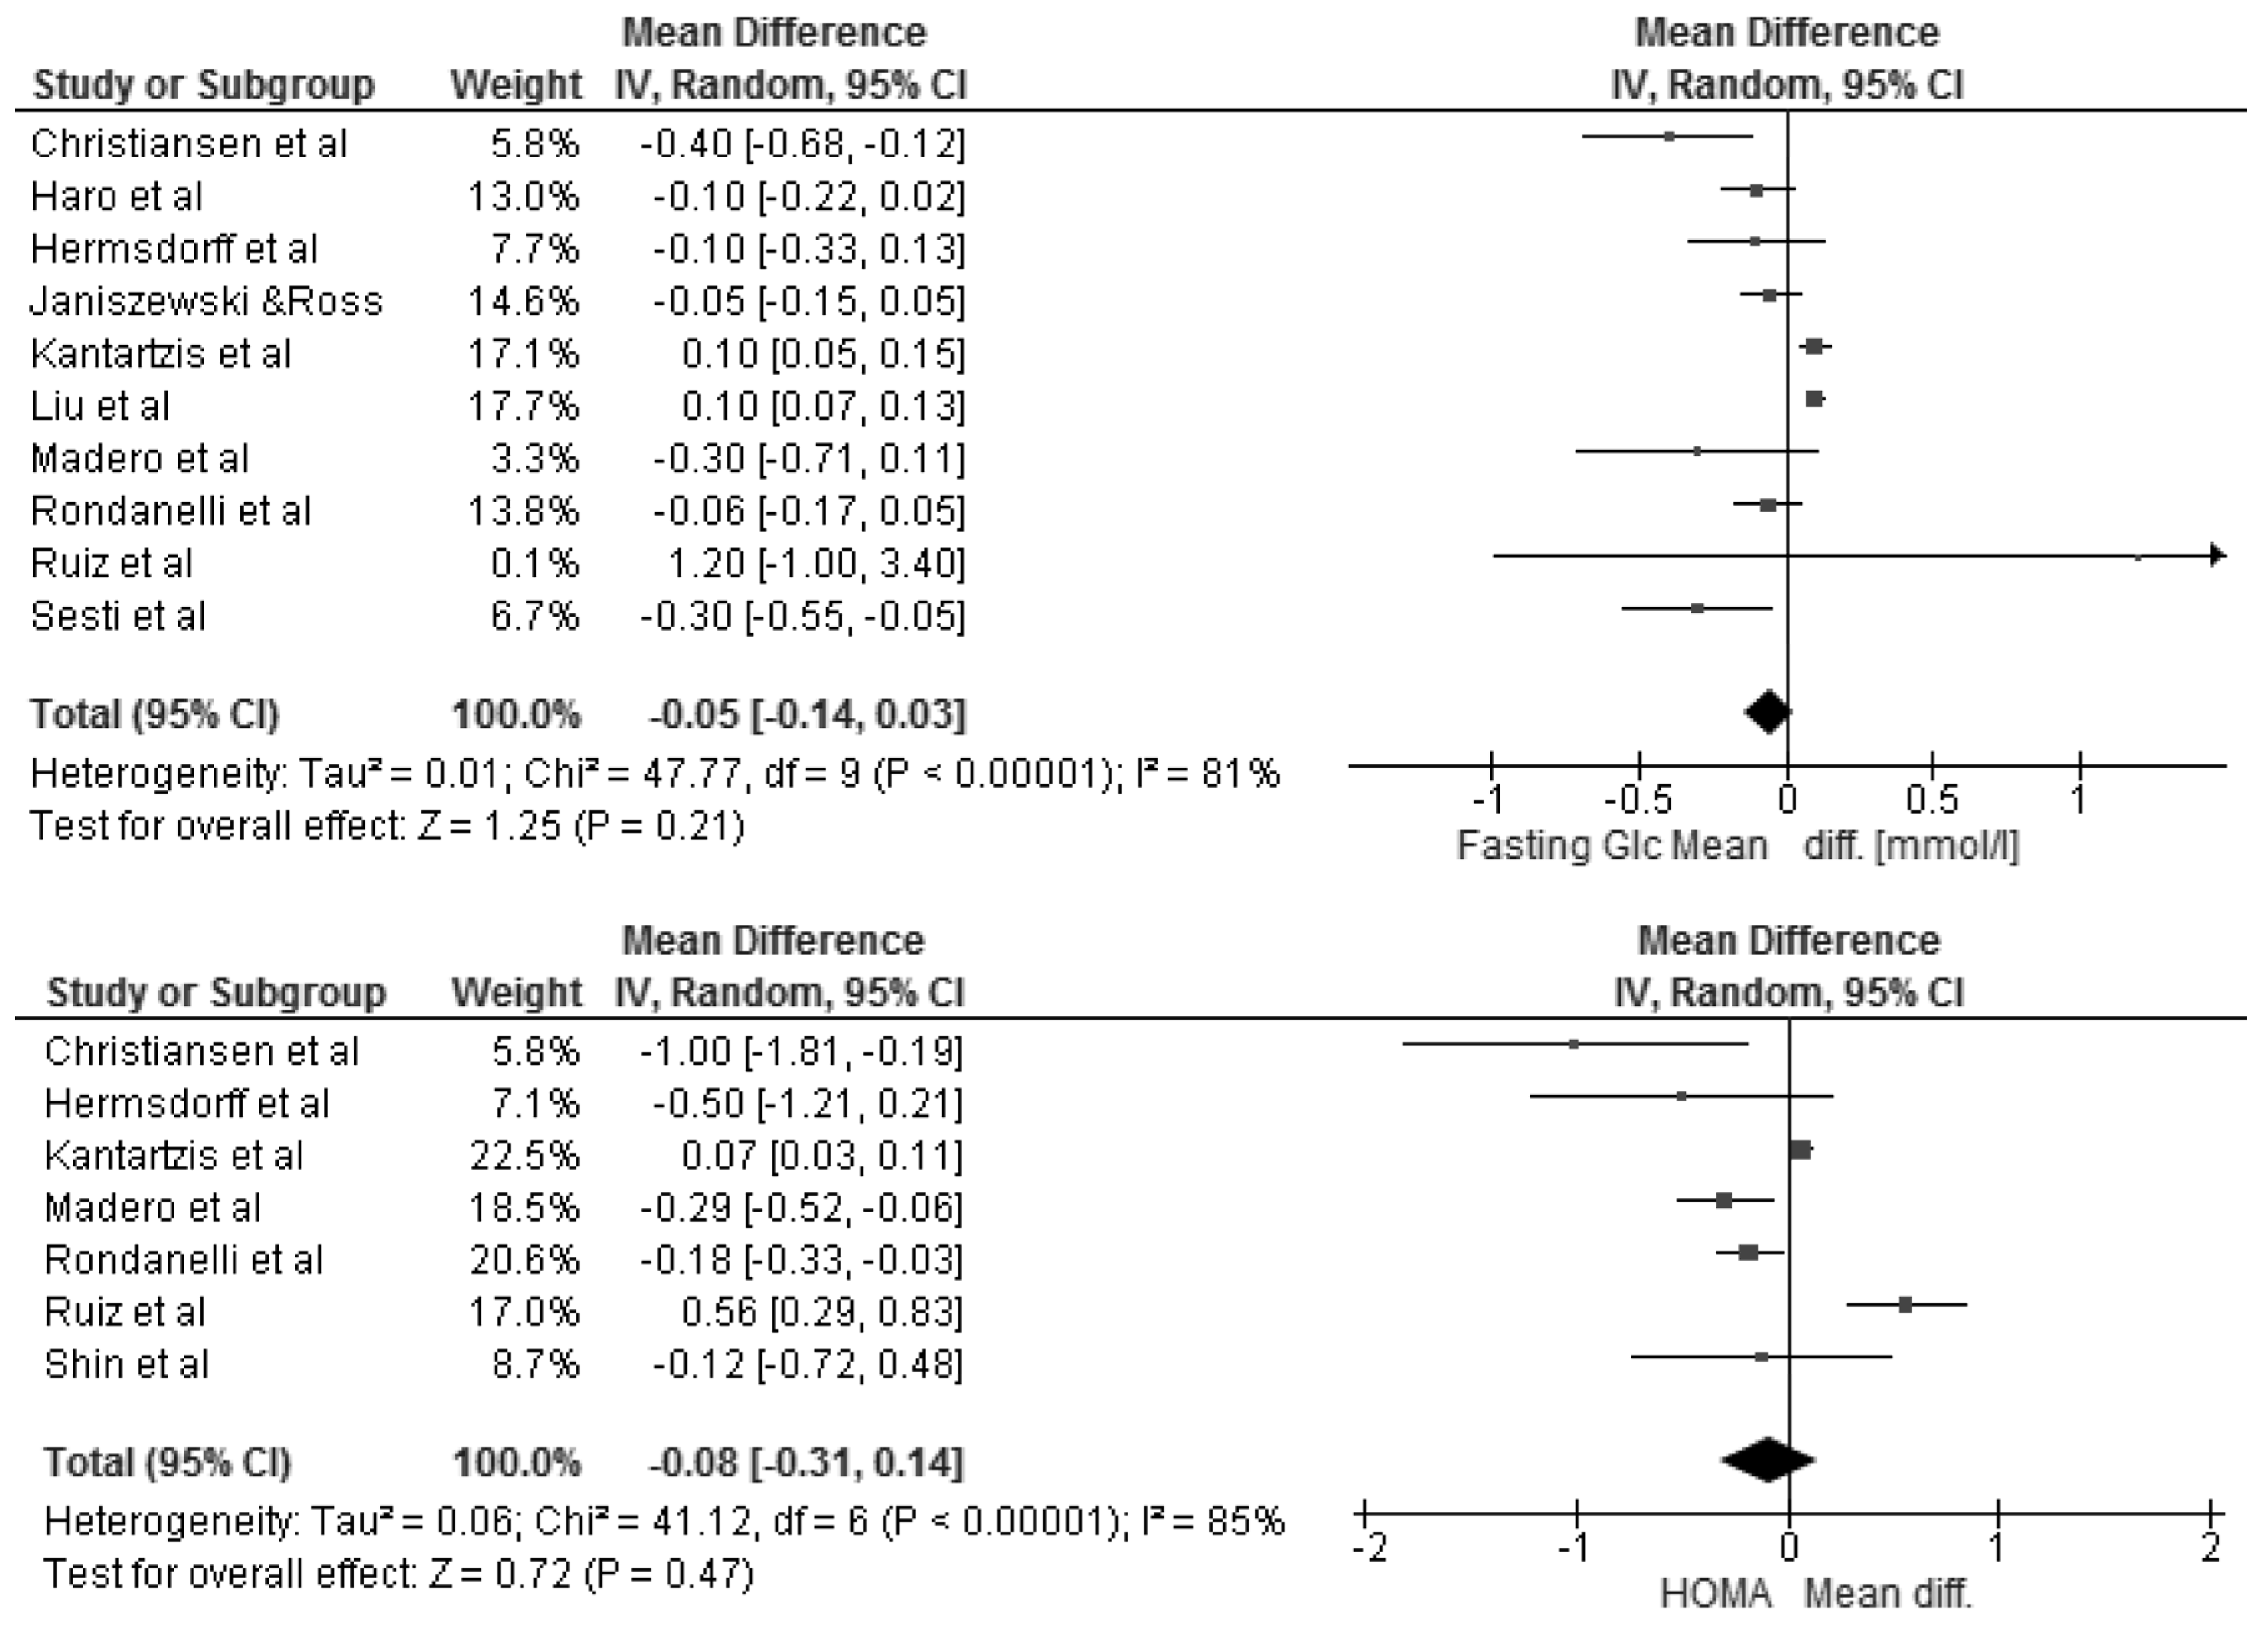
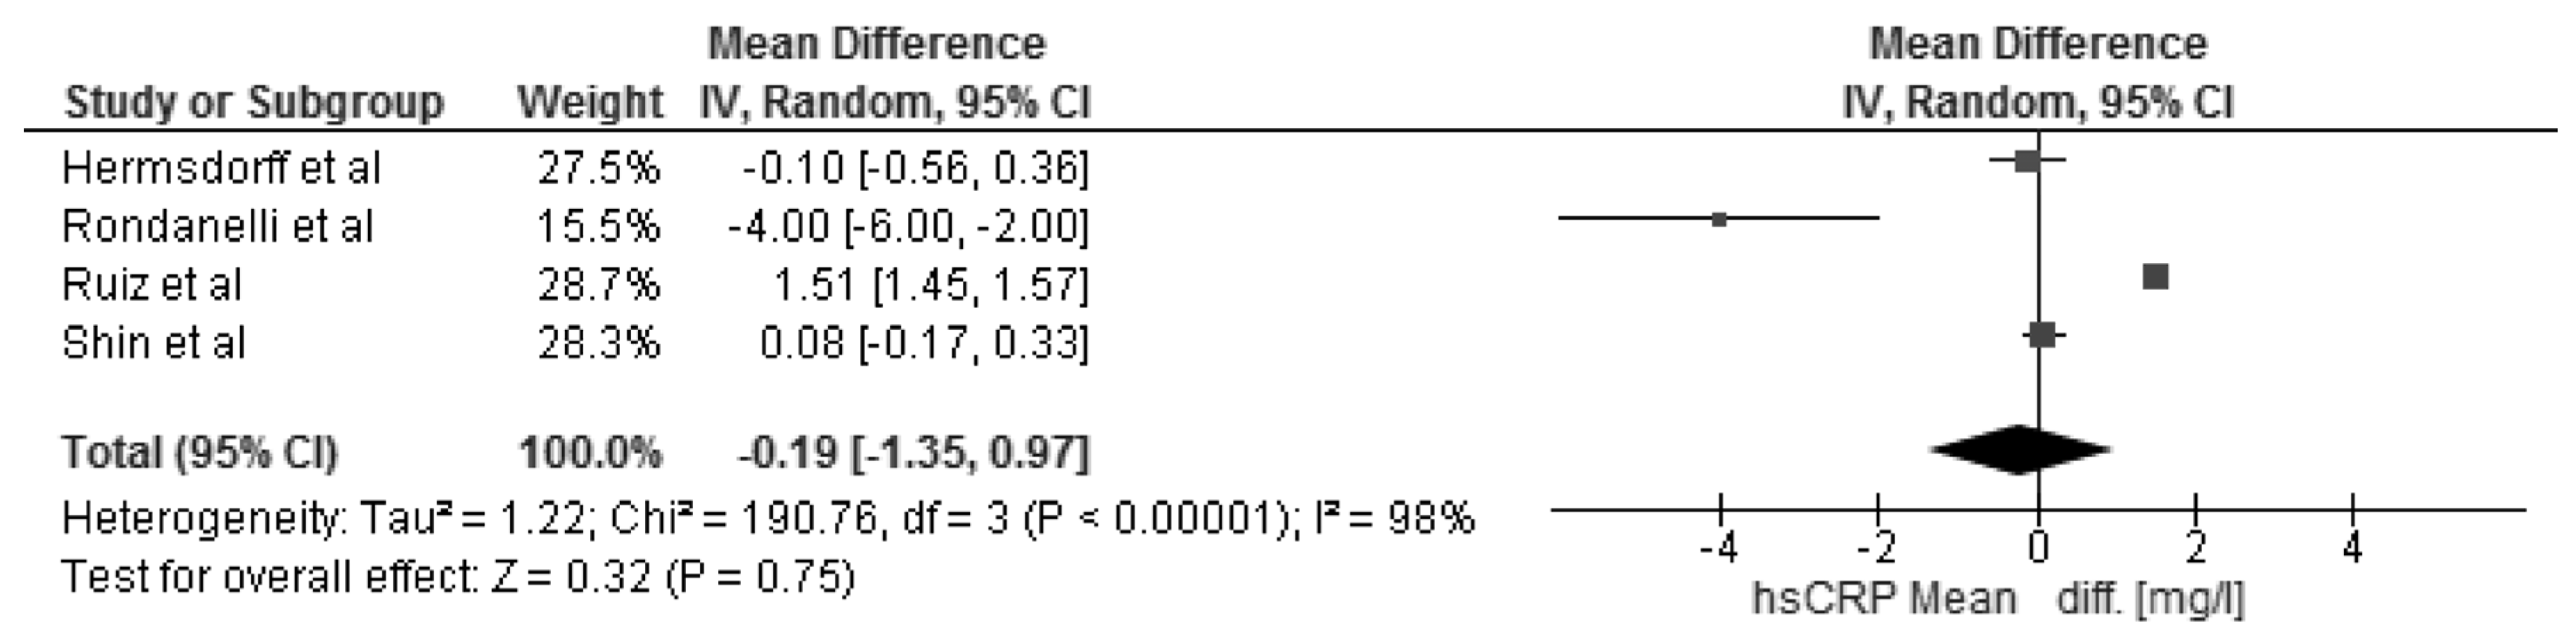
3.3. Changes in Body Mass Index and Selected Cardio-Metabolic Outcomes during Dietary Interventions
4. Discussion
5. Limitations
6. Conclusions
Supplementary Materials
Acknowledgments
Authors Contributions
Conflicts of Interest
References
- Kelly, T.; Yang, W.; Chen, C.S.; Reynolds, K.; He, J. Global burden of obesity in 2005 and projections to 2030. Int. J. Obes. 2008, 32, 1431–1437. [Google Scholar] [CrossRef] [PubMed]
- Flegal, K.M.; Kit, B.K.; Orpana, H.; Graubard, B.I. Association of all-cause mortality with overweight and obesity using standard body mass index categories: A systematic review and meta-analysis. JAMA 2013, 309, 71–82. [Google Scholar] [CrossRef] [PubMed]
- Ruderman, N.B.; Schneider, S.H.; Berchtold, P. The “metabolically obese”, normal-weight individual. Am. J. Clin. Nutr. 1981, 34, 1617–1621. [Google Scholar] [CrossRef] [PubMed]
- Wildman, R.P.; Muntner, P.; Reynolds, K.; McGinn, A.P.; Rajpathak, S.; Wylie-Rosett, J.; Sowers, M.R. The obese without cardiometabolic risk factor clustering and the normal weight with cardiometabolic risk factor clustering: Prevalence and correlates of 2 phenotypes among the US population (NHANES 1999–2004). Arch. Intern. Med. 2008, 168, 1617–1624. [Google Scholar] [CrossRef] [PubMed]
- Meigs, J.B.; Wilson, P.W.; Fox, C.S.; Vasan, R.S.; Nathan, D.M.; Sullivan, L.M.; D’Agostino, R.B. Body mass index, metabolic syndrome, and risk of type 2 diabetes or cardiovascular disease. J. Clin. Endocrinol. Metab. 2006, 91, 2906–2912. [Google Scholar] [CrossRef] [PubMed]
- Executive summary of the third report of the National Cholesterol Education Program (NCEP) expert panel on detection, evaluation, and treatment of high blood cholesterol in adults (adult treatment panel III). JAMA 2001, 285, 2486–2497.
- Van Vliet-Ostaptchouk, J.V.; Nuotio, M.L.; Slagter, S.N.; Doiron, D.; Fischer, K.; Foco, L.; Gaye, A.; Gögele, M.; Heier, M.; Hiekkalinna, T.; et al. The prevalence of metabolic syndrome and metabolically healthy obesity in Europe: A collaborative analysis of ten large cohort studies. BMC Endocr. Disord. 2014, 14, 9. [Google Scholar] [CrossRef] [PubMed] [Green Version]
- Soriguer, F.; Gutiérrez-Repiso, C.; Rubio-Martín, E.; García-Fuentes, E.; Almaraz, M.C.; Colomo, N.; de Antonio, I.E.; de Adana, M.S.R.; Chaves, F.J.; Morcillo, S.; et al. Metabolically healthy but obese, a matter of time? Findings from the prospective Pizarra study. J. Clin. Endocrinol. Metab. 2013, 98, 2318–2325. [Google Scholar] [CrossRef] [PubMed]
- Schröder, H.; Ramos, R.; Baena-Díez, J.M.; Mendez, M.A.; Canal, D.J.; Fito, M.; Sala, J.; Elosua, R. Determinants of the transition from a cardiometabolic normal to abnormal overweight/obese phenotype in a Spanish population. Eur. J. Nutr. 2013, 53, 1345–1353. [Google Scholar] [CrossRef] [PubMed]
- Moher, D.; Liberati, A.; Tetzlaff, J.; Altman, D.G.; PRISMA Group. Preferred reporting items for systematic reviews and meta-analyses: The PRISMA statement. PLoS Med. 2009, 6, e1000097. [Google Scholar] [CrossRef] [PubMed]
- Stefan, N.; Häring, H.U.; Hu, F.B.; Schulze, M.B. Metabolically healthy obesity: Epidemiology, mechanisms, and clinical implications. Lancet Diabetes Endocrinol. 2013, 1, 152–162. [Google Scholar] [CrossRef]
- Bo, S.; Musso, G.; Gambino, R.; Villois, P.; Gentile, L.; Durazzo, M.; Cavallo-Perin, P.; Cassader, M. Prognostic implications for insulin-sensitive and insulin-resistant normal-weight and obese individuals from a population-based cohort. Am. J. Clin. Nutr. 2012, 96, 962–969. [Google Scholar] [CrossRef] [PubMed]
- Calori, G.; Lattuada, G.; Piemonti, L.; Garancini, M.P.; Ragogna, F.; Villa, M.; Mannino, S.; Crosignani, P.; Bosi, S.; Luzi, L.; et al. Prevalence, metabolic features, and prognosis of metabolically healthy obese Italian Individuals: The Cremona Study. Diabetes Care 2011, 34, 210–215. [Google Scholar] [CrossRef] [PubMed]
- Hamer, M.; Stamatakis, E. Metabolically healthy obesity and risk of all-cause and cardiovascular disease mortality. J. Clin. Endocrinol. Metab. 2012, 97, 2482–2488. [Google Scholar] [CrossRef] [PubMed]
- Wells, G.; Shea, B.; O’Connell, D.; Peterson, J.; Welch, V.; Losos, M.; Tugwell, P. The Newcastle-Ottawa Scale (NOS) for Assessing the Quality of Nonrandomized Studies in Meta–Analyses. Available online: http://www.ohri.ca/programs/clinical_epidemiology/oxford.htm (accessed on 17 June 2016).
- Borenstein, M.; Hedges, L.V.; Higgins, J.P.T.; Rothstein, H.R. Introduction to Meta-Analysis; John Wiley & Sons Ltd.: Chichester, UK, 2009. [Google Scholar]
- Rondanelli, M.; Klersy, C.; Perna, S.; Faliva, M.A.; Montorfano, G.; Roderi, P.; Colombo, I.; Corsetto, P.A.; Fioravanti, M.; Solerte, S.B.; et al. Effects of two-months balanced diet in metabolically healthy obesity: Lipid correlations with gender and BMI-related differences. Lipids Health Dis. 2015, 14, 139. [Google Scholar] [CrossRef] [PubMed]
- Ruiz, J.R.; Ortega, F.B.; Labayen, I. A weight loss diet intervention has a similar beneficial effect on both metabolically abnormal obese and metabolically healthy but obese premenopausal women. Ann. Nutr. Metab. 2013, 62, 223–230. [Google Scholar] [CrossRef] [PubMed]
- Kantartzis, K.; Machann, J.; Schick, F.; Rittig, K.; Machicao, F.; Fritsche, A.; Häring, H.-U.; Stefan, N. Effects of a lifestyle intervention in metabolically benign and malign obesity. Diabetologia 2011, 54, 864–868. [Google Scholar] [CrossRef] [PubMed]
- Janiszewski, P.M.; Ross, R. Effects of weight loss among metabolically healthy obese men and women. Diabetes Care 2010, 33, 1957–1959. [Google Scholar] [CrossRef] [PubMed]
- Shin, M.J.; Hyun, Y.J.; Kim, O.Y.; Kim, J.Y.; Jang, Y.; Lee, J.H. Weight loss effect on inflammation and LDL oxidation in metabolically healthy but obese (MHO) individuals: Low inflammation and LDL oxidation in MHO women. Int. J. Obes. 2006, 30, 1529–1534. [Google Scholar] [CrossRef] [PubMed]
- Phillips, C.M. Metabolically healthy obesity: Definitions, determinants and clinical implications. Rev. Endocr. Metab. Disord. 2013, 14, 219–227. [Google Scholar] [CrossRef] [PubMed]
- Liu, R.H.; Wharton, S.; Sharma, A.M.; Ardern, C.I.; Kuk, J.L. Influence of a clinical lifestyle-based weight loss program on the metabolic risk profile of metabolically normal and abnormal obese adults. Obesity 2013, 21, 1533–1539. [Google Scholar] [CrossRef] [PubMed]
- Sesti, G.; Folli, F.; Perego, L.; Hribal, M.L.; Pontiroli, A.E. Effects of weight loss in metabolically healthy obese subjects after laparoscopic adjustable gastric banding and hypocaloric diet. PLoS ONE 2011, 6, e17737. [Google Scholar] [CrossRef] [PubMed]
- Haro, C.; Montes-Borrego, M.; Rangel-Zúñiga, O.A.; Alcalá-Díaz, J.F.; Gómez-Delgado, F.; Pérez-Martínez, P.; Delgado-Lista, J.; Quintana-Navarro, G.M.; Tinahones, F.J.; Landa, B.B.; et al. Two Healthy Diets Modulate Gut Microbial Community Improving Insulin Sensitivity in a Human Obese Population. J. Clin. Endocrinol. Metab. 2016, 101, 233–242. [Google Scholar] [CrossRef] [PubMed]
- Madero, M.; Arriaga, J.C.; Jalal, D.; Rivard, C.; McFann, K.; Pérez-Méndez, O.; Vázquez, A.; Ruiz, A.; Lanaspa, M.A.; Jimenez, C.R.; et al. The effect of two energy-restricted diets, a low-fructose diet versus a moderate natural fructose diet, on weight loss and metabolic syndrome parameters: A randomized controlled trial. Metabolism 2011, 60, 1551–1559. [Google Scholar] [CrossRef] [PubMed]
- Foster, G.D.; Wyatt, H.R.; Hill, J.O.; Makris, A.P.; Rosenbaum, D.L.; Brill, C.; Stein, R.I.; Mohammed, B.S.; Miller, B.; Rader, D.J.; et al. Weight and metabolic outcomes after 2 years on a low-carbohydrate versus low-fat diet: A randomized trial. Ann. Intern. Med. 2010, 153, 147–157. [Google Scholar] [CrossRef] [PubMed]
- Hermsdorff, H.H.M.; Zulet, M.Á.; Abete, I.; Martínez, J.A. A legume-based hypocaloric diet reduces proinflammatory status and improves metabolic features in overweight/obese subjects. Eur. J. Nutr. 2011, 50, 61–69. [Google Scholar] [CrossRef] [PubMed]
- Christiansen, T.; Paulsen, S.K.; Bruun, J.M.; Pedersen, S.B.; Richelsen, B. Exercise training versus diet-induced weight-loss on metabolic risk factors and inflammatory markers in obese subjects: A 12-week randomized intervention study. Am. J. Physiol. Endocrinol. Metab. 2010, 298, E824–E831. [Google Scholar] [CrossRef] [PubMed]
- Chang, Y.; Ryu, S.; Suh, B.S.; Yun, K.E.; Kim, C.-W.; Cho, S.-I. Impact of BMI on the incidence of metabolic abnormalities in metabolically healthy men. Int. J. Obes. 2012, 36, 1187–1194. [Google Scholar] [CrossRef] [PubMed]
- Ortega, F.B.; Lee, D.C.; Katzmarzyk, P.T.; Ruiz, J.R.; Sui, X.; Church, T.S.; Blair, S.N. The intriguing metabolically healthy but obese phenotype: Cardiovascular prognosis and role of fitness. Eur. Heart J. 2013, 34, 389–397. [Google Scholar] [CrossRef] [PubMed]
- Arnlov, J.; Ingelsson, E.; Sundstrom, J.; Lind, L. Impact of body mass index and the metabolic syndrome on the risk of cardiovascular disease and death in middle-aged men. Circulation 2010, 121, 230–236. [Google Scholar] [CrossRef] [PubMed]
- Berentzen, T.L.; Jakobsen, M.U.; Halkjaer, J.; Tjønneland, A.; Overvad, K.; Sørensen, T.I.A. Changes in waist circumference and mortality in middle-aged men and women. PLoS ONE 2010, 5, e13097. [Google Scholar] [CrossRef] [PubMed]
- Stelmach-Mardas, M.; Mardas, M.; Warchoł, W.; Jamka, M.; Walkowiak, J. Successful maintenance of body weight reduction after individualized dietary counseling in obese subjects. Sci. Rep. 2014, 4, 6620. [Google Scholar] [CrossRef] [PubMed]
- Phillips, C.M.; Perry, I.J. Lipoprotein particle subclass profiles among metabolically healthy and unhealthy obese and non-obese adults: Does size matter? Atherosclerosis 2015, 242, 399–406. [Google Scholar] [CrossRef] [PubMed]
- Perreault, M.; Zulyniak, M.A.; Badoud, F.; Stephenson, S.; Badawi, A.; Buchholz, A.; Mutch, D.M. A distinct fatty acid profile underlies the reduced inflammatory state of metabolically healthy obese individuals. PLoS ONE 2014, 9, e88539. [Google Scholar] [CrossRef] [PubMed]
- Jung, H.S.; Chang, Y.; Eun Yun, K.; Kim, C.W.; Choi, E.S.; Kwon, M.J.; Cho, J.; Zhang, Y.; Rampal, S.; Zhao, D.; et al. Impact of body mass index, metabolic health and weight change on incident diabetes in a Korean population. Obesity 2014, 22, 1880–1887. [Google Scholar] [CrossRef] [PubMed]
- Karelis, A.D.; Messier, V.; Brochu, M.; Rabasa-Lhoret, R. Metabolically healthy but obese women: Effect of an energy-restricted diet. Diabetologia 2008, 51, 1752–1754. [Google Scholar] [CrossRef] [PubMed]
- Karelis, A.D.; St-Pierre, D.H.; Conus, F.; Rabasa-Lhoret, R.; Poehlman, E.T. Metabolic and body composition factors in subgroups of obesity: What do we know? J. Clin. Endocrinol. Metab. 2004, 89, 2569–2575. [Google Scholar] [CrossRef] [PubMed]
- Badoud, F.; Lam, K.P.; Perreault, M.; Zulyniak, M.A.; Britz-McKibbin, P.; Mutch, D.M. Metabolomics Reveals Metabolically Healthy and Unhealthy Obese Individuals Differ in their Response to a Caloric Challenge. PLoS ONE 2015, 10, e0134613. [Google Scholar] [CrossRef] [PubMed]
- Stelmach-Mardas, M.; Mardas, M.; Walkowiak, J.; Boeing, H. Long-term weight status in regainers after weight loss by lifestyle intervention: Status and challenges. Proc. Nutr. Soc. 2014, 73, 509–518. [Google Scholar] [CrossRef] [PubMed]
- Phillips, C.M.; Dillon, C.; Harrington, J.M.; McCarthy, V.J.C.; Kearney, P.M.; Fitzgerald, A.P.; Perry, I.J. Defining metabolically healthy obesity: Role of dietary and lifestyle factors. PLoS ONE 2013, 8, e76188. [Google Scholar] [CrossRef] [PubMed]
- Camhi, S.M.; Katzmarzyk, P.T. Differences in body composition between metabolically healthy obese and metabolically abnormal obese adults. Int. J. Obes. 2014, 38, 1142–1145. [Google Scholar] [CrossRef] [PubMed]
- Camhi, S.M.; Crouter, S.E.; Hayman, L.L.; Must, A.; Lichtenstein, A.H. Lifestyle Behaviors in Metabolically Healthy and Unhealthy Overweight and Obese Women: A Preliminary Study. PLoS ONE 2015, 10, e0138548. [Google Scholar] [CrossRef] [PubMed]
- Calanna, S.; Piro, S.; di Pino, A.; Zagami, R.M.; Urbano, F.; Purrello, F.; Rabuazzo, A.M. Beta and alpha cell function in metabolically healthy but obese subjects: Relationship with entero-insular axis. Obesity 2014, 21, 320–325. [Google Scholar] [CrossRef] [PubMed]
- Hankinson, A.L.; Daviglus, M.L.; van Horn, L. Diet composition and activity level of at risk and metabolically healthy obese American adults. Obesity 2013, 21, 637–643. [Google Scholar] [CrossRef] [PubMed]
- Kimokoti, R.W.; Judd, S.E.; Shikany, J.M.; Newby, P.K. Food intake does not differ between obese women who are metabolically healthy or abnormal. J. Nutr. 2014, 144, 2018–2026. [Google Scholar] [CrossRef] [PubMed]


| Study | Country | Total Number (Number of MHO) | Age (Years) Mean ± SD | Study Design | Intervention | Time of Intervention | Study Quality (Newcastle-Ottawa Scale) |
|---|---|---|---|---|---|---|---|
| Rondanelli et al., 2015 [17] | Italy | MHO: 103 | MHO: 42.2 ± 9.2 | Clinical study: non-RCT | Low-energy mix, well-balanced (55% carbohydrates, 30% lipids and 15% proteins) diet providing 600 kcal less than individually estimated energy requirements based on the measured Resting Energy Expenditure | 8-week | 7 |
| Ruiz et al., 2013 [18] | Spain | 78 (MHO: 25) | MHO: 34.4 ± 6.8 MUHO: 37.8 ± 6.9 | Clinical study: non-RCT | Low-energy mixed diet (55% carbohydrates, 30% lipids and 15% proteins) providing 600 kcal less than individually estimated energy requirements based on measured resting metabolic rate (RMR) and multiplied by a factor of 1.3, corresponding to a low physical activity level | 12-week | 8 |
| Kantartzis et al., 2011 [19] | Germany | 262 (MHO: 26) | MHO: 46.8 ± 2.2 MUHO: 47.1 ± 1.3 | Clinical study: non-RCT | Lifestyle intervention program with aim to reduce body weight by ≥5%, to reduce the intake of energy from fat to <30% and particularly the intake of saturated fat to ≤10% of energy consumed and to increase the intake of dietary fiber to at least 15 g/4184 kJ (1000 kcal). Moderate sports per week: at least 3 h | 36-week | 7 |
| Janiszewski & Ross, 2010 [20] | Canada | 106 (MHO: 63) | MHO a. women: 61.1 ± 12.0 b. men: 61.4 ± 11.8 MUHO a. women: 46.5 ± 10.7 b. men: 53.1 ± 14.8 | Clinical study: RCT | Men: program (diet or exercise) designed to induce a daily 700-kcal energy deficit Women: program (diet or exercise) designed to induce a daily 500-kcal energy deficit | Men: 12-week Women: 14-week | 7 |
| Shin et al., 2006 [21] | Korea | 129 (MHO: 23) | MHO: 36.4 ± 11.2 MUHO: 39.8 ± 13.3 | Clinical study: non-RCT | Weight loss program consisting of a 300 kcal/day reduction of usual caloric intakes to achieve the goal of losing a minimum of 3% of initial body weight | 12-week | 7 |
| Liu et al., 2012 [22] | Canada | 392 (MHO: 83) | 53.6 ± 12.3 | Clinical study: non-RCT | Calorie restricted meal plan of approximately 500–1000 calories below the patient’s baseline daily caloric requirement to achieve the goal of losing a 5% of initial body weight | >12-week | 8 |
| Sesti et al., 2011 [23] | Italy | 190 | MHO: 38 ± 10 MUHO: 40 ± 10 | Clinical study: non-RCT | Diet applied after Laparoscopic Adjustable Gastric Banding First month: a semiliquid diet of 800 and 950 kcal/day in women and men, respectively (33% proteins, 19% lipids, 48% carbohydrates). Second month: a solid diet was reintroduced. Third month: the suggested diet was 970 and 1090 kcal/day in women and men, respectively (diet included 48% carbohydrates (starch or bread), 33% proteins (fat-free parts of different animals and fish), and 19% lipids (olive oil) | >12-week | 7 |
| Haro et al., 2015 [24] | Spain | MHO: 20 | The LFHCC diet (a low-fat, high-complex carbohydrate diet) 61.4 ± 2.6 The Med diet (Mediterranean diet) 65.2 ± 3.2 | Clinical study: RCT | The LFHCC diet contained 28% fat (12% monounsaturated; 8% polyunsaturated and 8% saturated) The Med diet contained 35% fat (22% monounsaturated; 6% polyunsaturated and 7% saturated) | 52-week | 8 |
| Madero et al., 2011 [25] | Mexico | MHO: 131 | The low-fructose diet 37.56 ± 1.14 The moderate natural fructose diet 40.15 ± 1.01 | Clinical study: RCT | Energy-restricted diets: I. The low-fructose diet: first 2-week period of less than 10 g of fructose per day followed by a 4-week period of less than 20 g of fructose per day. II. The moderate natural fructose diet: consisted of 50 to 70 g of fructose consisting of mostly natural fructose from fruits. | 6-week | 7 |
| Foster et al., 2010 [26] | US | MHO: 307 | A low-carbohydrate diet 46.2 ± 9.2 A low-fat diet 44.9 ± 10.2 | Clinical study: RCT | A low-carbohydrate diet which consisted of limited carbohydrate intake (20 g/day for 3 months) in the form of low-glycemic index vegetables with unrestricted consumption of fat and protein. After 3 months, participants in the low-carbohydrate diet group increased their carbohydrate intake (5 g per week) until a stable and desired weight was achieved A low-fat diet consisted of limited energy intake (1200 to 1800 kcal/day; ≤30% calories from fat) | 104-week | 8 |
| Hermsdorff et al., 2011 [27] | Spain | MHO: 30 | 36.0 ± 8.0 | Clinical study: RCT | The macronutrient-balanced diets (control and legume-based dietary approaches) were designed to provide a similar macronutrients distribution: 53% of energy as carbohydrates, 17% as proteins and 30% as fat | 4-week | 6 |
| Christiansen et al., 2011 [28] | Denmark | MHO: 79 | DIO group: 35.6 ± 7.0 DEX group: 37.5 ± 8.0 | Clinical study: RCT | A liquid, very low energy diet of 600 and 800 kcal/day, respectively (proteins 41 g, carbohydrates 29 g, fat 5.6 g per 100 g), for 8 week followed by a weight maintenance diet for 4 week. In Diet-induced weight loss using a very low energy diet (DIO) and exercise and diet-induced weight-loss combined (DEX) groups the subjects should obtain similar weight losses to observe the possible specific, weight-independent effect of exercise. Thus, the subjects in the DEX group were allowed to consume 150–200 kcal more per day than the DIO group, reflecting the estimated extra energy expenditure of 1500 kcal/week during exercise activity. The supervised aerobic exercise three times per week with duration of 60–75 min per training session, with an estimated energy expenditure of 500–600 kcal per session | 8-week | 7 |
| Study | Intervention | Groups | BMI (kg/m2) Mean ± SD | Systolic/Diastolic Blood Pressure (mmHg) Mean ± SD | TG (mmol/L) Mean ± SD | HDL-C (mmol/L) Mean ± SD | Fasting Glucose (mmol/L) Mean ± SD | HOMA-IR Mean ± SD | hsCRP (mg/L) Mean ± SD | |||||||
|---|---|---|---|---|---|---|---|---|---|---|---|---|---|---|---|---|
| B ′ | I ″ | B ′ | I ″ | B ′ | I ″ | B ′ | I ″ | B ′ | I ″ | B ′ | I ″ | B ′ | I ″ | |||
| Rondanelli et al., 2015 [17] | Diet ONLY | MHO | 0.89 (0.66 to 1.12) | - | 0.03 (−0.21 to 0.27) * | −0.06 (−0.10 to 0.02) * | −0.06 (−0.17 to 0.05) * | −0.18 (−0.33 to 0.52) * | −4.00 (−6.00 to −1.00) * | |||||||
| Ruiz et al., 2013 [18] | Diet ONLY | MHO: | +2.88 ± 1.3 * | - | –0.03 ± 0.9 * | +0.14 ± 0.3 * | +1.2 ± 5.6 * | +0.56 ± 0.7 * | +1.51 ± 0.15 * | |||||||
| MUHO: | +3.08 ± 1.1 * | +0.31 ± 0.79 * | +0.20 ± 0.28 * | +2.1 ± 6.4 * | +0.59 ± 0.66 * | +0.38 ± 1.88 | ||||||||||
| Kantartzis et al., 2011 [19] | Diet AND exercise | MHO: | >30 | - | 1.71 ± 0.41 | 1.62 ± 0.44 | 1.37 ± 0.08 | 1.30 ± 0.05 | 5.07 ± 0.08 | 5.17 ± 0.10 | 1.16 ± 0.06 | 1.23 ± 0.08 | - | |||
| MUHO: | 1.56 ± 0.12 | 1.49 ± 0.08 | 1.27 ± 0.03 | 1.22 ± 0.03 | 5.42 ± 0.06 | 5.26 ± 0.06 | 2.98 ± 0.13 | 2.44 ± 0.14 | ||||||||
| Janiszewski & Ross, 2010 [20] | Diet OR exercise | MHO: | - | - | ||||||||||||
| Men | −1.3 ± 1.0 * | −3.0 ± 11.0 */−2.1 ± 6.4 * | −0.2 ± 0.4 * | +0.1 ± 0.1 * | −0.1 ± 0.4 * | |||||||||||
| Women | −1.1 ± 0.8 * | −0.1 ± 11.3 */−1.5 ± 7.1 * | 0.0 ± 0.3 * | 0.0 ± 0.2 * | 0.0 ± 0.4 | |||||||||||
| MUHO: | ||||||||||||||||
| Men | −1.9 ± 0.9 * | −2.1 ± 11.9 */−2.9 ± 10.4 * | −0.5 ± 0.7 * | +0.1 ± 0.1 * | −0.6 ± 0.7 * | |||||||||||
| Women | −1.8 ± 1.0 * | −1.9 ± 18.0 */0.3 ± 9.9 * | −0.3 ± 0.5 * | −0.0 ± 0.1 * | −0.3 ± 0.8 * | |||||||||||
| Shin et al., 2006 [21] | Diet ONLY | MHO: | −2.83 ± 2 .74 ** | - | 1.09 ± 0.37 | 1.25 ± 0.54 | 1.33 ± 0.24 | 1.32 ± 0.25 | - | 1.80 ± 1.27 | 1.68 ± 0.76 | 0.74 ± 0.41 | 0.82 ± 0.45 | |||
| MUHO: | −3.16 ± 4.08 ** | 1.72 ± 0.73 | 1.54 ± 0.78 | 1.09 ± 0.26 | 1.16 ± 0.26 | 2.60 ± 1.61 | 2.40 ± 2.3 | 1.9 ± 1.98 | 1.50 ± 1.3 | |||||||
| Liu et al., 2012 [22] | Diet AND Supporting education | MHO: | ||||||||||||||
| <5% BW loss | −0.2 ± 3.4 | −8.0 ± 1.0 | −0.03 ± 0.07 | 0.08 ± 0.03 | 0.1 ± 0.15 | |||||||||||
| >5% BW loss | −10.1 ± 4.6 | −4.0 ± 1.0 | −0.14 ± 0.07 | −0.015 ± 0.03 | 0.0 ±0.15 | |||||||||||
| MUHO: | ||||||||||||||||
| <5% BW loss | −1.1 ± 3.1 | −4.0 ± 1.0 | −0.19 ± 0.05 | 0.05 ± 0.01 | −0.16 ± 0.09 | |||||||||||
| >5% BW loss | −11.4 ± 5.6 | −2.0 ± 1.0 | −0.02 ± 0.05 | 0.02 ± 0.01 | −0.07 ± 0.09 | |||||||||||
| Sesti et al., 2011 [23] | Diet Applied after LAGB ′′′ | MHO: | 41.1 ± 5.5 | 35.0 ± 5.3 | - | 1.34 ± 0.60 | 1.13 ± 0.52 | 1.24 ± 0.31 | 1.34 ± 0.31 | 5.2 ± 0.7 | 4.9 ± 0.7 | - | - | |||
| MUHO: | 44.0 ± 6.4 | 38.2 ± 5.6 | 1.58 ± 0.78 | 1.30 ± 0.55 | 1.27 ± 0.31 | 1.32 ± 0.34 | 5.7 ± 0.8 | 5.3 ± 0.7 | ||||||||
| Haro et al., 2015 [24] | Diet ONLY | MHO: | - | - | - | - | ||||||||||
| LFHCC diet # | 31.6 ± 0.8 | 129 ± 9.4 | 1.16 ± 0.09 | 1.11 ± 0.09 | 1.04 ± 0.06 | 1.03 ± 0.05 | 5.2 ± 0.2 | 5.1 ± 0.2 | ||||||||
| Med diet § | 32.8 ± 0.5 | 136 ± 3.7 | 1.18 ± 0.13 | 0.97 ± 0.13 | 1.09 ± 0.06 | 1.16 ± 0.05 | 5.1 ± 0.2 | 5.4 ± 0.2 | ||||||||
| Madero et al., 2011 [25] | Diet ONLY | MHO: | - | |||||||||||||
| A low-fructose diet | −1.18 ± 0.82 | −9.46 ± 7.77/−5.17 ± 4.69 | −0.26 ± 0.78 | 0.0 ± 0.49 | −0.30 ± 1.70 | −0.29 ± 0.93 | ||||||||||
| A moderate natural fructose diet | −1.57 ± 1.08 | −7.85 ± 8.73/−6.04 ± 5.40 | −0.35 ± 0.62 | 0.0 ± 0.31 | −0.4 ± 0.5 | −0.37 ± 0.57 | ||||||||||
| Foster et al., 2010 [26] | Diet AND Supporting education | MHO: | - | - | - | - | ||||||||||
| A low-carbohydrate diet | −2.68 (−5.08 to −0.27)/−3.19 (−4.66 to −1.73) | −0.13 (−0.25 to −0.01) | 0.20 (0.15 to 0.25) | |||||||||||||
| A low-fat diet | −2.59 (−5.07 to −0.12)/−0.50 (−2.13 to 1.13) | −0.16 (−0.28 to −0.03) | 0.10 (0.08 to 0.16) | |||||||||||||
| Hermsdorff et al., 2011 [27] | Diet ONLY | MHO: | ||||||||||||||
| Calorie-restricted legume-free diet | 31.3 ± 4.0 | 29.4 ± 4.1 | 115 ± 9/76 ± 9 | 111 ± 12/72 ± 10 | 1.17 ± 0.32 | 1.17 ± 0.57 | 1.50 ± 0.26 | 1.27 ± 0.31 | 5.1 ± 0.5 | 5.0 ± 0.4 | 2.1 ± 1.7 | 1.6 ± 1.0 | 2.0 ± 1.0 | 1.9 ± 0.8 | ||
| Calorie-restricted legume-based diet | 33.7 ± 4.7 | 31.7 ± 3.9 | 115 ± 13/76 ± 6 | 106 ± 10/70 ± 6 | 1.11 ± 0.43 | 1.09 ± 0.42 | 1.27 ± 0.26 | 1.14 ± 0.18 | 5.2 ± 0.3 | 5.1 ± 0.3 | 1.8 ± 0.9 | 1.6 ± 0.9 | 2.7 ± 2.4 | 1.6 ± 0.9 | ||
| Christiansen et al., 2011 [28] | Diet OR Exercise OR Diet with Exercise | Exercise only (EXO) | 33.3 ± 4 | 32.2 ± 4 | 126 ± 15/76 ± 12 | 118 ± 8/68 ±9 | 1.6 ± 0.7 | 1.5 ± 0.4 | 1.3 ± 0.4 | 1.3 ± 0.5 | 5.6 ± 0.4 | 5.6 ± 5 | 2.3 ± 1.0 | 1.8 ± 1.0 | - | |
| Diet-induced weight loss using a very low energy diet (DIO) | 35.3 ± 4 | 31.2 ± 4 | 129 ± 10/78 ± 12 | 122 ± 12/82 ± 12 | 1.5 ± 0.5 | 1.1 ± 0.3 | 1.2 ± 0.3 | 1.2 ± 0.3 | 5.5 ± 0.6 | 5.1 ± 0.5 | 3.1 ± 2.0 | 2.1 ± 1.0 | ||||
| Exercise and diet-induced weight-loss combined (DEX) | 34.2 ± 3 | 30.3 ± 3 | 140 ± 17/82 ± 12 | 129 ± 18/72 ± 13 | 1.8 ± 0.6 | 1.2 ± 0.5 | 1.2 ± 0.3 | 1.3 ± 0.3 | 5.6 ± 0.4 | 5.4 ± 0.5 | 3.2 ± 2.0 | 2.0 ± 1.0 | ||||
© 2016 by the authors; licensee MDPI, Basel, Switzerland. This article is an open access article distributed under the terms and conditions of the Creative Commons Attribution (CC-BY) license (http://creativecommons.org/licenses/by/4.0/).
Share and Cite
Stelmach-Mardas, M.; Walkowiak, J. Dietary Interventions and Changes in Cardio-Metabolic Parameters in Metabolically Healthy Obese Subjects: A Systematic Review with Meta-Analysis. Nutrients 2016, 8, 455. https://doi.org/10.3390/nu8080455
Stelmach-Mardas M, Walkowiak J. Dietary Interventions and Changes in Cardio-Metabolic Parameters in Metabolically Healthy Obese Subjects: A Systematic Review with Meta-Analysis. Nutrients. 2016; 8(8):455. https://doi.org/10.3390/nu8080455
Chicago/Turabian StyleStelmach-Mardas, Marta, and Jarosław Walkowiak. 2016. "Dietary Interventions and Changes in Cardio-Metabolic Parameters in Metabolically Healthy Obese Subjects: A Systematic Review with Meta-Analysis" Nutrients 8, no. 8: 455. https://doi.org/10.3390/nu8080455