Temporal Changes of Human Breast Milk Lipids of Chinese Mothers

 and
and
Abstract
:1. Introduction
2. Materials and Methods
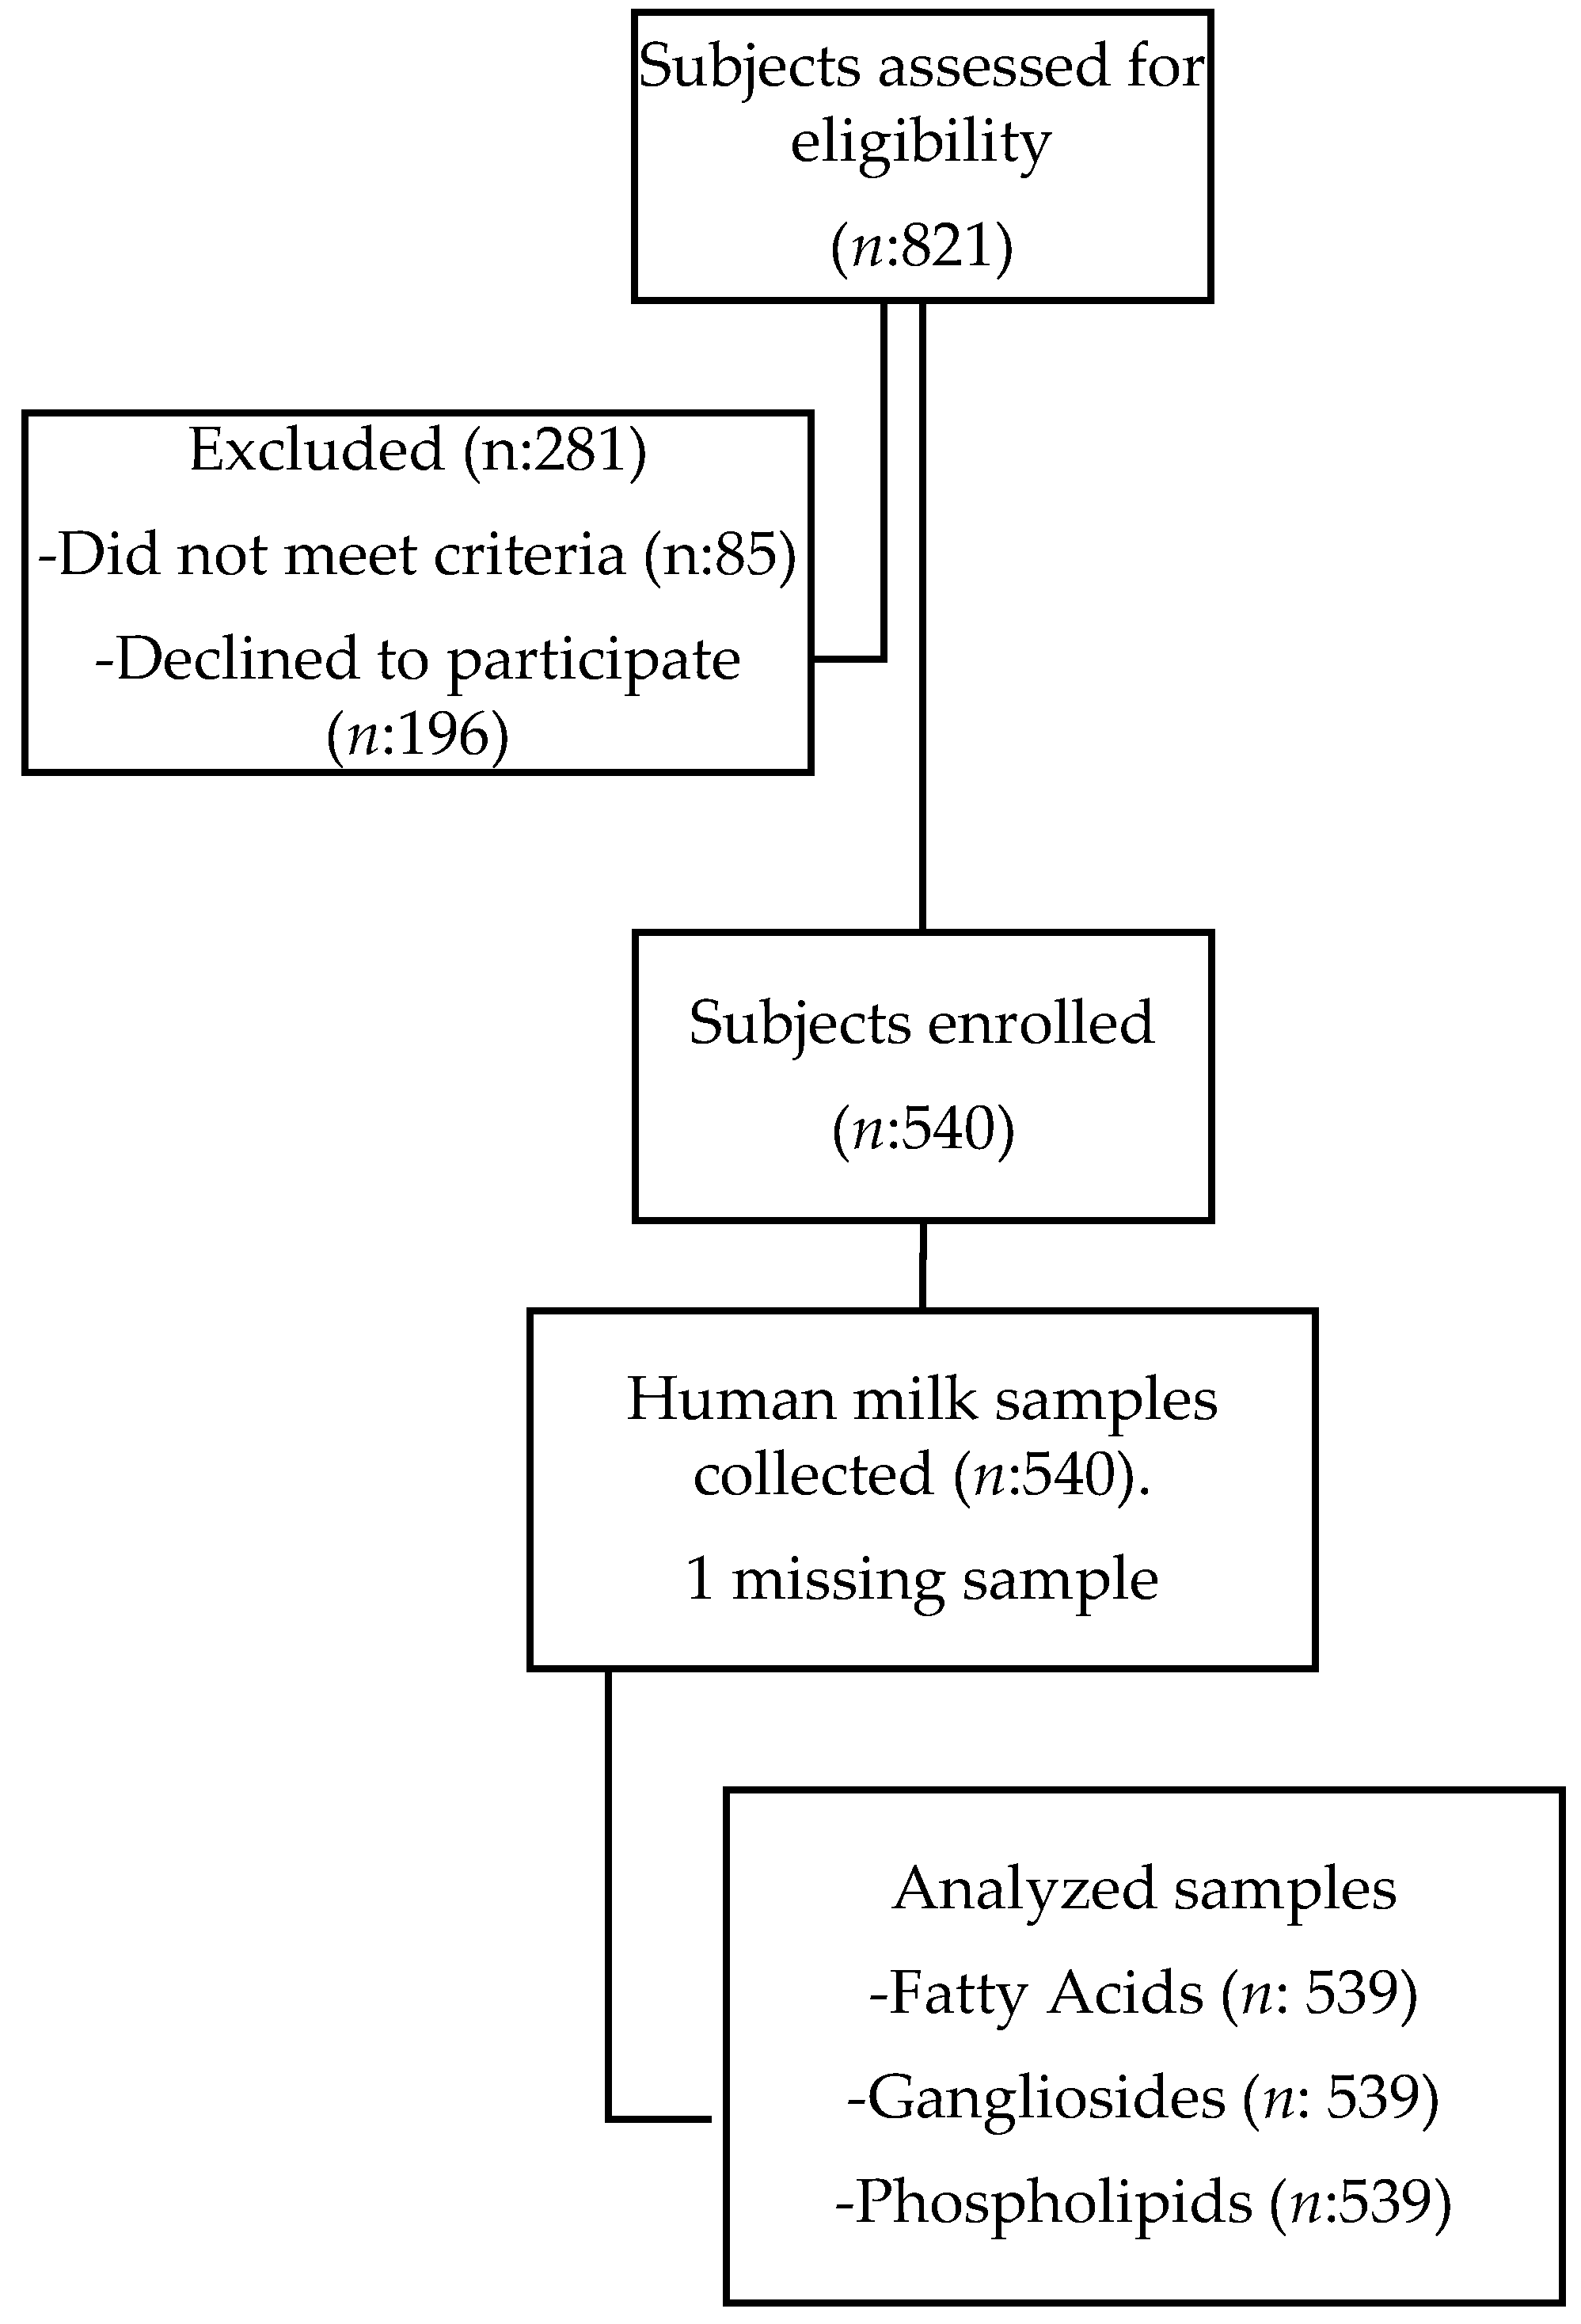
2.1. Subjects
2.2. Inclusion and Exclusion Criteria
2.3. Ethical and Legal Considerations
2.4. Data Collection
2.5. HM Sampling
2.6. Analytical Methods
2.6.1. FA Quantification
2.6.2. Phospholipid Quantification
2.6.3. Gangliosides Quantification
3. Results
3.1. Demographics and Anthropometrics of Study Subjects
3.2. FA
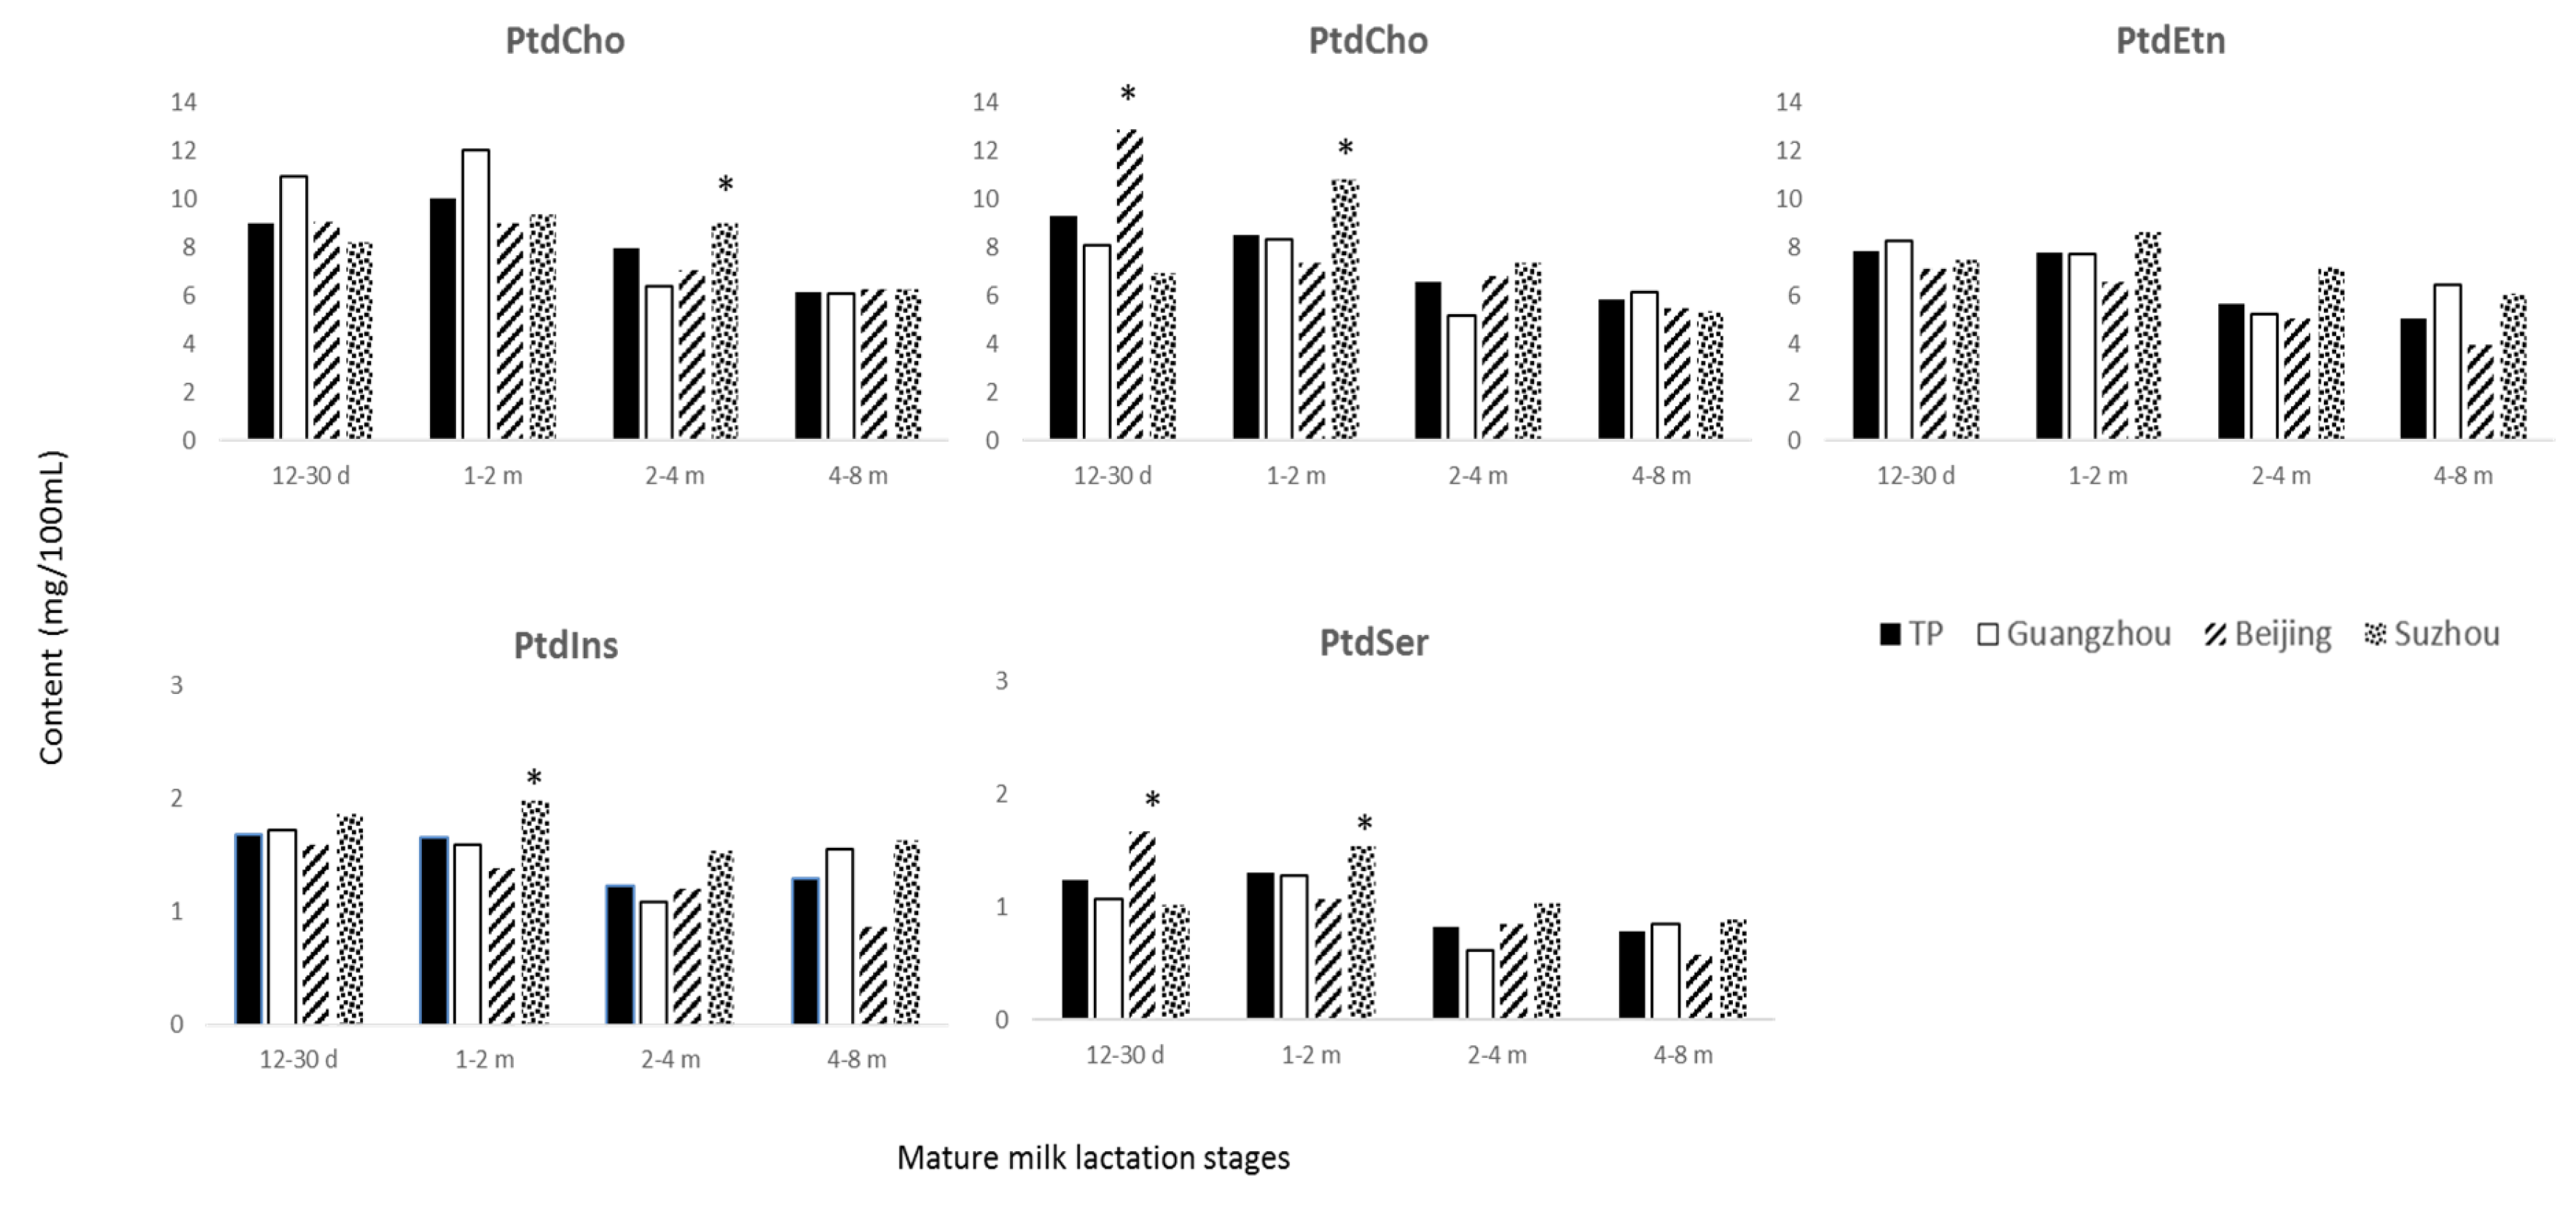
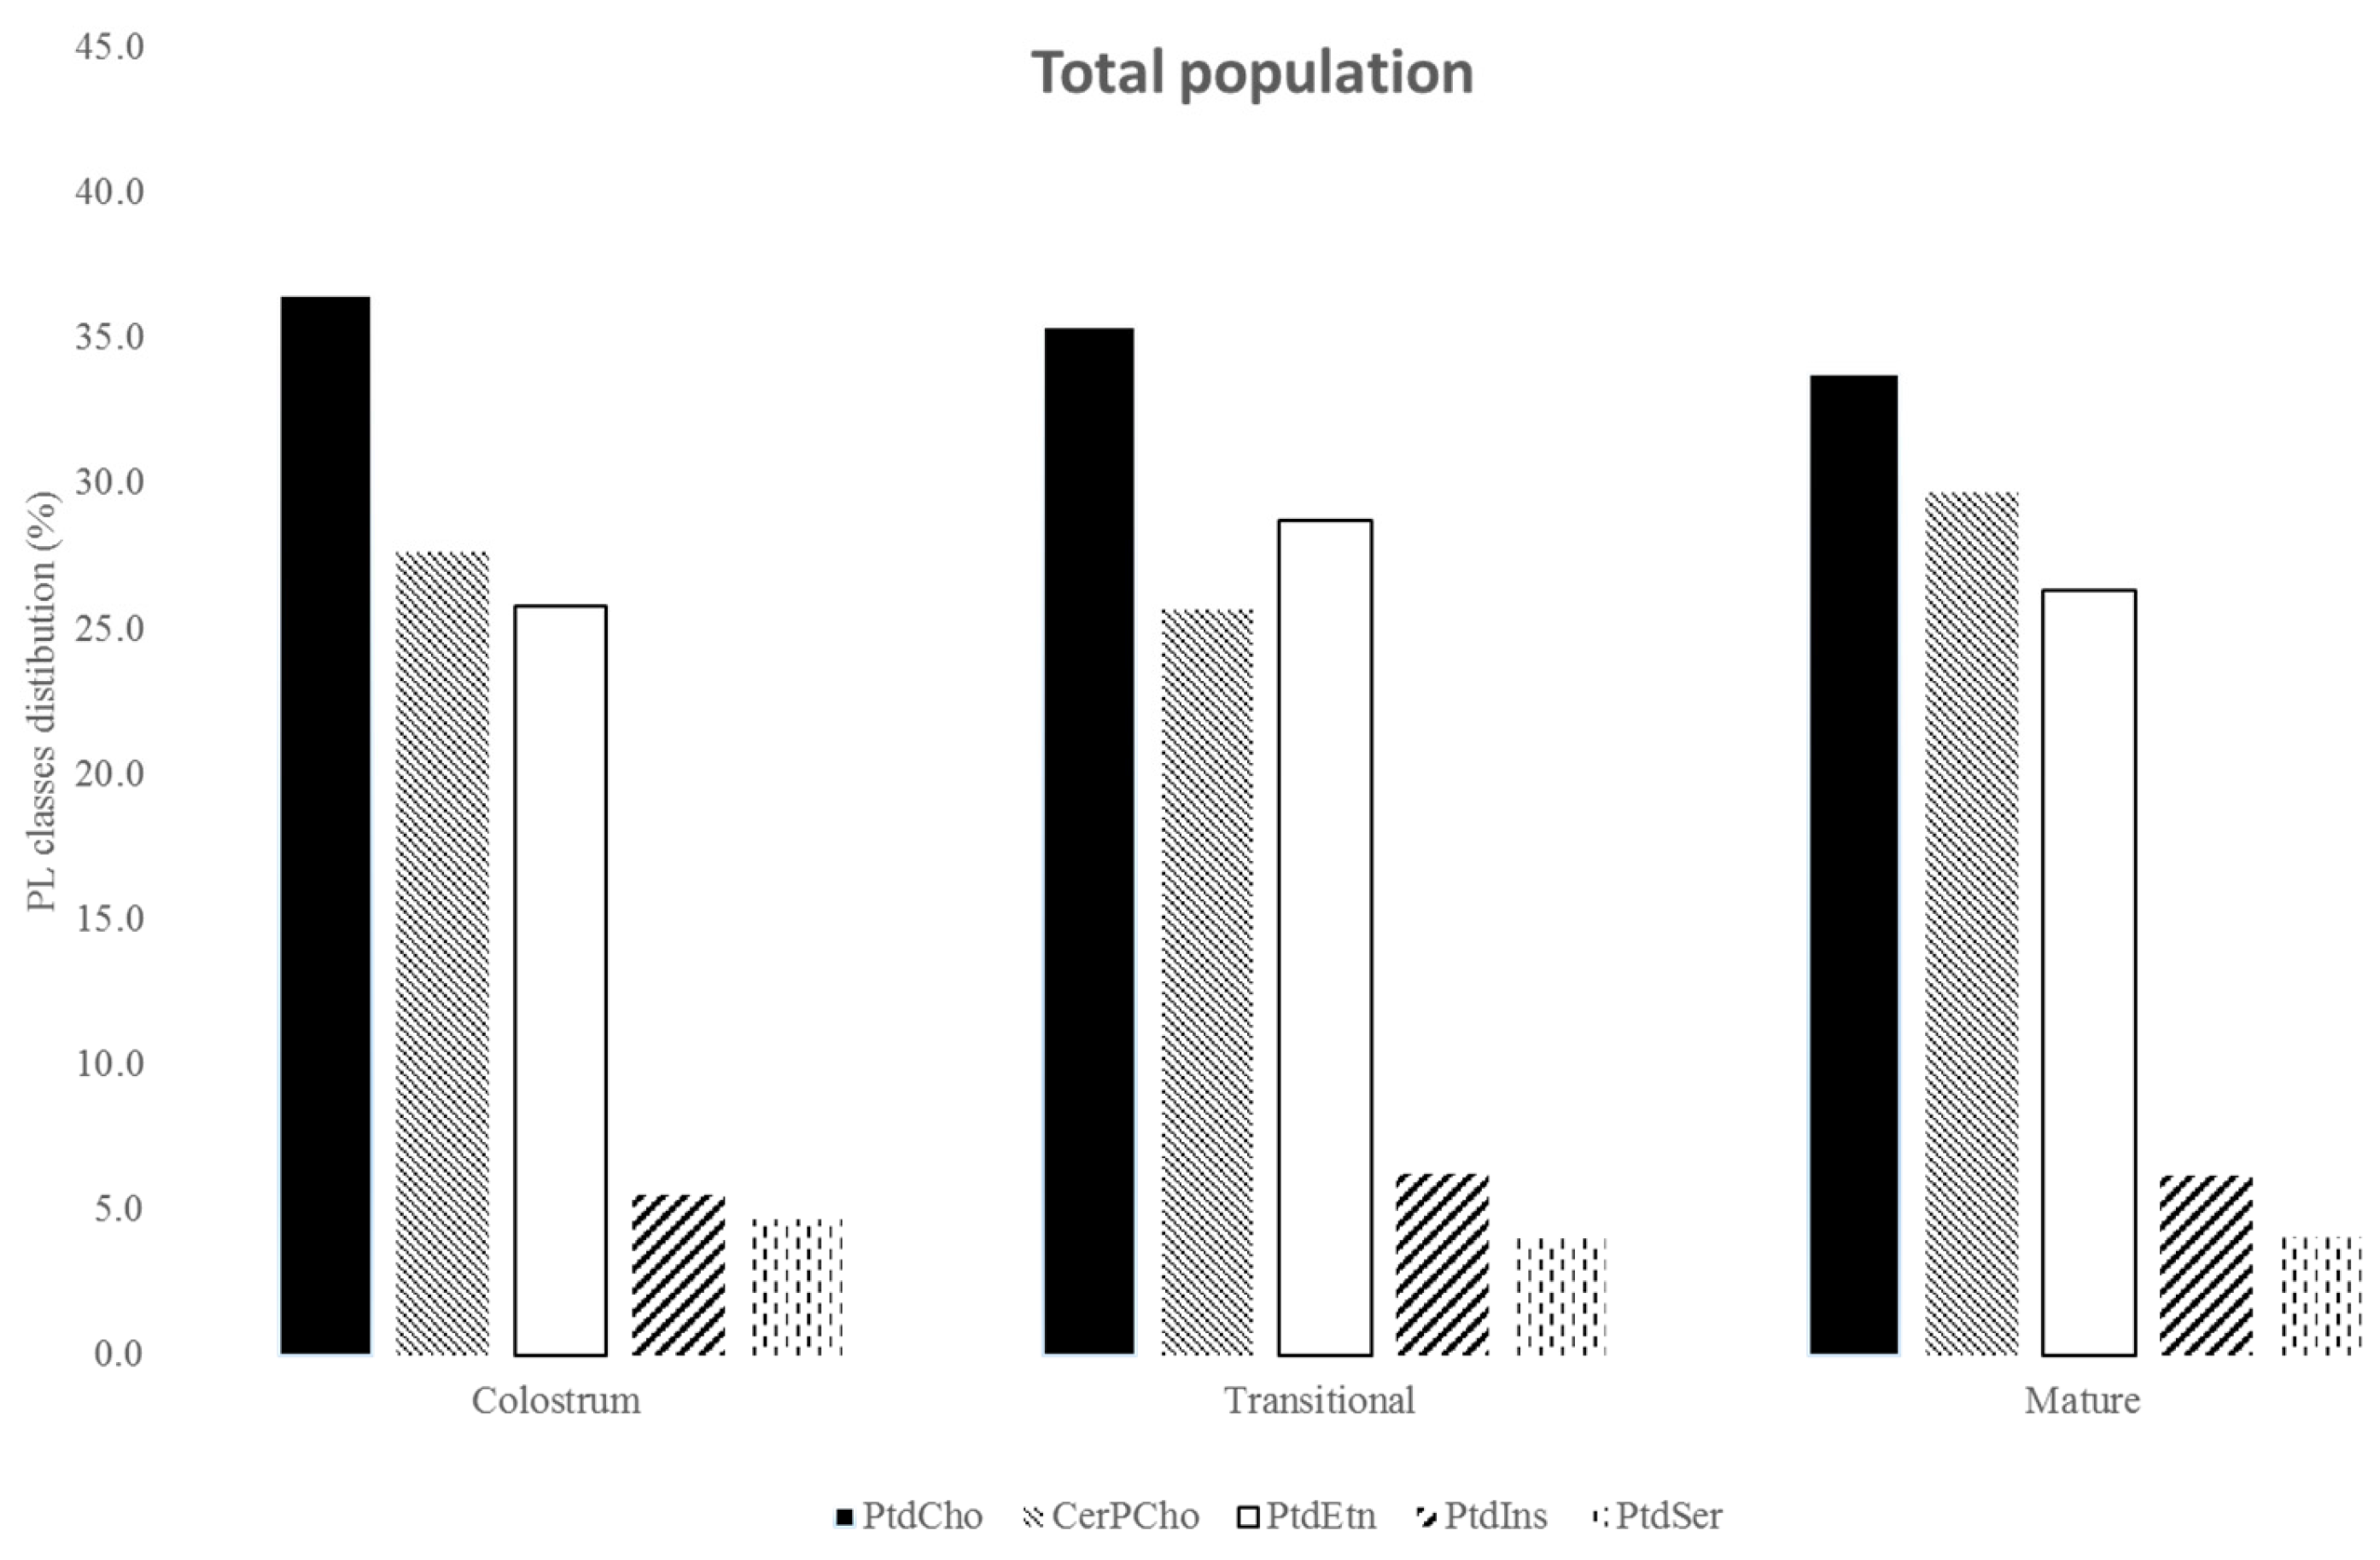
3.3. Phospholipids
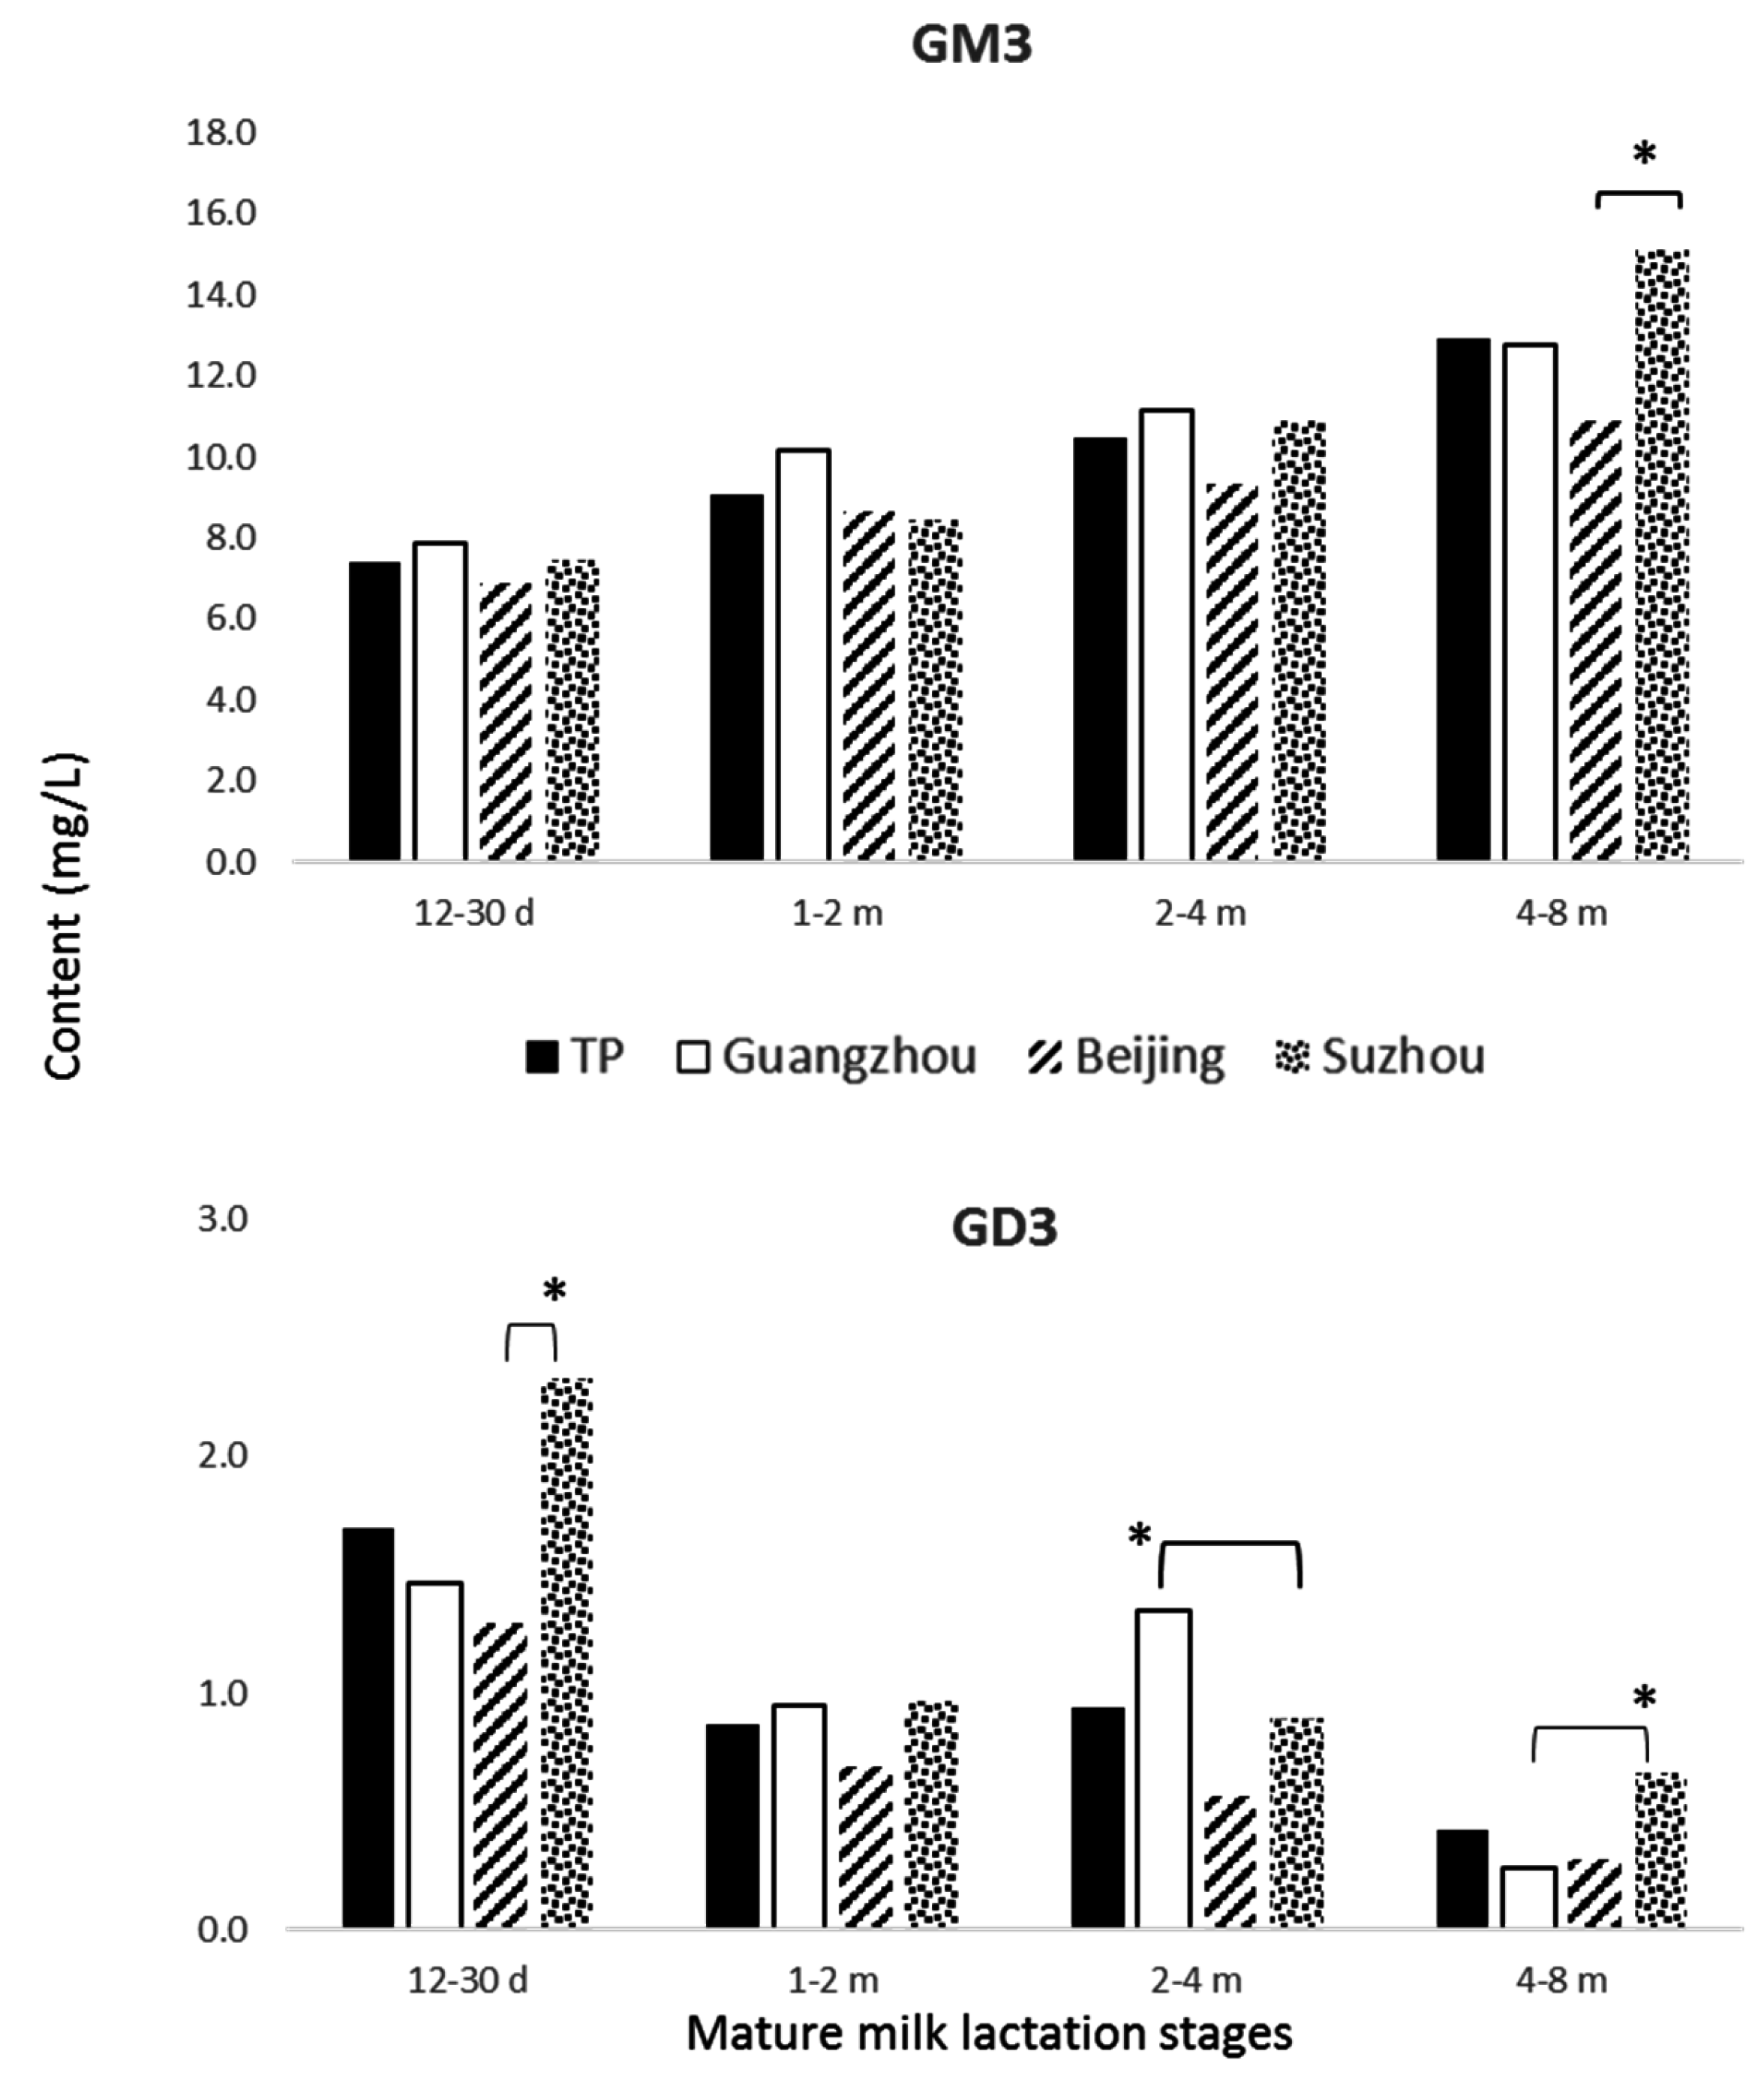
3.4. Gangliosides
4. Discussion
4.1. FA
4.2. Phospholipids
4.3. Gangliosides
5. Conclusions
Acknowledgments
Author Contributions
Conflicts of Interest
Abbreviations
References
- Kramer, M.; Ritsuko, S.K. The Optimal Duration of Exclusive Breastfeeding: A Systematic Review; World Health Organization: Geneva, Switzerland, 2002. [Google Scholar]
- Giovannini, M.; Riva, E.; Agostoni, C. FA in pediatric nutrition (Review). Pediatr. Clin. North. Am. 1995, 42, 861. [Google Scholar] [CrossRef]
- Bitman, J.; Wood, L.; Metha, N.R.; Hamosh, P.; Hamosh, M. Comparison of phospholipid composition of breast milk from mothers of term and preterm infants during lactation. Am. J. Clin. Nutr. 1984, 40, 1103–1119. [Google Scholar] [PubMed]
- Jensen, R.G. Lipids in HM. Lipids 1999, 12, 1243–1271. [Google Scholar] [CrossRef]
- Innis, S.M. Essential FA in growth and development. Prog. Lipid Res. 1991, 30, 39–103. [Google Scholar] [CrossRef]
- Pruett, S.T.; Bushnev, A.; Hagedorn, K.; Adiga, M.; Haynes, C.A.; Sullards, M.C.; Liotta, D.C.; Merrill, A.H., Jr. Biodiversity of sphingoid bases (“sphingosines”) and related amino alcohols. J. Lipid Res. 2008, 49, 1621–1639. [Google Scholar] [CrossRef] [PubMed]
- Zeisel, S.H.; Blusztajn, J.K. Choline and human nutrition. Ann. Rev. Nutr. 1994, 14, 269–296. [Google Scholar] [CrossRef] [PubMed]
- Zeisel, S.H. The fetal origins of memory: The role of dietary choline in optimal brain development. J. Pediatr. 2006, 149, 131s–136s. [Google Scholar] [CrossRef] [PubMed]
- Schauer, R. Achievements and challenges of sialic acid research. Glycoconj. J. 2000, 17, 485–499. [Google Scholar] [CrossRef] [PubMed]
- Gurnida, D.A.; Rowan, A.M.; Idjradinata, P.; Muchtadi, D.; Sekarwana, N. Association of complex lipids containing gangliosides with cognitive development of 6-month-old infants. Early Hum. Dev. 2012, 88, 595–601. [Google Scholar] [CrossRef] [PubMed]
- Harzer, G.; Haug, M.; Bindels, J.G. Biochemistry of human milk in early lactation. Z. Ernahrungswissenschaft 1986, 25, 77–90. [Google Scholar] [CrossRef]
- Sala Vila, A.; Castellote, A.I.; Rodriguez-Palmero-Seuma, M.; Campoy, C.; Lopez-Sabater, M.C. Lipid composition in human breast milk from Granada (Spain): Changes during lactation. Nutrition 2005, 21, 467–473. [Google Scholar] [CrossRef] [PubMed]
- Cilla, A.; Diego-Quintaes, K.; Barbera, R.; Alegria, A. Phospholipids in HM and infant formula: Benefits and needs for correct infant nutrition. Crit. Rev. Food Sc. Nutr. 2016, 56, 1880–1892. [Google Scholar] [CrossRef] [PubMed]
- Takamizawa, K.; Iwamori, K.; Mutai, M.; Nagai, Y. Selective changes in gangliosides of HM during lactation: A molecular indicator for the period of lactation. Biochim. Biophys. Acta 1986, 879, 73–77. [Google Scholar] [PubMed]
- Rueda, R.; Puente, R.; Hueso, P.; Maldonado, J.; Gil, A. New data on content and distribution of gangliosides in HM. Biol. Chem. Hoppe-Seyler 1995, 376, 723–727. [Google Scholar] [CrossRef] [PubMed]
- Rueda, R.; Maldonado, J.; Gil, A. Comparison of content and distribution of HM gangliosides from Spanish and Panamanian mothers. Ann. Nutr. Metab. 1996, 40, 194–201. [Google Scholar] [CrossRef] [PubMed]
- Pan, X.L.; Izumi, T. Variation of the ganglioside compositions of HM, cow’s milk and infant formulas. Early Hum. Dev. 2000, 57, 25–31. [Google Scholar] [CrossRef]
- Martin-Sosa, S.; Martin, M.-J.; Garcia-Pardo, L.A.; Hueso, P. Distribution of sialic acids in the milk of Spanish mothers of full term infants during lactation. J. Pediatr. Gastr. Nutr. 2004, 39, 111–116. [Google Scholar]
- Uchiyama, S.-I.; Sekiguchi, K.; Akaishi, M.; Anan, A.; Maeda, T.; Izumi, T. Characterization and chronological changes of preterm HM gangliosides. Nutrition 2011, 27, 998–1001. [Google Scholar] [CrossRef] [PubMed]
- Read, W.W.C.; Lutz, P.G.; Tashjian, A. HM lipids. II the influence of dietary carbohydrates and fat on the FA of mature milk. A study in four ethnic groups. Am. J. Clin. Nutr. 1965, 17, 180–183. [Google Scholar] [PubMed]
- Van Beusekom, C.M.; Martini, I.A.; Rutgers, H.M.; Boersma, E.R.; Muskiet, F.A. A carbohydrate-rich diets not only leads to incorporation of medium-chain FA (6:0–14:0) in triglycerides but also in each milk-phospholipid subclass. Am. J. Clin. Nut. 1990, 52, 326–334. [Google Scholar]
- Francois, C.A.; Connor, S.L.; Wander, R.C.; Connor, W.E. Acute effects of dietary FA on the FA of HM. Am. J. Clin. Nutr. 1998, 67, 301–308. [Google Scholar] [PubMed]
- Samur, G.; Topcu, A.; Turan, S. Trans FA and fatty acid composition of mature breast milk in Turkish women and their association with maternal diets. Lipids 2009, 44, 405. [Google Scholar] [CrossRef] [PubMed]
- Lauritzen, L.; Jørgensen, M.H.; Hansen, H.S.; Michaelsen, K.F. Fluctuations in HM long-chain PUFA levels in relation to dietary fish intake. Lipids 2002, 37, 237. [Google Scholar] [CrossRef] [PubMed]
- Ryan, J.M.; Rice, E.G.; Mitchell, M.D. The role of gangliosides in brain development and the potential benefits of perinatal supplementation. Nutr. Res. 2013, 33, 877–887. [Google Scholar] [CrossRef] [PubMed]
- Yang, T.; Zhang, Y.; Ning, Y.; You, L.; Ma, D.; Zheng, Y.; Yang, X.; Li, W.; Wang, J.; Wang, P. Breast milk macronutrient composition and the associated factors in urban Chinese mothers. Chin. Med. J. Assoc. 2014, 9, 127. [Google Scholar]
- Cruz-Hernandez, C.; Goeuriot, S.; Giuffrida, F.; Thakkar, S.K.; Destaillats, F. Direct quantification of FA in HM by gas chromatography. J. Chrom. A 2013, 9, 174. [Google Scholar] [CrossRef] [PubMed]
- Giuffrida, F.; Cruz-Hernandez, C.; Fluck, B.; Tavazzi, I.; Thakkar, K.S.; Destaillats, F.; Braun, M. Quantification of Phospholipids Classes in HM. Lipids 2013, 48, 1051–1058. [Google Scholar] [CrossRef] [PubMed]
- Giuffrida, F.; Masserey-Elmelegy, I.; Thakkar, S.K.; Marmet, C.; Destaillats, F. Longitudinal Evolution of the Concentration of Gangliosides GM3 and GD3 in HM. Lipids 2014, 49, 997–1004. [Google Scholar] [CrossRef] [PubMed]
- Wu, T.-C.; Lau, B.-H.; Chen, P.-H.; Wu, L.-T.; Tang, R.-B. Fatty acid composition of Taiwanese HM. J. Chin. Med. Assoc. 2012, 73, 581–588. [Google Scholar] [CrossRef]
- Chen, Z.Y.; Kwan, K.Y.; Tong, K.K.; Ratnayake, W.M.N.; Li, H.Q.; Leung, S.S.F. Breast milk fatty acid composition: A comparative study between Hong Kong and Chongquing Chinese. Lipids 1997, 32, 1061–1067. [Google Scholar] [CrossRef] [PubMed]
- Li, J.; Fan, Y.; Zhang, Z.; Yu, H.; An, Y.; Kramer, J.K.G.; Deng, Z. Evaluating the trans fatty acid, CLA, PUFA and erucic acid diversity in HM from five region in China. Lipids 2009, 44, 257–271. [Google Scholar] [CrossRef] [PubMed]
- Ruan, C.-L.; Liu, X.-F.; Man, H.-S.; Ma, X.-L.; Lu, G.-Z.; Duan, G.-H.; DeFrancesco, C.A.; Connor, W.E. Milk composition in women from five different regions of China: The great diversity of milk FA. Hum. Clin. Nutr. 1995, 2993–2998. [Google Scholar]
- Yuhas, R.; Pramuk, K.; Lien, E.L. HM fatty acid composition from nine countries varies most in DHA. Lipids 2006, 41, 851–858. [Google Scholar] [CrossRef] [PubMed]
- Xiang, M.; Alfvén, G.; Blennow, M.; Trygg, M.; Zetterstrom, R. Long-Chain polyunsaturated FA in HM and brain growth during early infancy. Acta Pediatr. 2000, 89, 142–147. [Google Scholar] [CrossRef]
- Genzel-Boroviczény, O.; Wahle, J.; Koletzko, B. Fatty acid composition of HM during the 1st month after term and preterm delivery. Eur. J. Pediatr. 1997, 156, 142–147. [Google Scholar] [CrossRef] [PubMed]
- Idota, T.; Sakurai, M.; Sugawara, Y.; Ishiyama, Y.; Murakami, Y.; Moriguchi, H.; Takeuchi, M.; Shimoda, K.; Asai, Y. The latest survey for the composition of milk obtained from Japanese mothers. Part II. Changes of fatty acid composition, phospholipids and cholesterol contents during lactation. Jpn. J. Pediatr. Gastroenterol. Nutr. 1991, 5, 159–173. [Google Scholar]
- Chardigny, J.-M.; Wolff, R.L.; Sébédio, J.-L.; Martine, L.; Juaneda, P. Trans mono- and polyunsaturated FA in HM. Eur. J. Clin. Nutr. 1995, 49, 523–531. [Google Scholar] [PubMed]
- Tanaka, K.; Hosozawa, M.; Kudo, N.; Yoshikawa, N.; Hisata, K.; Shoji, H.; Shinohara, K.; Shimizu, T. The pilot study: Sphingomyelin-Fortified milk has a positive association with the neurobehavioural development of very low birth weight infants during infancy, randomized control trial. Brain Dev. 2013, 35, 45–52. [Google Scholar] [CrossRef] [PubMed]
- Küllenberg, D.; Taylor, L.A.; Schneider, M.; Massing, U. Health effects of dietary phospholipids. Lipids Health Dis. 2012, 11, 1–16. [Google Scholar] [CrossRef] [PubMed]
- German, J.B. Dietary lipids from an evolutionary perspective: Sources, structures and functions. Mater. Child. Nutr. 2011, 7, 2–16. [Google Scholar] [CrossRef] [PubMed]
- Nixon, G.F. Sphingolipids in inflammation: Pathological implications and potential therapeutic targets. Br. J. Pharmacol. 2009, 158, 982–993. [Google Scholar] [CrossRef] [PubMed]
- McDaniel, M.A.; Maier, S.F.; Einstein, G.O. “Brain-specific” nutrients: A memory cure? Nutrition 2003, 19, 957–975. [Google Scholar] [CrossRef]
- Bitman, J.; Freed, L.M.; Neville, M.C.; Wood, D.L.; Hamosh, P.; Hamosh, M. Lipid composition of prepartum human mammary secretion and postpartum milk. J. Ped. Gastr. Nutr. 1986, 5, 608–615. [Google Scholar] [CrossRef]
- Harzer, G.; Haug, M.; Dieterich, I.; Gentner, P.G. Changing patterns of HM lipids in the course of the lactation and during the day. Am. J. Clin. Nutr. 1983, 37, 612–621. [Google Scholar] [PubMed]
- Morrison, W.R.; Smith, L.M. Fatty Acid Composition of Milk Phospholipids. II. Sheep, Indian Buffalo and HMs. Lipids 1967, 2, 178–182. [Google Scholar] [CrossRef] [PubMed]
- Rombaut, R.; Dewettinck, K. Properties, analysis and purification of milk polar lipids. Int. Dairy J. 2006, 16, 1362–1373. [Google Scholar] [CrossRef]
- Thakkar, S.K.; Giuffrida, F.; Cruz-Hernandez, C.; De Castro, A.C.; Mukherjee, R.; Tran, L.-A.; Steenhout, P.; Lee, L.Y.; Destaillats, F. Dynamic composition of HM nutrient composition of women from Singapore with special focus on lipids. Am. J. Nutr. Biol. 2013, 25, 770–779. [Google Scholar]
- Garcia, C.; Millet, V.; Coste, T.C.; Mimoun, M.; Ridet, A.; Antona, C.; Simeoni, U.; Armand, M. French Mothers’ Milk Deficient in DHA Contains Phospholipid Species of Potential Interest for Infant Development. J. Pediatr. Gastroenterol. Nutr. 2011, 53, 206–212. [Google Scholar] [CrossRef] [PubMed]
- Lopez, C.; Briard-Bion, V.; Menard, O.; Rousseau, F.; Pradel, P.; Besle, J.-M. Phospholipid, sphingolipid, and fatty acid compositions of the milk fat globule membrane are modified by diet. J. Agric. Food Chem. 2008, 56, 5226–5236. [Google Scholar] [CrossRef] [PubMed]
- Zou, X.-Q.; Guo, Z.; Huang, J.-H.; Jin, Q.-Z.; Cheong, L.-Z.; Wang, X.-G.; Xu, X.-B. HM fat globules from different stages of lactation: A lipid composition analysis and microstructure characterization. J. Agric. Food Chem. 2012, 60, 7158–7167. [Google Scholar] [CrossRef] [PubMed]
- Zeisel, S.H.; Char, D.; Sheard, N.F. Choline, phosphatidylcholine and sphingomyelin in human and bovine milk and infant formulas. J. Nutr. 1986, 116, 50–58. [Google Scholar] [PubMed]
- Kynast, G.; Schmitz, C. Determination of the phospholipid content of HM, cow’s milk and various infant formulas. Z. Ernährungswiss 1988, 27, 252–265. [Google Scholar] [CrossRef] [PubMed]
- Holmes-McNary, M.Q.; Cheng, W.-L.; Mar, M.-H.; Fussell, S.; Zeisel, S.H. Choline and choline esters in human and rat milk and in infant formulas. Am. J. Clin. Nutr. 1996, 64, 572–576. [Google Scholar] [PubMed]
- Ilcol, Y.O.; Ozbek, R.; Hamurtkin, E.; Ulus, I.H. Choline status in newborns, infants, children, breast-feeding women, breast-fed infants and human breast milk. J. Nutr. Biochem. 2005, 16, 489–499. [Google Scholar] [CrossRef] [PubMed]
- Fischer, L.M.; Costa, K.A.; Galanko, J.; Sha, W.; Stephenson, B.; Vick, J.; Zeisel, S.H. Choline intake and genetic polymorphisms influence choline metabolite concentrations in human breast milk and plasma. Am. J. Clin. Nutr. 2010, 92, 336–346. [Google Scholar] [CrossRef] [PubMed]
- Blaas, N.; Schüürmann, C.; Bartke, N.; Stahl, B.; Humpf, H.-U. Structural profiling and quantification of sphingomyelin in human breast milk by HPLC-MS/MS. J. Agric. Food Chem. 2011, 59, 6018–6024. [Google Scholar] [CrossRef] [PubMed]
- Neville, M.C.; Picciano, M.F. Regulation of milk lipid secretion and composition. Ann. Rev. Nutr. 1997, 17, 159–184. [Google Scholar] [CrossRef] [PubMed]
- Hytten, F.E. Clinical and chemical studies in human lactation. Br. Med. J. 1954, 1, 249–255. [Google Scholar] [CrossRef] [PubMed]
- Saarela, T.; Kokkonen, J.; Koivisto, M. Macronutrient and energy contents of HM fractions during the first six months of lactation. Acta Paediatr. 2005, 94, 1176–1181. [Google Scholar] [CrossRef] [PubMed]
- Rueda, R. The role of dietary gangliosides on immunity and the prevention of infection. Brit. J. Nutr. 2007, 98, 68–73. [Google Scholar] [CrossRef] [PubMed]
- Wang, B.; McVeagh, P.; Petocz, P.; Brand-Miller, J. Brain gangliosides and glycoprotein sialic acid in breastfed compared with formula-fed infants. Am. J. Clin. Nutr. 2003, 78, 1024–1029. [Google Scholar] [PubMed]
- Ma, L.; MacGibbon, A.K.H.; Mohamed, H.J.B.J.; Loy, S.L.; Rowan, A.; McJarrow, P.; Fong, B.Y. Determination of ganglioside concentrations in breast milk and serum from Malaysian mothers using a high performance liquid chromatography-mass spectrometry-multiple reaction monitoring method. Intern. Dairy J. 2015, 49, 62–71. [Google Scholar] [CrossRef]
- Ma, L.; Liu, X.; MacGibbon, A.K.H.; Loy, S.L.; Rowan, A.; McJarrow, P.; Fong, B.Y. Lactational changes in concentration and distribution of ganglioside molecular species in human breast milk from Chinese mothers. Lipids 2015, 50, 1145–1154. [Google Scholar] [CrossRef] [PubMed]
- Nakano, T.; Sugawara, M.; Kawakami, H. Sialic acid in HM: Composition and functions. Acta Paediatr. Taiwan 2001, 42, 11–17. [Google Scholar] [PubMed]
- Laegreid, A.; Otnaess, A.B.K.; Fuglesang, J. Human and bovine-milk: Comparison of ganglioside composition and enterotoxin-inhibitory activity. Pediatr. Res. 1986, 20, 416–421. [Google Scholar] [CrossRef] [PubMed]
- Mitchell, M.D.; Henare, K.; Balakrishnan, B.; Lowe, E. Transfer of gangliosides across the human placenta. Placenta 2012, 33, 312–316. [Google Scholar] [CrossRef] [PubMed]


| 5–11 Days | 12–30 Days | 1–2 Months | 2–4 Months | 4–8 Months | |
|---|---|---|---|---|---|
| (n = 90) | (n = 90) | (n = 90) | (n = 90) | (n = 90) | |
| Mother | |||||
| Age (years), Mean ± SD | 27 ± 4 | 27 ± 3 | 28 ± 4 | 27 ± 4 | 26 ± 4 |
| Natural delivery | 27 ± 4 | 27 ± 3 | 28 ± 5 | 26 ± 4 | 26 ± 4 |
| Caesarean delivery | 28 ± 3 | 27 ± 4 | 29 ± 4 | 28 ± 4 | 27 ± 4 |
| Height (cm), Mean ± SD | 160 ± 4 | 160 ± 5 | 161 ± 5 | 161 ± 5 | 159 ± 5 |
| Weight (kg), Mean ± SD | 60.7 ± 8.7 | 60.8 ± 7.9 | 61.9 ± 8.9 | 58.4 ± 8.3 | 56.2 ± 8.1 |
| BMI (kg/m2), Mean ± SD | 23.7 ± 3.3 | 23.7 ± 2.8 | 23.9 ± 3.1 | 22.5 ± 2.9 | 22.2 ± 3.1 |
| Gestational weight gain(kg), Mean ± SD | 16.7 ± 7.4 | 16.2 ± 6.0 | 15.9 ± 5.7 | 15.9 ± 5.9 | 14.9 ± 7.6 |
| Postpartum weight loss (kg), Mean ± SD | 9.1 ± 6.1 | 8.6 ± 5.3 | 9.8 ± 4.0 | 10.0 ± 6.2 | 10.6 ± 5.9 |
| Gestational age at birth (weeks), Mean ± SD | 39.3 ± 1.2 | 39.2± 1.3 | 39.2 ± 1.6 | 39.4 ± 1.3 | 39.5 ± 1.5 |
| FA (g/100 g) | Total Population | Guangzhou | Beijing | Suzhou | ||||||||
|---|---|---|---|---|---|---|---|---|---|---|---|---|
| Colostrum (0–5 Days) n = 113 | Transitional (6–15 Days) n = 81 | Mature (16 Days–8 Months) n = 345 | Colostrum (0–5 Days) n = 38 | Transitional (6–15 Days) n = 22 | Mature (16 Days–8 Months) n = 120 | Colostrum (0–5 Days) n = 45 | Transitional (6–15 Days) n = 21 | Mature (16 Days–8 Months) n = 113 | Colostrum (0–5 Days) n = 30 | Transitional (6–15 Days) n = 38 | Mature (16 Days–8 Months) n = 112 | |
| 10:0 | 0.5 ± 0.4 | 1.5 ± 0.5 † | 1.6 ± 0.4 ‡ | 0.4 ± 0.4 | 1.4 ± 0.5 | 1.5 ± 0.5 | 0.6 ± 0.5 | 1.5 ± 0.4 | 1.6 ± 0.4 | 0.5 ± 0.4 | 1.6 ± 0.5 | 1.6 ± 0.4 |
| 12:0 | 2.6 ± 1.6 | 6.1 ± 2.3 † | 5.2 ± 1.9 | 2.3 ± 1.5 | 5.5 ± 2.1 | 5.0 ± 2.1 | 2.6 ± 1.7 | 6.5 ± 1.7 | 5.3 ± 1.6 | 2.7 ± 1.7 | 6.3 ± 2.6 | 5.3 ± 1.9 |
| 14:0 | 3.8 ± 1.7 | 5.5 ± 2.2 † | 4.2 ± 1.7 ‡ | 3.6 ± 1.8 | 5.2 ± 1.9 | 4.1 ± 2.0 | 3.8 ± 1.7 | 5.8 ± 1.4 | 4.3 ± 1.4 | 4.0 ± 1.7 | 5.2 ± 2.7 | 4.0 ± 1.7 |
| 16:0 | 23.2 ± 1.9 | 20.5 ± 2.3 † | 19.8 ± 2.6 ‡ | 23.9 ± 1.9 | 21.5 ± 2.1 | 20.6 ± 2.6 | 22.8 ± 2.2 | 21.5 ± 2.2 | 19.8 ± 2.2 | 22.5 ± 1.3 | 19.4 ± 2.2 | 18.5 ± 2.6 |
| 16:1n-7 | 2.0 ± 0.8 | 2.2 ± 0.7 † | 2.0 ± 0.6 | 1.7 ± 1.0 | 2.4 ± 0.8 | 2.2 ± 0.7 | 2.2 ± 0.6 | 1.7 ± 0.6 | 2.0 ± 0.5 | 1.8 ± 0.8 | 2.2 ± 0.5 | 2.0 ± 0.6 |
| 18:0 | 5.2 ± 1.0 | 5.0 ± 0.8 | 5.1 ± 1.1 | 5.5 ± 1.2 | 5.3 ± 0.7 | 5.4 ± 1.2 | 5.1 ± 0.9 | 5.4 ± 0.7 | 5.1 ± 1.0 | 4.9 ± 0.9 | 4.5 ± 0.8 | 4.8 ± 1.0 |
| 18:1n-9 | 34.2 ± 3.2 | 31.9 ± 3.6 † | 31.9 ± 3.6 | 37.1 ± 2.8 | 34.0 ± 2.2 | 33.4 ± 3.3 | 32.6 ± 2.9 | 30.3 ± 2.9 | 30.1 ± 2.9 | 34.0 ± 2.5 | 31.0 ± 4.1 | 31.7 ± 3.7 |
| 18:1n-7 | 2.5 ± 0.4 | 2.2 ± 0.5 † | 1.9 ± 0.3 ‡ | 2.7 ± 0.5 | 2.2 ± 0.4 | 2.0 ± 0.3 | 2.3 ± 0.4 | 2.0 ± 0.3 | 1.7 ± 0.2 | 2.4 ± 0.3 | 2.3 ± 0.6 | 1.9 ± 0.3 |
| 18:2n-6 | 18.9 ± 3.6 | 19.7 ± 3.8 † | 22.8 ± 4.9 ‡ | 15.7 ± 2.8 | 18.0 ± 3.4 | 19.7 ± 4.3 | 20.2 ± 3.5 | 20.2 ± 3.6 | 25.1 ± 3.9 | 19.9 ± 3.0 | 21.0 ± 3.9 | 23.8 ± 5.2 |
| 18:3n-3 | 0.9 ± 0.4 | 1.4 ± 0.6 † | 1.5 ± 0.9 ‡ | 0.7 ± 0.3 | 1.0 ± 0.5 | 1.0 ± 0.6 | 0.9 ± 0.4 | 1.1 ± 0.7 | 1.6 ± 1.1 | 1.2 ± 0.3 | 1.7 ± 0.6 | 2.0 ± 0.8 |
| 18:3n-6 | 0.05 ± 0.07 | 0.09 ± 0.06 † | 0.14 ± 0.06 ‡ | <0.05 | 0.1 ± 0.1 | 0.1 ± 0.1 | 0.1 ± 0.1 | 0.1 ± 0.1 | 0.2 ± 0.1 | <0.05 | 0.1 ± 0.1 | 0.1 ± 0.1 |
| 20:0 | 0.2 ± 0.1 | 0.2 ± 0.05 | 0.2 ± 0.1 | 0.2 ± 0.1 | 0.2 ± 0.1 | 0.2 ± 0.1 | 0.2 ± 0.1 | 0.2 ± 0.1 | 0.2 ± 0.1 | 0.2 ± 0.1 | 0.1 ± 0.1 | 0.2 ± 0.1 |
| 20:1n-9 | 0.9 ± 0.3 | 0.5 ± 0.2 † | 0.4 ± 0.2 | 1.0 ± 0.3 | 0.5 ± 0.2 | 0.4 ± 0.1 | 0.7 ± 0.3 | 0.5 ± 0.1 | 0.3 ± 0.1 | 0.9 ± 0.4 | 0.5 ± 0.2 | 0.6 ± 0.3 |
| 20:2n-6 | 1.2 ± 0.4 | 0.6 ± 0.3 † | 0.4 ± 0.1 ‡ | 1.1 ± 0.4 | 0.5 ± 0.3 | 0.4 ± 0.1 | 1.1 ± 0.4 | 0.8 ± 0.3 | 0.4 ± 0.1 | 1.3 ± 0.4 | 0.6 ± 0.2 | 0.4 ± 0.1 |
| 20:3n-6 | 0.7 ± 0.2 | 0.5 ± 0.2 † | 0.4 ± 0.1 ‡ | 0.6 ± 0.2 | 0.4 ± 0.1 | 0.3 ± 0.2 | 0.8 ± 0.3 | 0.6 ± 0.2 | 0.4 ± 0.1 | 0.7 ± 0.2 | 0.5 ± 0.1 | 0.4 ± 0.1 |
| 20:5n-3 | 0.04 ± 0.05 | 0.05 ± 0.06 † | 0.05 ± 0.07 | <0.05 | 0.10 ± 0.1 | <0.05 | <0.05 | <0.05 | 0.1 ± 0.1 | 0.1 ± 0.1 | <0.05 | 0.1 ± 0.1 |
| 22:1n-9 | 0.2 ± 0.2 | 0.1 ± 0.1 | 0.1 ± 0.3 | 0.2 ± 0.1 | 0.1 ± 0.1 | 0.10 ± 0.2 | 0.2 ± 0.2 | 0.1 ± 0.1 | 0.1 ± 0.1 | 0.3 ± 0.3 | 0.1 ± 0.2 | 0.1 ± 0.5 |
| 20:4n-6 (ARA) | 0.9 ± 0.3 | 0.7 ± 0.2 † | 0.5 ± 0.1 ‡ | 0.9 ± 0.2 | 0.7 ± 0.2 | 0.5 ± 0.2 | 1.1 ± 0.4 | 0.8 ± 0.2 | 0.5 ± 0.1 | 0.9 ± 0.2 | 0.7 ± 0.2 | 0.6 ± 0.1 |
| 24:0 | 0.2 ± 0.1 | 0.1 ± 0.1 † | 0.1 ± 0.1 | 0.2 ± 0.1 | 0.1 ± 0.1 | 0.1 ± 0.1 | 0.3 ± 0.2 | 0.1 ± 0.1 | 0.1 ± 0.1 | 0.2 ± 0.1 | 0.1 ± 0.1 | 0.1 ± 0.1 |
| 24:1n-9 | 0.4 ± 0.3 | 0.1 ± 0.1 † | 0.1 ± 0.1 ‡ | 0.4 ± 0.2 | 0.1 ± 0.1 | 0.1 ± 0.1 | 0.4 ± 0.3 | 0.1 ± 0.1 | 0.1 ± 0.1 | 0.4 ± 0.3 | 0.1 ± 0.1 | 0.1 ± 0.1 |
| 22:6n-3 (DHA) | 0.5 ± 0.3 | 0.5 ± 0.2 † | 0.3 ± 0.2 ‡ | 0.7 ± 0.3 | 0.4 ± 0.4 | 0.3 ± 0.2 | 0.5 ± 0.2 | 0.5 ± 0.1 | 0.2 ± 0.1 | 0.5 ± 0.2 | 0.4 ± 0.2 | 0.3 ± 0.2 |
| Total SFA | 35.7 ± 3.9 | 38.9 ± 4.1 † | 36.2 ± 4.7 ‡ | 36.1 ± 4.0 | 39.2 ± 3.8 | 36.9 ± 4.8 | 35.4 ± 3.9 | 41.0 ± 3.0 | 36.4 ± 3.9 | 35.0 ± 3.7 | 37.2 ± 4.8 | 34.5 ± 4.9 |
| Total MUFA | 40.7 ± 3.8 | 37.7 ± 4.3 † | 36.9 ± 4.1 | 43.1 ± 3.3 | 39.3 ± 3.0 | 38.3 ± 3.6 | 38.4 ± 4.1 | 34.7 ± 3.5 | 34.3 ± 4.5 | 39.8 ± 2.6 | 36.2 ± 4.8 | 36.4 ± 4.4 |
| MCFA | 6.8 ± 2.4 | 13.1 ± 3.3 | 11.0 ± 2.6 | 6.3 ± 2.3 | 12.1 ± 3.5 | 10.6 ± 2.8 | 7.0 ± 2.2 | 13.8 ± 2.2 | 11.2 ± 2.3 | 7.2 ± 2.4 | 13.1 ± 3.8 | 10.9 ± 2.6 |
| Total PUFA n-6 | 21.7 ± 3.6 | 21.6 ± 3.8 | 24.1 ± 5.0 | 18.3 ± 2.8 | 19.7 ± 3.4 | 21.1 ± 4.3 | 23.3 ± 3.6 | 22.5 ± 3.6 | 26.6 ± 3.9 | 22.8 ± 3.0 | 22.9 ± 3.9 | 25.3 ± 5.2 |
| Total PUFA n-3 | 1.4 ± 0.5 | 1.9 ± 0.7 | 1.9 ± 0.9 | 1.4 ± 0.4 | 1.5 ± 0.6 | 1.3 ± 0.6 | 1.4 ± 0.4 | 1.6 ± 0.7 | 1.9 ± 1.1 | 1.8 ± 0.4 | 2.1 ± 0.6 | 2.4 ± 0.8 |
| n-6 to n-3 ratio | 14.4 ± 3.7 | 11.8 ± 3.7 † | 12.5 ± 5.5 | 13.1 ± 3.7 | 13.1 ± 3.9 | 16.5 ± 5.6 | 16.6 ± 3.0 | 14.1 ± 3.9 | 13.8 ± 5.6 | 12.7 ± 3.8 | 10.9 ± 2.9 | 10.5 ± 4.0 |
| ARA to DHA ratio | 1.8 ± 0.7 | 1.6 ± 0.5 | 2.2 ± 0.9 ‡ | 1.3 ± 0.5 | 1.8 ± 0.6 | 1.9 ± 1.0 | 2.2 ± 0.7 | 1.6 ± 0.5 | 2.3 ± 0.8 | 1.8 ± 0.4 | 1.8 ± 0.5 | 1.9 ± 0.8 |
| mg/100 mL | Total Population | Guangzhou | Beijing | Suzhou | ||||||||
|---|---|---|---|---|---|---|---|---|---|---|---|---|
| Colostrum (0–5 Days) n = 113 | Transitional (6–15 Days) n = 81 | Mature (16 Days–8 Months) n = 345 | Colostrum (0–5 Days) n = 38 | Transitional (6–15 Days) n = 22 | Mature (16 Days–8 Months) n = 120 | Colostrum (0–5 Days) n = 45 | Transitional (6–15 Days) n = 21 | Mature (16 Days–8 Months) n = 113 | Colostrum (0–5 Days) n = 30 | Transitional (6–15 Days) n = 38 | Mature (16 Days–8 Months) n = 112 | |
| PtdCho | 12.0 ± 5.8 | 10.1 ± 5.5 † | 8.2 ± 5.0 †,‡ | 12.5 ± 4.6 a | 11.3 ± 5.6 b | 8.6 ± 5.1 c | 10.9 ± 4.8 a | 8.3 ± 3.7 b | 7.6 ± 4.5 c | 12.6 ± 7.7 a | 11.9 ± 6.1 b | 8.5 ± 5.3 c |
| CerPCho | 9.1 ± 4.0 | 7.3 ± 4.1 † | 7.2 ± 4.0 † | 7.7 ± 1.6 a | 6.8 ± 2.7 b | 7.1 ± 4.0 c | 10.9 ± 4.9 d | 6.2 ± 3.8 b | 7.3 ± 3.9 c | 9.7 ± 3.1 a | 8.5 ± 4.7 e | 7.4 ± 4.2 c |
| PtdEtn | 8.5 ± 5.2 | 8.2 ± 5.3 | 6.4 ± 3.4 †,‡ | 9.9 ± 2.6 a | 5.6 ± 3.7 b | 7.1 ± 3.9 c | 7.6 ± 3.1 d | 7.3 ± 2.4 b | 5.3 ± 2.6 e | 12.6 ± 7.4 f | 10.8 ± 5.8 g | 7.3 ± 3.2 c |
| PtdIns | 1.8 ± 0.7 | 1.8 ± 1.0 | 1.5 ± 0.7 †,‡ | 1.8 ± 0.5 a | 1.2 ± 0.7 b | 1.5 ± 0.8 c | 1.6 ± 0.5 a | 1.5 ± 0.4 b | 1.2 ± 0.5 d | 2.3 ± 1.0 e | 2.4 ± 1.1 f | 1.7 ± 0.8 g |
| PtdSer | 1.5 ± 1.6 | 1.1 ± 0.8 † | 1.0 ± 1.0 † | 1.3 ± 0.4 a | 0.8 ± 0.4 b | 1.0 ± 0.6 c | 1.8 ± 2.3 d | 1.0 ± 1.4 b | 0.9 ± 1.2 c | 1.7 ± 0.5 a | 1.3 ± 0.5 e | 1.2 ± 1.4 f |
| Total PL (mg/100 mL) | 33.0 ± 13.2 | 28.5 ± 14.4 † | 24.2 ± 11.4 †,‡ | 33.2 ± 8.1 a | 25.6 ± 11.1 b | 25.3 ± 12.5 c | 33.0 ± 11.2 a | 24.4 ± 8.1 b | 22.3 ± 9.9 d | 38.9 ± 18.8 e | 34.9 ± 16.6 f | 26.02 ± 11.3 c |
| Total Population | Guangzhou | Beijing | Suzhou | |||||||||
|---|---|---|---|---|---|---|---|---|---|---|---|---|
| GD mg/L | Colostrum (0–5 Days) n = 113 | Transitional (6–15 Days) n = 81 | Mature (16 Days–8 Months) n = 345 | Colostrum (0–5 Days) n = 38 | Transitional (6–15 Days) n = 22 | Mature (16 Days–8 Months) n = 120 | Colostrum (0–5 Days) n = 45 | Transitional (6–15 Days) n = 21 | Mature (16 Days–8 Months) n = 113 | Colostrum (0–5 Days) n = 30 | Transitional (6–15 Days) n = 38 | Mature (16 Days–8 Months) n = 112 |
| GM3 | 3.8 ± 2.5 | 5.5 ± 3.2 † | 10.1 ± 4.6 †,‡ | 4.0 ± 2.7 a | 7.7 ± 4.5 b | 10.5 ± 4.6 c | 3.7 ± 2.3 a | 3.3 ± 1.6 d | 9.0 ± 3.8 c | 4.0 ± 2.6 a | 5.4 ± 2.0 e | 10.8 ± 5.2 c |
| GD3 | 4.1 ± 4.5 | 3.0 ± 3.4 † | 1.0 ± 1.7 †,‡ | 2.8 ± 2.5 a | 3.0 ± 3.5 b | 1.0 ± 2.3 c | 2.2 ± 2.0 a | 3.0 ± 2.8 b | 0.7 ± 0.9 c | 8.6 ± 5.9 d | 2.9 ± 3.7 b | 1.1 ± 1.5 c |
| GM3 + GD3 | 8.0 ± 5.3 | 8.5 ± 4.5 † | 11.0 ± 5.0 †,‡ | 6.6 ± 3.2 a | 10.7 ± 4.7 b | 11.5 ± 5.1 c | 5.9 ± 2.7 a | 6.3 ± 3.4 d | 9.7 ± 4.0 c | 12.6 ± 7.0 e | 8.3 ± 4.3 f | 11.9 ± 5.6 c |
| GM3/GD3 | 0.9 | 1.8 † | 10.1 †,‡ | 1.4 | 2.6 | 10.4 | 1.7 | 1.1 | 12.5 | 0.5 | 1.8 | 9.4 |
© 2016 by the authors; licensee MDPI, Basel, Switzerland. This article is an open access article distributed under the terms and conditions of the Creative Commons Attribution (CC-BY) license (http://creativecommons.org/licenses/by/4.0/).
Share and Cite
Giuffrida, F.; Cruz-Hernandez, C.; Bertschy, E.; Fontannaz, P.; Masserey Elmelegy, I.; Tavazzi, I.; Marmet, C.; Sanchez-Bridge, B.; Thakkar, S.K.; De Castro, C.A.; et al. Temporal Changes of Human Breast Milk Lipids of Chinese Mothers. Nutrients 2016, 8, 715. https://doi.org/10.3390/nu8110715
Giuffrida F, Cruz-Hernandez C, Bertschy E, Fontannaz P, Masserey Elmelegy I, Tavazzi I, Marmet C, Sanchez-Bridge B, Thakkar SK, De Castro CA, et al. Temporal Changes of Human Breast Milk Lipids of Chinese Mothers. Nutrients. 2016; 8(11):715. https://doi.org/10.3390/nu8110715
Chicago/Turabian StyleGiuffrida, Francesca, Cristina Cruz-Hernandez, Emmanuelle Bertschy, Patric Fontannaz, Isabelle Masserey Elmelegy, Isabelle Tavazzi, Cynthia Marmet, Belén Sanchez-Bridge, Sagar K. Thakkar, Carlos Antonio De Castro, and et al. 2016. "Temporal Changes of Human Breast Milk Lipids of Chinese Mothers" Nutrients 8, no. 11: 715. https://doi.org/10.3390/nu8110715