The Role of Viscosity and Fermentability of Dietary Fibers on Satiety- and Adiposity-Related Hormones in Rats

Abstract
:1. Introduction
2. Experimental Section
2.1. Animals and Diets
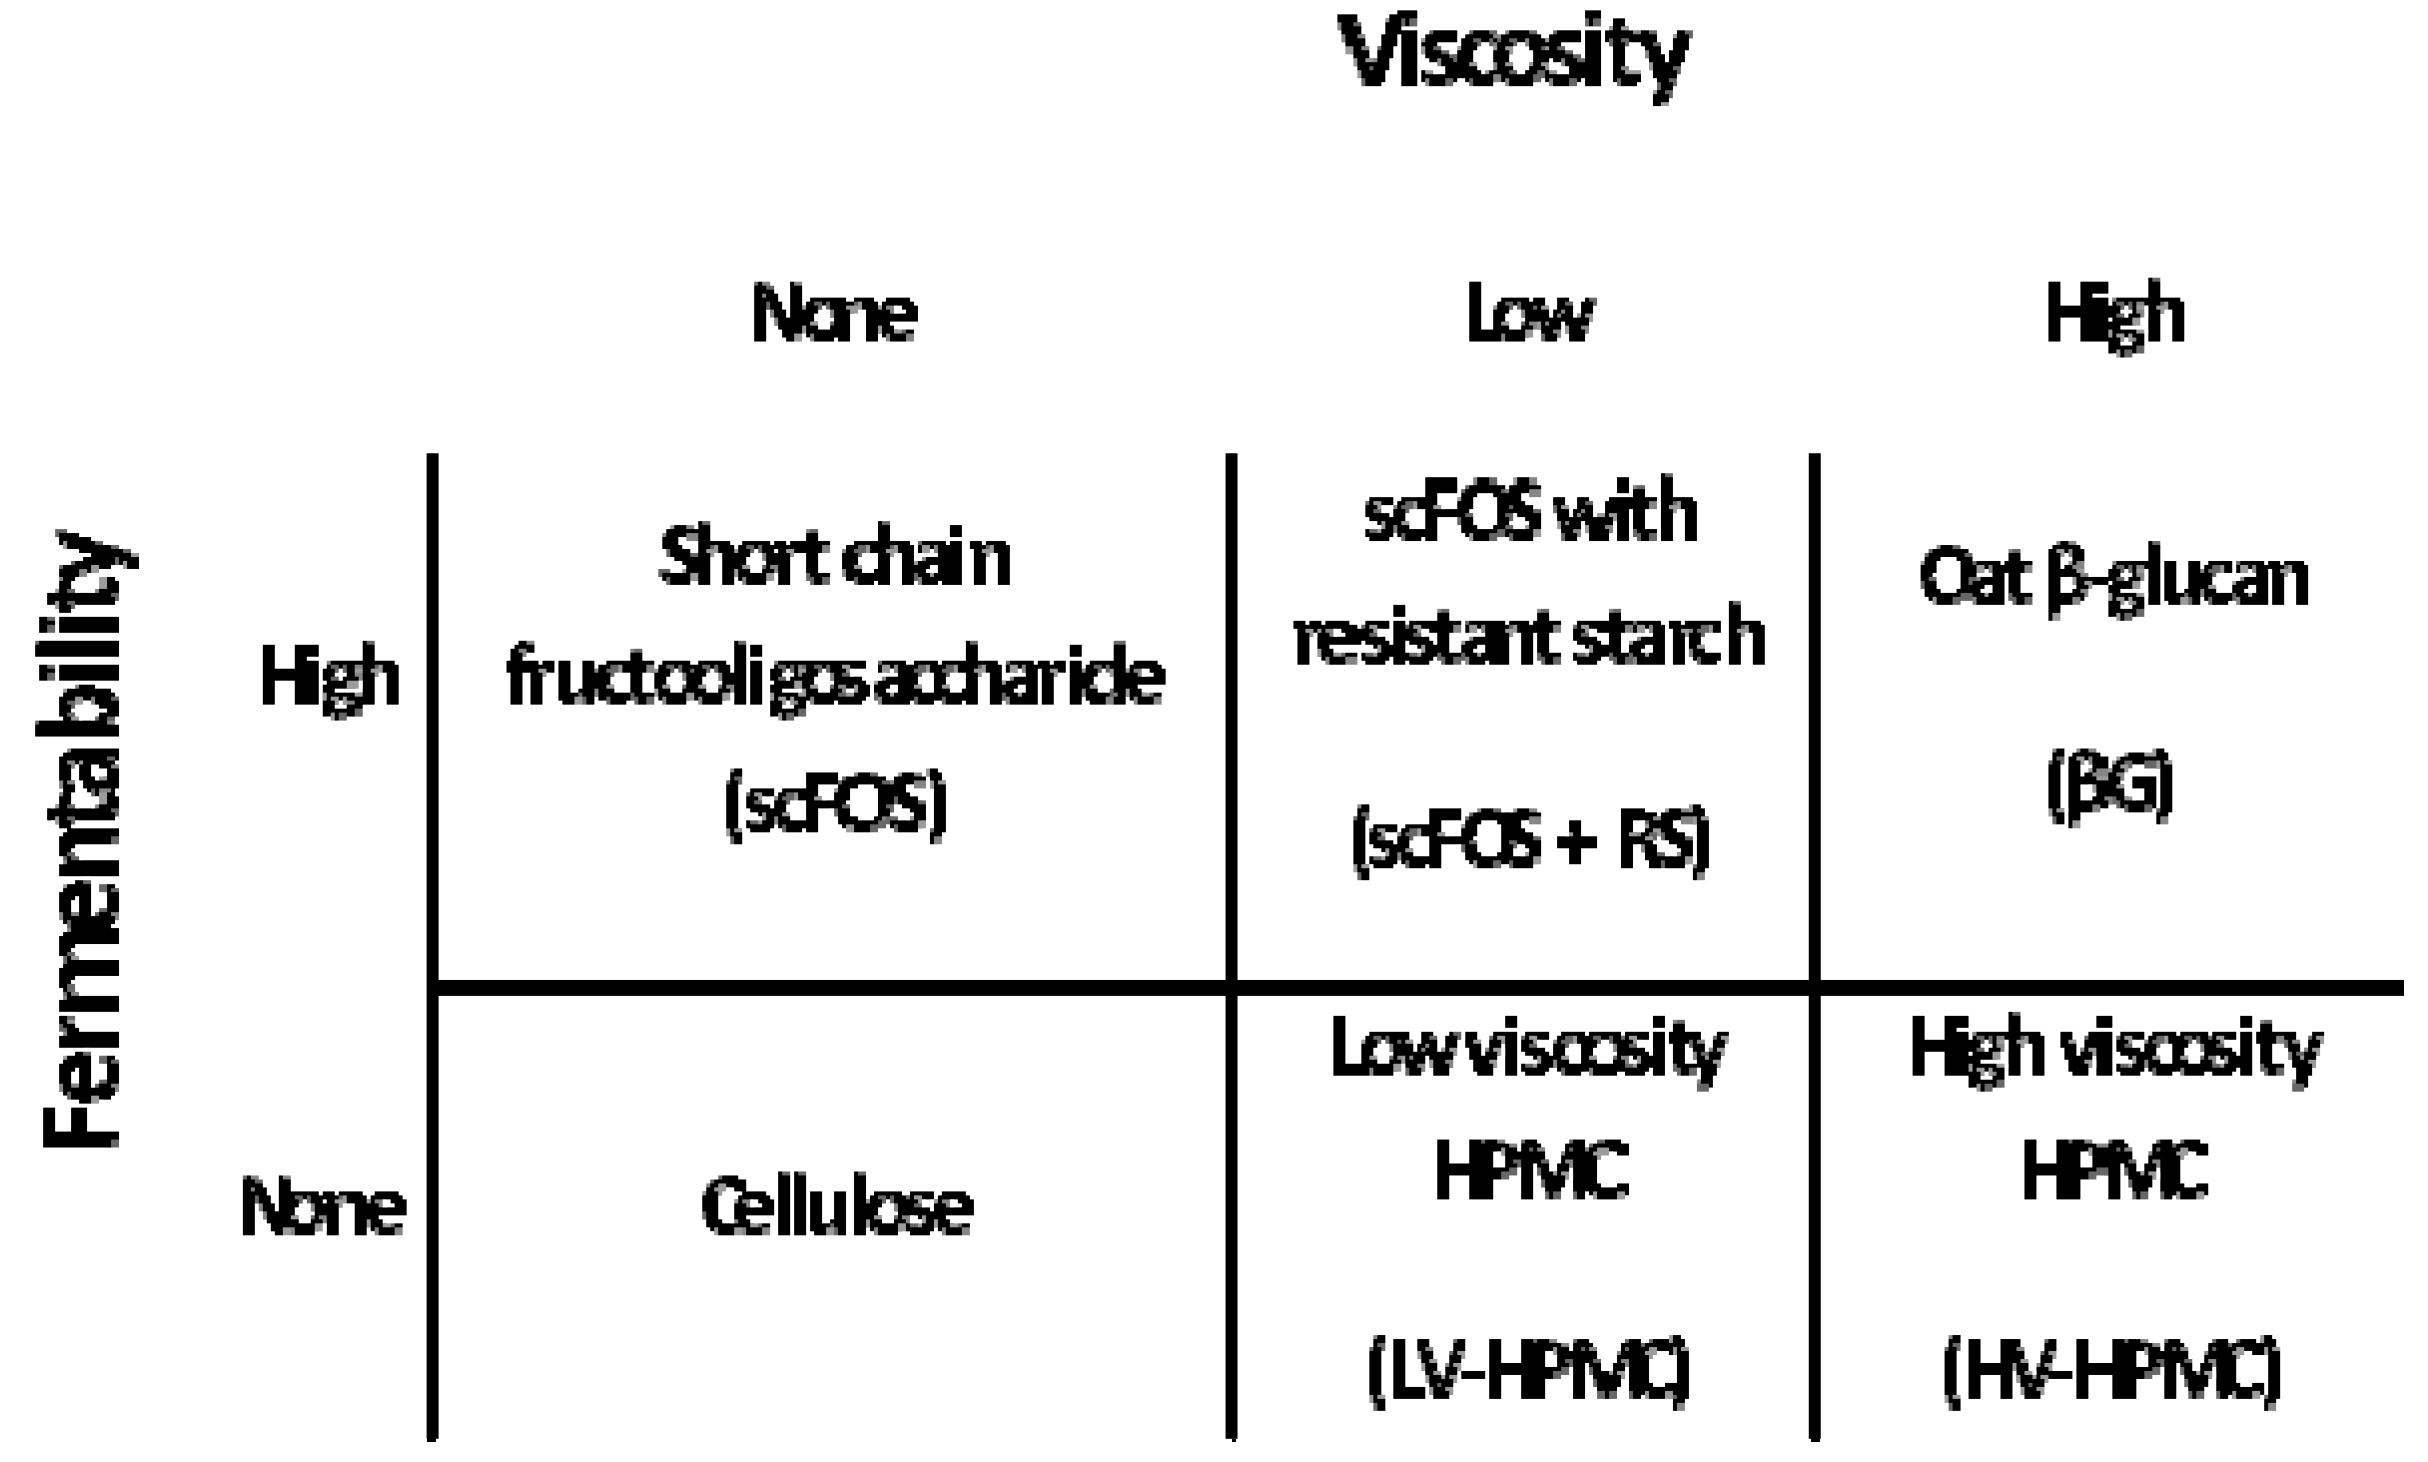
2.2. Experimental Design

| Diet components (g/kg) | Cellulose | LV-HPMC | HV-HPMC | scFOS | scFOS + RS | βG |
|---|---|---|---|---|---|---|
| Fiber source | 50 | 50 | 50 | 53.9 | 71 | 92.6 |
| Sucrose | 100 | 100 | 100 | 98.06 | 99.01 | 99.07 |
| Corn starch | 449.5 | 449.5 | 449.5 | 449.5 | 436.08 | 434.7 |
| Casein | 200 | 200 | 200 | 200 | 199.65 | 188.89 |
| Cellulose | 30 | 30 | 30 | 30 | 30 | 30 |
| Mineral Mix | 35 | 35 | 35 | 35 | 35 | 35 |
| Vitamin Mix | 10 | 10 | 10 | 10 | 10 | 10 |
| l-cysteine | 3 | 3 | 3 | 3 | 3 | 3 |
| Choline Bitartrate | 2.5 | 2.5 | 2.5 | 2.5 | 2.5 | 2.5 |
| TBHQ | 0.014 | 0.014 | 0.014 | 0.014 | 0.014 | 0.014 |
| Soybean Oil | 120 | 120 | 120 | 120 | 120 | 120 |
| Total Weight | 1000.014 | 1000.014 | 1000.014 | 1001.974 | 1006.254 | 1015.774 |
| % Carbohydrate | 54.95 | 54.95 | 54.95 | 54.84 | 54.61 | 54.10 |
| % Protein | 20.00 | 20.00 | 20.00 | 19.96 | 19.88 | 19.69 |
| % Fat | 12.00 | 12.00 | 12.00 | 11.98 | 11.93 | 11.81 |
| % Fiber | 8% | 8% | 8% | 8% | 8% | 8% |
| Energy (kcal/g) | 4.08 | 4.08 | 4.08 | 4.07 | 4.05 | 4.01 |

2.3. Small Intestinal Contents Viscosity
2.4. Plasma and Tissue Hormone Measurements
2.5. Statistical Analyses
3. Results
3.1. Food Intake
| Para-meter 2 | No Viscosity | Low Viscosity | High Viscosity | Significant Main Effects 3 | |||
|---|---|---|---|---|---|---|---|
| Not Fermentable | Fermentable | Not Fermentable | Fermentable | Not Fermentable | Fermentable | ||
| Cellulose | scFOS | LV-HPMC | scFOS + RS | HV-HPMC | βG | ||
| Final Body Weight, g | 389.2 ± 11.1 ac | 361.4 ± 11.0 bc | 370.9 ± 12.8 abc | 389.7 ± 10.8 a | 351.5 ± 6.8 b | 383.8 ± 9.5 ac | V × F Interaction p = 0.017 |
| Average Daily Food Intake, g | 20.35 ± 0.21 | 19.64 ± 0.64 | 20.38 ± 0.54 | 21.11 ± 0.40 | 19.64 ± 0.34 | 20.26 ± 0.46 | NS |
| Cecum Weight (empty), g | 0.60 ± 0.04 a | 1.04 ± 0.06 d | 0.91 ± 0.11 bcd | 0.78 ± 0.05 bc | 0.73 ± 0.05 ab | 0.91 ± 0.06 cd | F (p = 0.004); V × F Interaction p <0.001 |
| Cecal Contents Weight, g | 1.22 ± 0.17 a | 3.03 ± 0.42 c | 1.31 ± 0.17 a | 1.61 ± 0.16 ab | 1.89 ± 0.71 ab | 2.46 ± 0.32 bc | F p = 0.005 |
| Proximal Colon Weight, g | 0.21 ± 0.01 | 0.18 ± 0.01 | 0.23 ± 0.02 | 0.21 ± 0.03 | 0.23 ± 0.02 | 0.19 ± 0.01 | F p = 0.058 |
| Epididymal Fat Pad Weight, g | 3.17 ± 0.22 c | 2.35 ± 0.23 ba | 2.74 ± 0.26 abc | 2.94 ± 0.26 bc | 2.13 ± 0.22 a | 2.60 ± 0.22 abc | V × F Interaction p = 0.023 |
| Small Intestinal Contents Supernatant Viscosity, mPa·s | 12 ± 3 a | 18 ± 5 a | 43 ± 7 b | 35 ± 13 b | 201 ± 125 c | 210 ± 65 c | V p <0.0001 |
3.2. Body Weight
3.3. Organ and Tissue Weight
3.4. Small Intestinal Contents Viscosity
3.5. GLP-1
3.5.1. Fasted State
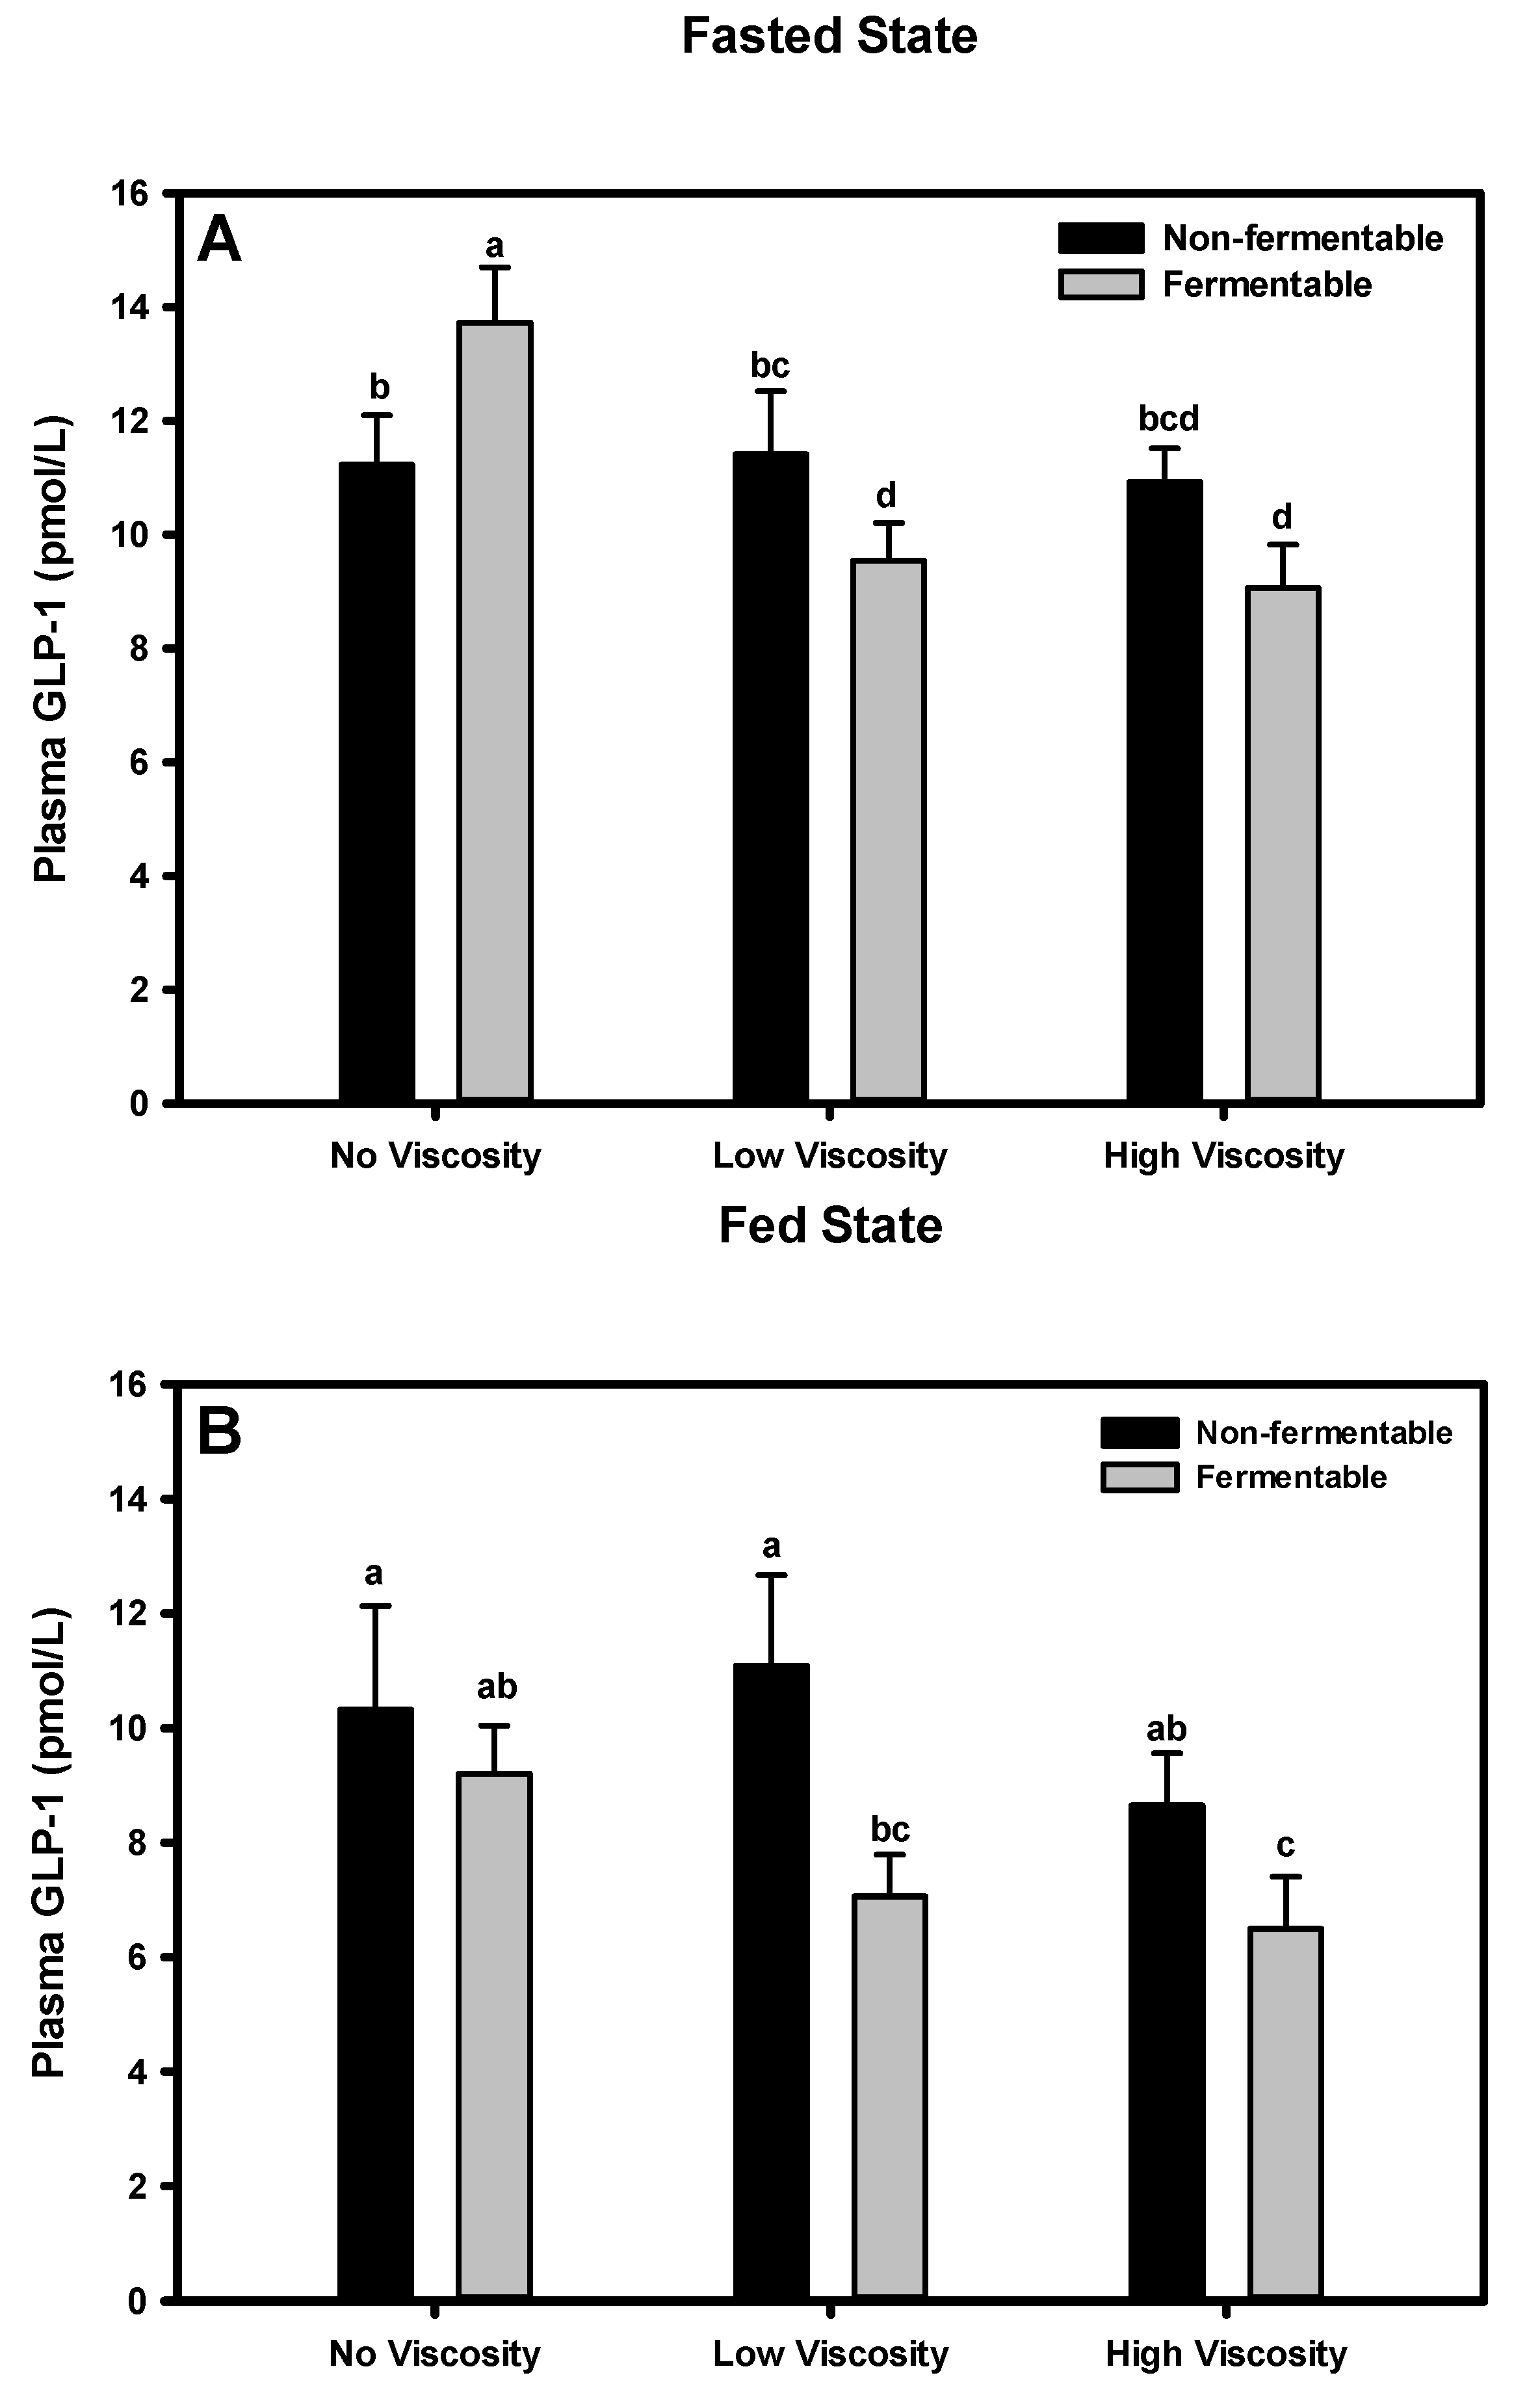
3.5.2. Fed State
3.6. Proximal Colon GLP-1 Protein Concentration
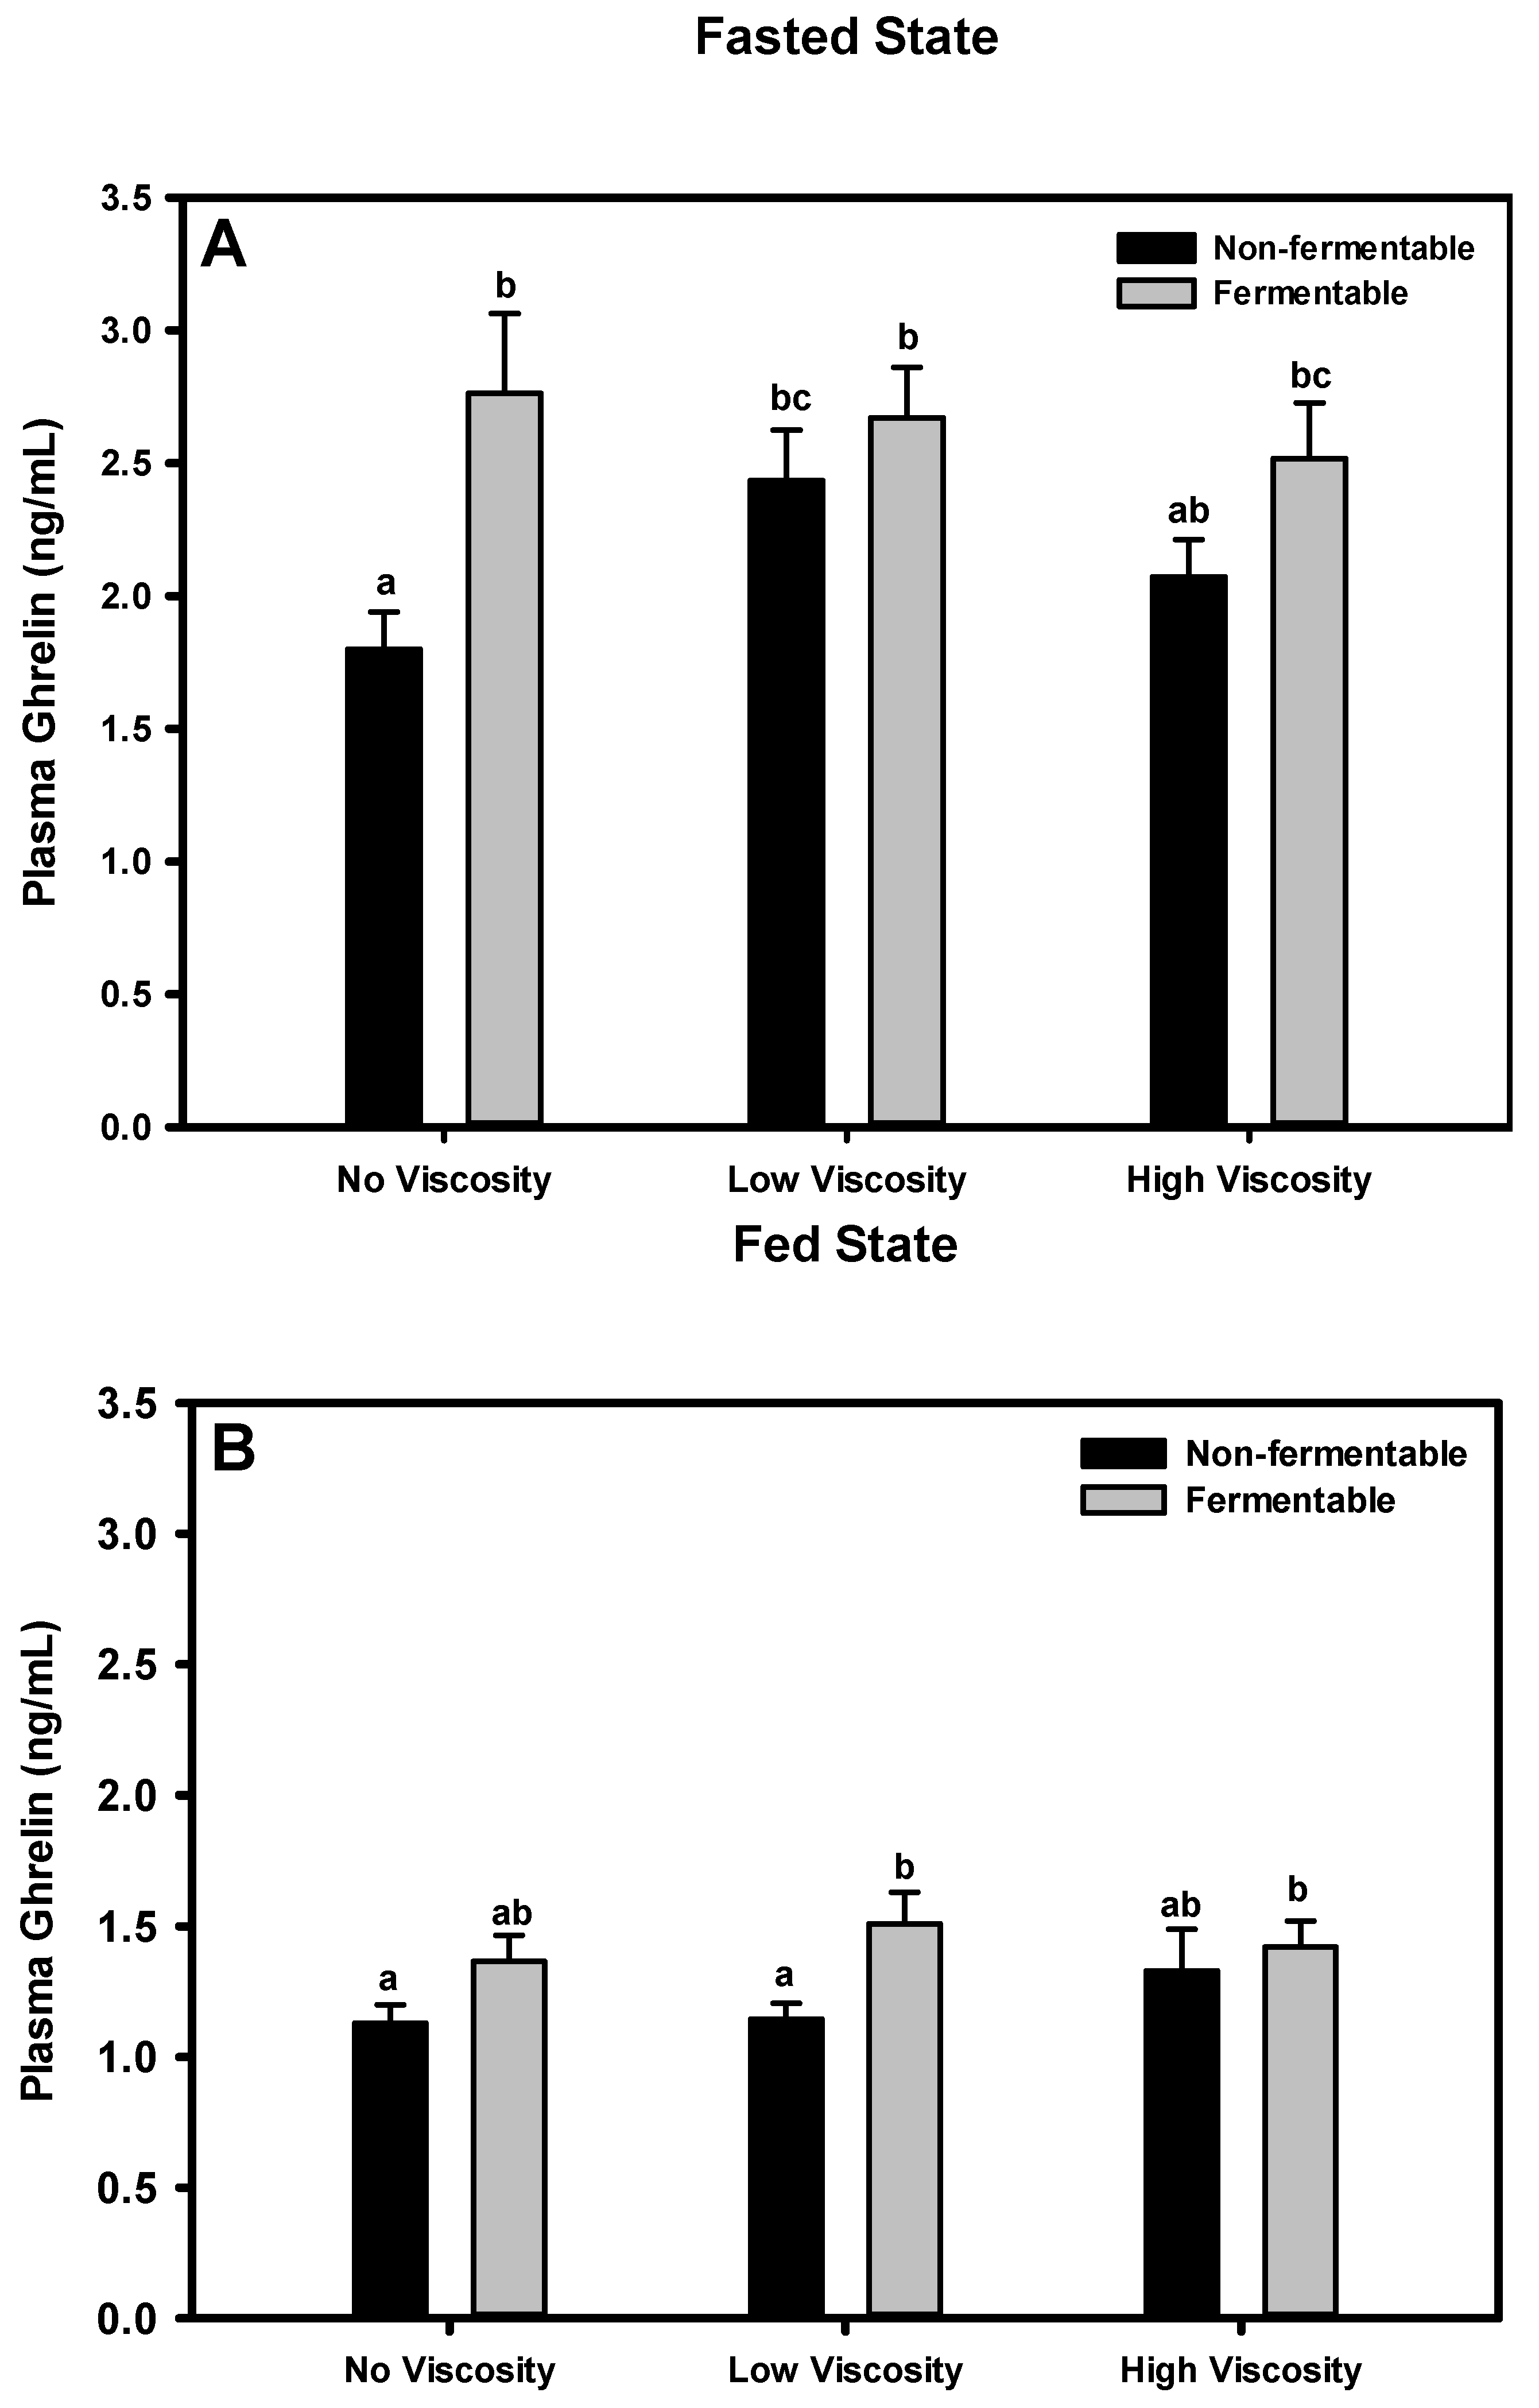
3.7. Ghrelin
3.7.1. Fasted State
3.7.2. Fed State
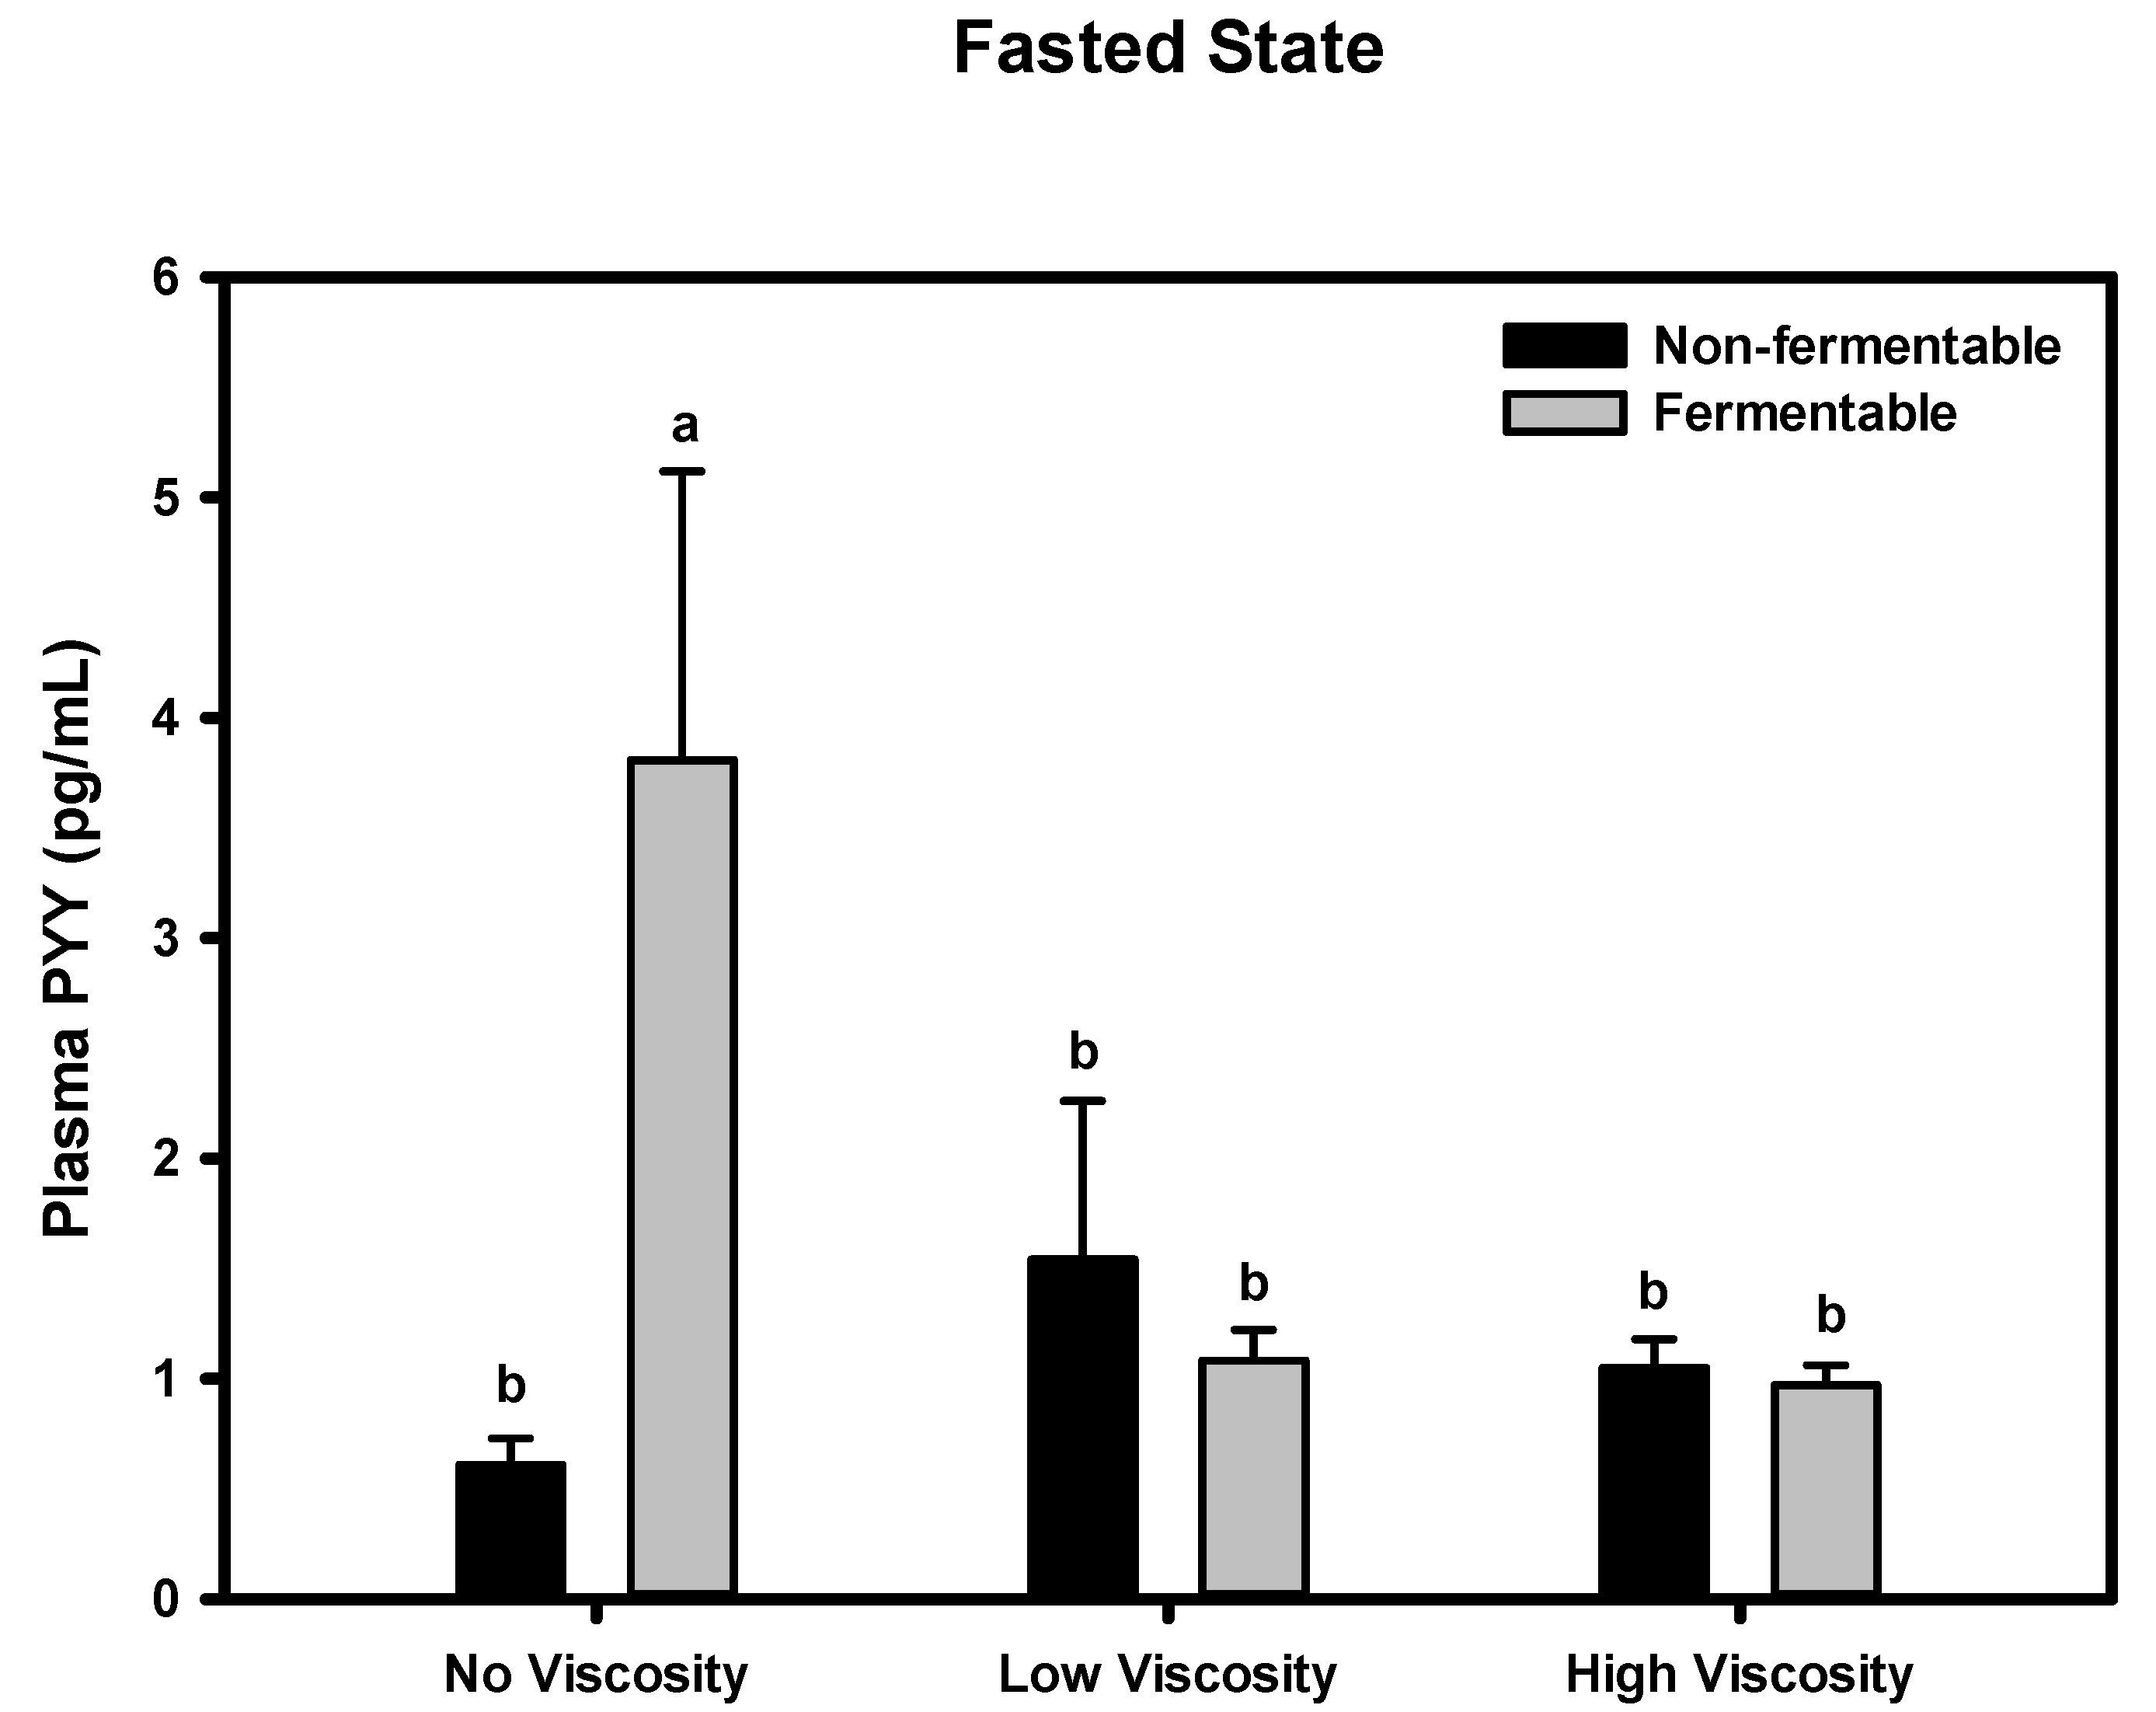
3.8. PYY
Fasted State

3.9. Leptin
3.9.1. Fasted State

3.9.2. Fed State
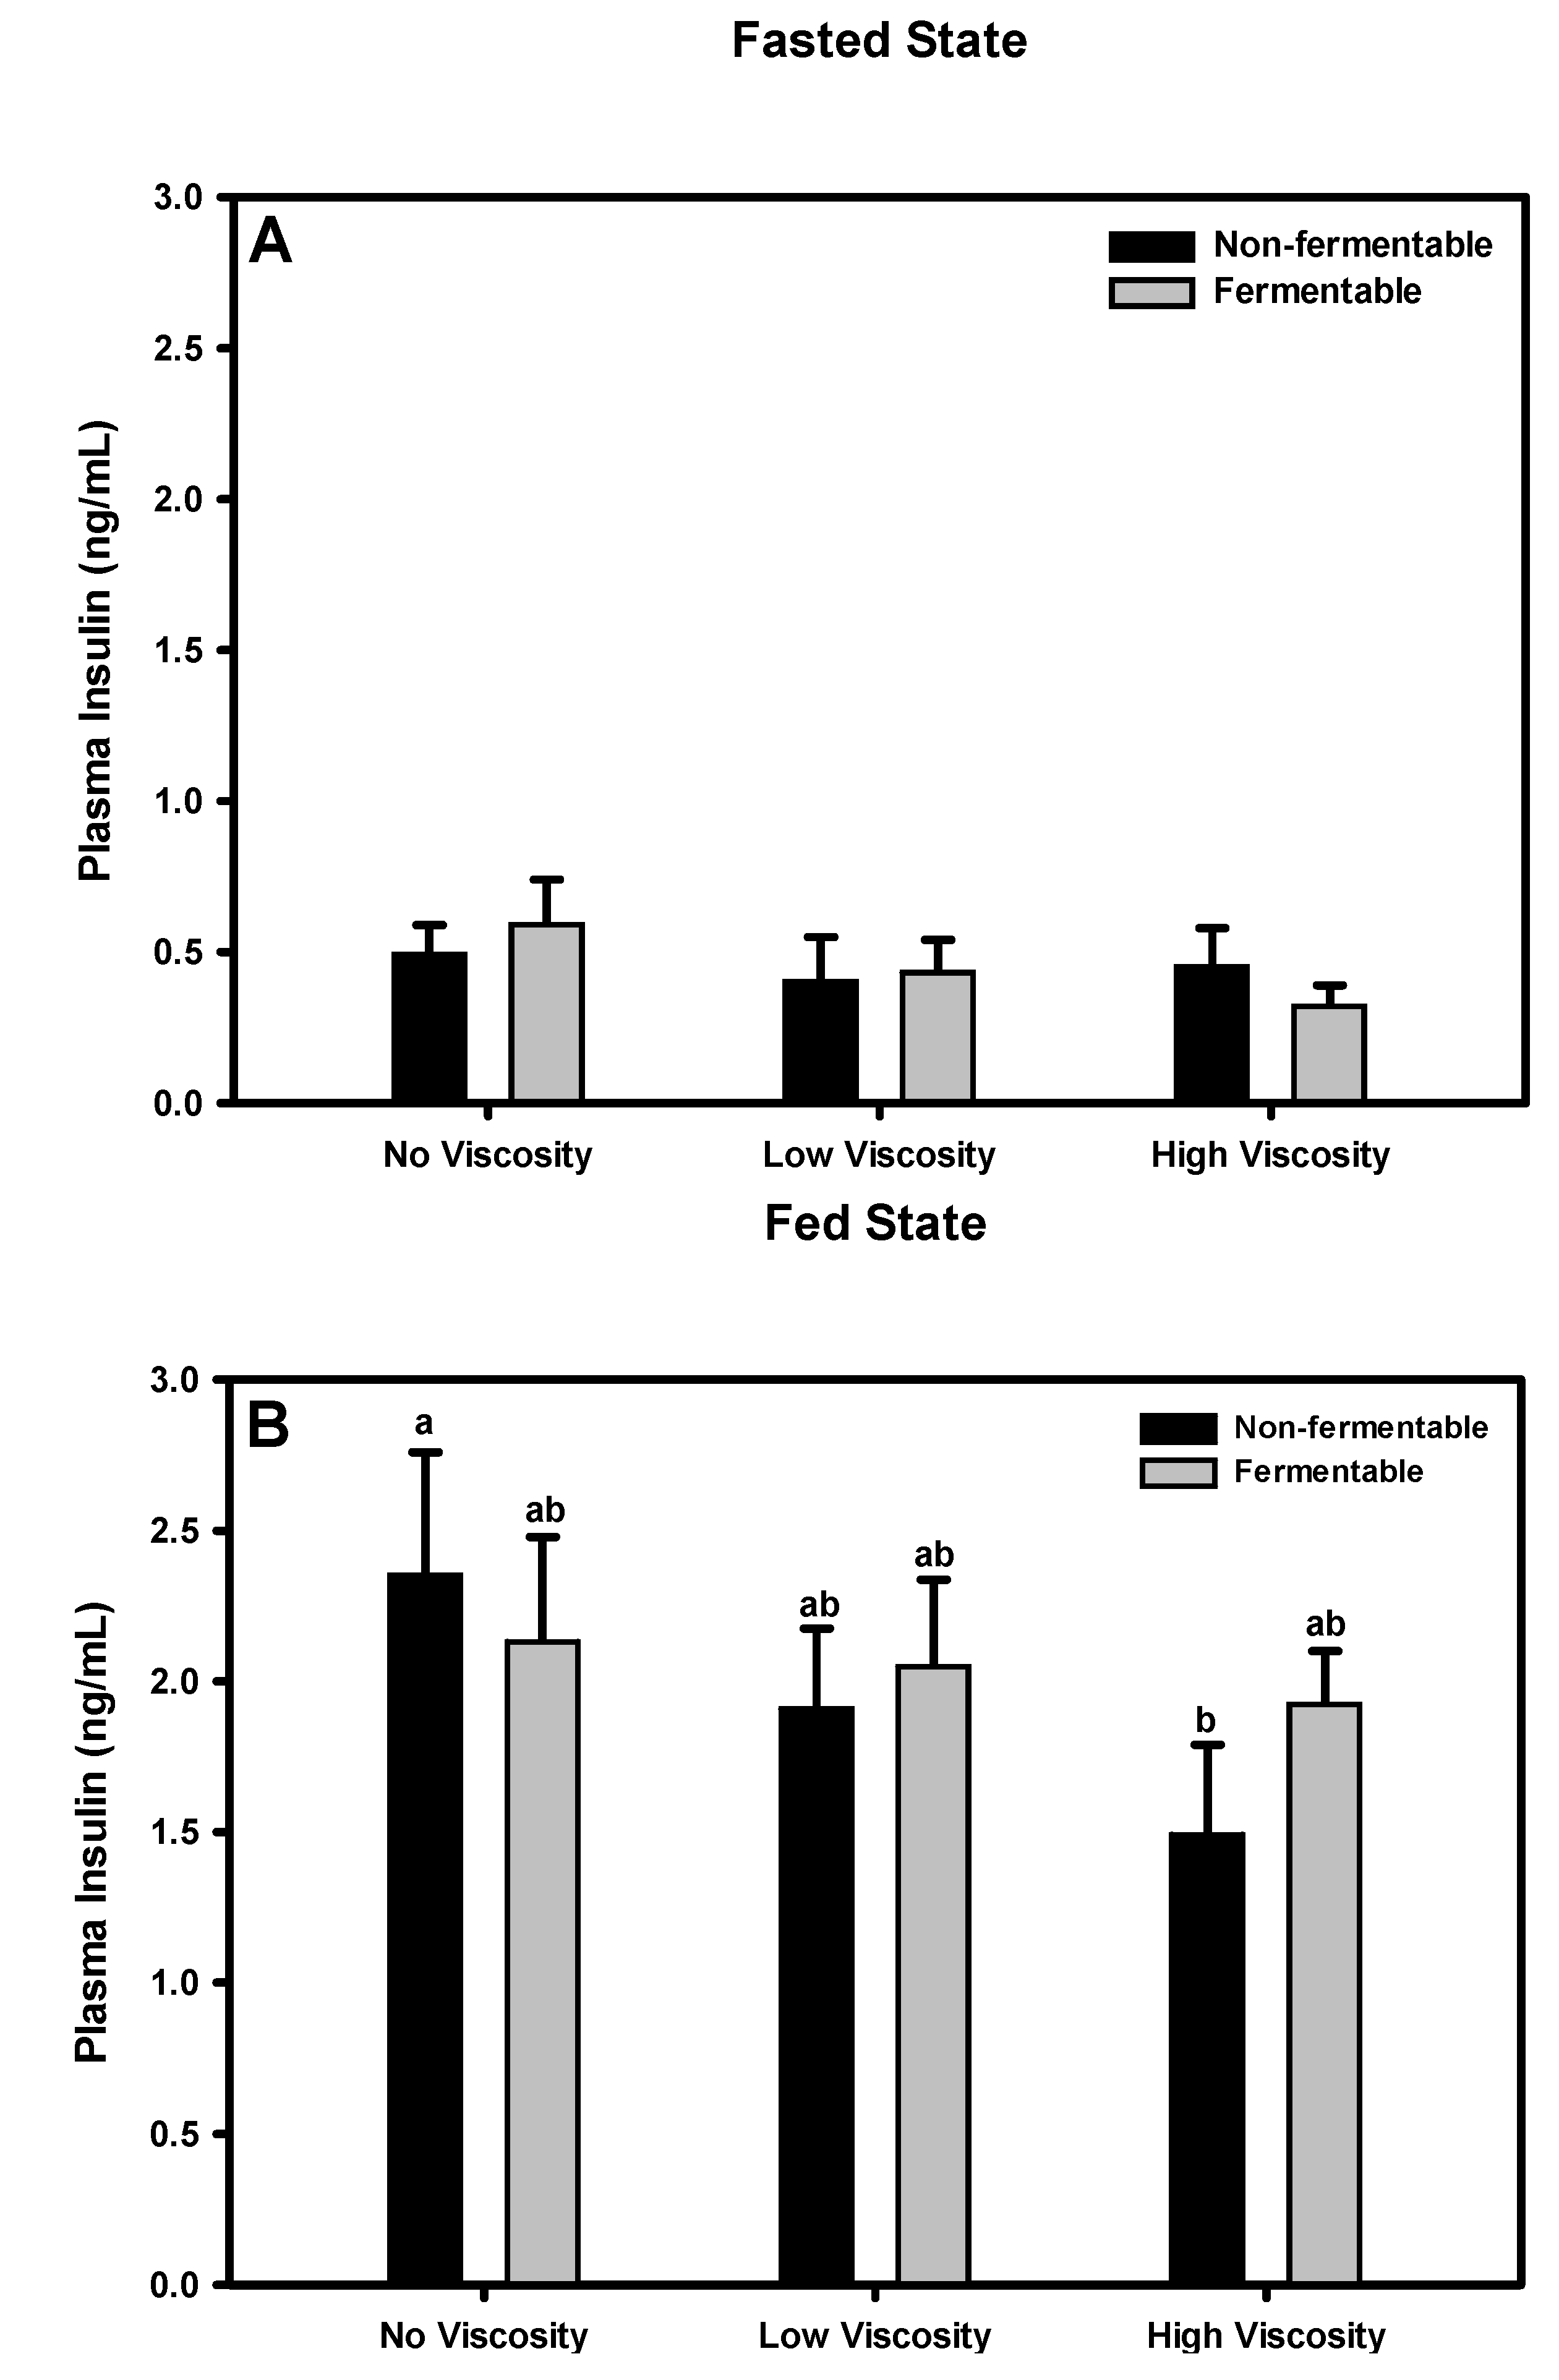
3.10. Insulin
3.10.1. Fasted State
3.10.2. Fed State
3.11. Correlations between Hormones
| Fasting Leptin | Fed Leptin | Fasting Ghrelin | Fed Ghrelin | Fasting PYY | Fed GLP-1 | Tissue GLP-1 | |
|---|---|---|---|---|---|---|---|
| Fasting Insulin | NS | 0.24 p = 0.059 | −0.29 p = 0.021 | NS | NS | −0.25 p = 0.048 | NS |
| Fed Insulin | NS | 0.52 p <0.0001 | −0.26 p = 0.039 | NS | NS | NS | −0.26 p = 0.040 |
| Fasting GLP-1 | NS | NS | NS | NS | 0.37 p = 0.003 | NS | −0.29 p = 0.021 |
3.12. Stepwise Regression of Average Food Intake with Plasma Hormones
| Hormone-state | Partial R2 | Cumulative R2 | P Value for Each Parameter |
|---|---|---|---|
| Leptin-fed | 0.181 | 0.181 | 0.0008 |
| Ghrelin-fasted | 0.201 | 0.381 | 0.0001 |
| PYY-fasted | 0.114 | 0.496 | 0.0008 |
4. Discussion
5. Conclusions
Conflict of Interest
References
- Cani, P.D.; Neyrinck, A.M.; Maton, N.; Delzenne, N.M. Oligofructose promotes satiety in rats fed a high-fat diet: Involvement of glucagon-like peptide-1. Obes. Res. 2005, 13, 1000–1007. [Google Scholar] [CrossRef]
- Marciani, L.; Gowland, P.A.; Spiller, R.C.; Manoj, P.; Moore, R.J.; Young, P.; Fillery-Travis, A.J. Effect of meal viscosity and nutrients on satiety, intragastric dilution, and emptying assessed by MRI. Am. J. Physiol. Gastrointest. Liver Physiol. 2001, 280, G1227–G1233. [Google Scholar]
- Darwiche, G.; Bjorgell, O.; Almer, L.O. The addition of locust bean gum but not water delayed the gastric emptying rate of a nutrient semisolid meal in healthy subjects. BMC Gastroenterol. 2003, 3, 12. [Google Scholar] [CrossRef]
- Leclere, C.J.; Champ, M.; Boillot, J.; Guille, G.; Lecannu, G.; Molis, C.; Bornet, F.; Krempf, M.; Delort-Laval, J.; Galmiche, J.P. Role of viscous guar gums in lowering the glycemic response after a solid meal. Am. J. Clin. Nutr. 1994, 59, 914–921. [Google Scholar]
- Rigaud, D.; Paycha, F.; Meulemans, A.; Merrouche, M.; Mignon, M. Effect of psyllium on gastric emptying, hunger feeling and food intake in normal volunteers: A double blind study. Eur. J. Clin. Nutr. 1998, 52, 239–245. [Google Scholar]
- Van Nieuwenhoven, M.A.; Kovacs, E.M.; Brummer, R.J.; Westerterp-Plantenga, M.S.; Brouns, F. The effect of different dosages of guar gum on gastric emptying and small intestinal transit of a consumed semisolid meal. J. Am. Coll. Nutr. 2001, 20, 87–91. [Google Scholar]
- Blom, W.A.; Lluch, A.; Vinoy, S.; Stafleu, A.; van den Berg, R.; Holst, J.J.; Kok, F.J.; Hendriks, H.F. Effects of gastric emptying on the postprandial ghrelin response. Am. J. Physiol. Endocrinol. Metab. 2006, 290, E389–E395. [Google Scholar]
- Brockman, D.A.; Chen, X.; Gallaher, D.D. Hydroxypropyl methylcellulose, a viscous soluble fiber, reduces insulin resistance and decreases fatty liver in Zucker Diabetic Fatty rats. Nutr. Metab. (Lond.) 2012, 9, 100. [Google Scholar] [CrossRef]
- Islam, A.; Civitarese, A.E.; Hesslink, R.L.; Gallaher, D.D. Viscous dietary fiber reduces adiposity and plasma leptin and increases muscle expression of fat oxidation genes in rats. Obesity (Silver Spring) 2012, 20, 349–355. [Google Scholar] [CrossRef]
- Cani, P.D.; Dewever, C.; Delzenne, N.M. Inulin-type fructans modulate gastrointestinal peptides involved in appetite regulation (glucagon-like peptide-1 and ghrelin) in rats. Br. J. Nutr. 2004, 92, 521–526. [Google Scholar] [CrossRef]
- Keenan, M.J.; Zhou, J.; McCutcheon, K.L.; Raggio, A.M.; Bateman, H.G.; Todd, E.; Jones, C.K.; Tulley, R.T.; Melton, S.; Martin, R.J.; et al. Effects of resistant starch, a non-digestible fermentable fiber, on reducing body fat. Obesity (Silver Spring) 2006, 14, 1523–1534. [Google Scholar] [CrossRef]
- Belobrajdic, D.P.; King, R.A.; Christophersen, C.T.; Bird, A.R. Dietary resistant starch dose-dependently reduces adiposity in obesity-prone and obesity-resistant male rats. Nutr. Metab. (Lond.) 2012, 9, 93. [Google Scholar] [CrossRef]
- Livesey, G. The energy values of dietary fibre and sugar alcohols for man. Nutr. Res. Rev. 1992, 5, 61–84. [Google Scholar] [CrossRef]
- Tulung, B.; Remesy, C.; Demigne, C. Specific effect of guar gum or gum arabic on adaptation of cecal digestion to high fiber diets in the rat. J. Nutr. 1987, 117, 1556–1561. [Google Scholar]
- Sakaguchi, E.; Sakoda, C.; Toramaru, Y. Caecal fermentation and energy accumulation in the rat fed on indigestible oligosaccharides. Br. J. Nutr. 1998, 80, 469–476. [Google Scholar]
- Remesy, C.; Demigne, C. Specific effects of fermentable carbohydrates on blood urea flux and ammonia absorption in the rat cecum. J. Nutr. 1989, 119, 560–565. [Google Scholar]
- Sakata, T. Stimulatory effect of short-chain fatty acids on epithelial cell proliferation in the rat intestine: A possible explanation for trophic effects of fermentable fibre, gut microbes and luminal trophic factors. Br. J. Nutr. 1987, 58, 95–103. [Google Scholar] [CrossRef]
- Frankel, W.L.; Zhang, W.; Singh, A.; Klurfeld, D.M.; Don, S.; Sakata, T.; Modlin, I.; Rombeau, J.L. Mediation of the trophic effects of short-chain fatty acids on the rat jejunum and colon. Gastroenterology 1994, 106, 375–380. [Google Scholar]
- Vitaglione, P.; Lumaga, R.B.; Stanzione, A.; Scalfi, L.; Fogliano, V. Beta-Glucan-enriched bread reduces energy intake and modifies plasma ghrelin and peptide YY concentrations in the short term. Appetite 2009, 53, 338–344. [Google Scholar] [CrossRef]
- Karhunen, L.J.; Juvonen, K.R.; Flander, S.M.; Liukkonen, K.H.; Lähteenmäki, L.; Siloaho, M.; Laaksonen, D.E.; Herzig, K.H.; Uusitupa, M.I.; Poutanen, K.S. A psyllium fiber-enriched meal strongly attenuates postprandial gastrointestinal peptide release in healthy young adults. J. Nutr. 2010, 140, 737–744. [Google Scholar] [CrossRef]
- Zijlstra, N.; Mars, M.; de Wijk, R.A.; Westerterp-Plantenga, M.S.; Holst, J.J.; de Graaf, C. Effect of viscosity on appetite and gastro-intestinal hormones. Physiol. Behav. 2009, 97, 68–75. [Google Scholar] [CrossRef]
- Cani, P.D.; Daubioul, C.A.; Reusens, B.; Remacle, C.; Catillon, G.; Delzenne, N.M. Involvement of endogenous glucagon-like peptide-1(7–36) amide on glycaemia-lowering effect of oligofructose in streptozotocin-treated rats. J. Endocrinol. 2005, 185, 457–465. [Google Scholar] [CrossRef]
- Zhou, J.; Martin, R.J.; Tulley, R.T.; Raggio, A.M.; McCutcheon, K.L.; Shen, L.; Danna, S.C.; Tripathy, S.; Hegsted, M.; Keenan, M.J. Dietary resistant starch upregulates total GLP-1 and PYY in a sustained day-long manner through fermentation in rodents. Am. J. Physiol. Endocrinol. Metabol. 2008, 295, E1160–E1166. [Google Scholar] [CrossRef]
- Massimino, S.P.; McBurney, M.I.; Field, C.J.; Thomson, A.B.; Keelan, M.; Hayek, M.G.; Sunvold, G.D. Fermentable dietary fiber increases GLP-1 secretion and improves glucose homeostasis despite increased intestinal glucose transport capacity in healthy dogs. J. Nutr. 1998, 128, 1786–1793. [Google Scholar]
- Bosch, G.; Verbrugghe, A.; Hesta, M.; Holst, J.J.; van der Poel, A.F.; Janssens, G.P.; Hendriks, W.H. The effects of dietary fibre type on satiety-related hormones and voluntary food intake in dogs. Br. J. Nutr. 2009, 102, 318–325. [Google Scholar] [CrossRef]
- Plaisancie, P.; Dumoulin, V.; Chayvialle, J.A.; Cuber, J.C. Luminal glucagon-like peptide-1(7–36) amide-releasing factors in the isolated vascularly perfused rat colon. J. Endocrinol. 1995, 145, 521–526. [Google Scholar] [CrossRef]
- Delmee, E.; Cani, P.D.; Gual, G.; Knauf, C.; Burcelin, R.; Maton, N.; Delzenne, N.M. Relation between colonic proglucagon expression and metabolic response to oligofructose in high fat diet-fed mice. Life Sci. 2006, 79, 1007–1013. [Google Scholar] [CrossRef]
- Brubaker, P.L. The glucagon-like peptides: Pleiotropic regulators of nutrient homeostasis. Ann. N. Y. Acad. Sci. 2006, 1070, 10–26. [Google Scholar] [CrossRef]
- Plaisancie, P.; Dumoulin, V.; Chayvialle, J.A.; Cuber, J.C. Luminal peptide YY-releasing factors in the isolated vascularly perfused rat colon. J. Endocrinol. 1996, 151, 421–429. [Google Scholar] [CrossRef]
- Velázquez, M.; Davies, C.; Marett, R.; Slavin, J.L.; Feirtag, J.M. Effect of oligosaccharides and fibre substitutes on short-chain fatty acid production by human faecal microflora. Anaerobe 2006, 6, 87–92. [Google Scholar]
- Demigne, C.; Jacobs, H.; Moundras, C.; Davicco, M.J.; Horcajada, M.N.; Bernalier, A.; Coxam, V. Comparison of native or reformulated chicory fructans, or non-purified chicory, on rat cecal fermentation and mineral metabolism. Eur. J. Nutr. 2008, 47, 366–374. [Google Scholar] [CrossRef]
- Polonsky, K.S.; Given, B.D.; Hirsch, L.; Shapiro, E.T.; Tillil, H.; Beebe, C.; Galloway, J.A.; Frank, B.H.; Karrison, T.; Van Cauter, E. Quantitative study of insulin secretion and clearance in normal and obese subjects. J. Clin. Invest. 1988, 81, 435–441. [Google Scholar] [CrossRef]
- Hu, F.B.; Chen, C.; Wang, B.; Stampfer, M.J.; Xu, X. Leptin concentrations in relation to overall adiposity, fat distribution, and blood pressure in a rural Chinese population. Int. J. Obes. Relat. Metab. Disord. 2001, 25, 121–125. [Google Scholar] [CrossRef]
- Williams, D.L.; Baskin, D.G.; Schwartz, M.W. Leptin regulation of the anorexic response to glucagon-like peptide-1 receptor stimulation. Diabetes 2006, 55, 3387–3393. [Google Scholar] [CrossRef]
- Adrian, T.E.; Ferri, G.L.; Bacarese-Hamilton, A.J.; Fuessl, H.S.; Polak, J.M.; Bloom, S.R. Human distribution and release of a putative new gut hormone, peptide YY. Gastroenterology 1985, 89, 1070–1077. [Google Scholar]
- Moran, T.H.; Smedh, U.; Kinzig, K.P.; Scott, K.A.; Knipp, S.; Ladenheim, E.E. Peptide YY(3–36) inhibits gastric emptying and produces acute reductions in food intake in rhesus monkeys. Am. J. Physiol. Regul. Integr. Comp. Physiol. 2005, 288, R384–R388. [Google Scholar]
- Kim, H.; Bartley, G.E.; Young, S.A.; Davis, P.A.; Yokoyama, W. HPMC supplementation reduces abdominal fat content, intestinal permeability, inflammation, and insulin resistance in diet-induced obese mice. Mol. Nutr. Food Res. 2012, 56, 1464–1476. [Google Scholar] [CrossRef]
- Brennan, C.S. Dietary fibre, glycaemic response, and diabetes. Mol. Nutr. Food Res. 2005, 49, 560–570. [Google Scholar] [CrossRef]
- Vanderweele, D.A.; Pi-Sunyer, F.X.; Novin, D.; Bush, M.J. Chronic Insulin Infusion Suppresses Food Ingestion and Body Weight Gain in Rats. Brain Res. Bull. 1980, 5, 7–11. [Google Scholar]
© 2013 by the authors; licensee MDPI, Basel, Switzerland. This article is an open access article distributed under the terms and conditions of the Creative Commons Attribution license (http://creativecommons.org/licenses/by/3.0/).
Share and Cite
Schroeder, N.; Marquart, L.F.; Gallaher, D.D. The Role of Viscosity and Fermentability of Dietary Fibers on Satiety- and Adiposity-Related Hormones in Rats. Nutrients 2013, 5, 2093-2113. https://doi.org/10.3390/nu5062093
Schroeder N, Marquart LF, Gallaher DD. The Role of Viscosity and Fermentability of Dietary Fibers on Satiety- and Adiposity-Related Hormones in Rats. Nutrients. 2013; 5(6):2093-2113. https://doi.org/10.3390/nu5062093
Chicago/Turabian StyleSchroeder, Natalia, Len F. Marquart, and Daniel D. Gallaher. 2013. "The Role of Viscosity and Fermentability of Dietary Fibers on Satiety- and Adiposity-Related Hormones in Rats" Nutrients 5, no. 6: 2093-2113. https://doi.org/10.3390/nu5062093