The Relationship between Lutein and Zeaxanthin Status and Body Fat

Abstract
:1. Introduction
2. Methods
2.1. Subjects
2.2. Assessment of LZ Status: Macular Pigment Optical Density & Serum LZ
2.3. Assessment of Body Composition
2.4. Statistical Analyses
3. Results

| Entire Sample (N = 100) | Males (N = 39) | Females (N = 61) | |
|---|---|---|---|
| Body Fat Percentage | |||
| Total Body | 25.79 ± 7.60 | 18.90 ± 4.89 | 30.19 ± 5.45 |
| Leg | 30.05 ± 8.98 | 20.72 ± 4.86 | 36.01 ± 5.03 |
| Trunk | 23.12 ± 7.95 | 17.81 ± 6.15 | 26.51 ± 7.09 |
| Arm | 26.15 ± 9.80 | 16.44 ± 4.47 | 32.35 ± 6.75 |
| Trunk Fat (Relative) a | 44.86 ± 6.35 | 47.52 ± 6.41 | 43.17 ± 5.76 |
| Body Mass (g) | |||
| Total Body | 65,346 ± 13,345 | 72,423 ± 12,516 | 60,790 ± 11,853 |
| Fat-Free Soft Tissue | 48,796 ± 10,413 | 58,980 ± 7291 | 42,284 ± 5891 |
| Total Body Fat | 17,062 ± 7090 | 13,847 ± 6062 | 19,132 ± 6972 |
| LZ Status | |||
| MPOD 15′ | 0.53 ± 0.21 | 0.55 ± 0.20 | 0.52 ± 0.22 |
| MPOD 30′ | 0.43 ± 0.18 | 0.45 ± 0.17 | 0.42 ± 0.19 |
| MPOD 60′ | 0.29 ± 0.14 | 0.29 ± 0.13 | 0.29 ± 0.14 |
| MPOD 105′ | 0.13 ± 0.09 | 0.14 ± 0.09 | 0.12 ± 0.09 |
| Serum LZ b | 0.26 ± 0.12 | 0.21 ± 0.07 | 0.28 ± 0.14 |
| Body Fat Percentage | |||||
|---|---|---|---|---|---|
| Total | Leg | Trunk | Arm | Trunk (Relative) a | |
| MPOD 15′ | −0.26 * | −0.18 | −0.28 ** | −0.25 * | −0.10 |
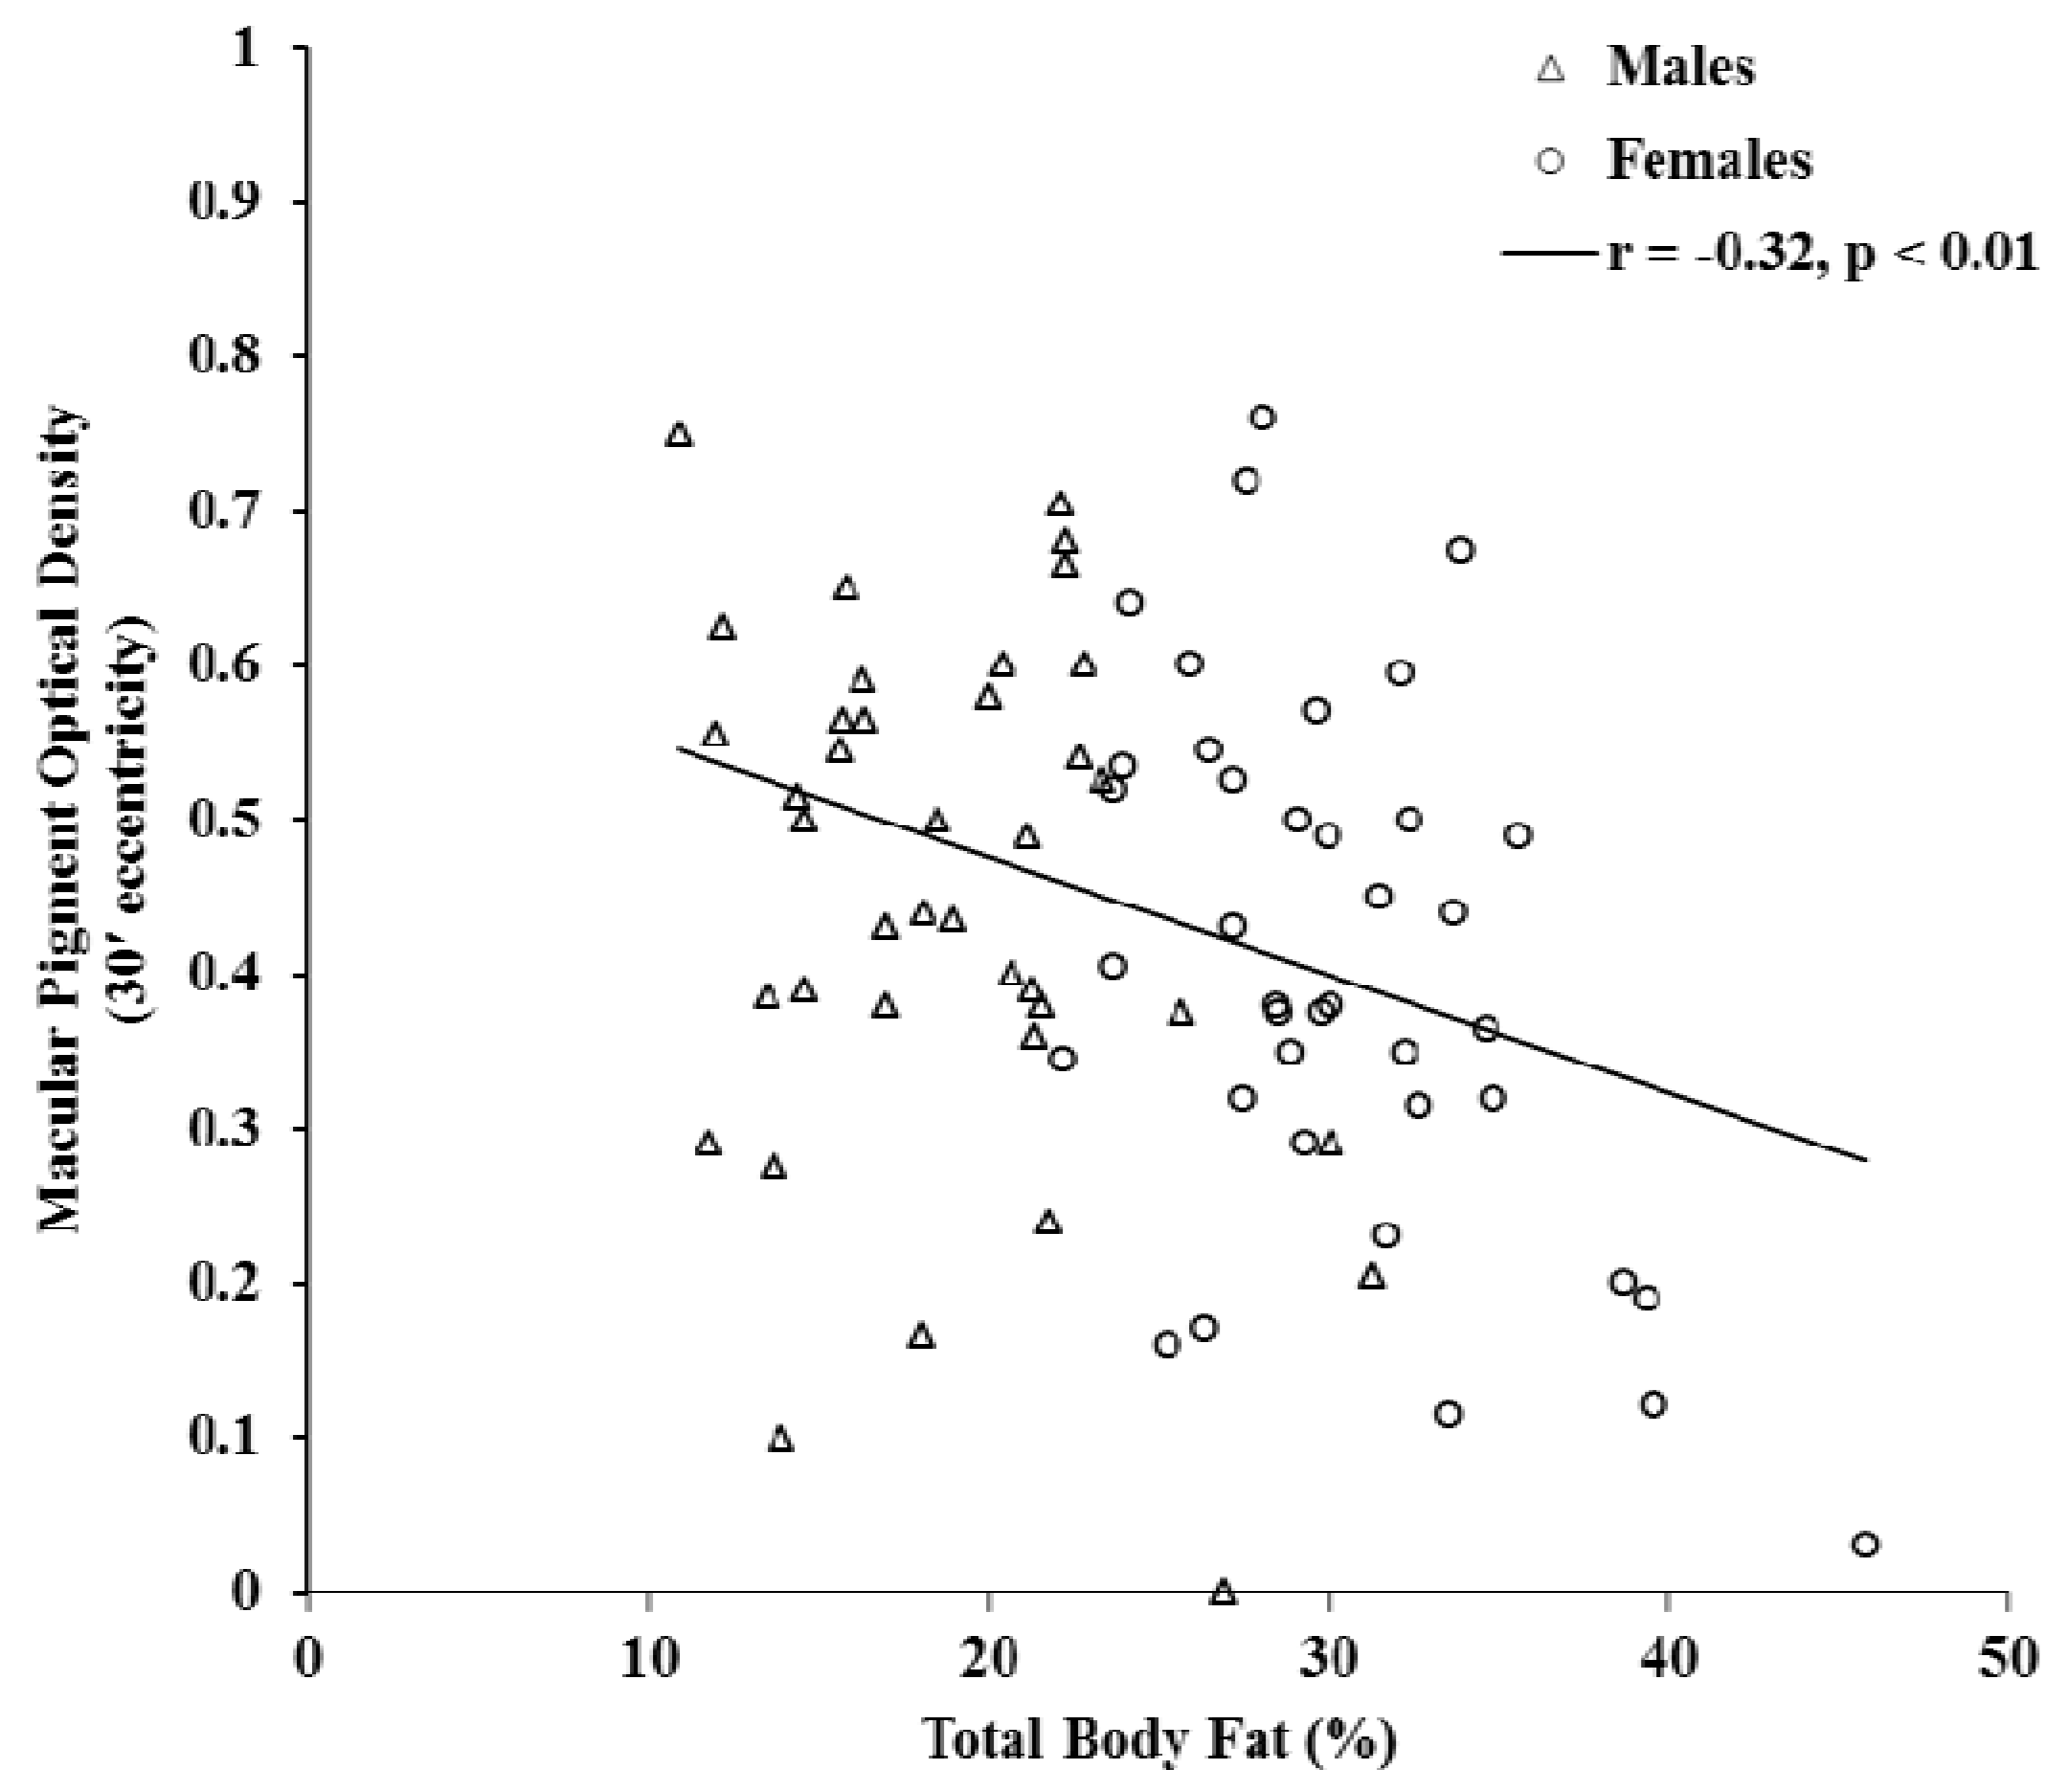
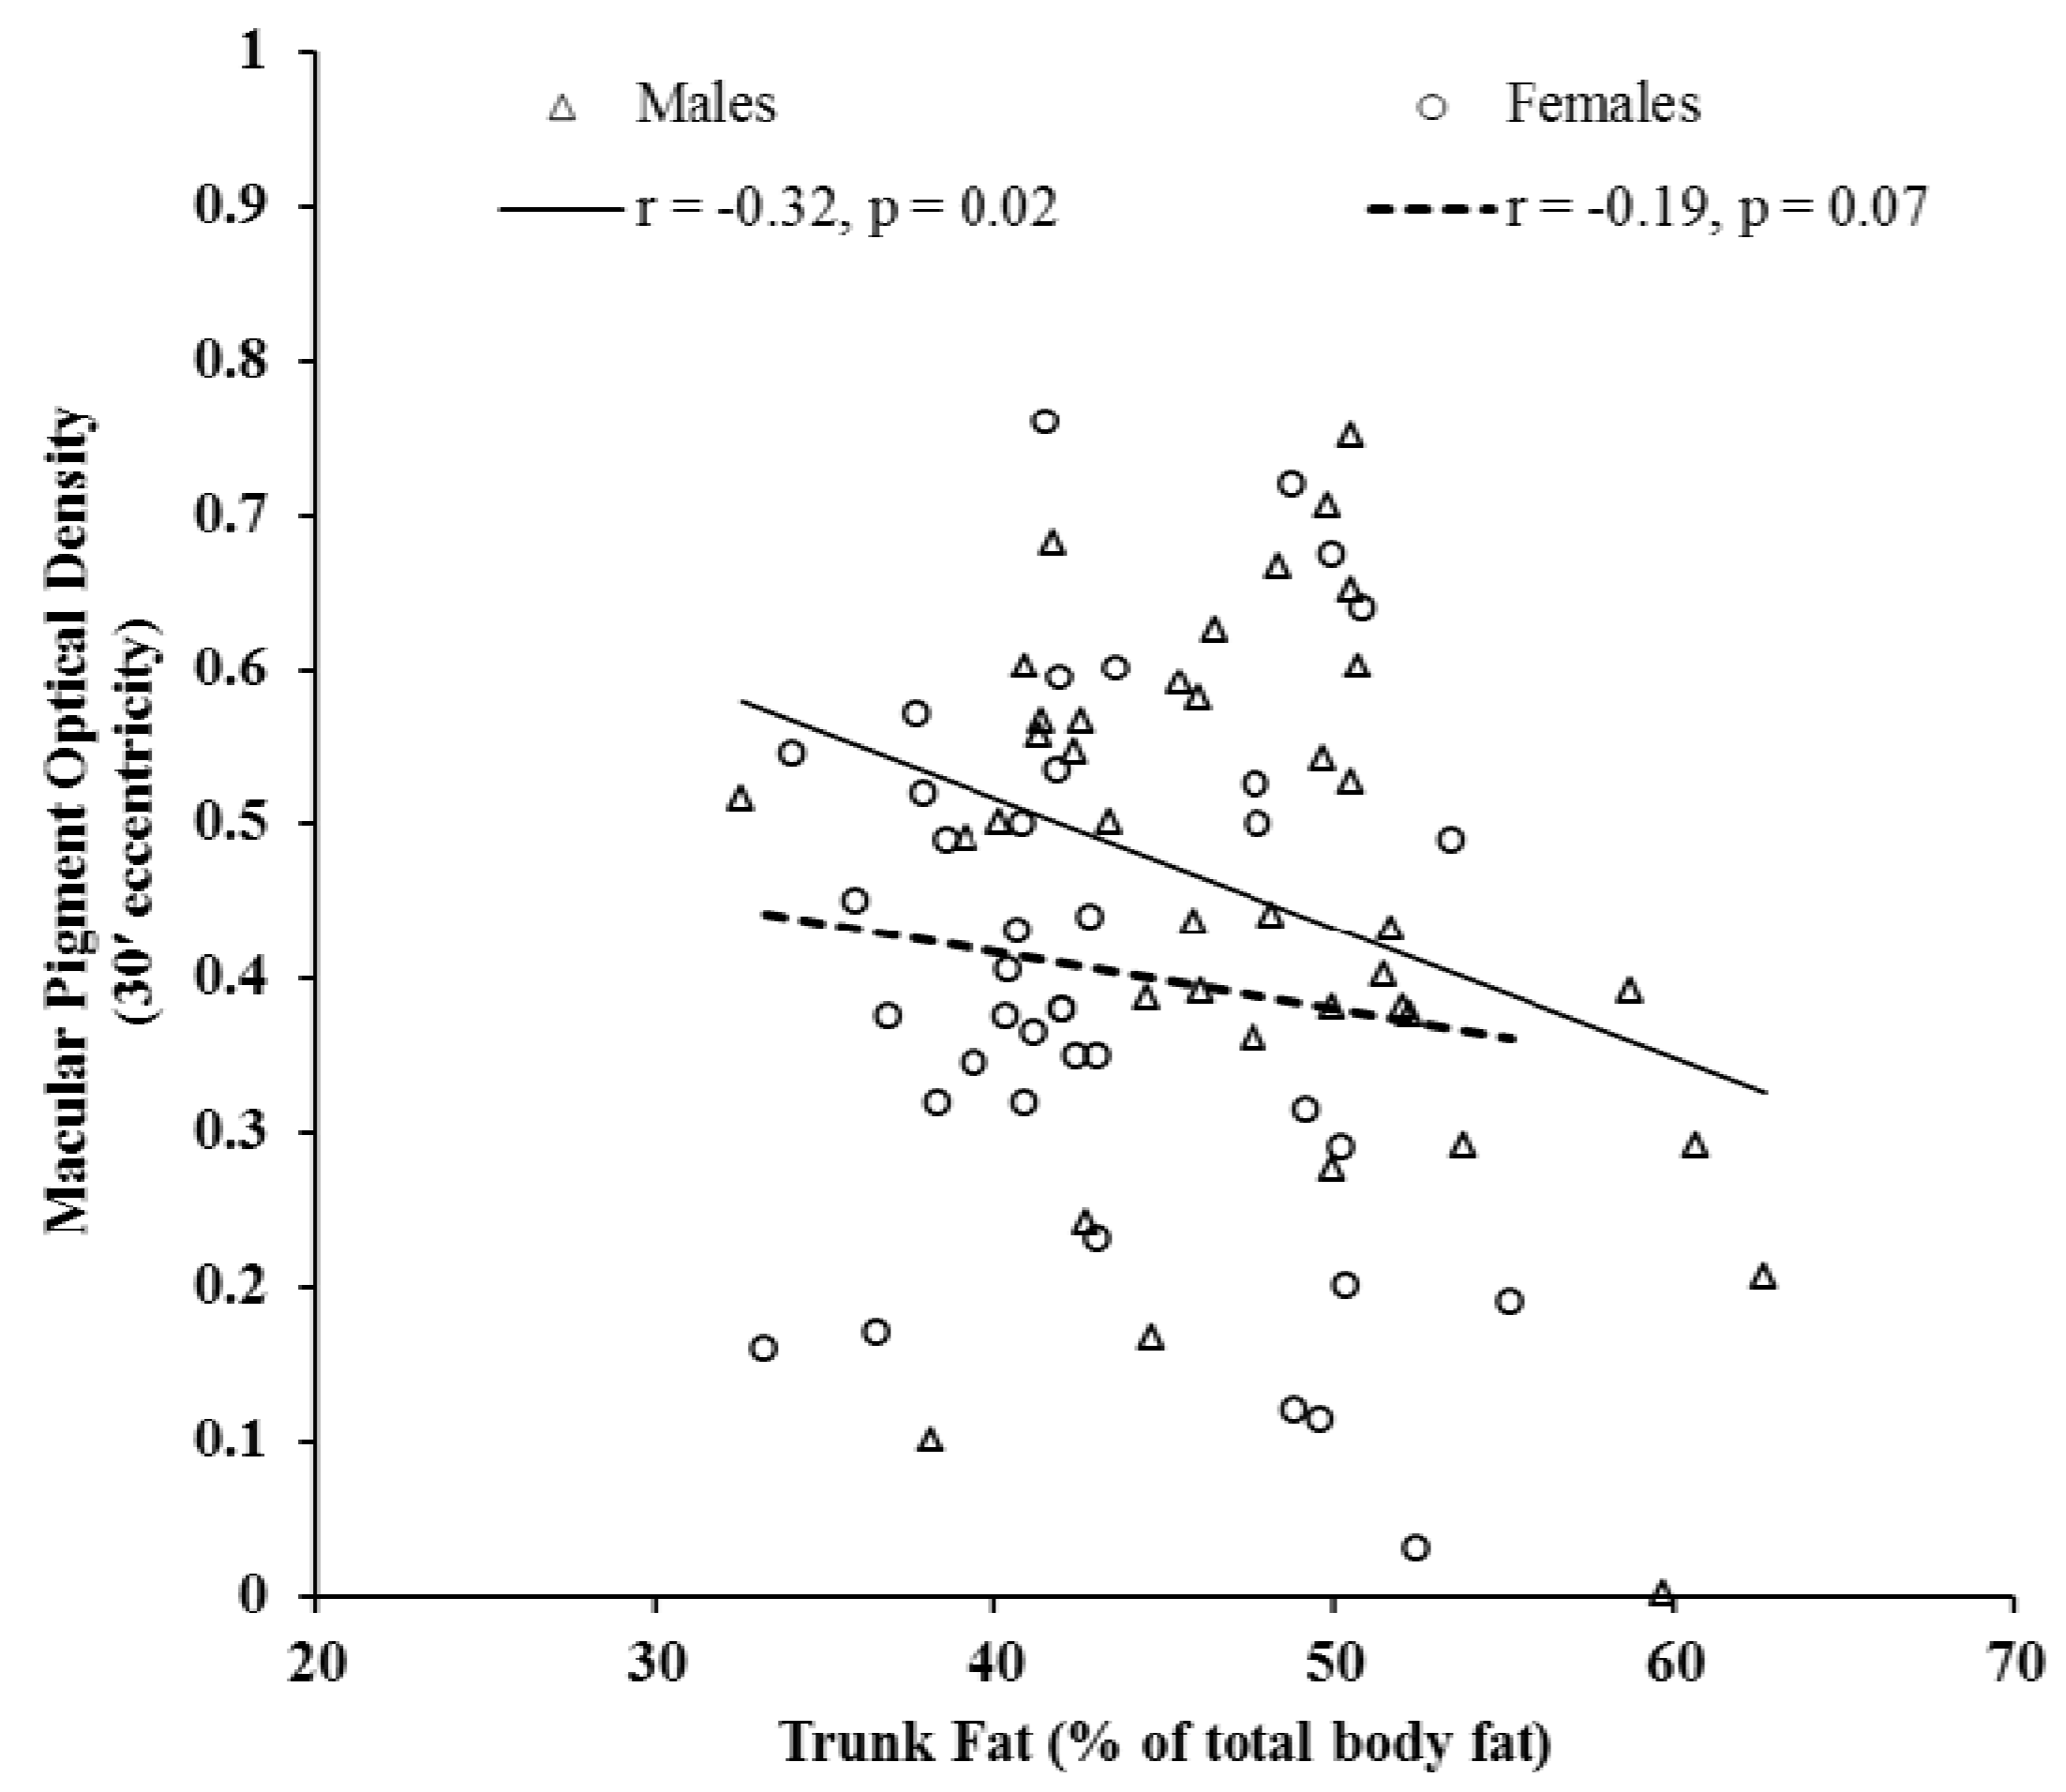
| MPOD 30′ | −0.32 ** | −0.22 * | −0.37 ** | −0.30 ** | −0.20 * |
| MPOD 60′ | −0.24 * | −0.14 | −0.31 ** | −0.21 * | −0.23 * |
| MPOD 105′ | −0.29 ** | −0.20 * | −0.32 ** | −0.28 ** | −0.16 |
| Serum LZ | 0.16 | 0.15 | 0.16 | 0.11 | −0.02 |


4. Discussion
Acknowledgments
Conflict of Interest
References
- Mares-Perlman, J.A.; Millen, A.E.; Ficek, T.L.; Hankinson, S.E. The body of evidence to support a protective role for lutein and zeaxanthin in delaying chronic disease. J. Nutr. 2002, 132, 518S–524S. [Google Scholar]
- Hammond, B.R.; Wooten, B.R.; Smollon, B. Assessment of the validity of in vivo methods ofmeasuring human macular pigment optical density. Optom. Vis. Sci. 2005, 82, 387–404. [Google Scholar] [CrossRef]
- Parker, R.S. Carotenoids in Human Blood and Tissues. J. Nutr. 1989, 119, 101–104. [Google Scholar]
- Kaplan, L.A.; Lau, J.M.; Stein, E.A. Carotenoid consumption, concentrations, and relationships in various humans organs. Clin. Physiol. Biochem. 1990, 8, 1–10. [Google Scholar]
- Johnson, E.J.; Hammond, B.R.; Yeum, K.; Qin, J.; Wang, X.D.; Castaneda, C.; Snodderly, D.M.; Russell, R.M. Relation among serum and tissue concentrations of lutein and zeaxanthin and macular pigment density. Am. J. Clin. Nutr. 2000, 71, 1555–1562. [Google Scholar]
- Hammond, B.R.; Curran-Celentano, J.; Judd, S.; Fuld, K.; Krinsky, N.I.; Wooten, B.R.; Snodderly, D.M. Sex differences in macular pigment optical density: Relation to plasma carotenoid concentrations and dietary patterns. Vis. Res. 1996, 36, 2001–2012. [Google Scholar] [CrossRef]
- Broekmans, W.; Berendschot, T.; Klopping-Ketelaars, I.; de Vries, A.J.; Goldbohm, R.A.; Tijburg, L.; Kardinaal, A.F.; van Poppel, G. Macular pigment density in relation to serum and adipose tissue concentrations of lutein and serum concentrations of zeaxanthin. Am. J. Clin. Nutr. 2002, 76, 595–603. [Google Scholar]
- Curran-Celentano, J.; Erdman, J.; Nelson, R.A.; Grater, S.J.E. Alterations in vitamin A, and thyroid hormone status in anorexia nervosa and associated disorders. Am. J. Clin. Nutr. 1985, 42, 1183–1191. [Google Scholar]
- Gruber, M.; Chappell, R.; Millen, A.; LaRowe, T.; Moeller, S.M.; Iannaccone, A. Correlates of serum lutein plus zeaxanthin: Findings from the third national health and nutrition examination survey. J. Nutr. 2004, 134, 2387–2394. [Google Scholar]
- Hammond, B.R.; Ciulla, T.A.; Snodderly, D.M. Macular pigment density is reduced in obese subjects. Invest. Ophthalmol. Vis. Sci. 2002, 43, 47–50. [Google Scholar]
- Chung, H.; Ferreira, A.L.A.; Epstein, S.; Paiva, S.A.R.; Casteneda-Sceppa, C.; Johnson, E.J. Site specific concentrations of carotenoids in adipose tissue: Relations with dietary and serum carotenoids concentrations in healthy adults. Am. J. Clin. Nutr. 2009, 90, 533–539. [Google Scholar] [CrossRef]
- Wooten, B.R.; Hammond, B.R.; Land, R.L.; Snodderly, D.M. A practical method for measuring macular pigment optical density. Invest. Ophthalmol. Vis. Sci. 1999, 40, 2481–2489. [Google Scholar]
- Stringham, J.M.; Hammond, B.R.; Nolan, J.M.; Wooten, B.R.; Mammend, A.; Smollen, W.; Snodderly, D.M. The utility of using customized heterochromatic flicker photometry (cHFP) tomeasure macular pigment in patients with age-related macular degeneration. Exp. Eye Res. 2008, 87, 445–453. [Google Scholar] [CrossRef]
- Mares, J.A.; LaRowe, D.; Snodderly, M.; Moeller, S.M.; Gruber, M.J.; Klein, M.L.; Wooten, B.R.; Johnson, E.J.; Chappell, R.J. CAREDS Macular Pigment Study Group and Investigators. Predictors of optical density of lutein and zeaxanthin in retinas of older women in the Carotenoids in Age-Related Eye Disease Study, an ancillary study of the Women’s Health Initiative. Am. J. Clin. Nutr. 2006, 84, 1107–1122. [Google Scholar]
- Kaiser, P.K. Sensation luminance: A new name to distinguish CIE luminance from luminance dependent on an individual’s spectral sensitivity. Vis. Res. 1988, 28, 455–456. [Google Scholar] [CrossRef]
- Nolan, J.; O’Donovan, O.; Kavanagh, H.; Stack, J.; Harrison, M.; Muldoon, A.; Mellerio, J.; Beatty, S. Macular pigment and percentage of body fat. Invest. Ophthalmol. Vis. Sci. 2004, 45, 3940–3950. [Google Scholar] [CrossRef]
- Dietary Supplement Barometer Survey, The Natural Marketing Institute, 2005. Available online: http://www.naturalhealthvillage.com/newsletter/15oct05/264-DSEA_Supplement_Barometer_Survey_Executive%201%20.pdf (accessed on 28 June 2011).
- Hammond, B.R.; Johnson, E.J.; Russell, R.M.; Krinsky, N.I.; Yeum, K.J.; Edwards, R.B.; Snodderly, D.M. Dietary modification of human macular pigment density. Invest. Ophthalmol. Vis. Sci. 1997, 38, 1795–1801. [Google Scholar]
- Johnson, E.J. Obesity, lutein metabolism, and age-related macular degeneration: A web of connections. Nutr. Rev. 2005, 63, 9–15. [Google Scholar] [CrossRef]
- Seddon, J.M.; Cote, J.; Davis, N.; Rosner, B. Progression of age-related macular degeneration: Association with body mass index, waist circumference, and waist-hip ratio. Arch. Ophthalmol. 2003, 121, 785–792. [Google Scholar] [CrossRef]
© 2013 by the authors; licensee MDPI, Basel, Switzerland. This article is an open-access article distributed under the terms and conditions of the Creative Commons Attribution license (http://creativecommons.org/licenses/by/3.0/).
Share and Cite
Bovier, E.R.; Lewis, R.D.; Hammond, B.R., Jr. The Relationship between Lutein and Zeaxanthin Status and Body Fat. Nutrients 2013, 5, 750-757. https://doi.org/10.3390/nu5030750
Bovier ER, Lewis RD, Hammond BR Jr. The Relationship between Lutein and Zeaxanthin Status and Body Fat. Nutrients. 2013; 5(3):750-757. https://doi.org/10.3390/nu5030750
Chicago/Turabian StyleBovier, Emily R., Richard D. Lewis, and Billy R. Hammond, Jr. 2013. "The Relationship between Lutein and Zeaxanthin Status and Body Fat" Nutrients 5, no. 3: 750-757. https://doi.org/10.3390/nu5030750
APA StyleBovier, E. R., Lewis, R. D., & Hammond, B. R., Jr. (2013). The Relationship between Lutein and Zeaxanthin Status and Body Fat. Nutrients, 5(3), 750-757. https://doi.org/10.3390/nu5030750