The whole data set of 224 bucket-reduced
1H NMR spectra (columns) for 37 EVOO samples (rows: 25 reference samples and 12 blends commercially available as Italian products in the U.S.), was analyzed by PCA. A clear discrimination between samples of different cultivars and geographical origin was revealed. Since the cultivars of the examined blends were unknown, discussion related to the blend olive oils has been limited only to metabolites composition. The olive oil samples were distributed in the PC1/PC2 scatterplot according to their intrinsic features and to their major/minor affinity in comparison with the reference samples included in this case study. The first four principal components (PC1–PC4) explained 92.43% of the total variance. The principal components PC1 and PC2, shown in the
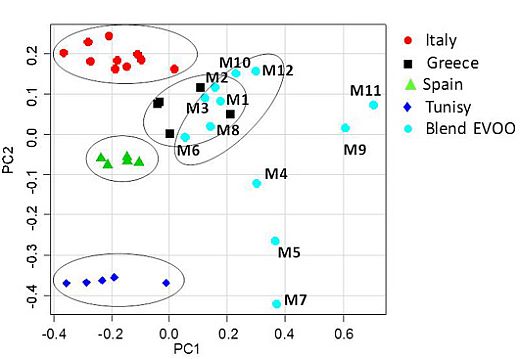
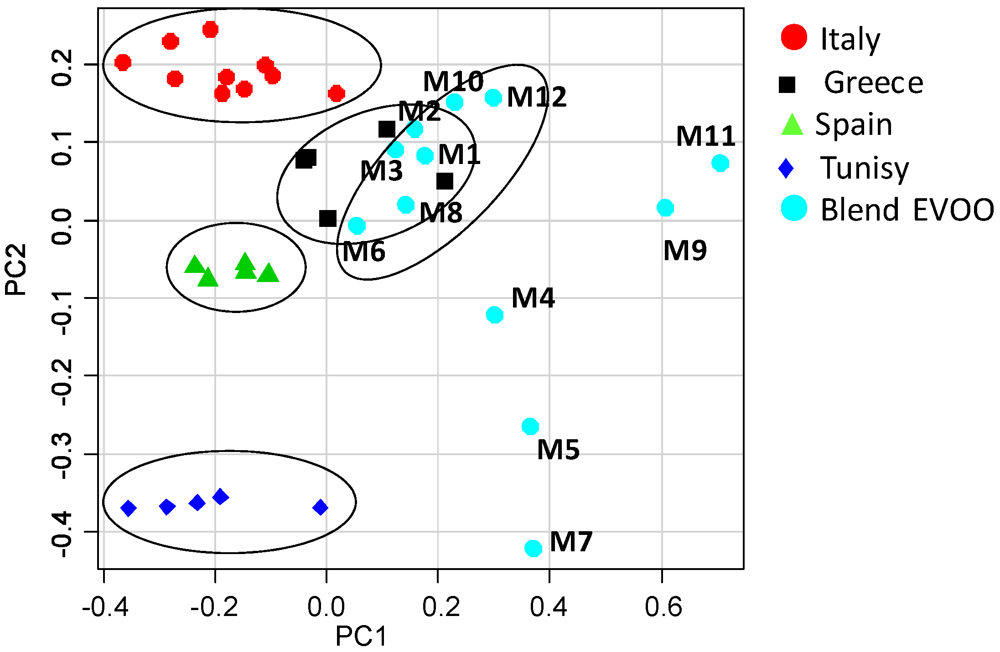
Figure 2 scatterplot, explained 78.35% of the total variance (PC1 49.09%, PC2 29.26%) while PC3 (8.41%) and PC4 (5.67%) accounted for the residual variance. The PC1/PC2 scatterplot showed that distinct clusters were formed for the studied samples (
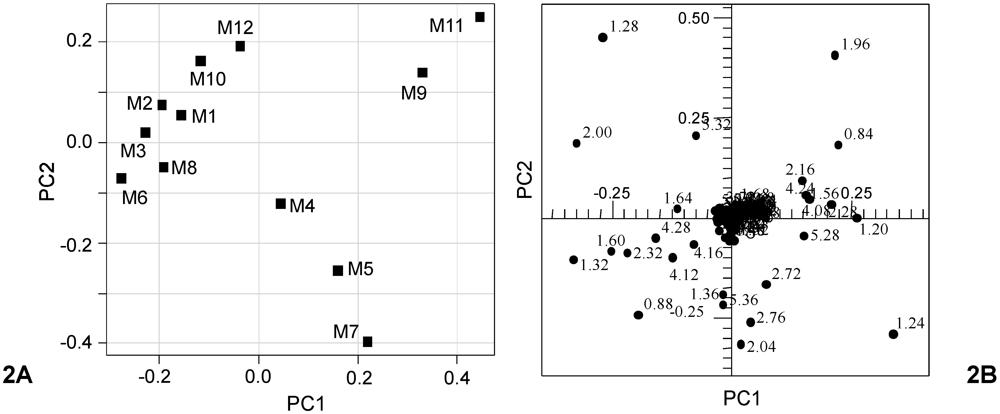
Figure 3). A separation between the mono cultivar reference olive oils and the U.S. commercially available blends was observed. In particular, the PC1 axis separated blends, in the range between 0.05 and 0.70, from the reference samples, in the range between −0.45 and 0.05, with the exception of the Greek references, which were in the PC1 range between −0.05 and 0. 20. Italian olive oils were nearly all included in the range between 0.05 and −0.40 for PC1; Spanish samples between −0.30 and −0.10 for PC1, and Tunisian samples between −0.40 and 0.00 for PC1. Moreover, from the PC2 comparative analysis a good affinity of most of the blend samples was found with the European olive oils (Spain, Greece and Italy). The PC2 highlighted differences among the reference samples since the samples were well distributed along the PC2 axis (Tunisians between −0.35 and −0.40, Spanish −0.50 and −0.10, Greek 0.00 and 0.15 and Italian olive oils 0.15 and 0.25). Two subgroups were observed for the commercial blends along the PC2 axis, the largest of them (9 samples) shared the same European PC2 range (between −0.05 and 0.20) while the second group (3 samples) fell at a PC2 range closer to the Tunisian references (between −0.10 and −0.45). It should be noted that 7 out of 9 blend samples were much closer to the European reference oils also on the PC1 (range between 0.00 and 0.40) and nearly merged with the Greek reference samples (
Table 6).
Figure 3.
Scatterplot of the first two PC for the whole olive oil dataset. PC1 and the PC2 explain 49.09% and 29.26% (together 78.35%) of the total variance, respectively.
In summary, the examined commercial blends could be divided into three groups: the first (7 samples) shared similar PC1 and PC2 ranges with European references (in particular Greek EVOO); the second (2 samples) displayed the same PC2 values of European samples but higher PC1 values; the third (3 samples) showed the same PC1 values as the second but PC2 values more similar to those of the Tunisian samples (especially for M5 and M7). Therefore, the higher similarity of the studied blend oils was detectable for European reference samples, in particular from Greece, Italy and Spain. It is interesting to note that the Greek reference samples were found just inside the bidimensional space (PC1, PC2) comprising the group of 7 out of 12 examined oils. Comparison of
Figure 3 with
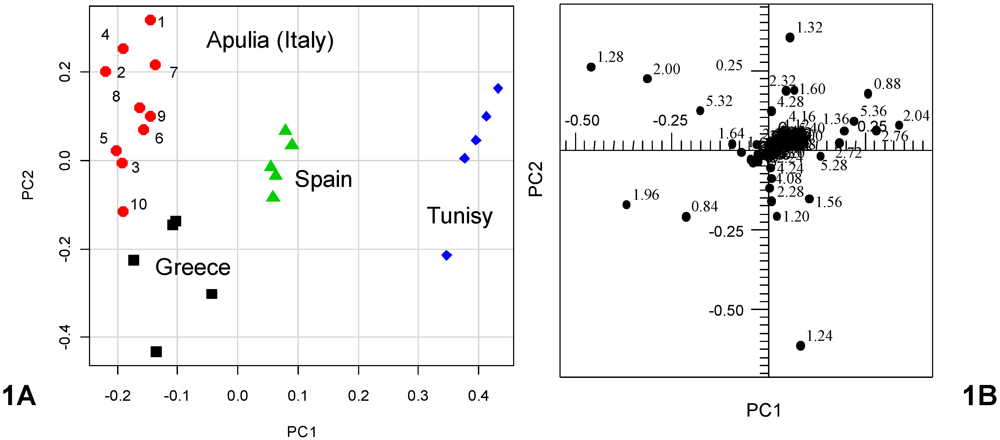
Figure 1A shows that the introduction of the blend samples in the data set resulted in a distribution of the reference groups where the PC1 and PC2 have been interchanged. This may be due to the presence in the blend samples of considerable amounts of the same metabolites that differentiated Italian from Greek olive oils in
Figure 1. Indeed PC1 differentiation of samples in the scatterplot of
Figure 2A is due to loadings related to signals which contribute to PC2 in the scoreplot of
Figure 1A. Examination of the loadings suggests that the separation of the nine blend samples having PC2 > −0.1 (M1, M2, M3, M6, M8, M9, M10, M11 and M12), which include the seven very close to the European also in terms of PC1 (M1, M2, M3, M6, M8, M10 and M12) was achieved due to spectral domains belonging to the resonances of acyl groups of oleic, linoleic and linolenic chains (δ = 1.28, 1.96, 2.00, 5.32 ppm). On the contrary, the group of the residual three samples (M4, M5, M7), although with higher PC1 values, were closer to the Tunisian samples due to higher saturated (δ = 1.24 ppm) fatty acids (M7 > M5 > M4) [
12]. Separation of samples on PC1 in the plot of
Figure 3 can be ascribed to the decrease of linoleic acid and increase of linolenic, which can be observed on going from Italian to Greek samples as well as from the seven (M1, M2, M3, M6, M8, M10 and M12) to the two (M9 and M11) blend samples with an intermediate position for the three high saturated blend samples (M4, M5 and M7). In general, blend olive oils are characterized by a higher amount of polyunsaturated fatty acids and a lower amount of saturated fatty acids than single cultivars samples. These results agree with previous findings suggesting that commercial olive oils could be distinguished according to their geographical origin depending on their major components (triglycerides).
The triglyceride composition was found to be particularly useful in discriminating the oil samples. In comparing the studied varieties, small but significant differences among the samples were shown; indicating a slight varietal effect on fatty acid composition. Furthermore, as the fatty acid composition is an important quality parameter and authenticity indicator of EVOO, these results are in agreement with other studies in which nutritional properties of EVOO have been described [
22]. The high content of monounsaturated, low saturated and linoleic fatty acids, which characterize in particular some of the studied samples, the European EVOO and, among them, the Italian EVOO, is of great importance because of their high nutritional value and positive effect on the oxidative stability of oils [
23].


