Protein Analysis-on-Chip Systems in Foodomics

 ,
,  , ,
, , 
Abstract
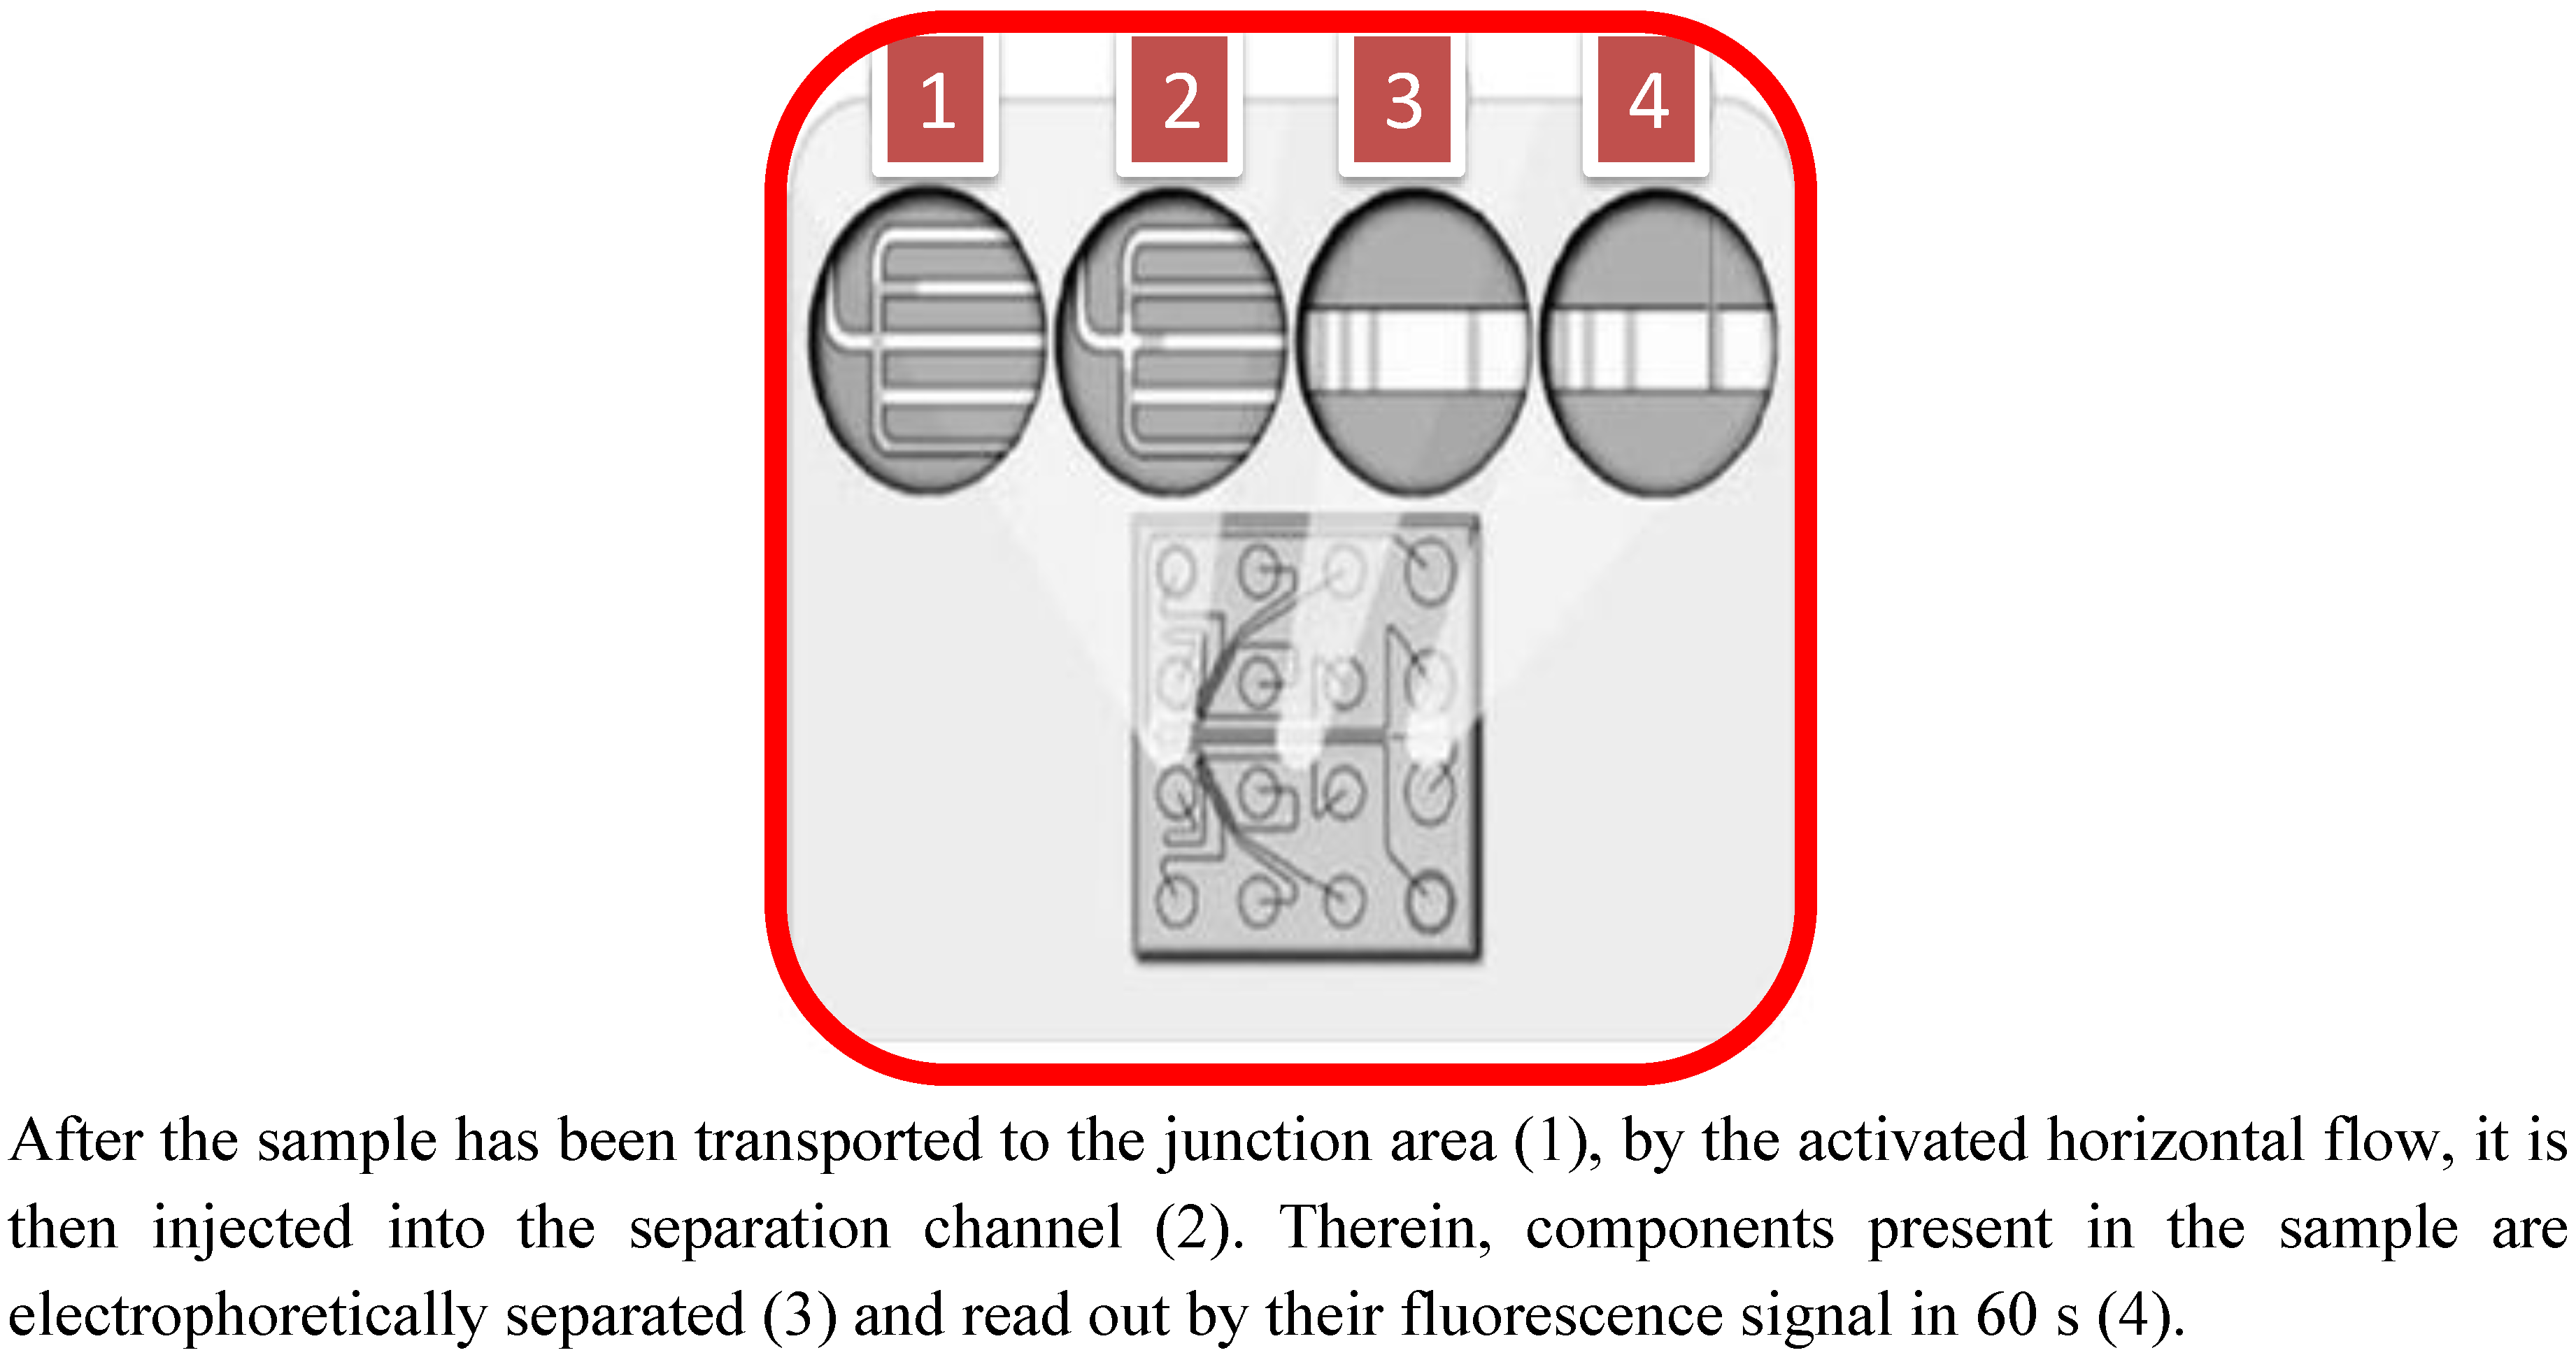
:1. Protein Analysis and Lab-on-Chip Method


| Factors considered | PAGE | RP-HPLC | Conventional CE | Microfluidic CE |
|---|---|---|---|---|
| Time for setting gel or regenerating column | 60 min | 10 min | 2–3 min | 2–3 min |
| Sample extraction | depending on source | depending on source | depending on source | depending on source |
| Run time | from 30 to 240 min | from 10 to 90 min | 10 min | 1–3 min |
| Visualization of proteins | from 2 h to overnight | instant | instant | instant |
| Health risks for operator | moderate | low | low–medium | low |
| Cost of equipment | low | high | high | medium |
| Cost of consumables | low | medium | medium | low–medium |

2. Proteomics-on-a-Chip: Promising Development in Food Science?


3. Conclusion
References
- Atalay, Y.T.; Vermeir, S.; Witters, D.; Vergauwe, N.; Verbruggen, B.; Verboven, P.; Nicolai, B.M.; Lammertyn, J. Microfluidic analytical systems for food analysis. Trends Food Sci. Technol. 2011, 22, 386–404. [Google Scholar] [CrossRef]
- Schemberg, J.; Grodrian, A.; Romer, R.; Gastrock, G.; Lemke, K. Application of segmented flow for quality control of food using microfluidic tools. Physica Status Solidi A 2010, 4, 904–912. [Google Scholar]
- Zhu, Z.; Lu, J.J.; Liu, J.L. Protein separation by capillary gel electrophoresis: A review. Anal. Chim. Acta 2012, 709, 21–31. [Google Scholar] [CrossRef]
- Reyes, D.R.; Iossifidis, D.; Auroux, P.A.; Manz, A. Micro Total Analysis Systems. 1. Introduction, Theory, and Technology. Anal. Chem. 2002, 74, 2623–2636. [Google Scholar] [CrossRef]
- Auroux, P.A.; Iossifidis, D.; Reyes, D.R.; Manz, A. Micro Total Analysis Systems. 2. Analytical Standard Operations and Applications. Anal. Chem. 2002, 74, 2637–2652. [Google Scholar] [CrossRef]
- Yao, S.; Anex, D.S.; Caldwell, W.B.; Arnold, D.W.; Smith, K.B.; Schultz, P.G. SDS capillary gel electrophoresis of proteins in microfabricated channels. Proc. Natl. Acad. Sci. USA 1999, 96, 5372–5377. [Google Scholar] [CrossRef]
- Bousse, L.; Mouradian, S.; Minalla, A.; Yee, H.; Williams, K.; Dubrow, R. Protein sizing on a microchip. Anal. Chem. 2001, 73, 1207–1212. [Google Scholar] [CrossRef]
- Han, J.; Singh, A.K. Rapid protein separations in ultra-short microchannels: Microchip sodium dodecyl sulfate-polyacrylamide gel electrophoresis and isoelectric focusing. J. Chromatogr. A 2004, 1049, 205–209. [Google Scholar]
- Herr, A.E.; Singh, A.K. Photopolymerized Cross-Linked Polyacrylamide Gels for On-Chip Protein Sizing. Anal. Chem. 2004, 76, 4727–4733. [Google Scholar] [CrossRef]
- Lo, C.T.; Throckmorton, D.J.; Singh, A.K.; Herr, A.E. Photopolymerized diffusion-defined polyacrylamide gradient gels for on-chip protein sizing. Lab Chip 2008, 8, 1273–1279. [Google Scholar] [CrossRef]
- Tsai, S.W.; Loughran, M.; Suzuki, H.; Karube, I. Native and sodium dodecyl sulfate-capillary gel electrophoresis of proteins on a single microchip. Electrophoresis 2004, 25, 494–501. [Google Scholar] [CrossRef]
- He, M.; Herr, A.E. Automated microfluidic protein immunoblotting. Nat. Protoc. 2010, 5, 1844–1856. [Google Scholar] [CrossRef]
- Tia, S.Q.; He, M.; Kim, D.; Herr, A.E. Multianalyte on-chip native western blotting. Anal. Chem. 2011, 83, 3581–3588. [Google Scholar] [CrossRef]
- Dittrich, P.S.; Tachikawa, K.; Manz, A. Microfluidics: Applications for analytical purposes in chemistry and biochemistry. Anal. Chem. 2006, 78, 3887–3907. [Google Scholar] [CrossRef]
- Mijatovic, D.; Eijkel, J.C.T.; van den Berg, A. Technologies for nanofluidic systems: Top-down vs. bottom-up—a review. Lab Chip 2005, 5, 492–500. [Google Scholar] [CrossRef]
- Liu, B.F.; Xu, B.; Zhang, G.; Du, W.; Luo, Q. Micro-separation toward systems biology. J. Chromatogr. A 2006, 1106, 19–28. [Google Scholar]
- Peng, Y.; Pallandre, A.; Tran, N.T.; Taverna, M. Recent innovations in protein separation on microchips by electrophoretic methods. Electrophoresis 2008, 29, 157–178. [Google Scholar] [CrossRef]
- Kaisoon, O.; Siriamornpun, S.; Meeso, N. Distinction between Cereal Genotypes Based on the Protein and DNA Composition of the Grain by Capillary Electrophoresis. World Appl. Sci. J. 2008, 4, 384–395. [Google Scholar]
- Lookhart, G.L.; Bean, S. Rapid differentiation of oat cultivars and of rice cultivars by capillary electrophoresis. Cereal Chem. 1995, 72, 312–316. [Google Scholar]
- García-Cañas, V.; Cifuentes, A. Recent advances in the application of capillary electromigration methods for food analysis. Electrophoresis 2008, 29, 294–309. [Google Scholar]
- Renzi, R.F.; Stamps, J.; Horn, B.A.; Ferko, S.; van der Noot, V.A.; Jay, A.A.; West, J.A.A.; Crocker, R.; Wiedenman, B.; Yee, D.; Fruetel, J.A. Hand-held microanalytical instrument for chip-based electrophoretic separations of proteins. Anal. Chem. 2005, 77, 435–441. [Google Scholar] [CrossRef]
- Clement, P.; Agboola, S.O.; Bencini, R. A study of polymorphism in milk proteins from local and imported dairy sheep in Australia by capillary electrophoresis. Food Sci. Technol. 2006, 39, 63–69. [Google Scholar]
- Miralles, B.; Ramos, M.; Amigo, L. Characterization of fresh cheeses by capillary electrophoresis. Milchwissenschaft 2005, 60, 278–282. [Google Scholar]
- Agboola, S.; Ng, D.; Mills, D. Characterisation and functional properties of Australian rice protein isolates. J. Cereal Sci. 2005, 41, 283–290. [Google Scholar] [CrossRef]
- Van Eckert, R.; Berghofer, E.; Ciclitira, P.; Chirdo, F.; Denery-Papinig, S.; Ellis, H.J.; Ferranti, P.; Goodwin, P.; Immer, U.; Mamone, G.; et al. Towards a new gliadin reference material-isolation and characterization. J. Cereal Sci. 2006, 43, 331–341. [Google Scholar] [CrossRef]
- Piergiovanni, A.R.; Taranto, G. Simple and rapid method for the differentiation of Lens culinaris Medik. from false lentil species. J. Agric. Food Chem. 2005, 53, 6593–6597. [Google Scholar] [CrossRef]
- Uthayakumaran, S.; Batey, I.L.; Wrigley, C.W. On-the-spot identification of grain variety and wheat-quality type by Lab-on-a-chip capillary electrophoresis. J. Cereal Sci. 2005, 41, 371–374. [Google Scholar] [CrossRef]
- Uthayakumaran, S.; Listiohadi, Y.; Baratta, M.; Batey, I.L.; Wrigley, C.W. Rapid identification and quantitation of high-molecular-weight glutenin subunits. J. Cereal Sci. 2006, 44, 34–39. [Google Scholar] [CrossRef]
- Bhandari, D.G.; Church, S.; Borthwick, A.; Jensen, M.A. Automated Varietal Identification Using Lab-on-a-Chip Technology. In Proceedings of the 12th International ICC Cereal and Bread Congress; Woodhead Publishing: Cambridge, UK, 2004. [Google Scholar]
- Wrigley, C.W.; Batey, I.L.; Uthayakumaran, S.; Rathmell, W.G. Modern approaches to food diagnostics for grain quality assurance. Food Aust. 2006, 58, 538–542. [Google Scholar]
- Schulze, P.; Ludwig, M.; Kholer, F.; Belder, D. Deep UV laser-induced fluorescence detection of unlabeled drugs and proteins in microchip electrophoresis. Anal. Chem. 2005, 77, 1325–1329. [Google Scholar] [CrossRef]
- Buffoni, J.N.; Bonizzi, I.; Pauciullo, A.; Ramunno, L.; Feligini, M. Characterization of the major whey proteins from milk of Mediterranean water buffalo (Bubalus bubalis). Food Chem. 2011, 127, 1515–1520. [Google Scholar] [CrossRef]
- Goetz, H.; Kuschel, M.; Wulff, T.; Sauber, C.; Miller, C.; Fisher, S.; Woodward, C. Comparison of selected analytical techniques for protein sizing, quantification and molecular weight determination. J. Biochem. Biophys. Methods 2004, 60, 281–293. [Google Scholar] [CrossRef]
- Butikofer, U.; Meyer, J.; Rehberger, B. Determination of the percentage of α-lactalbumin and β-lactoglobulin of total milk protein in raw and heat treated skim milk. Milchwissenschaft 2006, 61, 263–266. [Google Scholar]
- Anema, S. The use of “lab-on-a-chip” microfluidic SDS electrophoresis technology for the separation and quantification of milk proteins. Int. Dairy J. 2009, 19, 198–204. [Google Scholar] [CrossRef]
- Nazzaro, F.; Fratianni, F.; Sada, A.; Coppola, R. Microfluidic Lab-on-a-Chip Methodology as Alternative Method to Study Milk Proteins. In Proceedings of the Conference MICheese, Avellino, Italy, 3–5 September 2009.
- Fratianni, F.; Sada, A.; Orlando, P.; Nazzaro, F. Micro-Electrophoretic Study of the Sarcoplasmic Fraction in the Dry-Cured Goat Raw Ham. Open Food Sci. J. 2008, 2, 89–94. [Google Scholar] [CrossRef]
- Nazzaro, F.; Sada, A.; Scognamiglio, F.; Fratianni, F. Monitoraggio Della Frazione Proteica Sarcoplasmatica in Salami Tipo Napoli Prodotti con Estratti Vegetali Come Additivi Naturali. In Proceedings of the Conference “Qualicibi, Cibi di Ieri e di Domani: Qualità e Sicurezza tra Tradizione e Innovazione”, Positano, Italy, 22–25 June 2008.
- Lonigro, S.L.; Valerio, F.; de Angelis, F.; de Bellis, P.; Lavermicocca, P. Microfluidic technology applied to cell-wall protein analysis of olive related lactic acid bacteria. Int. J. Food Microbiol. 2009, 130, 6–11. [Google Scholar] [CrossRef]
- Gehring, A.G.; Patterson, D.L.; Tu, S.I. Use of a light-addressable potentiometric sensor for the detection of Escherichia coli O157:H7. Anal. Biochem. 1998, 258, 293–298. [Google Scholar]
- Boehm, D.A.; Gottlieb, P.A.; Hua, S.Z. On-chip microfluidic biosensor for bacterial detection and identification. Sens. Actuators B Chem. 2007, 126, 508–514. [Google Scholar] [CrossRef]
- Mairhofer, J.; Roppert, K.; Ertl, P. Microfluidic systems for pathogen sensing: A review. Sensors 2009, 9, 4804–4823. [Google Scholar] [CrossRef]
- Pandey, A.; Mann, M. Proteomics to study genes and genomes. Nature 2000, 405, 837–846. [Google Scholar] [CrossRef]
- Liu, W.T.; Zhu, L. Environmental microbiology-on-a-chip and its future impacts. Trends Biotechnol. 2005, 23, 174–179. [Google Scholar] [CrossRef]
- Picariello, G.; de Martino, A.; Mamone, G.; Ferranti, P.; Addeo, F.; Faccia, M.; Spagna Musso, S.; Di Luccia, A. Proteomic study of muscle sarcoplasmic proteins using AUT-PAGE/SDS-PAGE as two-dimensional gel electrophoresis. J. Chromatogr. B Analyt. Technol. Biomed. Life Sci. 2006, 833, 101–108. [Google Scholar] [CrossRef]
- Marangon, M.; van Sluyter, S.C.; Haynes, P.A.; Waters, E.J. Grape and wine proteins: Their fractionation by hydrophobic interaction chromatography and identification by chromatographic and proteomic analysis. J. Agric. Food Chem. 2009, 57, 11376–11382. [Google Scholar] [CrossRef]
- Skylas, D.J.; van Dyk, D.; Wrigley, C.W. Proteomics of wheat grain. J. Cereal Sci. 2005, 41, 165–179. [Google Scholar] [CrossRef]
- Mazzeo, M.F.; de Giulio, B.; Guerriero, G.; Ciarcia, G.; Malorni, A.; Russo, G.L.; Siciliano, R.A. Fish authentication by MALDI-TOF Mass Spectrometry. J. Agric. Food Chem. 2008, 56, 11071–11076. [Google Scholar]
- Dilley, D.R.; Kuai, J.P.; Poneleti, L.; Zhu, Y.; Pekker, Y. Molecular biology of pome fruit ripening and senescence: Concepts, statues, perspectives and future prospects. Acta Hortic. 1993, 326, 325–334. [Google Scholar]
- Dominguez-Puigjaner, E.; Vendrell, M.; Ludevid, M.D. Differential protein accumulation in banana fruit during ripening. Plant Physiol. 1992, 98, 157–162. [Google Scholar] [CrossRef]
- Saravanan, S.R.; Rose, J.K.C. A critical evaluation of sample extraction techniques for enhanced proteomic analysis of recalcitrant plant tissues. Proteomics 2004, 4, 2522–2532. [Google Scholar] [CrossRef]
- Casado-Vela, J.; Sellés, S.; Martínez, R.B. Proteomic approach to blossom-end rot in tomato fruits (Lycopersicon esculentum M.): Antioxidant enzymes and the pentose phosphate pathway. Proteomics 2005, 5, 2488–2496. [Google Scholar] [CrossRef]
- Van der Werf, M. Towards replacing closed with open target selection strategies. Trends Biotechnol. 2005, 23, 11–16. [Google Scholar] [CrossRef]
- Roberts, J.K.M. Proteomics and a future generation of plant molecular biologists. Plant Mol. Biol. 2005, 48, 143–154. [Google Scholar] [CrossRef]
- O’Farrel, P.H. High resolution two-dimensional electrophoresis of proteins. J. Biol. Chem. 1975, 250, 4007–4021. [Google Scholar]
- Gorg, A.; Weiss, W.; Dunn, M.J. Current two-dimensional electrophoresis technology for proteomics. Proteomics 2004, 4, 3665–3685. [Google Scholar] [CrossRef]
- Chen, X.X.; Wu, H.K.; Mao, C.D.; Whitesides, G.M. A prototype two-dimensional capillary electrophoresis system fabricated in poly(dimethylsiloxane). Anal. Chem. 2002, 74, 1772–1778. [Google Scholar] [CrossRef]
- Peptides, Structure and Biological Function: Proceedings of the Sixth American Peptide Symposium; Gross, E.; Meienhofer, J. (Eds.) Pierce Chemical Co.: Rockford, IL, USA, 1979; pp. 79–80.
- Fang, Y.; Robinson, D.R.; Foster, L.J. Quantitative Analysis of Proteome Coverage and Recovery Rates for Upstream Fractionation Methods in Proteomics. J. Proteome Res. 2010, 9, 1902–1912. [Google Scholar] [CrossRef]
- Hey, J.; Posch, A.; Cohen, A.; Liu, N.; Harbers, A. Fractionation of complex protein mixtures by liquid-phase isoelectric focusing. Methods Mol. Biol. 2008, 424, 225–239. [Google Scholar] [CrossRef]
- Chiu, R.; Ravindradas, S.; Wang, J.; Siegel, A.C.; Levy, G.A. Application of Microrotofor for Liquid Phase Protein Fractionation; Industrial Biodevelopment Laboratory: Toronto, Canada, 2008. [Google Scholar]
- Ross, A.; Faupel, M.; Mees, H.; van Oostrum, J.; Ferrigno, R.; Reymond, F.; Michel, P.; Rossier, J.S.; Hubert, H.; Girault, H.H. Protein purification by Off-Gel electrophoresis. Proteomics 2002, 2, 151–156. [Google Scholar] [CrossRef]
- D’Amici, G.M.; Timperio, A.M.; Zolla, L. Coupling of native liquid phase isoelectrofocusing and blue native polyacrylamide gel electrophoresis: A potent tool for native membrane multiprotein complexes separation. J. Proteome Res. 2008, 7, 1326–1340. [Google Scholar] [CrossRef]
- Herrero, M.; Simo, C.; Garcia-Canas, V.; Ibanez, E.; Cifuentes, A. Foodomics: MS strategies in modern food science and nutrition. Mass Spectr. Rev. 2012, 31, 49–69. [Google Scholar] [CrossRef] [Green Version]
- Garcia-Cañas, V.; Simó, C.; Leon, C.; Cifuentes, A. Advances in Nutrigenomics research: Novel and future analytical approaches to investigate the biological activity of natural compounds and food functions. J. Pharm. Biomed. Anal. 2010, 51, 290–304. [Google Scholar] [CrossRef] [Green Version]
- Tomas, R.; Yan, L.S.; Krenkova, J.; Foret, F. Autofocusing and ESI-MS analysis of protein digests in a miniaturized multicompartment electrolyzer. Electrophoresis 2007, 28, 2283–2290. [Google Scholar] [CrossRef]
- Surowiec, I.; Koistinen, K.M.; Fraser, P.D.; Bramley, P.M. Proteomic approach for the detection of chicken mechanically recovered meat. Meat Sci. 2011, 89, 233–237. [Google Scholar] [CrossRef]
- Nazzaro, F.; Fratianni, F.; Coppola, R.; Di Renzo, T.; Gagliardi, R.; Di Luccia, A. Protein Analysis of Meat from Different Species through 1D- and 2D-Microelectrophoresis. In Proceedings of the Italian Conference of Food Science and Technology, Milano, Italy, 9–10 May 2011.
- Nazzaro, F.; Fratianni, F.; Nicolaus, B.; Poli, A.; Orlando, P. The prebiotic source influences the growth, biochemical features and survival under simulated gastrointestinal conditions of the probiotic Lactobacillus acidophilus. Anaerobe 2012, 18, 280–285. [Google Scholar] [CrossRef]
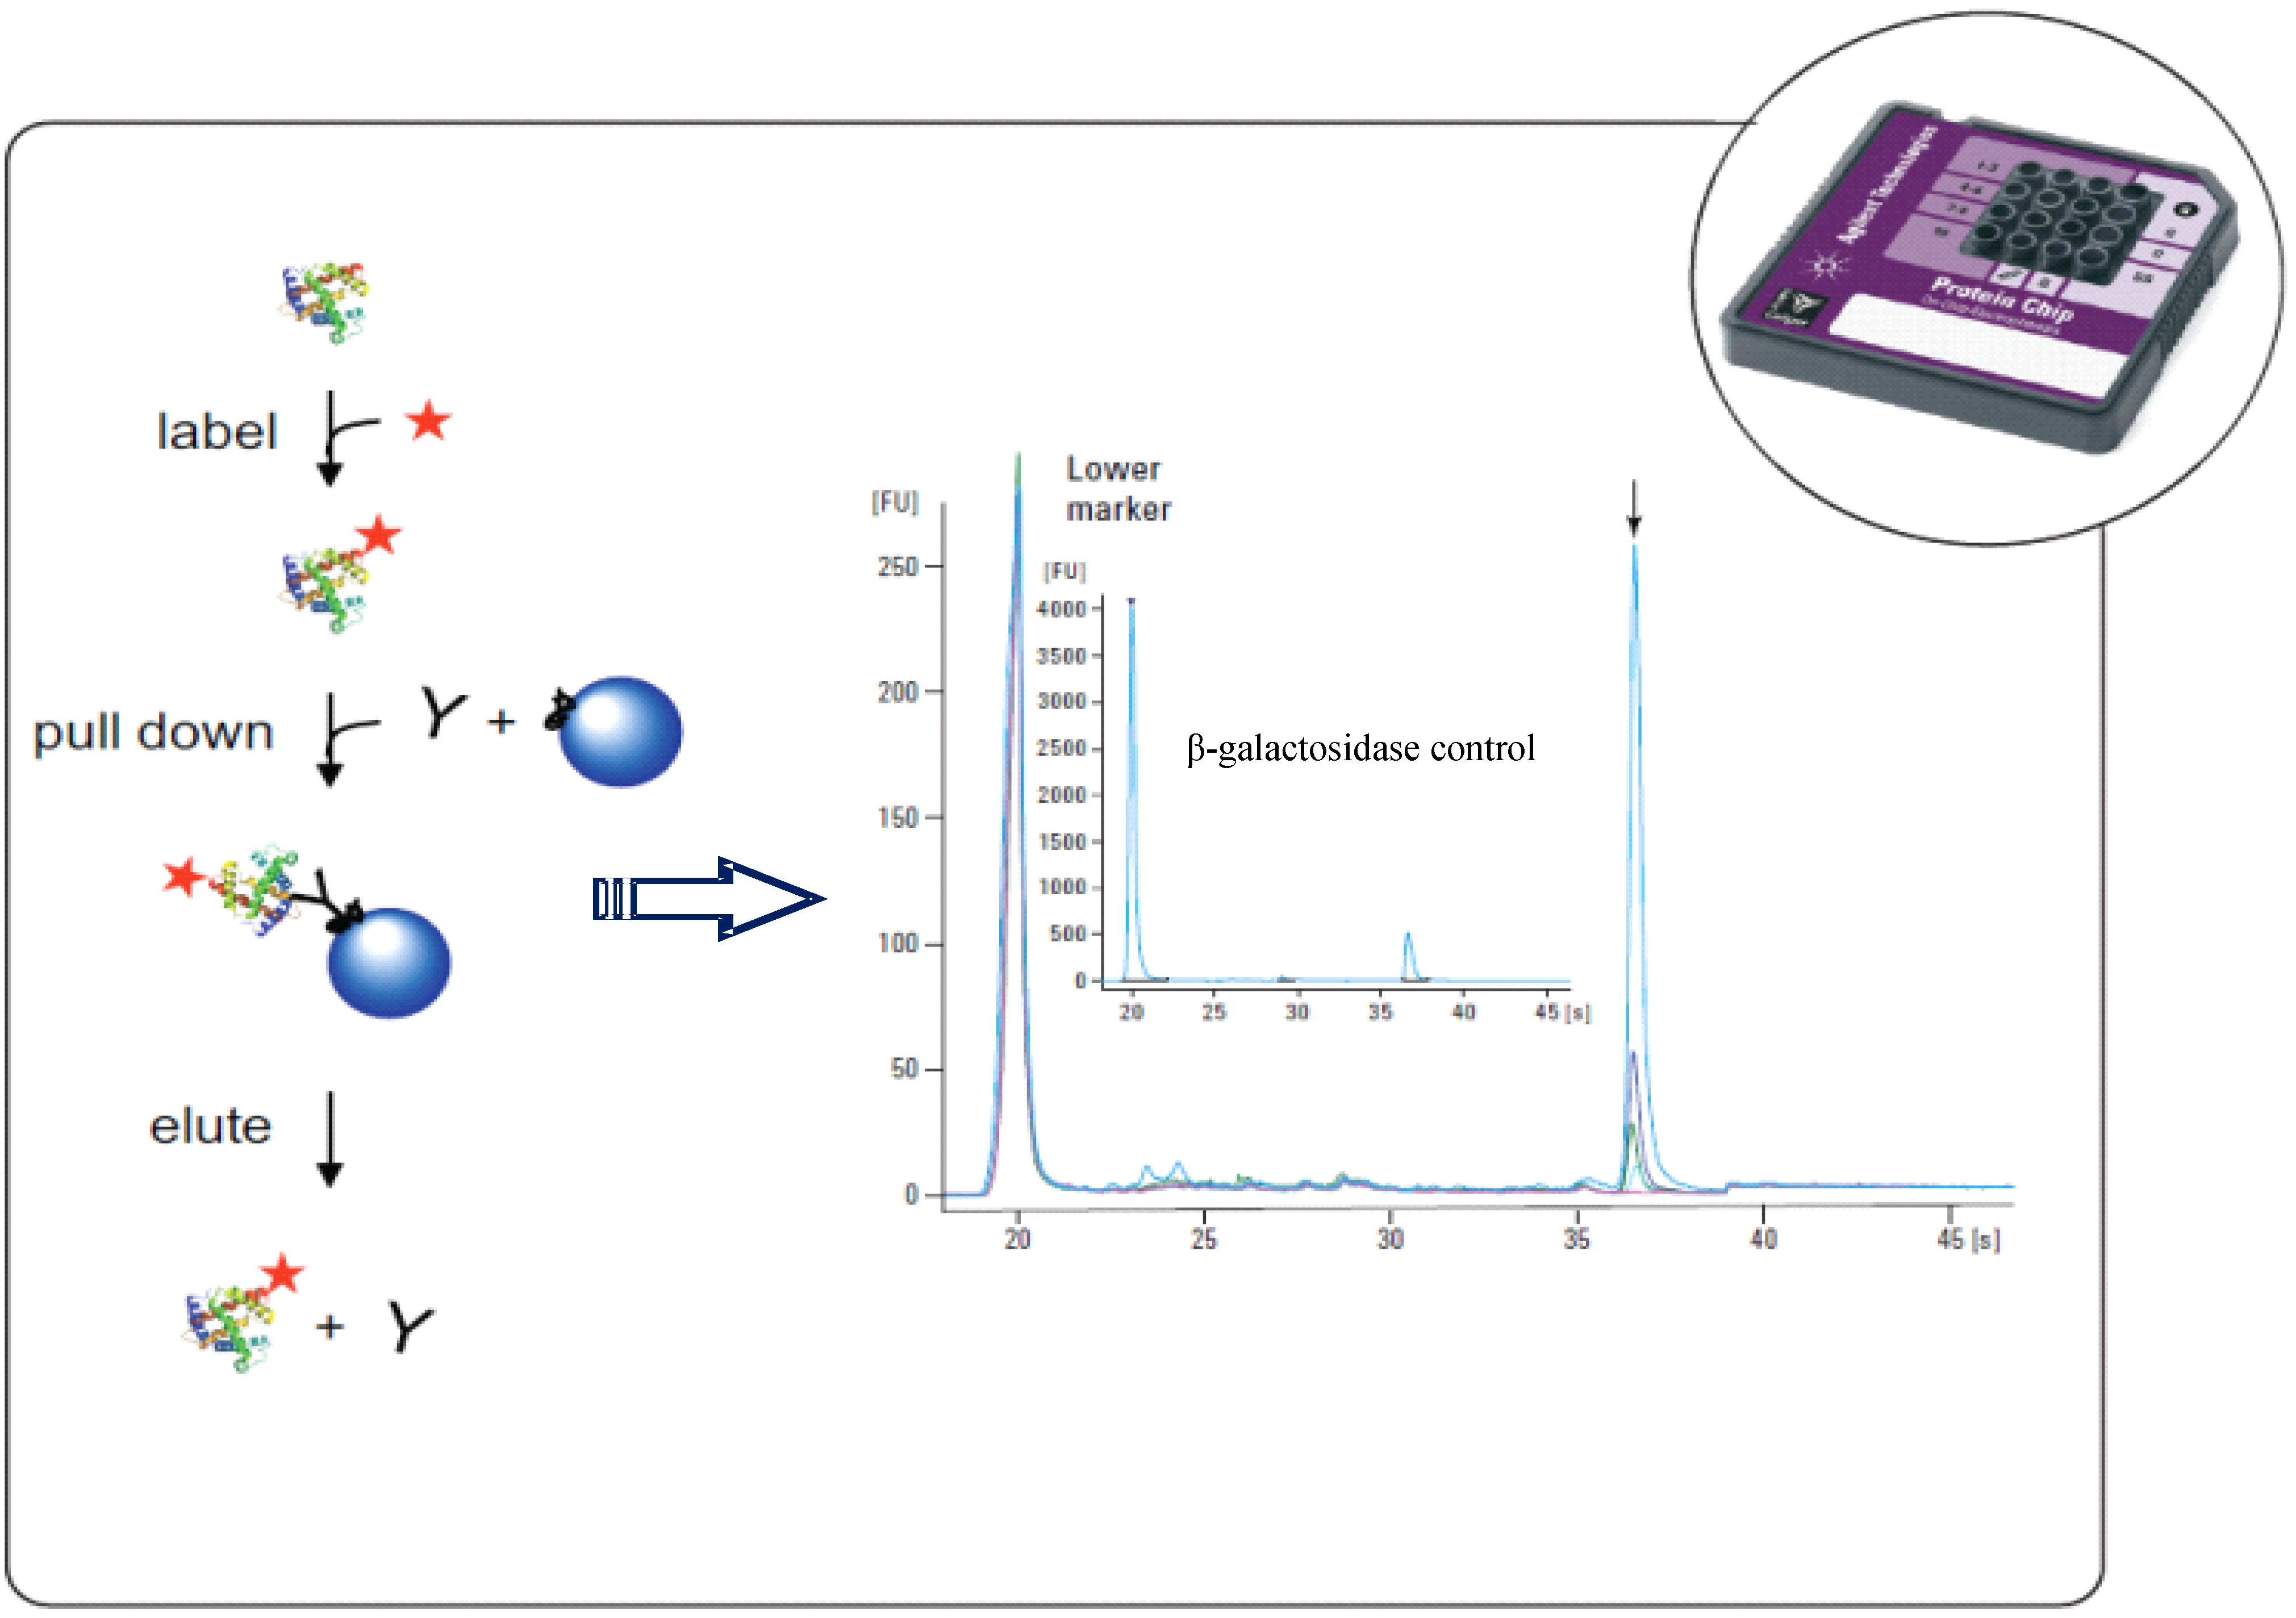
- Herwig, E.; Marchetti-Deschmann, M.; Wenz, C.; Rüfer, A.; Allmaier, G. Immunoprecipitation combined with microchip capillary gel electrophoresis: Detection and quantification of β-galactosidase from crude E. coli cell lysate. Biotechnol. J. 2011, 6, 420–427. [Google Scholar]
© 2012 by the authors; licensee MDPI, Basel, Switzerland. This article is an open-access article distributed under the terms and conditions of the Creative Commons Attribution license (http://creativecommons.org/licenses/by/3.0/).
Share and Cite
Nazzaro, F.; Orlando, P.; Fratianni, F.; Di Luccia, A.; Coppola, R. Protein Analysis-on-Chip Systems in Foodomics. Nutrients 2012, 4, 1475-1489. https://doi.org/10.3390/nu4101475
Nazzaro F, Orlando P, Fratianni F, Di Luccia A, Coppola R. Protein Analysis-on-Chip Systems in Foodomics. Nutrients. 2012; 4(10):1475-1489. https://doi.org/10.3390/nu4101475
Chicago/Turabian StyleNazzaro, Filomena, Pierangelo Orlando, Florinda Fratianni, Aldo Di Luccia, and Raffaele Coppola. 2012. "Protein Analysis-on-Chip Systems in Foodomics" Nutrients 4, no. 10: 1475-1489. https://doi.org/10.3390/nu4101475
APA StyleNazzaro, F., Orlando, P., Fratianni, F., Di Luccia, A., & Coppola, R. (2012). Protein Analysis-on-Chip Systems in Foodomics. Nutrients, 4(10), 1475-1489. https://doi.org/10.3390/nu4101475