2.1. Body weight and Spleen Characteristics
In all dietary groups, obese rats were shown to have higher body (650 ± 9 g vs. 382 ± 7 g, P < 0.001) and spleen weights compared (0.77 ± 0.01g, P < 0.05) to lean Ctl rats. Dietary treatment did not significantly affect final body weight (650 ± 9 g, Ctl; 660 ± 11 g, VA; 668 ± 14 g, EA) or percent body weight gain (48.9%, Ctl; 49.6%, VA; 52.7%, EA) among obese rats. Spleens of rats fed EA (1.2 ± 0.02 g) weighed significantly more than obese Ctl rats (1.0 ± 0.04 g); while the spleens of VA-fed rats (0.88 ± 0.03 g) weighed significantly less compared to obese Ctl and EA-fed rats (P < 0.05). The number of splenocytes did not differ between lean (3.52 × 10⁸ cells) and obese (3.90 × 10⁸ cells) or with VA (3.97 × 10⁸ cells) or EA (3.00 × 10⁸ cells) feeding.
2.2. Fatty Acid Composition of Plasma PL
Compared to lean Ctl rats, obese Ctl rats had a higher proportion of 16:0, 18:1 (n-9), C18:1 (n-7), 20:3 (n-6), total MUFA, and a lower percentage of 18:0 and 20:4 (n-6) in plasma phospholipids (
Table 1, P < 0.05). Compared to obese Ctl and EA rats, there was a higher proportion of 18:1
trans11, 18:1 (n-9), C18:1 (n-7), 18:2 (n-6) and 20:3(n-6), and a lower percentage of 12:0 (Ctl only) in plasma PLs of rats fed VA (
Table 1, P < 0.05). Overall VA-fed rats had a higher percentage of total PUFA, n-6:n-3 PUFA, n-6 PUFA and PUFA:SFA, and a lower proportion of total SFA relative to EA-fed rats (
Table 1, P < 0.05). EA-fed rats also had a higher proportion of 18:1
trans9 compared to all groups, and a lower proportion of total n-6 PUFA relative to obese Ctl rats (
Table 1, P < 0.05). The plasma level of EA in EA-fed rats was similar to the plasma level of VA in VA-fed rats. The plasma 20:4(n-6):20:3(n-6), an estimate of delta-5 desaturase, was higher in VA-fed rats (0.14 ± 0.00) relative to EA (0.11± 0.00) and Ob Ctl rats (0.12 ± 0.00). There was a slight difference in estimated delta-9 desaturase activity (MUFA:SFA) between VA (4.48 ± 0.20) and Ctl (6.85 ± 0.58), but not EA (5.39 ± 0.85).
Table 1.
Plasma PL fatty acid concentrations in lean rats and obese JCR:LA-cp rats fed Ctl, VA or EA diets.
Table 1.
Plasma PL fatty acid concentrations in lean rats and obese JCR:LA-cp rats fed Ctl, VA or EA diets.
| Lean Ctl | Obese Ctl | VA | EA |
|---|
| | % of fatty acids |
|---|
| 12:0 | 2.3 ± 0.2ab | 2.7 ± 0.5a | 1.0 ± 0.3b | 1.8 ± 0.9ab |
| 16:0 | 21 ± 1b | 26 ± 1a | 25 ± 1a | 28 ± 3.1a |
| 18:0 | 34 ± 1a | 27 ± 0b | 26 ± 1b | 28 ± 3b |
| 18:1trans9 | 0b | 0b | 0b | 1.6 ± 0.2a |
| 18:1trans11 | 0b | 0b | 1.5 ± 0.1a | 0b |
| 18:1(n-9) | 3.9 ± 0.1c | 5.4 ± 0.1b | 5.9 ± 0.1a | 5.2 ± 0.1b |
| 18:1(n-7) | 0.7 ± 0.0c | 1.4 ± 0.0b | 1.6 ± 0.1a | 1.3 ± 0.1b |
| 18:2(n-6) | 15 ± 1b | 18 ± 0.9b | 22 ± 1a | 15 ± 2b |
| c9t11CLA | 0 | 0 | 0.06 ± 0.05 | 0 |
| 20:3(n-6) | 0c | 1.8 ± 0.3b | 2.4 ± 0.1a | 2.0 ± 0.3ab |
| 20:4(n-6) | 18 ± 1a | 14 ± 1b | 11 ± 1b | 10 ± 1b |
| 22:5(n-3) | 0.05 ± 0.05a | 0.24 ± 0.01a | 0.31 ± 0.05a | 0.18 ± 0.06a |
| 22:6(n-3) | 1.3 ± 0.1a | 1.5 ± 0.1a | 1.1 ± 0.1a | 1.3 ± 0.2a |
| MUFA | 4.3 ± 0.2c | 6.7 ± 0.1ab | 7.5 ± 0.1a | 6.4 ± 0.1b |
| SFA | 56 ± 1a | 55 ± 1ab | 52 ± 0b | 57 ± 1a |
| PUFA | 34 ± 2ab | 35 ± 1ab | 36 ± 0a | 32 ± 1b |
| PUFA:SFA | 0.61 ± 0.20ab | 0.64 ± 0.03ab | 0.69 ± 0.01a | 0.56 ± 0.02b |
| n-6 PUFA | 33 ± 1a | 33 ± 1a | 35 ± 0a | 30 ± 1b |
| n-3 PUFA | 1.4 ± 0.1a | 1.7 ± 0.1a | 1.4 ± 0.1a | 1.7 ± 0.2a |
| n-6:n-3 PUFA | 26 ± 2.7a | 20 ± 1.1ab | 26 ± 2.9a | 19 ± 2.5b |
2.3. Fatty Acid Composition of Splenocyte PL
In the PE fraction, splenocytes of obese Ctl rats had a higher proportion of 16:0, 18:1
cis11, 20:3(n-6), 22:5(n-3), 22:6(n-3), MUFA and n-3 PUFA and had a lower percentage of 18:0, 18:2(n-6), (n-6) PUFA and (n-6):(n-3) compared to lean rats (
Table 2, P < 0.05). Relative to obese Ctl rats, rats fed VA had a higher proportion of VA, 18:1
cis11, and 18:2(n-6) and a lower percentage of 20:4(n-6), 22:6(n-3) and total PUFA (P < 0.05,
Table 2). Rats fed EA had a higher percentage of EA and 20:3(n-6) and a lower proportion of 16:0, 18:1
cis11 and total SFA (P < 0.05,
Table 2).
Table 2.
Splenocyte phosphatidylethanolamine fatty acid composition of lean rats and obese JCR:LA-cp rats fed Ctl, VA or EA diets.
Table 2.
Splenocyte phosphatidylethanolamine fatty acid composition of lean rats and obese JCR:LA-cp rats fed Ctl, VA or EA diets.
| | Lean Ctl | Obese Ctl | VA | EA |
|---|
| | g/100g lipid |
|---|
| C16:0 | 3.4 ± 0.1c | 5.0 ± 0.1a | 5.2 ± 0.2a | 4.2 ± 0.1b |
| C18:0 | 25 ± 0a | 22 ± 0b | 22 ± 0b | 23 ± 0b |
| C18:1trans9 | 0 | 0 | 0 | 1.4 ± 0.1 |
| 18:1trans11 | 0.38 ± 0.08b | 0.34 ± 0.02b | 1.1 ± 0.1a | 0.30 ± 0.00b |
| C18:1cis9 | 5.0 ± 0.1a | 5.2 ± 0.1a | 5.2 ± 0.1a | 5.1 ± 0.1a |
| C18:1cis11 | 0.58 ± 0.03d | 1.0 ± 0.0b | 1.2 ± 0.0a | 0.91 ± 0.03c |
| C18:2 (n-6) | 4.3 ± 0.4a | 3.6 ± 0.1b | 4.1 ± 0.1a | 3.5 ± 0.1b |
| C18:3 (n-3) | 0.30 ± 0.02a | 0.29 ± 0.03a | 0.35 ± 0.01a | 0.31 ± 0.01a |
| C20:3 (n-6) | 1.0 ± 0.1c | 1.5 ± 0.1b | 1.5 ± 0.0b | 1.7 ± 0.1a |
| C20:4 (n-6) | 40 ± 1a | 40 ± 0a | 38 ± 1b | 40 ± 0a |
| C20:5 (n-3) | 0.76 ± 0.46a | 0.40 ± 0.12a | 1.4 ± 0.7a | 0.68 ± 0.15a |
| C22:4 (n-6) | 0.65 ± 0.06a | 0.70 ± 0.05a | 0.62 ± 0.07a | 0.55 ± 0.03a |
| C22:5 (n-3) | 2.7 ± 0.1b | 4.4 ± 0.1a | 4.1 ± 0.1a | 4.3 ± 0.2a |
| C22:6 (n-3) | 2.1 ± 0.1c | 3.9 ± 0.2a | 2.8 ± 0.1b | 3.6 ± 0.1a |
| MUFA | 5.7 ± 0.3b | 6.5 ± 0.1a | 7.5 ± 0.1a | 6.4 ± 0.1a |
| SFA | 33 ± 1a | 31± 0a | 31 ± 1a | 29 ± 0b |
| PUFA | 60 ± 1ab | 61 ± 0a | 58 ± 1b | 61 ± 0a |
| PUFA:SFA | 1.8 ± 0.1b | 2.0 ± 0.0ab | 1.9 ± 0.1b | 2.1 ± 0.0a |
| (n-6) PUFA | 46 ± 1a | 44 ± 0.2bc | 43 ± 1c | 45 ± 0ab |
| (n-3) PUFA | 14 ± 0c | 16 ± 0a | 15 ± 1b | 16 ± 0ab |
| (n-6):(n-3) PUFA | 3.3 ± 0.1a | 2.7 ± 0.0b | 2.9 ± 0.1b | 2.8 ± 0.1b |
In the PC fraction, splenocytes of obese Ctl rats had a higher proportion of 16:0, 18:1
cis9
, 18:1
cis11, 20:3(n-6), 22:6(n-3) MUFA and n-3 PUFA and a lower percentage of 18:0, 18:2(n-6), 18:3(n-3), 20:5(n-3), C22:4(n-6), total PUFA, (n-6) PUFA and (n-6):(n-3) compared to lean Ctl rats (
Table 3, P < 0.05). Relative to obese Ctl rats, both VA and EA fed rats had a higher proportion 18:2(n-6) and a lower proportion of 20:4(n-6) (
Table 3, P < 0.05). Only rats fed VA had a higher proportion of VA, and (n-6):(n-3) PUFA and lower proportion of 18:1
cis9, 22:6(n-3) and (n-3) PUFA relative to obese Ctl group (P < 0.05,
Table 3). The EA group had more EA, 18:2(n-6), 20:3(n-6), and 22:5(n-3) and less 18:0, VA, and total SFA in PC PL compared to obese Ctl rats (P < 0.05,
Table 3).
Table 3.
Splenocyte phosphatidylcholine fatty acid composition of lean rats and obese JCR:LA-cp rats fed Ctl, VA or EA diets.
Table 3.
Splenocyte phosphatidylcholine fatty acid composition of lean rats and obese JCR:LA-cp rats fed Ctl, VA or EA diets.
| | Lean Ctl | Obese Ctl | VA | EA |
|---|
| | g/100g lipid |
|---|
| C16:0 | 31 ± 0a | 36 ± 0b | 37± 0b | 36 ± 0b |
| C18:0 | 17 ± 0a | 13 ± 0b | 12 ± 0bc | 12 ± 0c |
| C18:1trans9 | 0 | 0 | 0 | 2.1 ± 0.0 |
| 18:1trans11 | 0.60 ± 0.07b | 0.71 ± 0.04b | 1.5 ± 0.1a | 0 |
| C18:1cis9 | 9.0 ± 0.1b | 9.4 ± 0.1a | 9.0 ± 0.1b | 9.6 ± 0.1a |
| C18:1cis11 | 2.0 ± 0.1c | 3.4 ± 0.1ab | 3.6 ± 0.1a | 3.4 ± 0.0b |
| C18:2 (n-6) | 12 ± 0a | 10 ± 0c | 11 ± 0b | 11 ± 0b |
| C18:3 (n-3) | 0.95 ± 0.02a | 0.79 ± 0.03b | 0.82 ± 0.02b | 0.86 ± 0.02b |
| C20:3 (n-6) | 1.0 ± 0.0c | 1.7 ± 0.1b | 1.7 ± 0.0b | 2.0 ± 0.1a |
| C20:4 (n-6) | 17 ± 1a | 16 ± 0a | 14 ± 0b | 14 ± 0b |
| C20:5 (n-3) | 0.07 ± 0.00a | 0.05 ± 0.00b | 0.07 ± 0.02ab | 0.05 ± 0.00ab |
| C22:4 (n-6) | 0.10 ± 0.00a | 0.10 ± 0.00b | 0.08 ± 0.02b | 0.10 ± 0.00b |
| C22:5 (n-3) | 0.38 ± 0.01b | 0.66 ± 0.01b | 0.60 ± 0.02b | 0.73 ± 0.03a |
| C22:6 (n-3) | 0.39 ± 0.01c | 0.74 ± 0.03a | 0.54 ± 0.02b | 0.74 ± 0.03a |
| MUFA | 12 ± 0b | 14 ± 0a | 14 ± 1a | 14 ± 0a |
| SFA | 51 ± 1a | 50 ± 0a | 51 ± 1a | 49 ± 0b |
| PUFA | 35 ± 1a | 32 ± 0b | 31 ± 3b | 32 ± 0b |
| PUFA:SFA | 0.68 ± 0.03a | 0.64 ± 0.01ab | 0.60 ± 0.93b | 0.66 ± 0.01a |
| (n-6) PUFA | 31 ± 1a | 27 ± 0b | 26 ± 2b | 27 ± 0b |
| (n-3) PUFA | 3.6 ± 0.1c | 4.7 ± 0.1a | 4.2 ± 0.3b | 5.1 ± 0.1a |
| (n-6):(n-3) PUFA | 8.6 ± 0.1a | 5.8 ± 0.1c | 6.4 ± 0.32b | 5.3 ± 0.1c |
2.4. Splenocyte Phenotypes
Compared to lean Ctl rats, obese Ctl rats had a lower (P < 0.05) proportion of CD3
+ (T-cells), CD3
+CD4
+ (T-helper cells), CD3
+CD8
+ (cytotoxic T-cells (CTLs)), CD4
+CD28
+ (T-helpers cells expressing co-stimulatory molecule), CD4
+CD45RC
- (mature T-helper cells), CD8
+CD28
+ (activated CTL), CD8
+CD45RC
- (mature CTL), OX62
+OX6
+ (dendritic cell), CD45RA
+OX6
+ (activated B-cell) and OX6
+ (antigen presenting cells). Obese Ctl-fed rats also had a higher percentage of CD4
+CD25
+ (T-helpers cell expressing IL-2 receptor) and CD4
+CD45RC
+ (naïve T-helper cells) cells (
Table 4, P < 0.05).
Compared to obese Ctl rats, obese EA- and VA-fed rats had a higher (P < 0.05) percentage of CD3
+CD8
+ and CD8
+CD45RC
- (mature CTL) cells. VA-fed rats had a lower (P < 0.05) proportion of OX62
+OX6
+ (dendritic cells); whereas spleens from EA-fed rats had a higher percentage of OX62
+OX6
+ compared to obese Ctl rats (P < 0.05). Only obese VA-fed rats had a higher proportion of CD8
+CD28
+ (CTL expressing co-stimulatory) and a lower percentage of CD4
+CD45RC
+ (antigen naïve T-helper cells), and CD45RA
+OX6
+ (activated B-cells) relative to obese Ctl rats (P < 0.05,
Table 4). Obese rats fed EA had a lower proportion of OX6
+CD11b/c
+ (macrophages expressing MHC class II molecule) in their spleens compared to obese Ctl rats (P < 0.05,
Table 4).
Table 4.
Splenocyte phenotypes of lean Ctl rats and obese JCR:LA-cp rats fed VA, EA or Ctl diet.
Table 4.
Splenocyte phenotypes of lean Ctl rats and obese JCR:LA-cp rats fed VA, EA or Ctl diet.
| | Lean Ctl | Obese Ctl | VA | EA |
|---|
| | % of gated cells |
| CD3+ | 48 ± 1a | 45 ± 1b | 43 ± 1b | 44 ± 1b |
| CD3+CD4+ | 38 ± 1a | 34 ± 1b | 33 ± 1b | 33 ± 1b |
| CD3+CD8+ | 8.9 ± 0.3a | 4.8 ± 1.0b | 8.2 ± 0.3a | 9.7 ± 0.3a |
| CD4+CD25+ | 5.6 ± 0.5b | 7.5 ± 0.3a | 8.0 ± 0.3a | 4.6 ± 0.1c |
| CD4+CD28+ | 36 ± 1a | 30 ± 1b | 32 ± 1b | NM |
| CD4+CD45RC+ | 3.9 ± 0.57c | 6.8 ± 0.42a | 5.6 ± 0.25b | 3.4 ± 0.20c |
| CD4+CD45RC- | 40 ± 1a | 37 ± 1b | 36 ± 0b | 35 ± 1b |
| CD8+CD25+ | 1.3 ± 0.1b | 1.1 ± 0.1b | 3.1 ± 0.1a | 1.0 ± 0.0b |
| CD8+CD28+ | 7.6 ± 0.1a | 3.5 ± 0.7b | 7.6 ± 0.3a | NM |
| CD8+CD45RC+ | 7.0 ± 1.4ab | 6.2 ± 1.0ab | 7.7 ± 0.1a | 4.5 ± 0.2b |
| CD8+CD45RC- | 11 ± 0.4a | 9.4 ± 0.3b | 11 ± 0.3a | 10 ± 0.4a |
| CD11b/c+OX6+ | 9.9 ± 0.6a | 10 ± 1a | 9.3 ± 0.5a | 4.0 ± 0.2b |
| OX62+OX6+ | 1.4 ± 0.03b | 1.2 ± 0.07c | 1.5 ± 0.09b | 1.7 ± 0.06a |
| CD45RA+OX6+ | 22 ± 1a | 19 ± 1b | 15 ± 1c | 19 ± 1b |
| OX6+ | 30 ± 1a | 28 ± 1b | 27 ± 1b | 26 ± 1b |
2.5. Cytokines
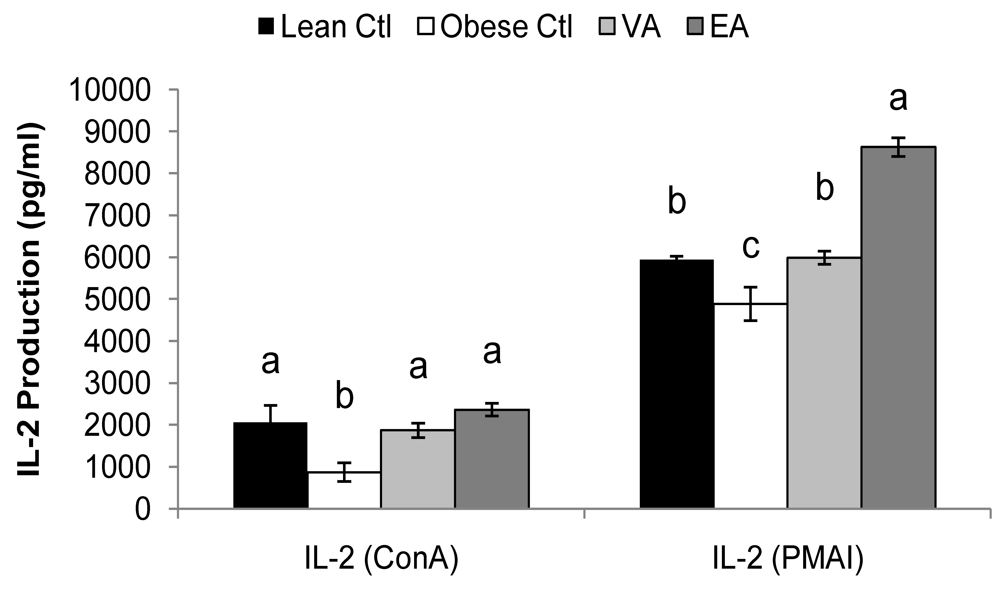
Obese rats fed the Ctl diet produced less ConA-stimulated IL-1β, IL-2 and TNF-α and more IL-6 compared to lean rats (
Figure 1 and
Table 5, P < 0.05). PMA+I-stimulated IL-2 and IFN-γ was also lower in obese Ctl rats (
Figure 1 and
Table 5, P < 0.05). There was no significant difference in the cytokine response to LPS by splenocytes between lean and obese rats fed the control diet.
Splenoctyes of EA-fed obese animals produced more Con A and PMA+I-stimulated IL-6 as compared to VA and Ctl-fed rats (
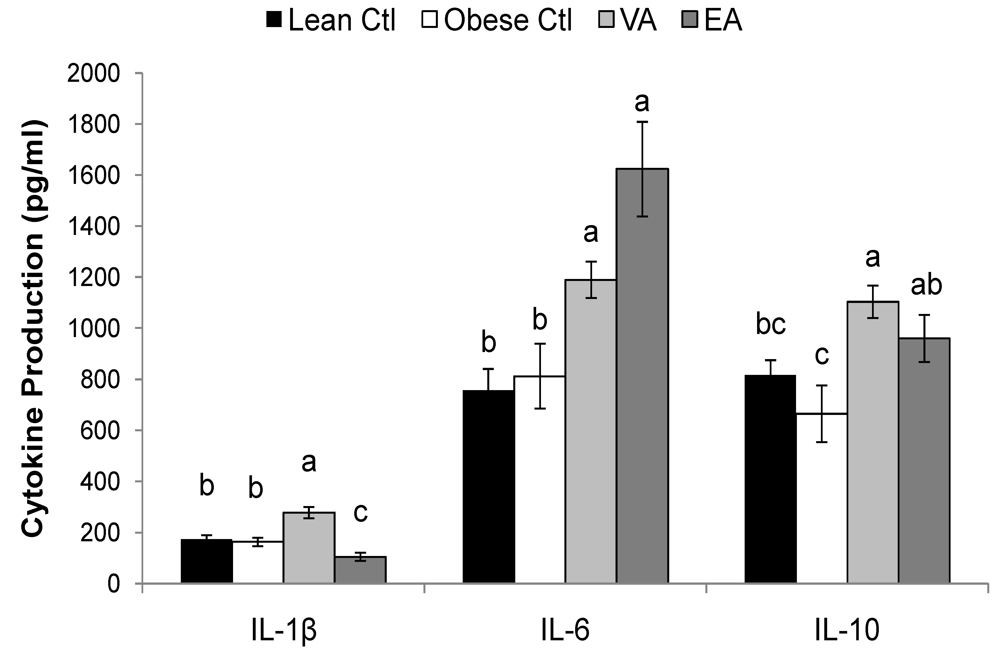
Table 5, P < 0.05). Compared to obese Ctl-fed rats, obese rats fed VA or EA produced more T-cell (ConA and PMA+I) stimulated IL-2 and TNF-α and more LPS-stimulated IL-6 and IL-10 (
Figure 1 and
Table 5, P < 0.05). Splenocytes of obese rats fed VA secreted more ConA-stimulated IL-4, and PMAI-stimulated IL-10 compared to obese Ctl rats, and these responses did not differ from lean Ctl rats (
Table 5, P < 0.05). VA-fed rats also produced more LPS-stimulated IL-1β; whereas, EA-fed rats produced less (
Figure 2, P < 0.05).
Table 5.
Mitogen-stimulated cytokine production of lean rats and obese JCR:LA-cp rats fed Ctl, VA or EA diet.
Table 5.
Mitogen-stimulated cytokine production of lean rats and obese JCR:LA-cp rats fed Ctl, VA or EA diet.
| | | Lean Ctl | Obese Ctl | VA | EA |
|---|
| | (pg/ml) |
|---|
| ConA | IL-1β | 73 ± 5a | 32 ± 6.0b | 59 ± 4.3a | 26 ± 7.2b |
| | IL-4 | 30 ± 6.4ab | 16 ± 3.2b | 40 ± 4.2a | 17 ± 2.5b |
| | IL-6 | 50 ± 7.7c | 100 ± 15b | 118 ± 16b | 283 ± 47a |
| | IL-10 | 489 ± 62a | 348± 65a | 510 ± 40a | 499 ± 50a |
| | TNF-α | 130 ± 24a | 40 ± 9.0b | 92 ± 11a | 83 ± 11a |
| | IFN-γ | 670 ± 228a | 310 ± 82a | 416 ± 35a | 341 ± 45a |
| PMAI | IL-1β | 91 ± 7.3a | 86 ± 9.9a | 99 ± 10a | 70 ± 11a |
| | IL-6 | 250 ± 22ab | 227 ± 33b | 218 ± 25b | 398 ± 71a |
| | IL-10 | 2559 ± 540ab | 1414 ± 310b | 3599 ± 523a | 2239 ± 391ab |
| | TNF-α | 829 ± 107a | 620 ± 89a | 812 ± 76a | 912 ± 175a |
| | IFN-γ | 7876 ± 1002a | 4601 ± 1032b | 6393 ± 762ab | 4779 ± 745b |
Figure 1.
Mitogen-stimulated IL-2 production. Bars represent mean ± SEM, n=8/group. Bars not sharing a common letter are significantly different (P < 0.05). Ctl, control; VA, vaccenic acid; EA, elaidic acid.
Figure 1.
Mitogen-stimulated IL-2 production. Bars represent mean ± SEM, n=8/group. Bars not sharing a common letter are significantly different (P < 0.05). Ctl, control; VA, vaccenic acid; EA, elaidic acid.
Figure 2.
LPS-stimulated cytokine production. Bars represent mean ± SEM, n=8/group. Bars not sharing a common letter are significantly different (P < 0.05). Ctl, control; VA, vaccenic acid; EA, elaidic acid. TNF-α production did not differ among groups (458 ± 42, n = 32).
Figure 2.
LPS-stimulated cytokine production. Bars represent mean ± SEM, n=8/group. Bars not sharing a common letter are significantly different (P < 0.05). Ctl, control; VA, vaccenic acid; EA, elaidic acid. TNF-α production did not differ among groups (458 ± 42, n = 32).
2.7. Discussion
In the present study, obese JCR:LA-
cp rats had elevated serum haptoglobin concentrations, indicating a heightened systemic inflammatory state similar to that reported in overweight-obese patients [
31]. A positive correlation between serum inflammatory markers and TFA has been reported in the literature [
6,
7,
8]; however, the contribution of individual TFA to inflammation in obesity is not known. In the present study, obese animals fed VA had lower serum haptoglobin concentrations relative to those fed the Ctl diet and these levels did not differ from lean animals. These findings are consistent with our previous report showing a trend of VA to lower serum haptoglobin after three weeks of feeding [
27]. Serum concentrations in EA-fed rats were significantly higher relative to VA-fed rats, but levels did not differ from obese Ctl rats. This suggests that EA may not independently exacerbate obesity-associated inflammation, which is reported to contribute to the development and progression of insulin resistance [
31], type 2 diabetes [
10], and CVD [
11]. Plasma concentrations of 18:2(n-6), 20:3(n-6) and total PUFA were greater in the VA group, suggesting a possible improvement in essential fatty acid status in the VA group as compared to the EA and obese Ctl groups.
Splenocytes of obese JCR:LA-
cp rats had an impaired ability to respond to T-cell mitogen stimulation (IL-2 and IFN-γ production), which may have been due to the lower proportion of T-helper cells (CD3
+CD4
+) and is consistent with previous reports [
18,
19,
26,
32,
33,
34,
35,
36]. Additionally obese rats had a higher proportion of T helper cells expressing IL-2 (CD4
+CD25
+) suggesting that T cells were in a state of activation in-vivo. In other chronic inflammatory disease states, T-cells that display an activated Th1 phenotype are less responsive to mitogen or antigen stimulation [
37].
It is well established that altering that fatty acid composition of immune cell PL, particularly long chain PUFA, induces structural and functional changes in T-cells [
30]. In splenocytes from obese Ctl rats, there was a lower concentration of 18:2(n-6) in both PC and PE compared to lean Ctl-fed rats. Although the concentration of arachidonic acid (AA, 20:4(n-6)) did not differ in the membrane PL there was a significantly lower concentration of AA in plasma PL, suggesting alteration in essential fatty acid status in the obese state. Additionally, total n-3 PUFA, specifically 22:5(n-3) and 22:6 (n-3), were higher in both membrane PL in obese animals compared to lean animals. Alterations in immune cell membrane concentrations of (n-6) and (n-3) PUFA have been shown to modify IL-2 production after membrane stimulation [
38].
In the present study, feeding either TFA corrected the impaired IL-2 and TNF-α response to T-cell mitogen stimulation in obese rats. In addition, feeding VA normalized T-cell stimulated IL-1β, and IFN-γ production. This suggests that habitual consumption of the naturally occurring VA may improve impaired T-cell function in obesity. Despite the improved IL-2 and TNF-α response, EA-fed rats produced more IL-6 than the Ctl or VA-fed groups in response to T-cell mitogen stimulation. The greater production of IL-6 in response to T-cell stimulation was associated with greater incorporation of EA into splenocyte PL and indicating that EA facilitates a pro-inflammatory T-cell response. The direct impact of EA on inflammatory T-cell responses has not been examined. However, epidemiological studies and a short-term intervention study in healthy men have reported that EA and a mixture of synthetic TFA negatively impact serum inflammatory markers, including IL-6 [
6,
7,
8]. Moreover, Han
et al reported greater LPS-stimulated IL-6 production when overweight subjects consumed partially hydrogenated margarine [
9]. These results suggest that EA augments the inflammatory response of T-cells through direct incorporation into the plasma membrane and/or through modification of intracellular targets, such as peroxisome proliferator activated receptor-gamma (PPAR-γ) [
39]. In addition, we did observe that spleens of EA-fed rats weighed more than Ctl rats, but there was no significant difference in the total number of immune cells isolated. Further studies are needed to determine what caused the higher spleen weight.
In the present study, we did not directly study the mechanisms that contributed to improved T-cell stimulated cytokine responses in the VA-or EA-fed obese rodents. However, it appeared that although VA and EA were incorporated to similar levels in both PL fractions, VA and EA may act through different mechanisms. More specifically, changes induced by VA were associated with alterations in essential fatty acid composition. On the other hand, changes induced by EA may be through direct membrane incorporation and/or through intracellular targets downstream of the plasma membrane. Interestingly, the biological derivative of VA,
c9
t11 CLA, was not detected in either PL fraction in VA-fed rats, indicating that VA is not readily converted to CLA and/or that the CLA is not incorporated into the PLs analyzed. VA-fed rats had significantly less docosahexaenoic acid (DHA, 22:6(n-3)) and lower total (n-3) PUFA in splenocyte membrane PL compared to EA and Ctl-fed animals, and these levels were more similar to lean Ctl rats. High incorporation of long chain (n-3) fatty acids into PL membranes has been shown to reduce the inflammatory response [
30]. Thus, normalization of DHA in splenocyte membranes of obese VA rats may have contributed to the improved T-cell response (as this is suppressed by a pro-inflammatory response). In contrast, the DHA or total (n-3) PUFA composition of EA-fed rat splenocytes did not differ from obese Ctl rats. Thus, the heightened T-cell response observed in EA-fed rats do not appear to be associated with changes in other long chain PUFA, but rather may be related to the direct incorporation if EA into the membrane. Moreover, EA-fed rats produced approximately 30% higher levels of IL-2 in response to PMA+I, a mitogen that bypasses the plasma membrane T-cell receptor and activates protein kinase C [
40]. This suggests that EA may also target intracellular pathways downstream of the T-cell receptor.
We next examined the ability of the innate immune system to respond to LPS stimulation. Despite an impaired ability to respond to T-cell mitogen stimulation, cytokine production in response to LPS did not significantly differ with obesity in rats fed the Ctl diet. These findings are supported by our previous reports and infer that the ability of systemic innate immune cells to produce inflammatory cytokines is not impaired in obese JCR:LA-
cp [
25,
18]. Feeding either TFA to obese rats resulted in greater IL-6 and IL-10 production, compared to Ctl rats after LPS-stimulation, implying that both EA and VA facilitate the production of pro-inflammatory cytokines by macrophages, dendritic cells and/or B-cells. This appears to be a long-term feeding effect as the shorter term (3 wk) dietary VA intervention did not alter LPS-stimulated IL-1β or IL-6 production in obese JCR:LA-
cp rats [
25]. In the present study, we observed differential effects of VA and EA on LPS-stimulated IL-1β production, such that cells from EA-fed rats produced less IL-1β compared to VA-fed rats. These differences may be related to our observation that EA-fed rats had fewer macrophages expressing the MHC class II molecule (OX6
+CD11b/c
+), which are major producers of IL-1β [
41]. Long chain PUFA significantly influence the ability of inflammatory innate immune cells to respond to stimulation [
30], and it is possible that the lower proportion of DHA and total (n-3) PUFA in the splenocyte PL of VA-fed rats contributed to the higher IL-1β response in contrast to EA-fed animals. However, similar changes in (n-3) PUFA composition were not observed in EA-fed rats, suggesting that other membrane or intracellular modifications may be responsible. Therefore, further investigation into the effects of these TFA may be warranted to explore these and other membrane changes in relationship to immune function in the obese state.


