A Tool for Sheep Product Quality: Custom Microarrays from Public Databases

Abstract
:1. Introduction
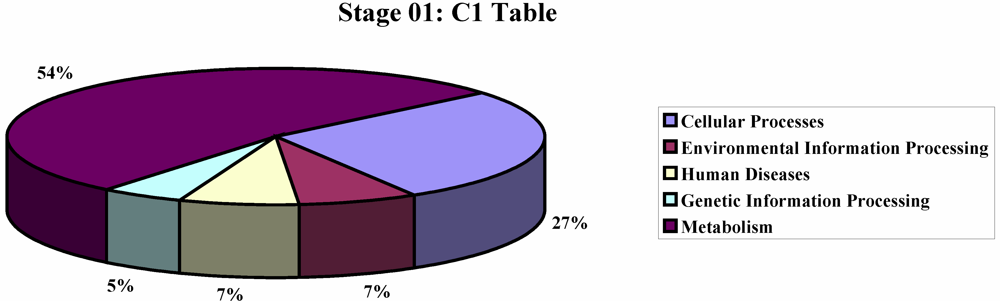
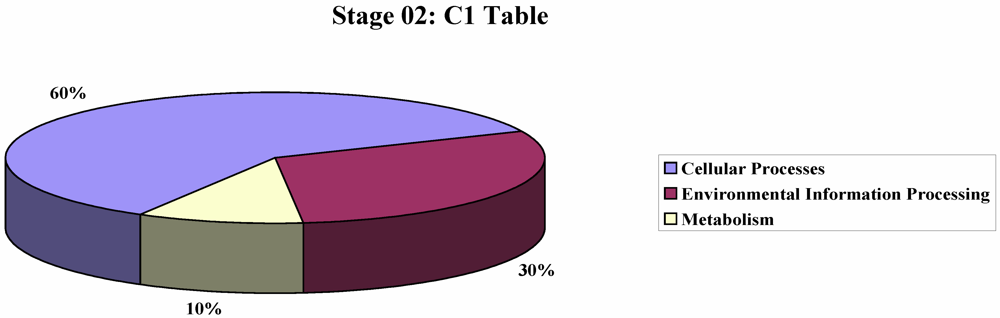
2. Results and Discussion

3. Experimental Section
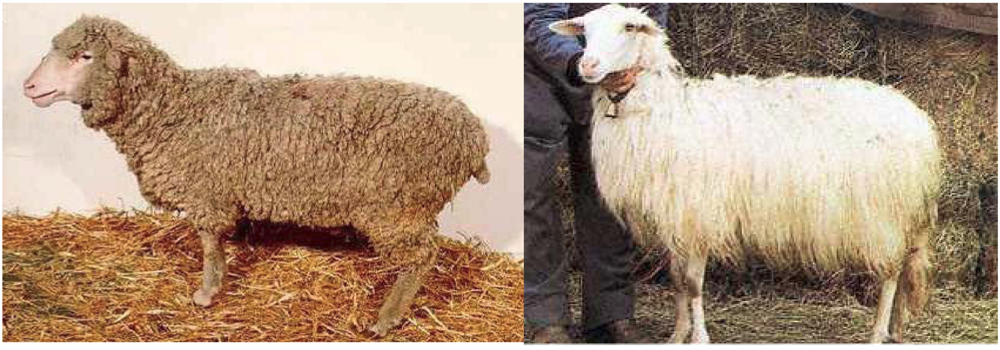
3.1. Animals and Sampling
3.2. RNA Extraction
3.3. RNA Amplification and Labeling
3.4. Microarray Study Design and Hybridization

 |
3.5. Microarray Data Analysis
Single microarray step
Paired dye-swap microarrays step and normalization
Significance analysis
4. Conclusions
Acknowledgements
Appendix
| P value | FC | EST | RefSeq | Gene | UP | DOWN |
|---|---|---|---|---|---|---|
| 0.0089536 | -4.677 | EE874449.1 | -- | -- | Gentile | Sarda |
| 0.0399319 | -2.705 | CD287057.1 | -- | -- | Gentile | Sarda |
| 0.00629989 | -2.578 | EE788795.1 | -- | -- | Gentile | Sarda |
| 0.0148422 | -2.489 | EE873971.1 | NM_001083800 | IGLL1 | Gentile | Sarda |
| 0.0107907 | -2.339 | DY479414.1 | -- | -- | Gentile | Sarda |
| 0.00171376 | -2.275 | EE874479.1 | NM_001025317 | RPS8 | Gentile | Sarda |
| 0.00263317 | -2.249 | EE814758.1 | NM_001015592 | PFN1 | Gentile | Sarda |
| 0.00360217 | -2.164 | EE781281.1 | -- | -- | Gentile | Sarda |
| 0.0110063 | -2.07 | EE866465.1 | NM_001033614 | RPS18 | Gentile | Sarda |
| 0.0164299 | -2.067 | EE873426.1 | NM_001105455 | RPL39 | Gentile | Sarda |
| 0.0354098 | -2.015 | DY497824.1 | -- | FTH1 | Gentile | Sarda |
| 0.0306295 | -1.918 | EE788254.1 | -- | -- | Gentile | Sarda |
| 0.0184745 | -1.753 | EE856480.1 | -- | FTH1 | Gentile | Sarda |
| 0.0185062 | -1.697 | EE824030.1 | XM_615127 | ASPHD2 | Gentile | Sarda |
| 0.00474836 | -1.682 | EE874471.1 | NM_001034438 | RPS20 | Gentile | Sarda |
| 0.0434131 | -1.632 | EE865486.1 | NM_001045929 | MPV17 | Gentile | Sarda |
| 0.0250763 | -1.588 | EE831966.1 | -- | -- | Gentile | Sarda |
| 0.019839 | -1.582 | EE866322.1 | XM_615898 | VAV3 | Gentile | Sarda |
| 0.000864936 | -1.57 | EE848574.1 | -- | -- | Gentile | Sarda |
| 0.0424348 | -1.568 | EE774810.1 | XM_001373571 | LOC100021448 | Gentile | Sarda |
| 0.0043326 | -1.546 | EE866312.1 | XM_583460 | RPUSD2 | Gentile | Sarda |
| 0.0440448 | -1.522 | EE862726.1 | XM_001787912 | PLEKHA2 | Gentile | Sarda |
| 0.0263277 | -1.52 | DY485409.1 | -- | -- | Gentile | Sarda |
| 0.04731 | -1.514 | EE862521.1 | NM_001076831 | COL3A1 | Gentile | Sarda |
| 0.0135288 | -1.509 | EE750744.1 | XM_865008 | ERBB2IP | Gentile | Sarda |
| 0.00245474 | -1.492 | EE831293.1 | -- | -- | Gentile | Sarda |
| 0.0390691 | -1.458 | EE831369.1 | NM_001046226 | FEM1A | Gentile | Sarda |
| 0.0449235 | -1.448 | CO202828.1 | -- | -- | Gentile | Sarda |
| 0.0107052 | -1.445 | DY484904.1 | -- | -- | Gentile | Sarda |
| 0.0275188 | -1.437 | EE871094.1 | -- | -- | Gentile | Sarda |
| 0.0279427 | -1.436 | EE864971.1 | NM_174590 | PTPN13 | Gentile | Sarda |
| 0.0267974 | -1.432 | EE792695.1 | NM_001101894 | FBXO11 | Gentile | Sarda |
| 0.000833469 | -1.419 | EE816833.1 | NM_001075714 | LOC515452 | Gentile | Sarda |
| 0.000176532 | -1.418 | EE874214.1 | NM_003032 | ST6GAL1 | Gentile | Sarda |
| 0.0471172 | -1.404 | EE777222.1 | NM_001001441 | TNNT3 | Gentile | Sarda |
| 0.0401322 | -1.401 | EE770300.1 | NM_001034333 | SAT1 | Gentile | Sarda |
| 0.00551675 | -1.4 | DY513982.1 | NM_001076011 | ITPKC | Gentile | Sarda |
| 0.0103614 | -1.398 | EE802605.1 | NM_001078161 | LOC777786 | Gentile | Sarda |
| 0.0244517 | -1.389 | EE849733.1 | -- | -- | Gentile | Sarda |
| 0.00575702 | -1.386 | EE830948.1 | XM_001790594 | LOC100139162 | Gentile | Sarda |
| 0.0251925 | -1.377 | EE873625.1 | NM_001079783 | UBE2E3 | Gentile | Sarda |
| 0.00381358 | -1.374 | EE816897.1 | -- | -- | Gentile | Sarda |
| 0.00653387 | -1.373 | EE837747.1 | NM_001075367 | ALDH2 | Gentile | Sarda |
| 0.0100565 | -1.373 | EE846386.1 | NM_001101154 | ALAS1 | Gentile | Sarda |
| 0.0496638 | -1.37 | DY500795.1 | NM_001035376 | MEOX1 | Gentile | Sarda |
| 0.0090203 | -1.367 | EE825590.1 | XM_001109283 | LOC712430 | Gentile | Sarda |
| 0.015555 | -1.361 | DY512463.1 | NM_001101929 | HK3 | Gentile | Sarda |
| 0.0104062 | -1.358 | EE807632.1 | XM_612129 | ATP2A2 | Gentile | Sarda |
| 0.00419809 | -1.357 | EE798194.1 | XM_001250724 | PDCL | Gentile | Sarda |
| 0.0129818 | -1.347 | EE755345.1 | XM_865894 | MORC3 | Gentile | Sarda |
| 0.0138409 | -1.344 | EE795474.1 | NM_001105041 | RUSC1 | Gentile | Sarda |
| 0.0268807 | -1.342 | EE864960.1 | NM_001045971 | SPINT2 | Gentile | Sarda |
| 0.0404747 | -1.339 | EE812525.1 | NM_001102149 | MGC159954 | Gentile | Sarda |
| 0.0464112 | -1.339 | EE869934.1 | NM_001100314 | PIK3R4 | Gentile | Sarda |
| 0.027626 | -1.338 | EE792100.1 | -- | -- | Gentile | Sarda |
| 0.00996729 | -1.337 | EE864412.1 | NM_001113764 | TYK2 | Gentile | Sarda |
| 0.0121423 | -1.331 | EE832631.1 | NM_001034743 | RAB5C | Gentile | Sarda |
| 0.0318396 | -1.329 | EE831575.1 | NM_001046043 | ANGPTL4 | Gentile | Sarda |
| 0.035704 | -1.325 | EE767566.1 | XM_001089198 | beta- galactosidase | Gentile | Sarda |
| 0.000597784 | -1.32 | EE857107.1 | -- | -- | Gentile | Sarda |
| 0.0323903 | -1.319 | EE872862.1 | NM_001075700 | RAP2C | Gentile | Sarda |
| 0.0421994 | -1.319 | EE841857.1 | NM_001042682 | RERE | Gentile | Sarda |
| 0.0208483 | -1.309 | EE810668.1 | NM_001099167 | TMEM149 | Gentile | Sarda |
| 0.0279321 | -1.309 | EE798509.1 | -- | -- | Gentile | Sarda |
| 0.0326586 | -1.307 | EE842831.1 | -- | -- | Gentile | Sarda |
| 0.00133131 | -1.304 | DY521037.1 | XM_001788744 | LOC513508 | Gentile | Sarda |
| 0.0189923 | -1.304 | EE867731.1 | -- | -- | Gentile | Sarda |
| 0.0237616 | -1.302 | EE816414.1 | XM_614378 | SPRYD3 | Gentile | Sarda |
| 0.043391 | -1.302 | EE858582.1 | NM_001077971 | GRSF1 | Gentile | Sarda |
| 0.00992968 | -1.301 | EE862241.1 | NM_175610 | TJP1 | Gentile | Sarda |
| 0.0487321 | 1.301 | EE830752.1 | XM_001789168 | LOC100138505 | Sarda | Gentile |
| 0.0153892 | 1.302 | EE770765.1 | XM_001787762 | HEXB | Sarda | Gentile |
| 0.0217868 | 1.303 | EE851241.1 | NM_138782 | FCHO2 | Sarda | Gentile |
| 0.0167642 | 1.303 | EE801658.1 | NM_001015555 | AUP1 | Sarda | Gentile |
| 0.0430405 | 1.304 | EE831852.1 | NM_001102287 | FANCG | Sarda | Gentile |
| 0.0337551 | 1.305 | EE819075.1 | NM_001075848 | RASGRP3 | Sarda | Gentile |
| 0.0152904 | 1.307 | EE759878.1 | -- | -- | Sarda | Gentile |
| 0.00792688 | 1.307 | EE869797.1 | XM_001789365 | LOC783484 | Sarda | Gentile |
| 0.0305344 | 1.308 | EE839816.1 | NM_001038561 | RPUSD3 | Sarda | Gentile |
| 0.00727823 | 1.309 | DY520684.1 | XM_001720318 | LOC100129623 | Sarda | Gentile |
| 0.0103058 | 1.31 | EE845343.1 | XM_001787123 | CALCA | Sarda | Gentile |
| 0.000212856 | 1.311 | EE867028.1 | NM_001101171 | ABI2 | Sarda | Gentile |
| 0.0198107 | 1.312 | EE782033.1 | XM_001256327 | LOC789629 | Sarda | Gentile |
| 0.0405272 | 1.313 | EE783717.1 | -- | -- | Sarda | Gentile |
| 0.00239957 | 1.313 | CF117405.1 | XM_599530 | LOC521270 | Sarda | Gentile |
| 0.0133575 | 1.315 | EE849952.1 | -- | -- | Sarda | Gentile |
| 0.0174528 | 1.315 | EE770796.1 | -- | -- | Sarda | Gentile |
| 0.0196397 | 1.315 | EE871964.1 | -- | -- | Sarda | Gentile |
| 0.0211185 | 1.315 | EE873622.1 | NM_174718 | PNN | Sarda | Gentile |
| 0.0174924 | 1.317 | EE866027.1 | NM_053043 | RBM33 | Sarda | Gentile |
| 0.00224632 | 1.319 | EE833196.1 | -- | -- | Sarda | Gentile |
| 0.0077293 | 1.319 | EE746291.1 | XR_042970 | LOC532848 | Sarda | Gentile |
| 0.0453195 | 1.321 | EE830242.1 | -- | -- | Sarda | Gentile |
| 0.00152261 | 1.321 | EE848826.1 | XM_001788615 | ANAPC11 | Sarda | Gentile |
| 0.0371348 | 1.321 | EE861720.1 | -- | -- | Sarda | Gentile |
| 0.0124763 | 1.322 | EE840376.1 | XR_027670 | LOC539015 | Sarda | Gentile |
| 0.0110695 | 1.323 | EE836611.1 | NM_001101080 | ADAMTS1 | Sarda | Gentile |
| 0.00869526 | 1.324 | EE854385.1 | -- | -- | Sarda | Gentile |
| 0.0470865 | 1.325 | EE824979.1 | NM_001286 | CLCN6 | Sarda | Gentile |
| 0.000591604 | 1.326 | EE834601.1 | -- | -- | Sarda | Gentile |
| 0.0164817 | 1.326 | EE872298.1 | XM_875686 | CLDND1 | Sarda | Gentile |
| 0.0129429 | 1.327 | EE865545.1 | NM_001102062 | WDR75 | Sarda | Gentile |
| 0.00936087 | 1.33 | EE856712.1 | XM_001788055 | LOC100138621 | Sarda | Gentile |
| 0.0422128 | 1.332 | EE836140.1 | XM_001789542 | LOC100139498 | Sarda | Gentile |
| 0.00099139 | 1.334 | EE865157.1 | NM_018509 | LRRC59 | Sarda | Gentile |
| 0.0419962 | 1.335 | EE773093.1 | -- | -- | Sarda | Gentile |
| 0.0041349 | 1.335 | EE822639.1 | NM_001034368 | ABHD4 | Sarda | Gentile |
| 0.0191105 | 1.337 | EE842849.1 | XR_042867 | ZNF134 | Sarda | Gentile |
| 0.0151336 | 1.338 | EE825761.1 | XM_001256069 | LOC789273 | Sarda | Gentile |
| 0.0287527 | 1.338 | EE827215.1 | NM_001002892 | ST3GAL2 | Sarda | Gentile |
| 0.0106897 | 1.339 | EE861357.1 | XM_001255930 | LOC789066 | Sarda | Gentile |
| 0.00547498 | 1.339 | EE796870.1 | XM_614279 | LGI2 | Sarda | Gentile |
| 0.0325118 | 1.341 | EE784162.1 | -- | -- | Sarda | Gentile |
| 0.0130226 | 1.342 | EE795222.1 | -- | IFNAR1E | Sarda | Gentile |
| 0.0310787 | 1.342 | EE793726.1 | -- | -- | Sarda | Gentile |
| 0.0225565 | 1.343 | EE780347.1 | -- | -- | Sarda | Gentile |
| 0.0041103 | 1.343 | EE826336.1 | NM_001076049 | EFEMP2 | Sarda | Gentile |
| 0.00847258 | 1.345 | EE847787.1 | NM_001075670 | SMAP2 | Sarda | Gentile |
| 0.0144838 | 1.348 | EE848020.1 | XM_593447 | CCDC61 | Sarda | Gentile |
| 0.0251965 | 1.348 | DY491137.1 | -- | -- | Sarda | Gentile |
| 0.01472 | 1.35 | EE747969.1 | -- | -- | Sarda | Gentile |
| 0.0230545 | 1.355 | EE872727.1 | NM_001078102 | DNAJC24 | Sarda | Gentile |
| 0.0340345 | 1.357 | EE797130.1 | NM_020772 | NUFIP2 | Sarda | Gentile |
| 0.0400043 | 1.357 | EE782700.1 | -- | -- | Sarda | Gentile |
| 0.0199472 | 1.358 | EE852157.1 | NM_172127 | CAMK2D | Sarda | Gentile |
| 0.0284178 | 1.36 | EE837214.1 | NM_001098003 | TMCO3 | Sarda | Gentile |
| 0.0152216 | 1.36 | EE844290.1 | NM_001102498 | NKAPL | Sarda | Gentile |
| 0.000664005 | 1.36 | EE816910.1 | -- | -- | Sarda | Gentile |
| 0.0129656 | 1.365 | EE813986.1 | XM_584123 | LOC538993 | Sarda | Gentile |
| 0.00239596 | 1.368 | EE833638.1 | -- | -- | Sarda | Gentile |
| 0.00473005 | 1.371 | EE776285.1 | XM_600379 | AHDC1 | Sarda | Gentile |
| 0.0313393 | 1.372 | EE837130.1 | NM_001025345 | MCM7 | Sarda | Gentile |
| 0.00257839 | 1.373 | DY522523.1 | NM_001102074 | QSOX1 | Sarda | Gentile |
| 0.0308861 | 1.373 | EE868991.1 | NM_001034633 | SLC3A1 | Sarda | Gentile |
| 0.0407681 | 1.375 | EE746824.1 | XM_865771 | RUNX1 | Sarda | Gentile |
| 0.0393277 | 1.379 | EE794485.1 | -- | -- | Sarda | Gentile |
| 0.0307812 | 1.38 | EE815257.1 | NM_001046011 | CD37 | Sarda | Gentile |
| 0.0184587 | 1.384 | EE816699.1 | NM_001083429 | PANK4 | Sarda | Gentile |
| 0.000606351 | 1.384 | EE830551.1 | NM_001037607 | ARFRP1 | Sarda | Gentile |
| 0.0424528 | 1.385 | EE753287.1 | -- | -- | Sarda | Gentile |
| 0.0213158 | 1.385 | EE826333.1 | XM_590179 | DENND2A | Sarda | Gentile |
| 0.0264585 | 1.386 | EE851940.1 | NM_012319 | SLC39A6 | Sarda | Gentile |
| 0.00647171 | 1.387 | EE790636.1 | NM_001045969 | ALDH7A1 | Sarda | Gentile |
| 0.0226806 | 1.388 | CN824197.1 | NM_053064 | GNG2 | Sarda | Gentile |
| 0.0387653 | 1.388 | EE813255.1 | NM_030935 | TSC22D4 | Sarda | Gentile |
| 0.00174915 | 1.393 | EE791965.1 | NM_001046497 | MAT1A | Sarda | Gentile |
| 0.0264875 | 1.397 | DY490978.1 | -- | NDUFS2 | Sarda | Gentile |
| 0.00295738 | 1.398 | EE829627.1 | NM_001077854 | MS4A1 | Sarda | Gentile |
| 0.0224081 | 1.399 | EE854207.1 | NM_001077104 | KRTAP3-1 | Sarda | Gentile |
| 0.0470249 | 1.402 | EE858765.1 | NM_001083703 | RNF185 | Sarda | Gentile |
| 0.00371868 | 1.402 | EE832497.1 | NM_001078041 | PLD3 | Sarda | Gentile |
| 0.0216581 | 1.402 | EE866310.1 | NM_001099072 | UNC45A | Sarda | Gentile |
| 0.010359 | 1.403 | EE808144.1 | XM_001250150 | TAF2 | Sarda | Gentile |
| 0.0317868 | 1.407 | EE833224.1 | -- | CDH5 | Sarda | Gentile |
| 0.00506313 | 1.408 | EE794195.1 | -- | -- | Sarda | Gentile |
| 0.0323786 | 1.408 | DY478310.1 | NM_000088 | COL1A1 | Sarda | Gentile |
| 0.00625366 | 1.41 | EE825745.1 | NM_001102546 | PDE4B | Sarda | Gentile |
| 0.0396624 | 1.412 | EE764887.1 | -- | -- | Sarda | Gentile |
| 0.0240626 | 1.413 | EE818092.1 | NM_001102238 | METTL3 | Sarda | Gentile |
| 0.000452341 | 1.416 | EE843072.1 | NM_178140 | PDZD2 | Sarda | Gentile |
| 0.00772543 | 1.418 | EE856741.1 | NM_001075176 | RPA1 | Sarda | Gentile |
| 0.0055955 | 1.421 | EE823634.1 | -- | -- | Sarda | Gentile |
| 0.0140254 | 1.422 | EE864563.1 | NM_001034339 | IL11RA | Sarda | Gentile |
| 4.02e-05 | 1.424 | DY480261.1 | -- | -- | Sarda | Gentile |
| 0.0444903 | 1.428 | EE816651.1 | NM_001083414 | WWP2 | Sarda | Gentile |
| 0.000877121 | 1.432 | EE870673.1 | -- | -- | Sarda | Gentile |
| 0.0154273 | 1.442 | EE766357.1 | XM_585246 | KIF11 | Sarda | Gentile |
| 0.00750741 | 1.446 | EE825953.1 | XM_865238 | EXOC2 | Sarda | Gentile |
| 0.00222257 | 1.446 | EE788062.1 | NM_019863 | F8 | Sarda | Gentile |
| 0.00743356 | 1.446 | EE747821.1 | -- | -- | Sarda | Gentile |
| 0.0372742 | 1.447 | EE871308.1 | -- | -- | Sarda | Gentile |
| 0.015438 | 1.448 | EE851254.1 | -- | -- | Sarda | Gentile |
| 0.0081182 | 1.451 | DY520937.1 | NM_001102035 | CERCAM | Sarda | Gentile |
| 0.00371839 | 1.458 | EE873738.1 | NM_001035283 | TALDO1 | Sarda | Gentile |
| 0.00612951 | 1.458 | EE765691.1 | -- | GALN | Sarda | Gentile |
| 0.0211205 | 1.46 | EE780060.1 | NM_001012281 | CFLAR | Sarda | Gentile |
| 0.0149215 | 1.461 | EE821548.1 | NM_001046390 | TES | Sarda | Gentile |
| 0.0337644 | 1.464 | BG874259.1 | -- | -- | Sarda | Gentile |
| 0.0347533 | 1.466 | DY514734.1 | XM_589271 | FBLN2 | Sarda | Gentile |
| 0.00652737 | 1.469 | EE783524.1 | -- | -- | Sarda | Gentile |
| 0.0121699 | 1.469 | EE828474.1 | XM_870386 | SH3BP5 | Sarda | Gentile |
| 0.00171057 | 1.477 | DY504539.1 | -- | -- | Sarda | Gentile |
| 0.00492899 | 1.478 | EE856049.1 | XM_865072 | PIGT | Sarda | Gentile |
| 0.00154659 | 1.479 | EE871601.1 | -- | -- | Sarda | Gentile |
| 0.0138137 | 1.48 | EE831423.1 | XM_001788882 | LOC789539 | Sarda | Gentile |
| 0.00952563 | 1.481 | EE829269.1 | NM_001014865 | DRG2 | Sarda | Gentile |
| 0.00808543 | 1.489 | EE818202.1 | XM_602855 | GALNT7 | Sarda | Gentile |
| 0.0212484 | 1.491 | DY485302.1 | NM_001024824 | RIPK5 | Sarda | Gentile |
| 0.0204847 | 1.498 | EE871638.1 | XM_870378 | CAPN7 | Sarda | Gentile |
| 0.0185014 | 1.511 | DY480855.1 | XM_001787789 | LOC534471 | Sarda | Gentile |
| 0.0161177 | 1.514 | EE748326.1 | NM_001046194 | CDCA2 | Sarda | Gentile |
| 0.00825915 | 1.514 | DY496078.1 | XM_001789157 | LOC508459 | Sarda | Gentile |
| 0.0193849 | 1.517 | EE841331.1 | NM_001039591 | USP9X | Sarda | Gentile |
| 0.00544002 | 1.54 | EE767854.1 | NM_001076330 | PRSS16 | Sarda | Gentile |
| 0.00694391 | 1.541 | EE820835.1 | NM_001045866 | BRD2 | Sarda | Gentile |
| 0.048183 | 1.544 | EE760222.1 | XM_001252101 | LOC784704 | Sarda | Gentile |
| 0.00585242 | 1.551 | DY491388.1 | XM_596546 | SH3PXD2B | Sarda | Gentile |
| 0.0242248 | 1.554 | EE749164.1 | NM_174676 | RASA3 | Sarda | Gentile |
| 0.0179786 | 1.561 | EE750374.1 | -- | -- | Sarda | Gentile |
| 0.0452829 | 1.564 | EE857270.1 | XM_596854 | PLEK | Sarda | Gentile |
| 0.036256 | 1.566 | EE798015.1 | -- | -- | Sarda | Gentile |
| 0.00057357 | 1.579 | EE856496.1 | NM_001046252 | LITAF | Sarda | Gentile |
| 0.0123283 | 1.599 | EE825369.1 | NM_001081602 | STK38 | Sarda | Gentile |
| 0.00833088 | 1.603 | EE812445.1 | XM_001254977 | LRRCC1 | Sarda | Gentile |
| 0.0428815 | 1.612 | EE826810.1 | NM_001035012 | RIPK1 | Sarda | Gentile |
| 0.00179087 | 1.642 | DY500867.1 | XM_001254158 | ZNF318 | Sarda | Gentile |
| 0.00631294 | 1.682 | EE849102.1 | -- | -- | Sarda | Gentile |
| 7.62e-05 | 1.877 | EE799074.1 | NM_174703 | TNXB | Sarda | Gentile |
| 0.0144325 | 1.931 | EE791703.1 | -- | -- | Sarda | Gentile |
| 0.0124589 | 2.018 | EE874444.1 | -- | CSN2 | Sarda | Gentile |
| 0.0468452 | 2.039 | EE816347.1 | NM_001075485 | LYSMD2 | Sarda | Gentile |
| 0.0228427 | 2.078 | EE874341.1 | -- | LOC443383 | Sarda | Gentile |
| 0.0176061 | 2.197 | EE874443.1 | -- | CSN3 | Sarda | Gentile |
| pvalue | FC | EST | RefSeq | Gene | UP | DOWN |
|---|---|---|---|---|---|---|
| 0.0262055 | -1.467 | EE855884.1 | NM_001038689 | C5H12orf45 | Gentile | Sarda |
| 0.0440456 | -1.391 | EE804883.1 | NM_172216 | CAMKK2 | Gentile | Sarda |
| 0.0295858 | -1.37 | EE752417.1 | NM_174438 | PROS1 | Gentile | Sarda |
| 0.00912544 | -1.344 | EE805588.1 | NM_001105615 | CENPP | Gentile | Sarda |
| 0.0356366 | -1.341 | CF117455.1 | XM_001254445 | FBXO48 | Gentile | Sarda |
| 0.0153359 | -1.332 | EE831205.1 | NM_001046346 | WDR1 | Gentile | Sarda |
| 0.0167085 | -1.304 | EE872615.1 | NM_001099859 | EIF4G2 | Gentile | Sarda |
| 0.00236899 | -1.302 | EE803274.1 | NM_001102100 | LENG8 | Gentile | Sarda |
| 0.0220397 | 1.303 | EE794531.1 | NM_001083487 | DAGLB | Sarda | Gentile |
| 0.0117502 | 1.305 | CD288635.1 | NM_001083793 | SMAGP | Sarda | Gentile |
| 0.00915309 | 1.308 | EE811805.1 | -- | -- | Sarda | Gentile |
| 0.0480977 | 1.314 | DY516851.1 | XR_028016 | LOC539596 | Sarda | Gentile |
| 0.00597485 | 1.316 | EE869114.1 | -- | -- | Sarda | Gentile |
| 0.0159031 | 1.316 | EE749850.1 | XM_001249987 | EEF1A1 | Sarda | Gentile |
| 0.0483209 | 1.32 | EE810406.1 | NM_001045938 | AP1B1 | Sarda | Gentile |
| 0.0164487 | 1.322 | EE840745.1 | NM_194442 | LBR | Sarda | Gentile |
| 0.0194088 | 1.323 | EE752798.1 | NM_001083462 | SEC22A | Sarda | Gentile |
| 0.0205422 | 1.324 | DY514991.1 | XM_001251051 | LOC782414 | Sarda | Gentile |
| 0.00825489 | 1.325 | EE872139.1 | XR_027898 | LOC784355 | Sarda | Gentile |
| 0.000861353 | 1.327 | EE858050.1 | XM_580387 | PRKD3 | Sarda | Gentile |
| 0.0386497 | 1.33 | EE788388.1 | -- | -- | Sarda | Gentile |
| 0.000485662 | 1.335 | EE844249.1 | NM_001075142 | IL4R | Sarda | Gentile |
| 0.00842772 | 1.336 | EE816344.1 | -- | -- | Sarda | Gentile |
| 0.0290668 | 1.338 | EE874443.1 | -- | CSN3 | Sarda | Gentile |
| 0.032805 | 1.342 | EE834071.1 | XM_583748 | TBX21 | Sarda | Gentile |
| 0.00363329 | 1.359 | EE860008.1 | XM_613386 | ZNF532 | Sarda | Gentile |
| 0.000451745 | 1.361 | DY520339.1 | NM_174520 | COL1A2 | Sarda | Gentile |
| 0.028263 | 1.362 | DY480878.1 | -- | -- | Sarda | Gentile |
| 0.046296 | 1.392 | EE820416.1 | -- | -- | Sarda | Gentile |
| 0.00529847 | 1.405 | DY520664.1 | NM_001075474 | MRPS16 | Sarda | Gentile |
| 0.0195754 | 1.417 | CF117857.1 | NM_001098860 | RAMP2 | Sarda | Gentile |
| 0.00072133 | 1.456 | CD287057.1 | -- | -- | Sarda | Gentile |
| 0.00198483 | 1.465 | DY479000.1 | -- | -- | Sarda | Gentile |
| 0.022287 | 1.47 | EE801908.1 | NM_001046214 | ACBD4 | Sarda | Gentile |
| 0.0105584 | 1.484 | EE815399.1 | XM_589331 | TGOLN2 | Sarda | Gentile |
| 0.00657655 | 1.518 | DY497824.1 | -- | FTH1 | Sarda | Gentile |
References and Notes
- Allen, J.C.; Keller, R.P.; Archer, P.; Neville, M.C. Studies in human lactation: Milk composition and daily secretion rates of macronutrients in the first year of lactation. Am. J. Clin. Nutr. 1991, 54, 69–80. [Google Scholar]
- Neville, M.C. Anatomy and physiology of lactation. Pediatr. Clin. N. Am. 2001, 48, 13–34. [Google Scholar]
- Capuco, A.V.; Akers, R.M. The origin and evolution of lactation. J. Biol. 2009, 8 art. no. 37. [Google Scholar]
- Chadwick, R. Nutrigenomics, individualism and public health. Proc. Nutr. Soc. 2004, 63, 161–166. [Google Scholar] [Green Version]
- Van Knegsel, A.T.M.; Van Den Brand, H.; Dijkstra, J.; Van Straalen, W.M.; Heetkamp, M.J.W.; Tamminga, S.; Kemp, B. Dietary energy source in dairy cows in early lactation: Energy partitioning and milk composition. J. Dairy Sci. 2007, 90, 1467–1476. [Google Scholar]
- Van Knegsel, A.T.M.; Van Den Brand, H.; Graat, E.A.M.; Dijkstra, J.; Jorritsma, R.; Decuypere, E.; Tamminga, S.; Kemp, B. Dietary energy source in dairy cows in early lactation: Metabolites and metabolic hormones. J. Dairy Sci. 2007, 90, 1477–1485. [Google Scholar]
- Palmquist, D.L.; Beaulieu, A.D.; Barbano, D.M. Feed and animal factors influencing milk fat composition. J. Dairy Sci. 1993, 76, 1753–1771. [Google Scholar]
- Kim, S.W.; Wu, G. Regulatory role for amino acids in mammary gland growth and milk synthesis. Amino Acids 2009, 37, 89–95. [Google Scholar]
- Andrechek, E.R.; Mori, S.; Rempel, R.E.; Chang, J.T.; Nevins, J.R. Patterns of cell signaling pathway activation that characterize mammary development. Development 2008, 135, 2403–2413. [Google Scholar]
- Hartmann, P.E. Changes in the composition and yield of the mammary secretion of cows during the initiation of lactation. J. Endocrinol. 1973, 59, 231–247. [Google Scholar]
- Hartmann, P.E.; Trevethan, P.; Shelton, J.N. Progesterone and oestrogen and the initiation of lactation in ewes. J. Endocrinol. 1973, 59, 249–259. [Google Scholar]
- Neville, M.C.; McFadden, T.B.; Forsyth, I. Hormonal regulation of mammary differentiation and milk secretion. J. Mammary Gland Biol. 2002, 7, 49–66. [Google Scholar]
- McManaman, J.L.; Neville, M.C. Mammary physiology and milk secretion. Ad. Drug Deliver Rev. 2003, 55, 629–641. [Google Scholar]
- Capuco, A.V.; Wood, D.L.; Baldwin, R.; Mcleod, K.; Paape, M.J. Mammary cell number, proliferation, and apoptosis during a bovine lactation: Relation to milk production and effect of bST. J. Dairy Sci. 2001, 84, 2177–2187. [Google Scholar] [CrossRef] [PubMed]
- Sorensen, M.T.; Nørgaard, J.V.; Theil, P.K.; Vestergaard, M.; Sejrsen, K. Cell turnover and activity in mammary tissue during lactation and the dry period in dairy cows. J. Dairy Sci. 2006, 89, 4632–4639. [Google Scholar]
- Finucane, K.A.; McFadden, T.B.; Bond, J.P.; Kennelly, J.J.; Zhao, F.Q. Onset of lactation in the bovine mammary gland: Gene expression profiling indicates a strong inhibition of gene expression in cell proliferation. Funct. Integr. Genomic. 2008, 8, 251–264. [Google Scholar]
- Baxter, F.O.; Neoh, K.; Tevendale, M.C. The beginning of the end: Death signaling in early involution. J. Mammary Gland Biol. 2007, 12, 3–13. [Google Scholar]
- Stein, T.; Salomonis, N.; Gusterson, B.A. Mammary gland involution as a multi-step process. J. Mammary Gland Biol. 2007, 12, 25–35. [Google Scholar] [CrossRef]
- Capuco, A.V.; Akers, R.M. Mammary Involution in Dairy Animals. J. Mammary Gland Biol 1999, 4, 37–144. [Google Scholar]
- Haenlein, G.F.W. Past, present, and future perspectives of small ruminant dairy research. J. Dairy Sci. 2001, 84, 2097–2115. [Google Scholar] [CrossRef] [PubMed]
- Signorelli, F.; Contarini, G.; Annicchiarico, G.; Napolitano, F.; Orrù, L.; Catillo, G.; Haenlein, G.F.W.; Moioli, B. Breed differences in sheep milk fatty acid profiles: Opportunities for sustainable use of animal genetic resources. Small Ruminant Res. 2008, 78, 24–31. [Google Scholar]
- Moioli, B.; D'Andrea, M.; Pilla, F. Candidate genes affecting sheep and goat milk quality. Small Ruminant Res. 2007, 68, 179–192. [Google Scholar]
- Kaput, J.; Rodriguez, R.L. Nutritional genomics: The next frontier in the postgenomic era. Phys. Genomic. 2004, 16, 166–177. [Google Scholar]
- Kato, H.; Saito, K.; Kimura, T. A perspective on DNA microarray technology in food and nutritional science. Curr. Opin. Clin. Nutr. 2005, 8, 516–522. [Google Scholar]
- Zduńczyk, Z.; Pareek, Ch.S. Application of nutrigenomics tools in animal feeding and nutritional research. J. Anim. Feed Sci. 2009, 18, 13–16. [Google Scholar]
- Pariset, L.; Chillemi, G.; Bongiorni, S.; Spica, V.R.; Valentini, A. Microarrays and high-throughput transcriptomic analysis in species with incomplete availability of genomic sequences. New Biotech. 2009, 25, 272–279. [Google Scholar]
- Bongiorni, S.; Chillemi, G.; Prosperini, G.; Bueno, S.; Signorelli, F.; Moioli, B.; Pariset, L. Transcriptomic analysis of two sheep breeds during lactation, using a new custom microarray platform. Ital. J. Anim. Sci. 2009, 8, 33–35. [Google Scholar]
- Katz, E.; Streuli, C.H. The extracellular matrix as an adhesion checkpoint for mammary epithelial function. Inter. J. Biochem. Cell B. 2007, 39, 715–726. [Google Scholar]
- Wilde, C.J.; Quarrie, L.H.; Tonner, E.; Flint, D.J.; Peaker, M. Mammary apoptosis. Livest. Prod. Sci. 1997, 50, 29–37. [Google Scholar]
- Wilde, C.J.; Addey, C.V.P.; Li, P.; Fernig, D.G. Programmed cell death in bovine mammary tissue during lactation and involution. Exp. Physiol. 1997, 82, 943–953. [Google Scholar]
- Suchyta, S.P.; Sipkovsky, S.; Halgren, R.G.; Kruska, R.; Elftman, M.; Weber-Nielsen, M.; Vandehaar, M.J.B; Coussens, P.M. Bovine mammary gene expression profiling using a cDNA microarray enhanced for mammary-specific transcripts. Phys. Genomic 2004, 16, 8–18. [Google Scholar]
- Lemay, D.G.; Neville, M.C.; Rudolph, M.C.; Pollard, K.S.; German, J.B. Gene regulatory networks in lactation: Identification of global principles using bioinformatics. BMC Syst. Biol. 2007, 1 art. no. 56. [Google Scholar]
- Rosano, T.G.; Jones, D.H. Developmental changes in mitochondria during the transition into lactation in the mouse mammary gland. I. Behavior on isopycnic gradient centrifugation. J. Cell Biol. 1976, 69, 573–580. [Google Scholar]
- Rosano, T.G.; Lee, S.K.; Jones, D.H. Developmental changes in mitochondria during the transition into lactation in the mouse mammary gland. II. Membrane marker enzymes and membrane ultrastructure. J. Cell Biol. 1976, 69, 581–588. [Google Scholar]
- Fontecha, J.; Mayo, I.; Toledano, G.; Juárez, M. Use of changes in triacylglycerols during ripening of cheeses with high lipolysis levels for detection of milk fat authenticity. Int. Dairy J. 2006, 16, 1498–1504. [Google Scholar]
- Fang, Y.; Brass, A.; Hoyle, D.C.; Hayes, A.; Bashein, A.; Oliver, S.G.; Waddingtong, D.; Rattray, M. A model-based analysis of microarray experimental error and normalisation. Nucleic Acids Res. 2003, 31, e96. [Google Scholar]
- Yang, Y.H.; Dudoit, S.; Luu, P.; Speed, T.P. Normalization for cDNAmicroarray data. In Microarrays: optical technologies and informatics; Bittner, M., Chen, Y., Dorsel, A., Dougherty, E.R., Eds.; SPIE: San Jose, CA, USA, 2001; pp. 141–152. [Google Scholar]
- Benjamini, Y.; Hochberg, Y. Controlling the false discovery rate: a practical and powerful approach to multiple testing. J. R. Stat. Soc. 1995, 57, 289–300. [Google Scholar]
- Khatri, P.; Drǎghici, S. Ontological analysis of gene expression data: Current tools, limitations, and open problems. Bioinformatics 2005, 21, 3587–3595. [Google Scholar] [CrossRef] [PubMed]
- Ha, J.K.; Lindsay, R.C. Release of volatile branched-chain and other fatty acids from ruminant milk fats by various lipases. J. Dairy Sci. 1993, 76, 677–690. [Google Scholar]
© 2009 by the authors; licensee Molecular Diversity Preservation International, Basel, Switzerland. This article is an open-access article distributed under the terms and conditions of the Creative Commons Attribution license (http://creativecommons.org/licenses/by/3.0/).
Share and Cite
Bongiorni, S.; Chillemi, G.; Prosperini, G.; Bueno, S.; Valentini, A.; Pariset, L. A Tool for Sheep Product Quality: Custom Microarrays from Public Databases. Nutrients 2009, 1, 235-250. https://doi.org/10.3390/nu1020235
Bongiorni S, Chillemi G, Prosperini G, Bueno S, Valentini A, Pariset L. A Tool for Sheep Product Quality: Custom Microarrays from Public Databases. Nutrients. 2009; 1(2):235-250. https://doi.org/10.3390/nu1020235
Chicago/Turabian StyleBongiorni, Silvia, Giovanni Chillemi, Gianluca Prosperini, Susana Bueno, Alessio Valentini, and Lorraine Pariset. 2009. "A Tool for Sheep Product Quality: Custom Microarrays from Public Databases" Nutrients 1, no. 2: 235-250. https://doi.org/10.3390/nu1020235