
SHAP-Based Interpretable Object Detection Method for Satellite Imagery


Department of Civil Engineering, The University of Tokyo, 7-3-1 Hongo, Bunkyo-ku, Tokyo 113-8656, Japan
*
Author to whom correspondence should be addressed.
Remote Sens. 2022, 14(9), 1970; https://doi.org/10.3390/rs14091970
Submission received: 11 March 2022
/
Revised: 15 April 2022
/
Accepted: 17 April 2022
/
Published: 19 April 2022
(This article belongs to the Special Issue Explainable Deep Neural Networks for Remote Sensing Image Understanding)
Abstract
:There is a growing need for algorithms to automatically detect objects in satellite images. Object detection algorithms using deep learning have demonstrated a significant improvement in object detection performance. However, deep-learning models have difficulty in interpreting the features for inference. This difficulty is practically problematic when analyzing earth-observation images, which are often used as evidence for public decision-making. In addition, for the same reason, it is difficult to set an explicit policy or criteria to improve the models. To deal with these challenges, we introduce a feature attribution method that defines an approximate model and calculates the attribution of input features to the output of a deep-learning model. For the object detection models of satellite images with complex textures, we propose a method to visualize the basis of inference using pixel-wise feature attribution. Furthermore, we propose new methods for model evaluation, regularization, and data selection, based on feature attribution. Experimental results demonstrate the feasibility of the proposed methods for basis visualization and model evaluation. Moreover, the results illustrate that the model using the proposed regularization method can avoid over-fitting and achieve higher performance, and the proposed data selection method allows for the efficient selection of new training data.
1. Introduction
In recent years, many optical satellites have been planned and operated for high-resolution earth observation owing to the increasing number of image sensors they have onboard. They are making it possible to obtain higher-resolution images than before, and the constellation of many small and light satellites has made it possible to capture images at a high frequency. High-resolution satellite images have a wide range of applications; for example, they can be used to assess disaster damage, create and update topographic maps, and detect vehicle locations [1,2,3]. The availability of many satellite images through spatiotemporal high-resolution satellite observations has increased the need for algorithms to automatically recognize geographic objects [4].
Image-recognition algorithms based on deep learning (DL), especially convolutional neural networks (CNNs), have made significant progress. This is due to the large numbers of datasets used as training data [5]. The dramatic improvement in computer performance has made it possible to handle the high computational load of DL [6]. There are two main reasons for such high performance of DL in image recognition: (a) the features to be extracted are determined by learning rather than heuristically, and (b) the introduction of deeper layers in the network allows for more flexible modeling of highly nonlinear problems [7]. Because of these features, CNNs have been widely applied to general object detection models, including many geographic object detection models for satellite images [4].
However, DL models are faced with the so-called “black box” problem. The DL models have difficulty in interpreting the features used to make the inferences. The model’s features are essential for the inference, and the difficulty in interpreting them is practically problematic and highly controversial. The General Data Protection Regulation (GDPR), presented by the EU in 2018, clearly states that service providers are responsible for protecting users’ rights and ensuring appropriate interventions for data-based decisions [8]. The Defense Advanced Research Projects Agency (DARPA) is actively investing in the research and development of artificial intelligence (AI) that humans can understand and trust, such as the explainable artificial intelligence (XAI) project [9]. Considering that the analysis results of earth-observation data are often used as the evidence for public decision-making, such as urban planning and environmental monitoring, it is necessary to indicate the model’s features as the basis for model inference. Another issue owing to the same reason is that it is difficult to explicitly formulate policies and criteria for improving the models. To formulate these policies and criteria appropriately, efficient training of the models is required. Particularly for object detection model training, the cost of creating training data of object classes and regions is high; therefore, it is necessary to ensure an efficient performance by training the models with the minimum possible amount of data. Thus, the black-box problem of DL poses several issues in the application of object detection models to satellite images.
Research on XAI, which guarantees the interpretability of machine-learning models including DL, and that of input–output relationships, has been conducted to address these problems. In general, there is a trade-off between the interpretability of the inference of a machine-learning model and its general performance; it is difficult to achieve both [10]. A group of methods called feature attribution (FA) methods has been proposed to obtain the attribution of input features to the output of machine-learning models [11]. FA is an indicator that indicates the basis for an inference result of a model by approximating the model to make it easy to interpret, and it can be calculated without changing the model architecture. In the FA for DL, the most common method is to calculate the attribution of each input feature by computing the gradient of the input to the output [12]. Because simple gradients enhance the noise, several improvement methods have been proposed to reduce it [13,14,15,16,17,18,19,20]. However, most applications of FA to such DL models are limited to the simple visualization of the feature attribution. In addition, FA applications are for classifier models; there are few models to which the FA is applied for object detection. Gudovskiy et al. [21] applied the FA to Single-Shot Detector (SSD) and calculated the FA for each super-pixel defined by region segmentation to reduce noise and computational complexity. It is only applied as a visualization index, and there are challenges in its applicability when a detection target is a small object in the image, or the image texture is complex, for example, vehicles in satellite images.
Following the above background, we propose novel FA-based methods for basis visualization, model evaluation, and regularization for DL-based object detection models for satellite images. For this, the super-pixel-wise FA, presented in Gudovskiy et al. [21], is insufficient because the image texture is often complicated, and the target ground objects may appear small in the images. The proposed method sets the input feature to be the target of FA to each pixel of the image and calculates the pixel-wise FA. We also propose a method that uses FA as a qualitative basis indicator and for quantitative model evaluation and regularization. In object detection models, the object region to be detected corresponds to the feature region. The model should focus on the feature region. Accordingly, it is suggested that it is possible to quantitatively evaluate if the model focuses on the features from object regions and FA.
The attribution to features that should not be based on inference can be calculated, suggesting that the regularization term can be set to reduce the magnitude of this attribution. Attention mechanisms, which incorporate a structure that selectively learns the features to be focused on the model, are often used to improve the performance of DL models. It has also been proposed to use the saliency map of features of interest in the attention mechanism as the inference basis for the model [22]; however, this method requires changes to the architecture of the inference model itself. FA can be obtained without making any changes to the architecture of the inference model. Therefore, it is expected to have the advantage of identifying features of interest and feeding them back to the learning process without changing the architecture of the inference model.
Furthermore, FA can be used as an indicator for selecting additional training data. The learning framework for efficiently selecting additional training data is one of the methods of active learning. Active learning methods have been actively studied in recent years because the amount of data required for training increases with the advancement of DL models. However, there are few data selection methods based on FA.
The contributions of this paper can be summarized as follows:
- We present an integrated model improvement framework based on FA as a first work. The entire framework has a model-agnostic property since we use model-agnostic FA. This framework is applicable to any object detection model.
- A novel approach using pixel-wise FA for the basis visualization of DL-based object detection models in satellite images, in which texture is often complicated, and the target objects may be small, is proposed.
- A new metric for quantitatively evaluating models is developed using FA and information on object regions (bounding box) of training data. Accordingly, a quantitative evaluation can be performed to check if the model focuses on the valuable features. Existing metrics such as precision and recall can evaluate models only based on the model’s output, but the proposed metric can evaluate models based on focused input features.
- A regularization term that acts to reduce the FA of features that should not contribute to inference is formulated to feed the FA back for learning without changing the model architecture.
- A novel data selection approach is formulated by using FA to quantify the degree to which model inference is based on the valuable features of unknown training data. The proposed method can be applied to any object detection model.
Experimental results validate the effectiveness of the proposed methods for basis visualization and model evaluation. Furthermore, the results suggest that the model with the regularization method can avoid overtraining and achieve significant performance, and the data selection method allows for the efficient selection of new training data. These methods for model evaluation, regularization, and data selection are regarded as explicit criteria to improve object detection models. For more details on the implementation and experiments, please refer to our GitHub (https://github.com/hiroki-kawauchi/SHAPObjectDetection, accessed on 16 April 2022).
The rest of this paper is organized as follows: Section 2 briefly introduces FA methods and object detection models of satellite imagery. The details of the proposed methods are presented in Section 3. Section 4 describes the experimental results and presents a detailed discussion. Section 5 concludes the paper.
2. Related Work
2.1. Feature Attribution Methods
This brief review discusses FA methods for DL models and DL-based object detection models. A more general overview of FA can be found in [10,23].
2.1.1. Feature Attribution Methods for Deep Learning Models
When the inputs of a DL model are , and the outputs are (where C is the dimensionality of the output), FA is a method for determining the attribution
of each input feature to an output , where is the FA of to . Methods based on forward propagation of perturbations [19,20] and on backpropagation [13,14,15,16,17,18,19,20] have been proposed as FA methods for DL. The methods based on forward propagation of perturbations directly calculate the attribution of input features by removing, masking, or modifying some of the input features (adding perturbations); performing the forward propagation on the new input; and measuring the difference from the actual output. These methods can directly estimate the marginal effects of features; however, they tend to be computationally expensive. Therefore, methods based on backpropagation, which are more advantageous in terms of the computational complexity, have become the mainstream.
The backpropagation-based methods obtain a saliency map of input-feature attributions by back-propagating the gradient from the output to the input space; their basic framework was proposed in [12]. In this framework, referring to the weight vector in the linear-regression model, which can be interpreted as the importance vector for the corresponding feature, the explanation model:
is defined for the output of a nonlinear deep-learning model. To calculate the weight vector , the first-order Taylor series expansion of the input vector x of the output is used, and the gradient
(or its absolute value or square) is defined as the importance. Back propagation-based methods can compute the attribution of all input features in a single propagation of the network. However, it has been established that simply using the gradient as the importance may lead to inaccurate feature attribution calculation of the model due to nonlinear saturation or discontinuous or negative gradients [14]. Therefore, methods such as gradient * input [15], LRP (Layer-wise Relevance Propagation) [13], DeepLIFT [16], and IG (Integrated Gradients) [18] have been proposed to partially address such problems while allowing for an increase in computational complexity. The gradient * input method was proposed to alleviate the above problem by multiplying the input by the gradient. The IG method sets an arbitrary baseline for the input and multiplies the Riemann integral along the linear path from to x to the original feature x. In particular, this method theoretically satisfies the properties that FA should satisfy—sensitivity, implementation invariance, linearity, symmetry, and completeness [18]. Ribeiro et al. [24] proposed LIME as a unified method of FA for machine-learning models, including deep-learning models.
Lundberg and Lee [11] demonstrated that FAs, such as LRP, DeepLIFT, IG, and LIME, could be understood in a unified framework called additive feature attribution methods. They proposed the SHAP values, an additive feature attribution method that supports the Shapley value in cooperative game theory. Due to reliance on game theory, SHAP values guarantee the following specific important properties: local accuracy, missingness, and consistency in explanations. Because it is difficult to calculate the exact SHAP values, several methods have been proposed to estimate them according to the models. As an approximation to the SHAP value, Lundberg and Lee [11] proposed Gradient SHAP. Gradient SHAP computes the SHAP value by suppressing noise using SmoothGrad [25] while using IG as a base. SmoothGrad smooths the input image by generating samples with Gaussian noise added to the input image of the model, and then takes the average of the FAs calculated from these samples as the final FA. In IG, noise is generated because the path integral is linear. In contrast, Gradient SHAP ensures the nonlinearity of the path by taking random points on the path and averaging their outputs, and further suppresses the noise by SmoothGrad. Gradient SHAP is easy to implement and can compute the SHAP value with less noise and lower computation than IG. Based on these points, we use Gradient SHAP as FA in this work. Lundberg and Lee [11] only tested the validity of SHAP values as a basis for image classification models and not for object detection models.
2.1.2. Feature Attribution Methods for Object Detection Models
In the study of explainability of DL-based object detection models, several methods other than FA have also been proposed [22,26]. However, FA is the most common because theoretical analyses, such as SHAP values, have improved. Gudovskiy et al. [21] proposed an E2X framework using an IG-based designed SHAP estimator as FA and applied it to SSD trained on the VOC07+12 dataset [27].
Gudovskiy et al. [21] pointed out that noise increases in IG owing to the strong assumption of independence of features, and the following method is adopted in E2X to suppress the noise. In E2X, the image is divided into super-pixels by region segmentation, and each super-pixel is treated as an input feature. It averages out the noise in each pixel and suppresses the noise during visualization. Furthermore, E2X relaxes the above assumption by changing the Riemann integral of the linear path of IG to random sampling. Although E2X achieves effective visualization with less noise, it has several problems. First, there is no logical relationship between this super-pixel segmentation algorithm and SSD. Second, there are challenges in its applicability when a detection target is a small object in the image, or the image texture is complex, for example, in remote sensing images. Furthermore, in E2X, FA is not used as an indicator for model evaluation, regularization, or data selection.
2.2. Object Detection in Satellite Imagery
In recent years, numerous object detection approaches have been studied to detect various geospatial objects by the earth-observation community. Many of these works are based on DL-based object detection methods proposed by the computer-vision community. Generally, the existing DL-based object detection methods can be divided into two streams based on whether or not to generate region proposals [28]. The two streams are region proposal-based methods and regression-based methods. Region proposal-based methods consist of two stages for object detection. The first generates a series of candidate-region proposals that may contain objects. The second stage aims to classify the candidate-region proposals into object classes or backgrounds and adjusts the coordinates of the bounding boxes. Regression-based methods simplify the detection process into a regression problem. Compared with the region proposal-based methods, these methods are considerably simpler and computationally more efficient. Although region proposal-based methods have been used in most studies by the earth-observation community, some recent studies have been based on regression-based methods [4]. Regardless of whether the method is regression-based or region proposal-based, if it is an end-to-end DL-based model, it is easy to obtain FA using backpropagation calculation. Therefore, FA is a versatile method to ensure the explainability of DL-based object detection models for many geographic objects. In addition, the cost of creating annotation data for geographic objects is high, and there is a need for a framework for efficient learning with fewer images.
3. Method
We propose methods for visualizing the basis of inference, model evaluation, regularization, and data selection based on pixel-wise FA, as shown in Figure 1. For the above-mentioned reasons, Gradient SHAP is used as the FA. These methods can be applied to any DL-based geographic object detection model because Gradient SHAP can be applied to any DL model and is simple to implement. In Section 3.1, we outline the computation of FA by SHAP. Subsequently, the four methods for visualization of the basis of inference, evaluation, regularization, and data selection are described in Section 3.2, Section 3.3, Section 3.4 and Section 3.5, respectively.
3.1. Outline of the Computation of FA by SHAP
In the proposed method, SHAP is used to obtain FA. SHAP assumes that, in the neighborhood of an input , the output can be approximated as , where is a binary vector . SHAP uses the framework of additive feature attribution, and is represented by the following linear function
where is constant, and is the FA of to (approximately corresponding to the FA of to ). According to cooperative game theory, the additive feature attribution is uniquely determined and called the Shapley value. The additive feature attribution satisfies the three desirable properties of FA, namely, local accuracy, missingness, and consistency. However, owing to the high computational complexity of the exact solution, we use Gradient SHAP, which is an approximate SHAP value for the DL model proposed by Lundberg and Lee [11]. Gradient SHAP is a back-propagation-based method; the explanation model is defined in Equations (2) and (3). An explanation model is one of the linear additive models, as shown in Equation (4). The method of calculating the Gradient SHAP is described in detail as follows: first, we generate n samples of the input image x with Gaussian noise. Next, a random point on the path from the baseline to each sample is taken, and the gradients at these points are calculated. Finally, the average of these gradient values is calculated as FA. Thus, the Gradient SHAP for a feature is calculated as:
where and are sampled from the uniform distribution and normal distribution , respectively. Gradient SHAP can efficiently calculate noise-suppressed FA, even for the DL models, with strong nonlinearity by sampling and smoothing in the neighborhood of an input.
3.2. Visualization of the Basis of Inference
We propose a method to visualize the basis for inferring geographic object detection models using FA. In general, the outputs of an object detection model are position information, the existence probability of an object, and class probability. The existence probability or class probability of an object are set as the target of the FA calculation. Because this work focuses on remote-sensing images, in which texture is often complicated, and the target objects may be small, and each pixel of the image is assumed to be an input feature of Gradient SHAP. The FA calculation outputs a two-dimensional saliency map that is the same size as the original image. However, if each image pixel is set as an input feature, the noise becomes more intense, resulting in a salient map with low visibility; therefore, the distributions of positive and negative components are separated before visualizing Gradient SHAP. This visualization of the saliency map allows for the visualization of the basis for the inference of geographic object detection models.
3.3. Evaluation of Learning
In object detection models, the object region to be detected corresponds to the feature region that the model needs to focus on. Accordingly, it is suggested that, from the object regions and FA, it is possible to quantitatively evaluate if the model focuses on the features that need to be focused on. In detail, the saliency map calculated by Gradient SHAP is aggregated and indexed in units of bounding boxes of the ground truth (GT). A bounding box is a rectangle that indicates the object’s detected region in the object detection model. The pixels inside the bounding box of the GT are considered to be features that contribute positively to the output, and aggregating by the bounding box can also suppress the effect of noise in the Gradient SHAP for each pixel. Figure 2 shows a conceptual diagram of the method for the evaluation of learning.
By comparing this metric at different learning steps, we can quantitatively assess whether the model focuses on the valuable features. Since this cannot be evaluated with existing metrics such as precision and recall, models based on unreasonable features could not be excluded only by evaluation with existing indices. Accordingly, this metric should be helpful for reasonable model improvements. However, Gradient SHAP has the property of completeness, which means that the sum of the attributions of a specific input x, given a particular baseline , is equal to the difference in the outputs of the model when they are used as inputs, i.e., . This property is helpful for FA scaling. However, if the values of the network outputs are different at each stage of learning, the sum of the FAs are different and cannot be compared; therefore, normalization is required. This study standardized the FA to make it a comparable learning metric. A quantitative evaluation can be formulated with the indicator to evaluate if the model focuses on the valuable features. The evaluation metrics for learning with FA are expressed as follows:
where and are the sample mean and standard deviation of all , respectively, S is the index set of features inside the GT bounding box, and is the number of elements in S.
3.4. Regularization
The same framework as for the evaluation method can be applied for regularization. The attribution of features that should not be based on inference can be calculated, suggesting that a regularization term can be set to reduce the magnitude of this attribution. Because features outside the bounding box should not contribute positively to the output, the model is regularized by imposing penalties on features that have positive SHAP values outside the bounding box of the GT. Figure 3 shows a conceptual diagram of the method for the regularization.
Specifically, we set the error function , which is the error function of the original model , plus the regularization term , as
where is a hyperparameter, S is the index set of features with positive SHAP values outside the bounding box, and is the number of elements in S. FA can be obtained without making any changes to the architecture of the inference model; therefore, it is expected to have the advantage of being able to identify the features of interest and feed them back to the learning process without changing the architecture of the inference model.
The detailed mechanism of this regularization term is described below. Gradient SHAP defines an explanation model, as shown in Equation (2). For calculating , the first-order Taylor-series expansion of x of the output is used, and the gradient is defined as FA. Gradient SHAP uses the product of the gradient and the input, and the regularization term restricts the value of this gradient. This means that it regularizes the weight in the linear explanation model, which corresponds to Lasso regression in the linear-regression model because we use the L2 norm. This regularization of the weight vector corresponding to each feature is expected to prevent overfitting and improve the generalization performance. Typical model-agnostic regularization methods for DL include Weight Decay and Dropout, which correspond to L2 regularization. However, these regularization methods regularize the neural network weights equally. For efficient regularization, weights corresponding to features that should not be focused on should be regularized; by using FA, we can identify features that should not be focused on and regularize the weight vector.
3.5. Data Selection
Furthermore, FA can be used as an indicator for selecting additional training data. The learning framework to efficiently select the additional training data is one of the methods of active learning, which has been actively studied in recent years because the data required for training have been increasing with the advancement of DL models. Many methods have been proposed in the framework of active learning to select data for annotation from unlabeled data sets. One of the effective methods of active learning is uncertainty sampling. This method assigns GT labels to the samples that are ambiguous inference results. By assigning labels to such samples, a discriminator can be trained to correctly discriminate the complex samples near the discrimination boundary [29,30]. The Least-Confidence method (LC) is typically used as a measure of the ambiguity of the inferred results; LC defines the sample with the lowest inferred class probability as the most ambiguous sample. However, LC cannot account for cases where the model is focusing on features that should not be focused on. Therefore, we propose a method that can take into account data that are not focused on reasonable features by using FA. We consider samples that are difficult to be inferred based on valuable features to be samples with significant uncertainty. Such samples can be identified by comparing the proposed evaluation metric. Similar to the evaluation method for learning, when the FA aggregated in the bounding box is small, the data are difficult to infer based on the valuable features. However, because there are no annotated data, these data cannot be aggregated in the GT bounding box. Therefore, the output label of the inference of the initial model is defined as a pseudolabel, and the FAs are aggregated in that bounding box. The formulation is the same as in Equation (6), except for the use of pseudolabels. The datasets with small values for this indicator are annotated preferentially. In remote sensing images, the priority of such annotations becomes particularly problematic when selecting cross-city datasets, where the model trained in one city is subsequently trained in another city to improve its generalization performance. We use the proposed method as a metric to select the training dataset of the city that will improve the generalization performance the most from image datasets of multiple cities. The proposed method described above allows for efficient learning with little annotation data. Figure 4 shows a conceptual diagram of the method for data selection.
4. Experiments and Discussion
In this experiment, we validate the proposed methods. These were developed for object detection models for small objects in satellite images with complex textures by applying them to the problem of vehicle detection in the satellite images. The details of the experiment and the discussion of the results are described below.
4.1. Datasets
Various datasets are now available for models to detect vehicles in remote sensing images, such as satellite and aerial images [31]. Among these datasets, the COWC dataset [32] (https://gdo152.llnl.gov/cowc/, accessed on 16 April 2022) with the multi-city dataset is used in this experiment. To validate the regularization and data selection methods that reduce overfitting and enable learning with less data, it is necessary to apply them to real problems in object detection models for remote-sensing images. Since overfitting and data selection are particularly problematic in training and preparing the annotated data on cross-city datasets, we use the COWC dataset, which is appropriate for such problem settings. The COWC dataset contains aerial images with a resolution of 15 cm ground sample distance (GSD), which is twice as good as WorldView-3, widely used commercial satellite imagery. Therefore, images were downsized to 30 cm GSD using Bicubic interpolation. Because the 32,716 cars in the annotated images of the dataset were annotated as points, the size of the GT bounding box for object detection was kept constant at 20 pixels (6 m) squared. Each image was divided into 416 × 416 pixels. Among the COWC dataset, the four distinct locations with three-band RGB images are Potsdam, Selwyn, Toronto, and Utah. The dataset of Utah (1266 images with 19,807 cars) was used to provide baseline model training and validation datasets (80% and 20%, respectively). Because the images of other cities differ significantly from the Utah images in terms of the background texture, they were used as test data to examine the change in generalization performance when regularization and data selection methods were applied.
4.2. Implementation Details
In this experiment, we used YOLOv3 [33] and Mask R-CNN [34], popular regression-based and region proposal-based object detection models, respectively [35]. YOLOv3 inputs an RGB image and outputs a bounding box, object confidence (objectness score), and object class probability for each grid that divides the image. In addition, YOLOv3 uses a structure called Feature Pyramid Network for multi-scale estimation, and the output is calculated at each of the three scales. Mask R-CNN inputs an RGB image and outputs a bounding box and corresponding object class probability. To compute the gradient SHAP, we need to target a 1D output; therefore, we set the class probability of each object as a target and computed the FA for each pixel of the input. For computing the Gradient SHAP, we used Captum, a model interpretability and understanding library for PyTorch.
As backbone networks, we used Darknet53 [33] for YOLOv3 and Resnet101 [36] for Mask R-CNN. The weights of the original YOLOv3 and Mask R-CNN pre-trained on the COCO dataset [37] were used as the initial values. The training of models in this experiment meant fine-tuning on the COWC dataset. We trained up to 2000 epochs, where four images constitute one mini-batch, and 16 mini-batches constitute one epoch. Stochastic gradient descent (SGD) was used to update the parameters, and the momentum was set to 0.9. The weight decay was also set, and its hyperparameter was set to 0.0005. Random placing, exposure, saturation, hue, and left–right flipping were used as data augmentation techniques. The learning-rate parameter was set to 0.001, and its scheduler was set to up to 100 epochs, between 100 and 1500 epochs, and after 1500 epochs. We ignored the outputs with class scores below 0.7 during training and 0.5 during inference. All experiments were implemented using the PyTorch framework and run on an NVIDIA TITAN RTX GPU(24 GB memory) completed in 3–6 h. For other detailed libraries, algorithms, and settings, please refer to our GitHub mentioned above.
Figure 5 shows some results of training the baseline models under the above training setup. We classified an output as true positive (TP) when the IoU (Intersection over Union) of the bounding boxes of the output and the corresponding GT was more significant than 0.50, false positive (FP) when no such GT existed, false negative (FN) when no such output existed, and true negative (TN) when both did not exist. As for performance indicators for object detection, we used the commonly used Precision (P), Recall (R), F1-score, and Average Precision (AP). P and R are computed as TP/(TP + FP) and TP/(TP + FN), respectively. Moreover, the F1-score and AP can be computed as follows:
where and denote Precision and Recall difference, respectively, when using the k-th threshold. The model’s performance metrics, Precision, Recall, F1-score, and AP, described below, are listed in Table 1.
4.3. Visualization of the Basis of Inference
We tested the effectiveness of Gradient SHAP as a visualization metric by applying it to the benchmark YOLOv3. As detailed settings of Gradient SHAP, baselines were set to black images, the number of samples was set to 10, and the standard deviation of noise was set to . Figure 6 shows the visualization results of positive outputs using pixel-wise Gradient SHAP. For visualization, the FA of each pixel is normalized from to 1. For the output of TP, we can see that the FA on and around the detected object region is significant, indicating that the inference was based on the features on and around the object region. In the case of FP, FA around the target-object region is significant; however, the distribution of FA is more long-tailed than that of TP. Judging from the inference results alone, the model seems to have responded strongly only to the wrong object region; however, judging from the FA, it can be interpreted that the model inferred FP as a result of focusing on a large region around the wrong object and making uncertain inferences. We compare the proposed pixel-wise visualization with E2X [21], an existing superpixel-wise SHAP-based visualization method. Figure 7 shows the visualization results of positive outputs using E2X. These experimental results show that super-pixel-wise visualization is insufficient for object detection in images with detailed textures, such as satellite images, and that pixel-wise visualization is valid. Thus, it was confirmed that it is possible to visualize the basis of inferring the outputs of TP and FP as positive by the proposed method.
In the case of FN, the target output of FA was the one that had the most significant IoU with the GT among the outputs that were not positive. Figure 8 demonstrates that, in the case of FN, the FA is also more significant around the object of interest but distributed over a slightly wider area. As described above, it was confirmed that the basis of inference can be visualized by creating a saliency map with FA for each model’s output. On the other hand, as shown in Figure 6 and Figure 8, the positive and negative values of FA are mixed, resulting in a rather noisy distribution. This is because the FA input is set to each image pixel. It increases the effect of the nonlinearity of the DL model. This is not a significant problem when illustrating the region of the basis of model inference because our interest in the interpretability of object detection models lies in knowing which part of the model inference it is based on. However, it requires consideration when calculating the indices for evaluation of learning, regularization, and data selection.
4.4. Evaluation of Learning
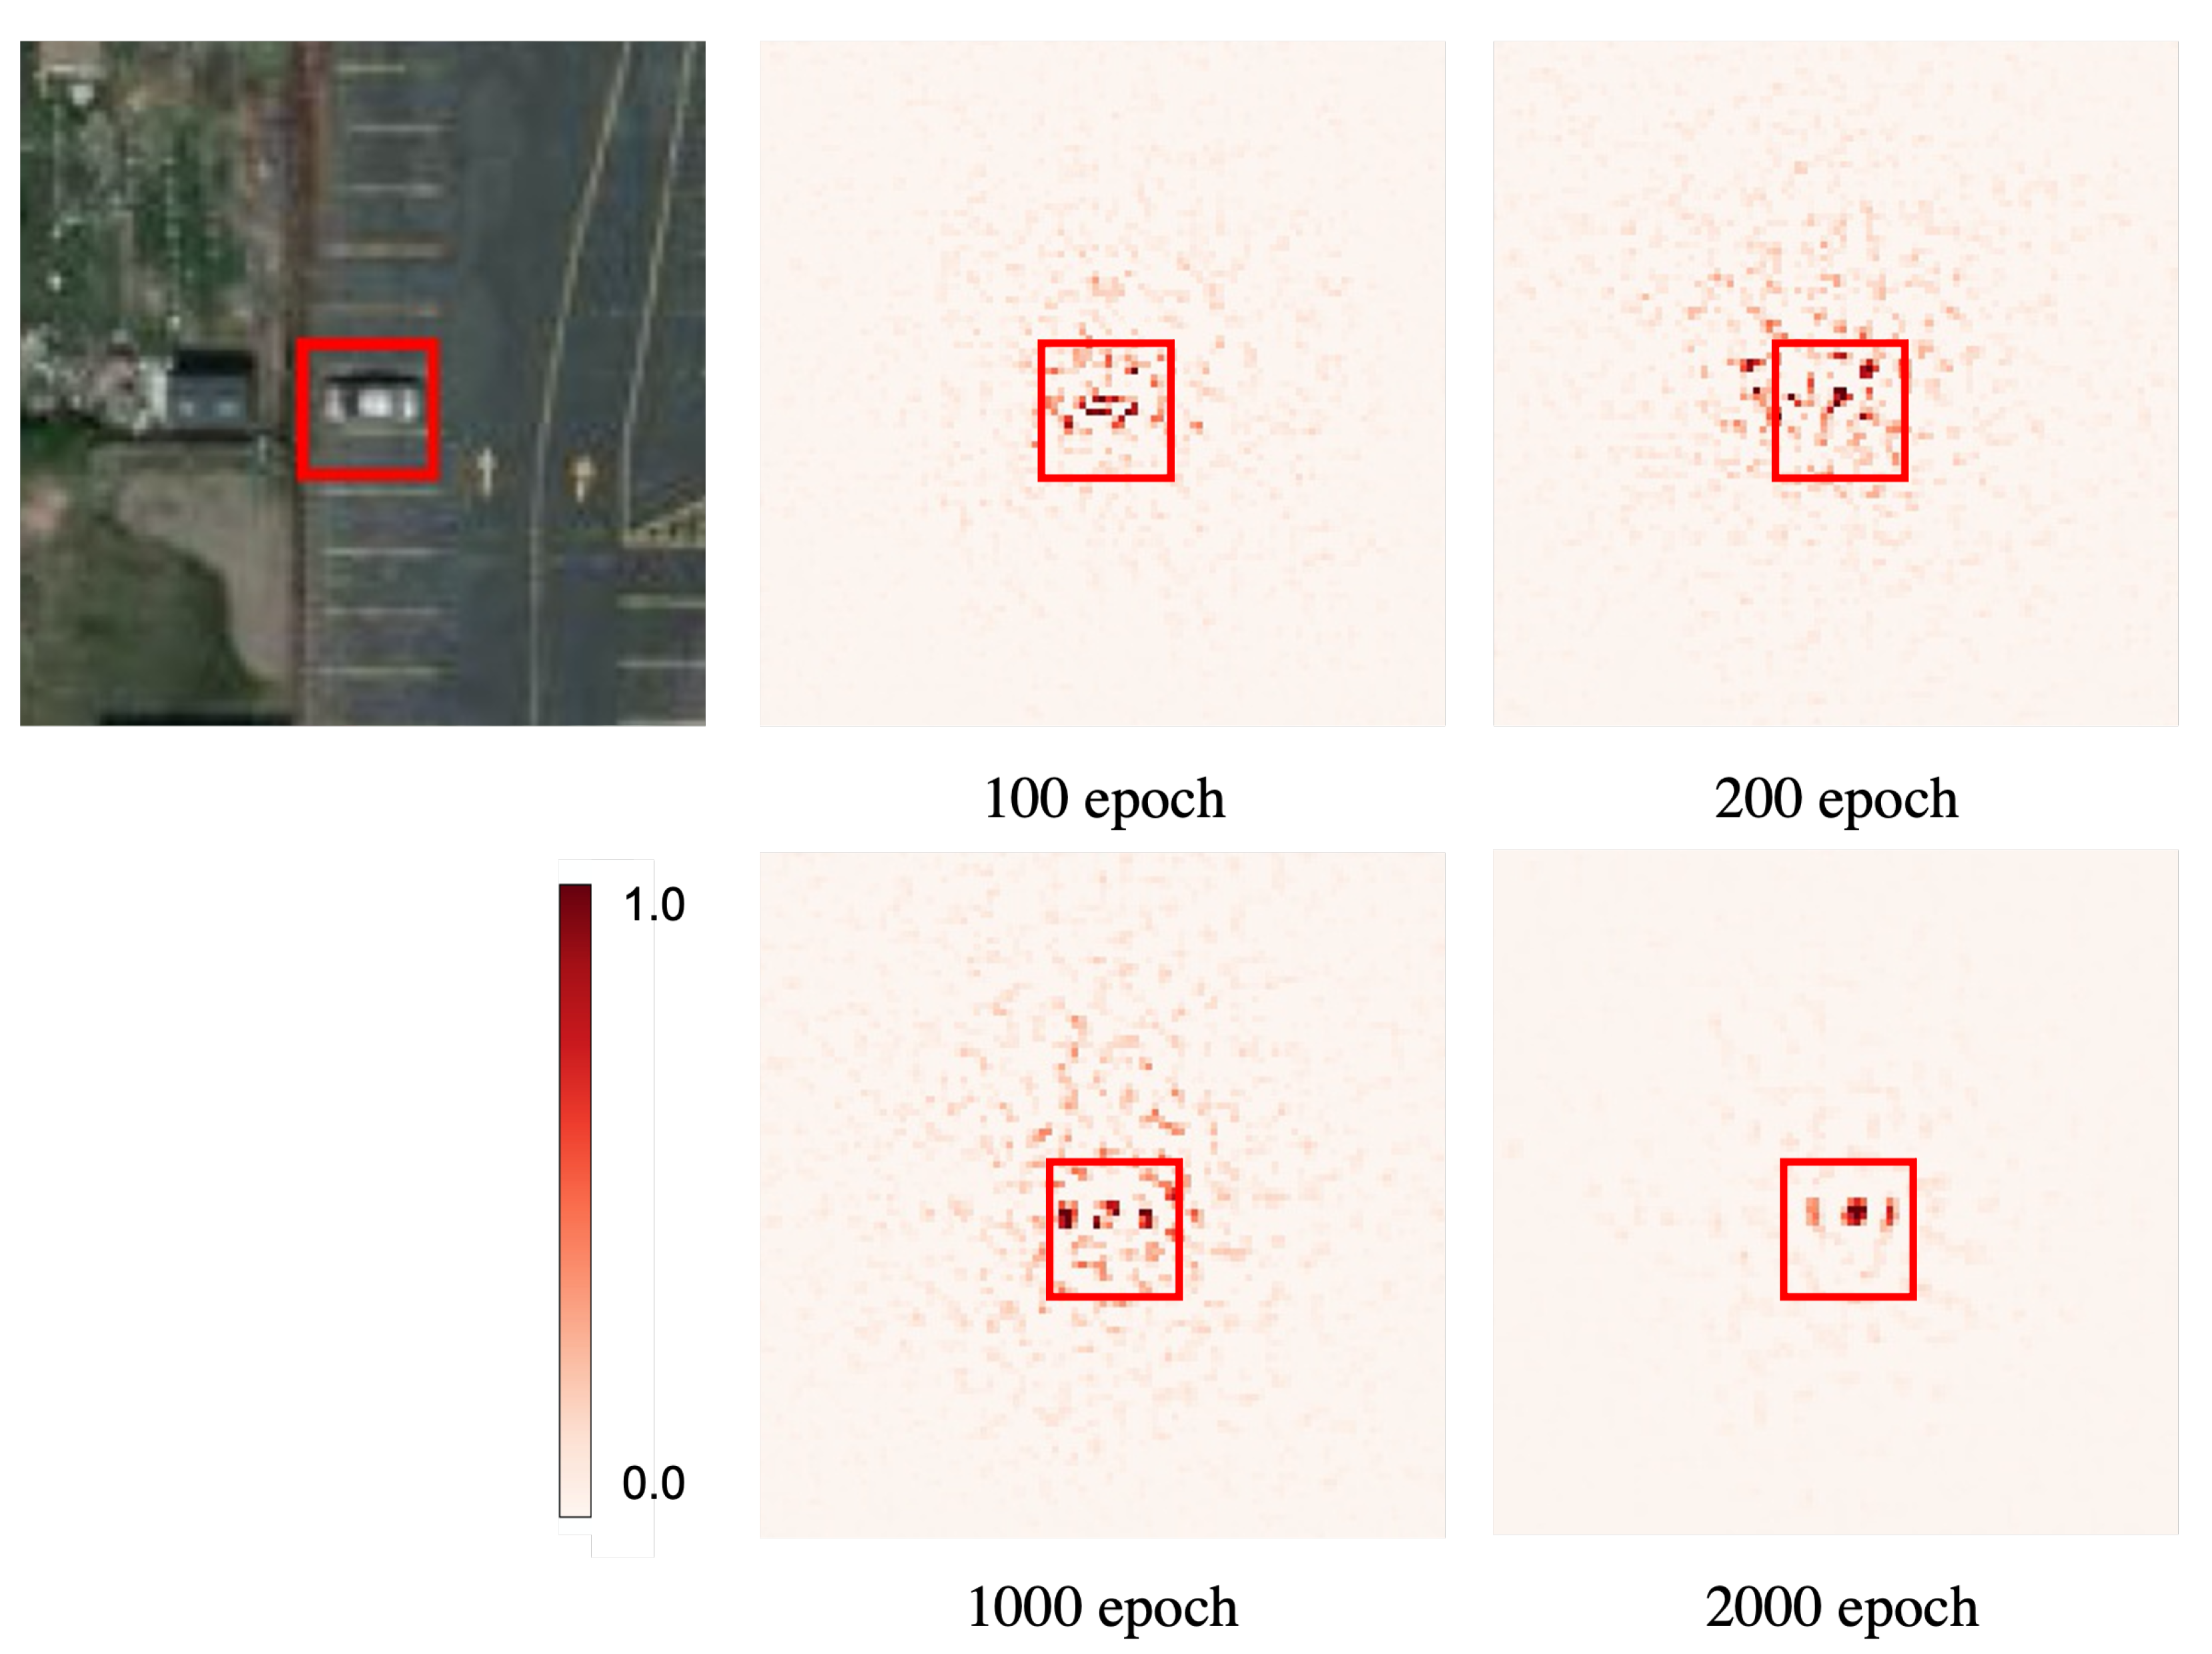
Next, the validity of the method for evaluating learning using FA was tested on YOLOv3. The detailed settings of Gradient SHAP are the same as in the previous section. By performing the evaluation using the evaluation metrics defined in Equation (6) and the visualization using the FA saliency map at each stage of learning, we can identify whether the progress of learning in a way that focuses on the correct features can be verified. Because the FA is using a bounding box, the noise effect due to the nonlinearity of the model can be suppressed, as mentioned in the previous section. Figure 9 and Table 2 show the saliency map, performance evaluation, and evaluation metrics of FA for 100, 200, 1000, and 2000 epochs.
The evaluation metrics are calculated with the FAs for all TPs, aggregating them in the bounding box of the corresponding GT and calculating the mean and variance. According to the evaluation metrics, the overall trend is that the mean within the bounding box increases, and the standard deviation decreases as the learning progresses. The features with positive FA are concentrated inside the bounding box; the same is observed in the saliency maps. This indicates that the features’ FA increases as learning progresses and that the learning is progressing correctly. As a result, the effectiveness of the learning evaluation method was confirmed, and it was confirmed that it is possible to evaluate whether or not the correct features are being focused on, which was not possible in the previous metrics.
4.5. Regularization
Next, we describe the validation of our method that uses FA to regularize the models. In this section, we compare the generalization performance of YOLOv3 and Mask R-CNN concerning Precision, Recall, F1-score, and AP when the regularization term is added to the training set. Moreover, we also compare if the correct features are focused on using the learning evaluation metrics. The results for generalization performance are listed in Table 3. In this case, the data from a different city rather than the training data were used as the test data. The number of data in each dataset for the index calculation was set to 50 to match the lowest number in the Potsdam dataset. In addition, Table 3 also lists the evaluation metrics of learning calculated using the same data.
According to Precision, Recall, F1-score, and AP, the values increase for all cities and all metrics, indicating that the regularization term improves the generalization performance for the validation data and the test data. As for the learning metrics, the value of increases for all the metrics except Potsdam of YOLOv3 and Toronto of Mask R-CNN, indicating that the regularization term has helped the model focus on more correct features. From these experimental results, it can be inferred that the model learned to correctly recognize the features of the object itself that need to be focused on by the model regularization method, which reduced the focus on the background and improved the generalization performance of the model. This result confirms the effectiveness of the regularization method using FA. Additionally, the experimental results demonstrate that the regularization method is effective for both regression-based and region proposal-based object detection models. It suggests that this method improves any type of object detection model. We also validated the effectiveness of the proposed method by comparing it to existing regularization methods (Weight Decay and Dropout). Table 4 shows the results. This experiment is conducted on the Utah (Validation) dataset. Experimental results show that the proposed method has a greater regularization effect than Dropout and comparable to that of Weight Decay, confirming its effectiveness.
On the other hand, the proposed method requires multiple backpropagation calculations to calculate the regularization term; therefore, the drawback of this method is that the computational cost is relatively high. The average training speed without and with regularization in the YOLOv3 experiment was 12.1 epoch/min and 5.56 epoch/min, respectively. The Gradient SHAP calculation requires another backpropagation calculation. Thus, the training time with regularization is about twice as long as that without regularization. Since the increase in training time with regularization depends on the time of backpropagation computation, the increase can be reduced by using a lightweight model, for example, [38]. Note that changing the running time was only related to training time, so the training time increases, but the inference time does not.
4.6. Data Selection
Finally, we describe the validation of our method for selecting the data to be annotated using FA. In our experiments, we used the dataset that had already been annotated with GTs; however, the GT information was not used in the data selection. First, we prepared the baseline model trained on the Utah dataset, described in Section 4.2. Subsequently, we calculated the value of and for ten randomly sampled images from each unknown city dataset (Potsdam, Toronto, Selwyn), using the outputs of the baseline model with the highest objectness score as pseudolabels. The dataset with the most petite or the most significant in Equation (6) should be considered to have the highest uncertainty. Subsequently, we retrained the model on each city dataset and compared the generalization performances of these models. For the test dataset, we generated a dataset of the four cities. Each was sampled equally from images not used for training from each city. For comparison, we also applied the Least-Confidence method (LC) of Uncertainty Sampling to our experimental data. Here, as in the experiments with the proposed method, we calculated the class scores for each of the ten randomly sampled images and summed them over the ten images. Based on the LC concept, the sample set with the smallest value of this sum can be considered to improve performance the most. Table 5 demonstrates the performance of each retrained model on the four-city dataset.
From Table 5, in the order of Toronto, Potsdam, and Selwyn, decreased, and in the same order, the AP increased after retraining. This suggests that it is possible to improve the generalization performance by choosing a dataset where the uncertainty is estimated to be more significant from the pseudolabel and FA. On the other hand, no reasonable relationship is observed between and AP. Therefore, it can be inferred that is suitable as an indicator for the uncertainty sampling based on FA. The LC values also decrease in the same order as , but the difference in LC values is small because the difference in inferred class probabilities is small. It is suggested that the proposed method, i.e., , is clearer and more effective as a data selection criterion. As with the regularization method, it is suggested that this data selection method improves any type of object detection model. Thus, the method’s effectiveness for selecting data for annotation using FA was confirmed.
4.7. Future Extension
These experimental results verify the validity of the proposed methods for basis visualization, model evaluation, regularization, and data selection. Although we conducted our experiments on YOLOv3 and Mask R-CNN, the experimental results suggest that the proposed method is helpful for various object detection models, including state-of-arts models, due to the model-agnostic property of our approach. One of the future tasks is to develop a method that can be applied to higher-dimensional input data than that of this study. For example, the higher the input-data dimensionality, such as hyperspectral data or point clouds, the more serious the problem of interpretability and overfitting. Therefore, the impact of the proposed methods will be significant during such problems. In addition, although the proposed method was designed for vehicle detection models with one class of output and an approximately constant scale, the methods can be extended to multi-class and multi-scale object detection models. The Gradient SHAP used in this study requires multiple backpropagation calculations. It makes the computational cost relatively high, which is a problem, especially for the regularization method. The problem becomes serious when the input is high-dimensional, or the output is multi-class or multi-scale. This problem can be mitigated by using a model with a simple architecture or by using an FA calculation method that is computationally less expensive. By extending the methods to these problems, we expect to develop more generic and interpretable object detection methods.
5. Conclusions
In this paper, we proposed a novel approach using pixel-wise FA for basis visualization of DL-based object detection models of satellite images, in which texture is often complicated, and the target objects may be small. We also proposed new methods for model evaluation, regularization, and data selection, based on FA. A new metric for quantitatively evaluating models was developed using FA and the information on object regions of GT. Furthermore, we formulated a regularization term that reduces the FA of features that should not contribute to inference. We formulated a novel data selection approach based on FA to quantify how model inference is based on valuable features of unknown training data. The experimental results verify the validity of the proposed methods for basis visualization and model evaluation, regularization, and data selection.
Author Contributions
Conceptualization, T.F.; methodology, T.F. and H.K.; software, H.K.; validation, H.K.; formal analysis, H.K.; investigation, H.K.; resources, T.F.; data curation, H.K.; writing—original draft preparation, H.K.; writing—review and editing, T.F.; visualization, H.K.; supervision, T.F.; project administration, T.F.; funding acquisition, T.F. All authors have read and agreed to the published version of the manuscript.
Funding
This research received no external funding.
Data Availability Statement
For more details on the implementation and experiments, please refer to our GitHub (https://github.com/hiroki-kawauchi/SHAPObjectDetection, accessed on 16 April 2022). The COWC dataset [32] (https://gdo152.llnl.gov/cowc/, accessed on 16 April 2022) was used in the experiments.
Conflicts of Interest
The authors declare no conflict of interest.
References
- Barnes, C.F.; Fritz, H.; Yoo, J. Hurricane disaster assessments with image-driven data mining in high-resolution satellite imagery. IEEE Trans. Geosci. Remote Sens. 2007, 45, 1631–1640. [Google Scholar] [CrossRef]
- Holland, D.; Boyd, D.; Marshall, P. Updating topographic mapping in Great Britain using imagery from high-resolution satellite sensors. ISPRS J. Photogramm. Remote Sens. 2006, 60, 212–223. [Google Scholar] [CrossRef]
- Gerhardinger, A.; Ehrlich, D.; Pesaresi, M. Vehicles detection from very high resolution satellite imagery. Int. Arch. Photogramm. Remote Sens. 2005, 36, W24. [Google Scholar]
- Li, K.; Wan, G.; Cheng, G.; Meng, L.; Han, J. Object detection in optical remote sensing images: A survey and a new benchmark. ISPRS J. Photogramm. Remote Sens. 2020, 159, 296–307. [Google Scholar] [CrossRef]
- Krizhevsky, A.; Sutskever, I.; Hinton, G.E. Imagenet classification with deep convolutional neural networks. Adv. Neural Inf. Process. Syst. 2012, 25, 1097–1105. [Google Scholar] [CrossRef]
- Raina, R.; Madhavan, A.; Ng, A.Y. Large-scale deep unsupervised learning using graphics processors. In Proceedings of the 26th Annual International Conference on Machine Learning, Montreal, QC, Canada, 14–18 June 2009; pp. 873–880. [Google Scholar]
- LeCun, Y.; Bengio, Y.; Hinton, G. Deep learning. Nature 2015, 521, 436–444. [Google Scholar] [CrossRef]
- Voigt, P.; Von dem Bussche, A. The eu general data protection regulation (gdpr). In A Practical Guide, 1st ed.; Springer International Publishing: Cham, Switzerland, 2017; Volume 10, p. 3152676. [Google Scholar]
- Gunning, D.; Aha, D. DARPA’s explainable artificial intelligence (XAI) program. AI Mag. 2019, 40, 44–58. [Google Scholar]
- Adadi, A.; Berrada, M. Peeking inside the black-box: A survey on explainable artificial intelligence (XAI). IEEE Access 2018, 6, 52138–52160. [Google Scholar] [CrossRef]
- Lundberg, S.M.; Lee, S.I. A unified approach to interpreting model predictions. In Proceedings of the Advances in Neural Information Processing Systems, Long Beach, CA, USA, 4–9 December 2017; pp. 4765–4774. [Google Scholar]
- Simonyan, K.; Vedaldi, A.; Zisserman, A. Deep inside convolutional networks: Visualising image classification models and saliency maps. arXiv 2013, arXiv:1312.6034. [Google Scholar]
- Bach, S.; Binder, A.; Montavon, G.; Klauschen, F.; Müller, K.R.; Samek, W. On pixel-wise explanations for nonlinear classifier decisions by layer-wise relevance propagation. PLoS ONE 2015, 10, e0130140. [Google Scholar] [CrossRef] [Green Version]
- Montavon, G.; Lapuschkin, S.; Binder, A.; Samek, W.; Müller, K.R. Explaining nonlinear classification decisions with deep taylor decomposition. Pattern Recognit. 2017, 65, 211–222. [Google Scholar] [CrossRef]
- Shrikumar, A.; Greenside, P.; Shcherbina, A.; Kundaje, A. Not just a black box: Learning important features through propagating activation differences. arXiv 2016, arXiv:1605.01713. [Google Scholar]
- Shrikumar, A.; Greenside, P.; Kundaje, A. Learning Important Features Through Propagating Activation Differences. In Proceedings of the International Conference on Machine Learning, Sydney, Australia, 6–11 August 2017; pp. 3145–3153. [Google Scholar]
- Springenberg, J.; Dosovitskiy, A.; Brox, T.; Riedmiller, M. Striving for Simplicity: The All Convolutional Net. arXiv 2014, arXiv:1412.6806. [Google Scholar]
- Sundararajan, M.; Taly, A.; Yan, Q. Axiomatic Attribution for Deep Networks. In Proceedings of the International Conference on Machine Learning (ICML), Sydney, Australia, 6–11 August 2017. [Google Scholar]
- Zeiler, M.D.; Fergus, R. Visualizing and understanding convolutional networks. In European Conference on Computer Vision; Springer: Berlin/Heidelberg, Germany, 2014; pp. 818–833. [Google Scholar]
- Zintgraf, L.M.; Cohen, T.S.; Adel, T.; Welling, M. Visualizing deep neural network decisions: Prediction difference analysis. arXiv 2017, arXiv:1702.04595. [Google Scholar]
- Gudovskiy, D.; Hodgkinson, A.; Yamaguchi, T.; Ishii, Y.; Tsukizawa, S. Explain to fix: A framework to interpret and correct dnn object detector predictions. arXiv 2018, arXiv:1811.08011. [Google Scholar]
- Fukui, H.; Hirakawa, T.; Yamashita, T.; Fujiyoshi, H. Attention branch network: Learning of attention mechanism for visual explanation. In Proceedings of the IEEE Conference on Computer Vision and Pattern Recognition, Long Beach, CA, USA, 15–20 June 2019; pp. 10705–10714. [Google Scholar]
- Ancona, M.; Ceolini, E.; Öztireli, C.; Gross, M. Towards better understanding of gradient-based attribution methods for Deep Neural Networks. In Proceedings of the 6th International Conference on Learning Representations (ICLR). Arxiv-Computer Science, Vancouver, BC, Canada, 30 April–3 May 2018. [Google Scholar]
- Ribeiro, M.T.; Singh, S.; Guestrin, C. “Why should I trust you?” Explaining the predictions of any classifier. In Proceedings of the 22nd ACM SIGKDD International Conference on Knowledge Discovery and Data Mining, San Francisco, CA, USA, 13–17 August 2016; pp. 1135–1144. [Google Scholar]
- Smilkov, D.; Thorat, N.; Kim, B.; Viégas, F.; Wattenberg, M. Smoothgrad: Removing noise by adding noise. arXiv 2017, arXiv:1706.03825. [Google Scholar]
- Petsiuk, V.; Jain, R.; Manjunatha, V.; Morariu, V.I.; Mehra, A.; Ordonez, V.; Saenko, K. Black-box explanation of object detectors via saliency maps. In Proceedings of the IEEE/CVF Conference on Computer Vision and Pattern Recognition, Nashville, TN, USA, 20–25 June 2021; pp. 11443–11452. [Google Scholar]
- Everingham, M.; Van Gool, L.; Williams, C.K.; Winn, J.; Zisserman, A. The pascal visual object classes (voc) challenge. Int. J. Comput. Vis. 2010, 88, 303–338. [Google Scholar] [CrossRef] [Green Version]
- Liu, L.; Ouyang, W.; Wang, X.; Fieguth, P.; Chen, J.; Liu, X.; Pietikäinen, M. Deep learning for generic object detection: A survey. Int. J. Comput. Vis. 2020, 128, 261–318. [Google Scholar] [CrossRef] [Green Version]
- Lewis, D.D.; Gale, W.A. A sequential algorithm for training text classifiers. In SIGIR’94; Springer: London, UK, 1994; pp. 3–12. [Google Scholar]
- Yang, Y.; Ma, Z.; Nie, F.; Chang, X.; Hauptmann, A.G. Multi-class active learning by uncertainty sampling with diversity maximization. Int. J. Comput. Vis. 2015, 113, 113–127. [Google Scholar] [CrossRef]
- Lin, H.Y.; Tu, K.C.; Li, C.Y. VAID: An Aerial Image Dataset for Vehicle Detection and Classification. IEEE Access 2020, 8, 212209–212219. [Google Scholar] [CrossRef]
- Mundhenk, T.N.; Konjevod, G.; Sakla, W.A.; Boakye, K. A large contextual dataset for classification, detection and counting of cars with deep learning. In European Conference on Computer Vision; Springer: Berlin/Heidelberg, Germany, 2016; pp. 785–800. [Google Scholar]
- Redmon, J.; Farhadi, A. Yolov3: An incremental improvement. arXiv 2018, arXiv:1804.02767. [Google Scholar]
- He, K.; Gkioxari, G.; Dollár, P.; Girshick, R. Mask r-cnn. In Proceedings of the IEEE International Conference on Computer Vision, Venice, Italy, 22–29 October 2017; pp. 2961–2969. [Google Scholar]
- Lu, J.; Ma, C.; Li, L.; Xing, X.; Zhang, Y.; Wang, Z.; Xu, J. A vehicle detection method for aerial image based on YOLO. J. Comput. Commun. 2018, 6, 98–107. [Google Scholar] [CrossRef] [Green Version]
- He, K.; Zhang, X.; Ren, S.; Sun, J. Deep residual learning for image recognition. In Proceedings of the IEEE Conference on Computer Vision and Pattern Recognition, Las Vegas, NV, USA, 26 June–1 July 2016; pp. 770–778. [Google Scholar]
- Lin, T.Y.; Maire, M.; Belongie, S.; Hays, J.; Perona, P.; Ramanan, D.; Dollár, P.; Zitnick, C.L. Microsoft coco: Common objects in context. In European Conference on Computer Vision; Springer: Cham, Switzerland, 2014; pp. 740–755. [Google Scholar]
- Winoto, A.S.; Kristianus, M.; Premachandra, C. Small and slim deep convolutional neural network for mobile device. IEEE Access 2020, 8, 125210–125222. [Google Scholar] [CrossRef]
Figure 1.
Overview of the proposed methods for visualizing the basis of inference, model evaluation, regularization, and data selection based on pixel-wise FA.
Figure 1.
Overview of the proposed methods for visualizing the basis of inference, model evaluation, regularization, and data selection based on pixel-wise FA.

Figure 2.
Conceptual diagram of the method for the evaluation of learning. The background image illustrates the saliency map of FA.
Figure 2.
Conceptual diagram of the method for the evaluation of learning. The background image illustrates the saliency map of FA.
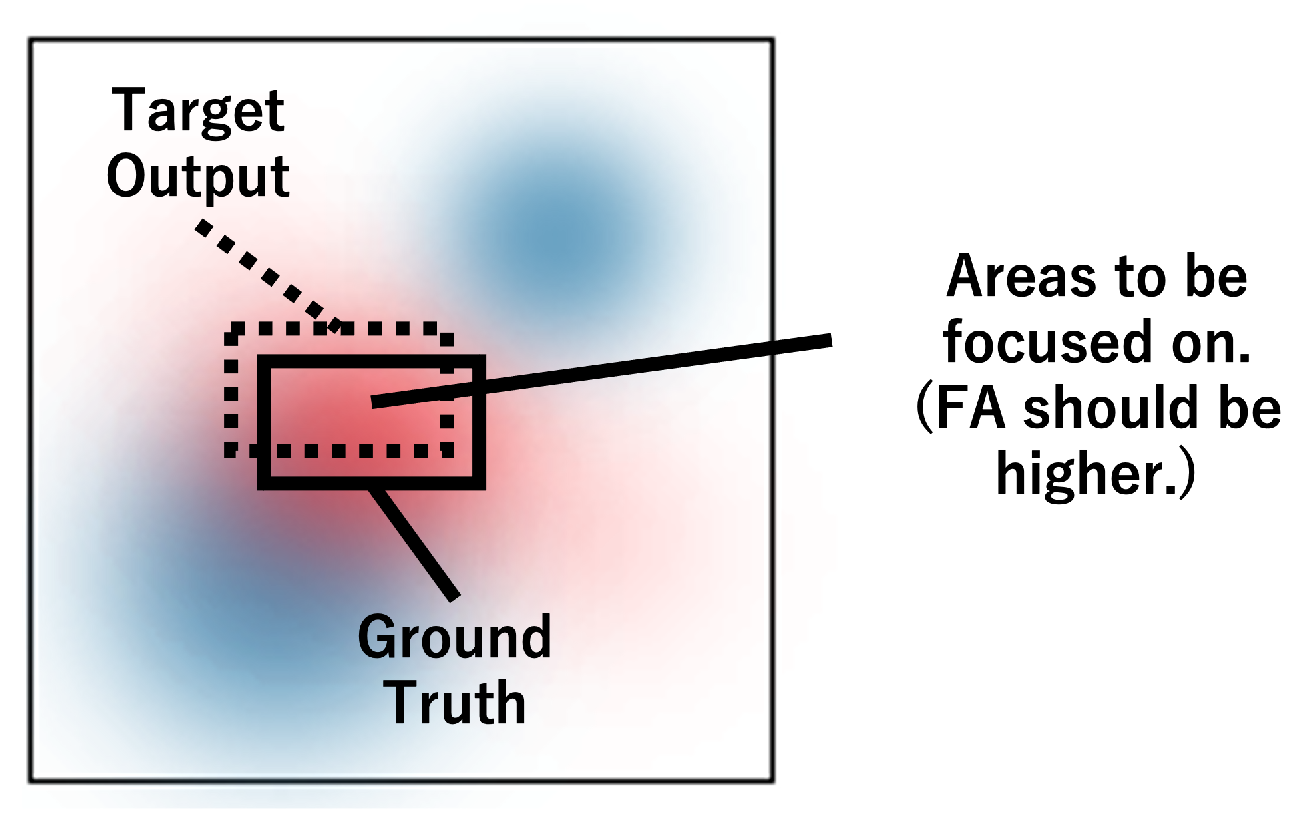
Figure 3.
Conceptual diagram of the method for the regularization. The background image illustrates the saliency map of FA.
Figure 3.
Conceptual diagram of the method for the regularization. The background image illustrates the saliency map of FA.
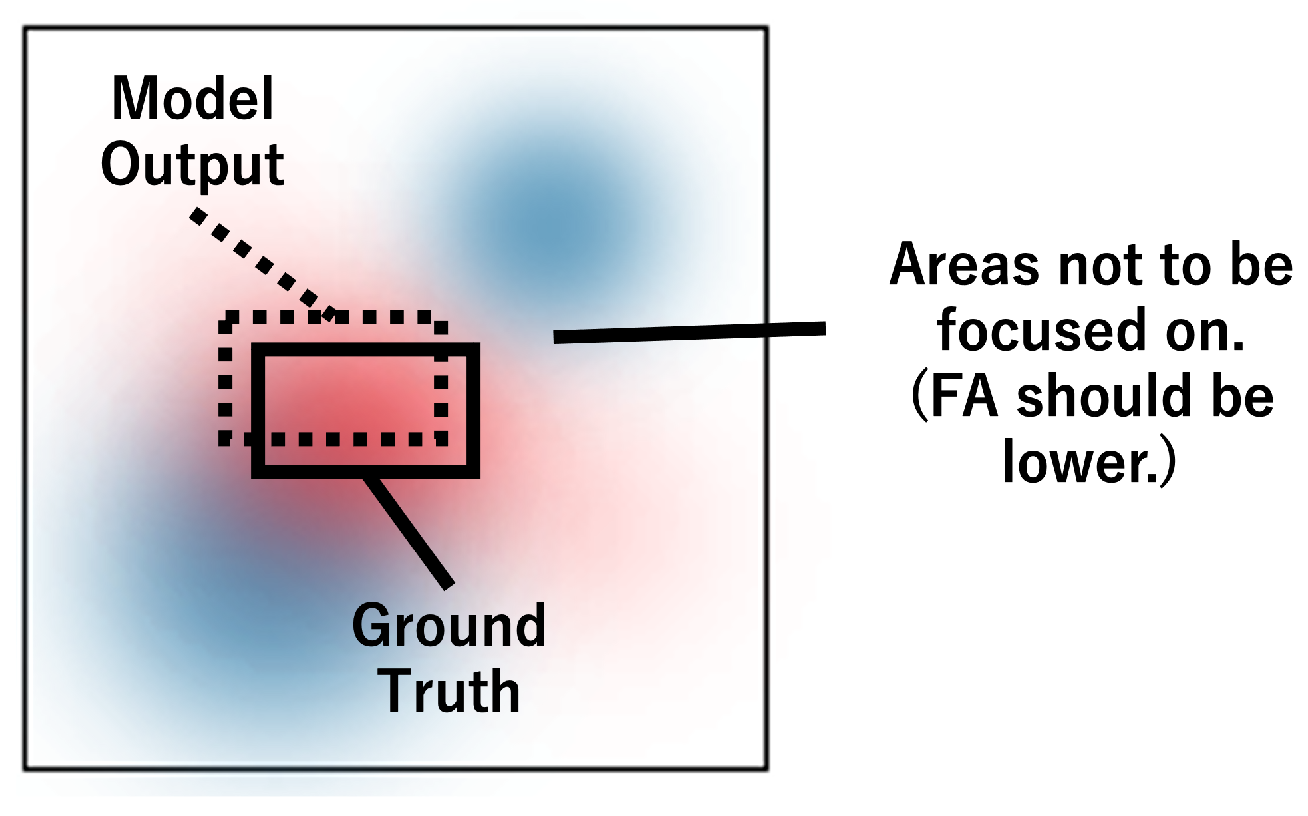
Figure 4.
Conceptual diagram of the method for the data selection. The background image illustrates the saliency map of FA.
Figure 4.
Conceptual diagram of the method for the data selection. The background image illustrates the saliency map of FA.

Figure 5.
The detection results of the baseline model trained on the Utah city dataset. The top, middle, and bottom rows show the bounding boxes of GT, YOLOv3, and Mask R-CNN outputs, respectively.
Figure 5.
The detection results of the baseline model trained on the Utah city dataset. The top, middle, and bottom rows show the bounding boxes of GT, YOLOv3, and Mask R-CNN outputs, respectively.
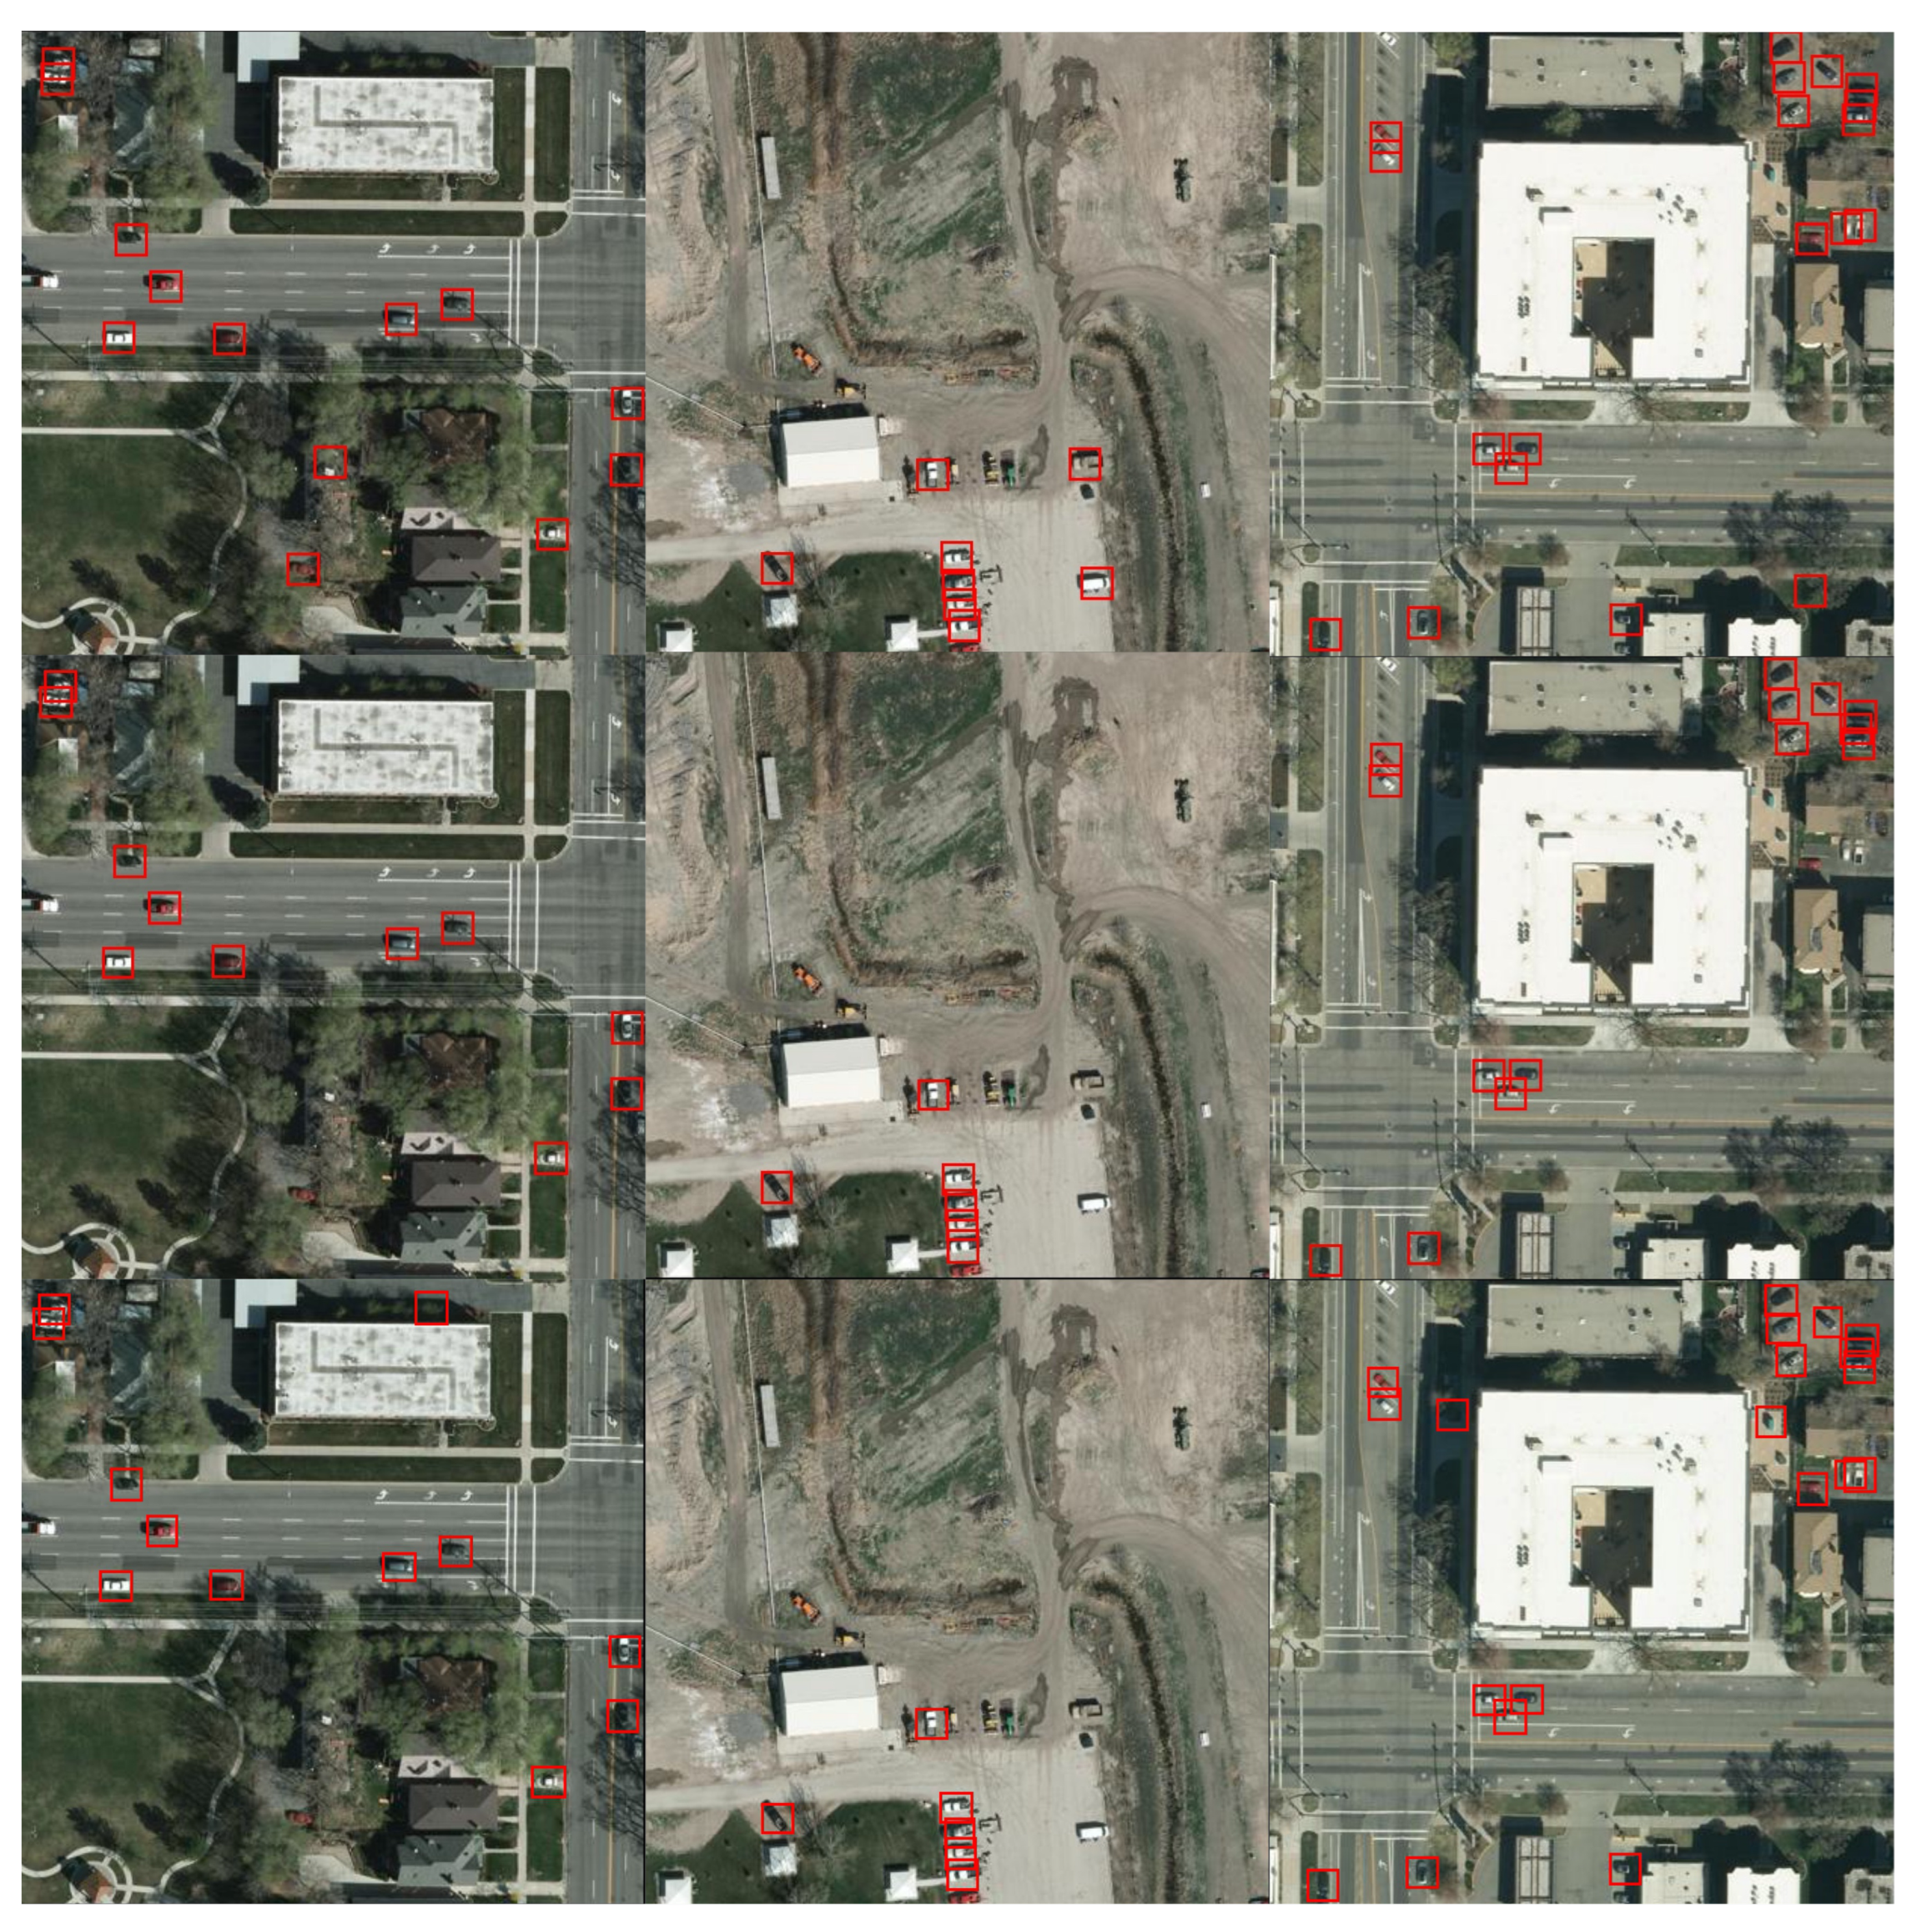
Figure 6.
Visualization results of positive outputs using pixel-wise Gradient SHAP. The left image shows the inferred results, the center image shows the distribution of positive values, and the right image shows the negative values.
Figure 6.
Visualization results of positive outputs using pixel-wise Gradient SHAP. The left image shows the inferred results, the center image shows the distribution of positive values, and the right image shows the negative values.
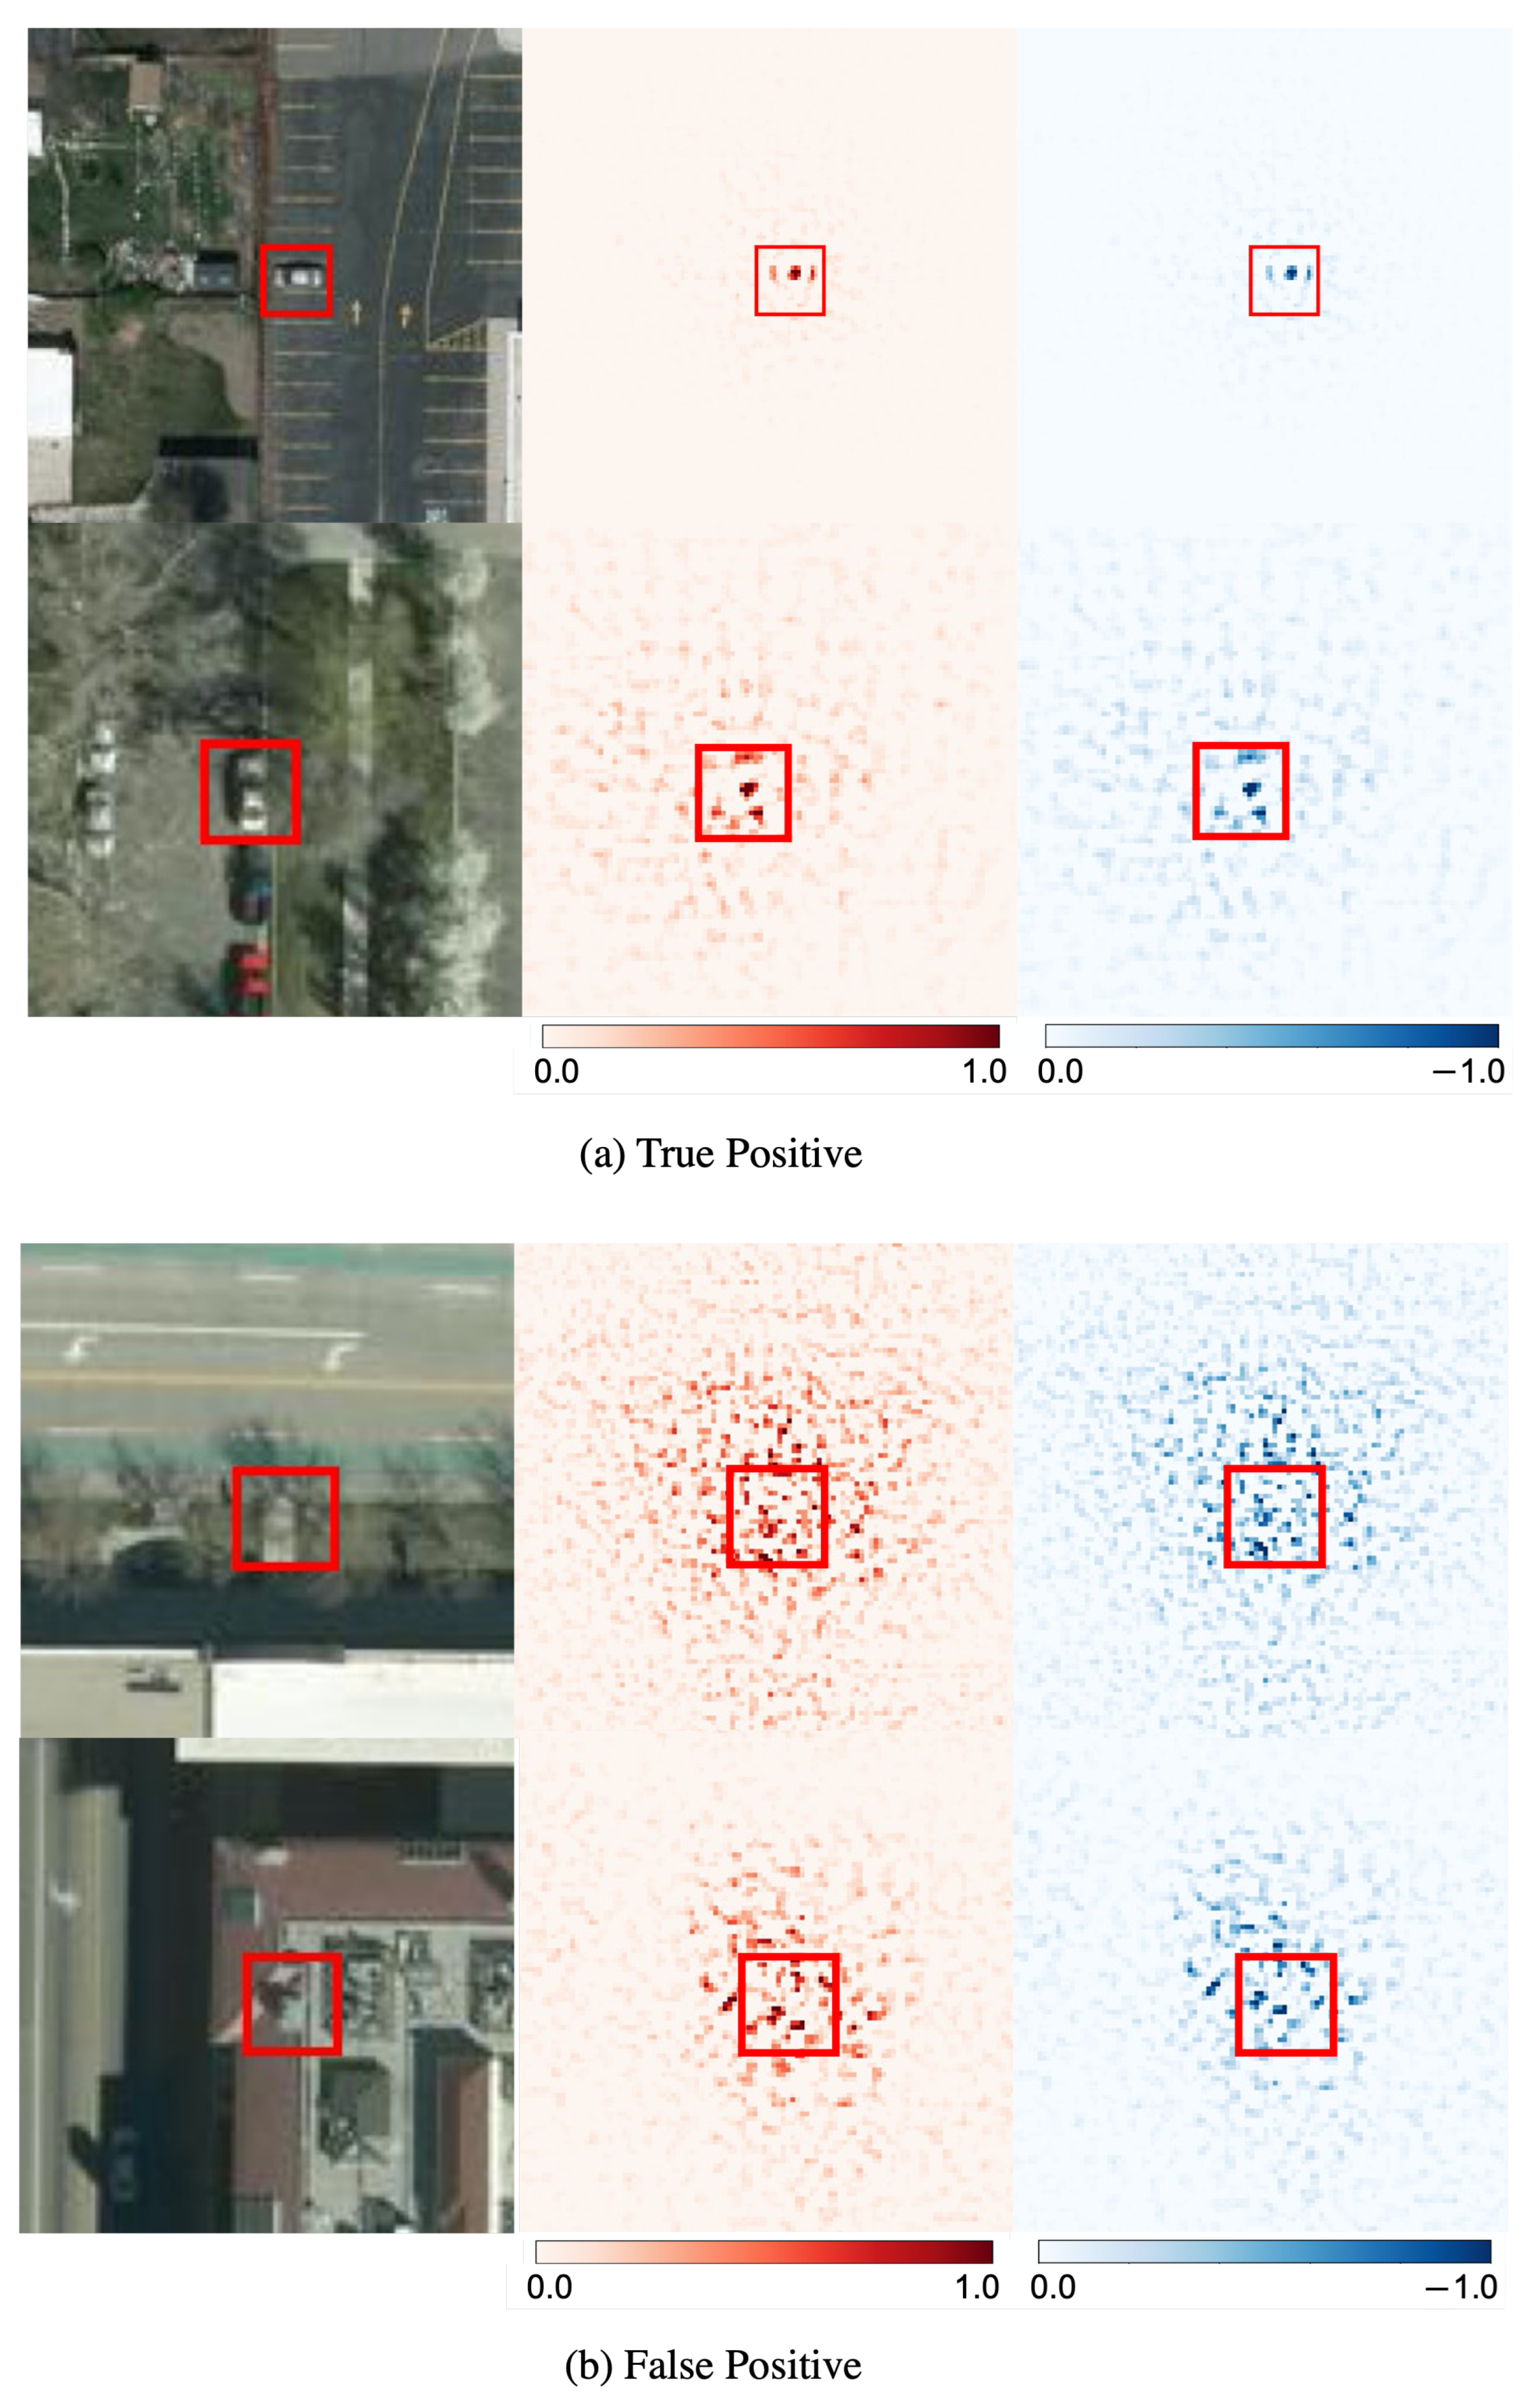
Figure 7.
Visualization results of positive outputs using E2X [21]. The left image shows the inferred results, the center image shows the distribution of positive values, and the right image shows the negative values.
Figure 7.
Visualization results of positive outputs using E2X [21]. The left image shows the inferred results, the center image shows the distribution of positive values, and the right image shows the negative values.
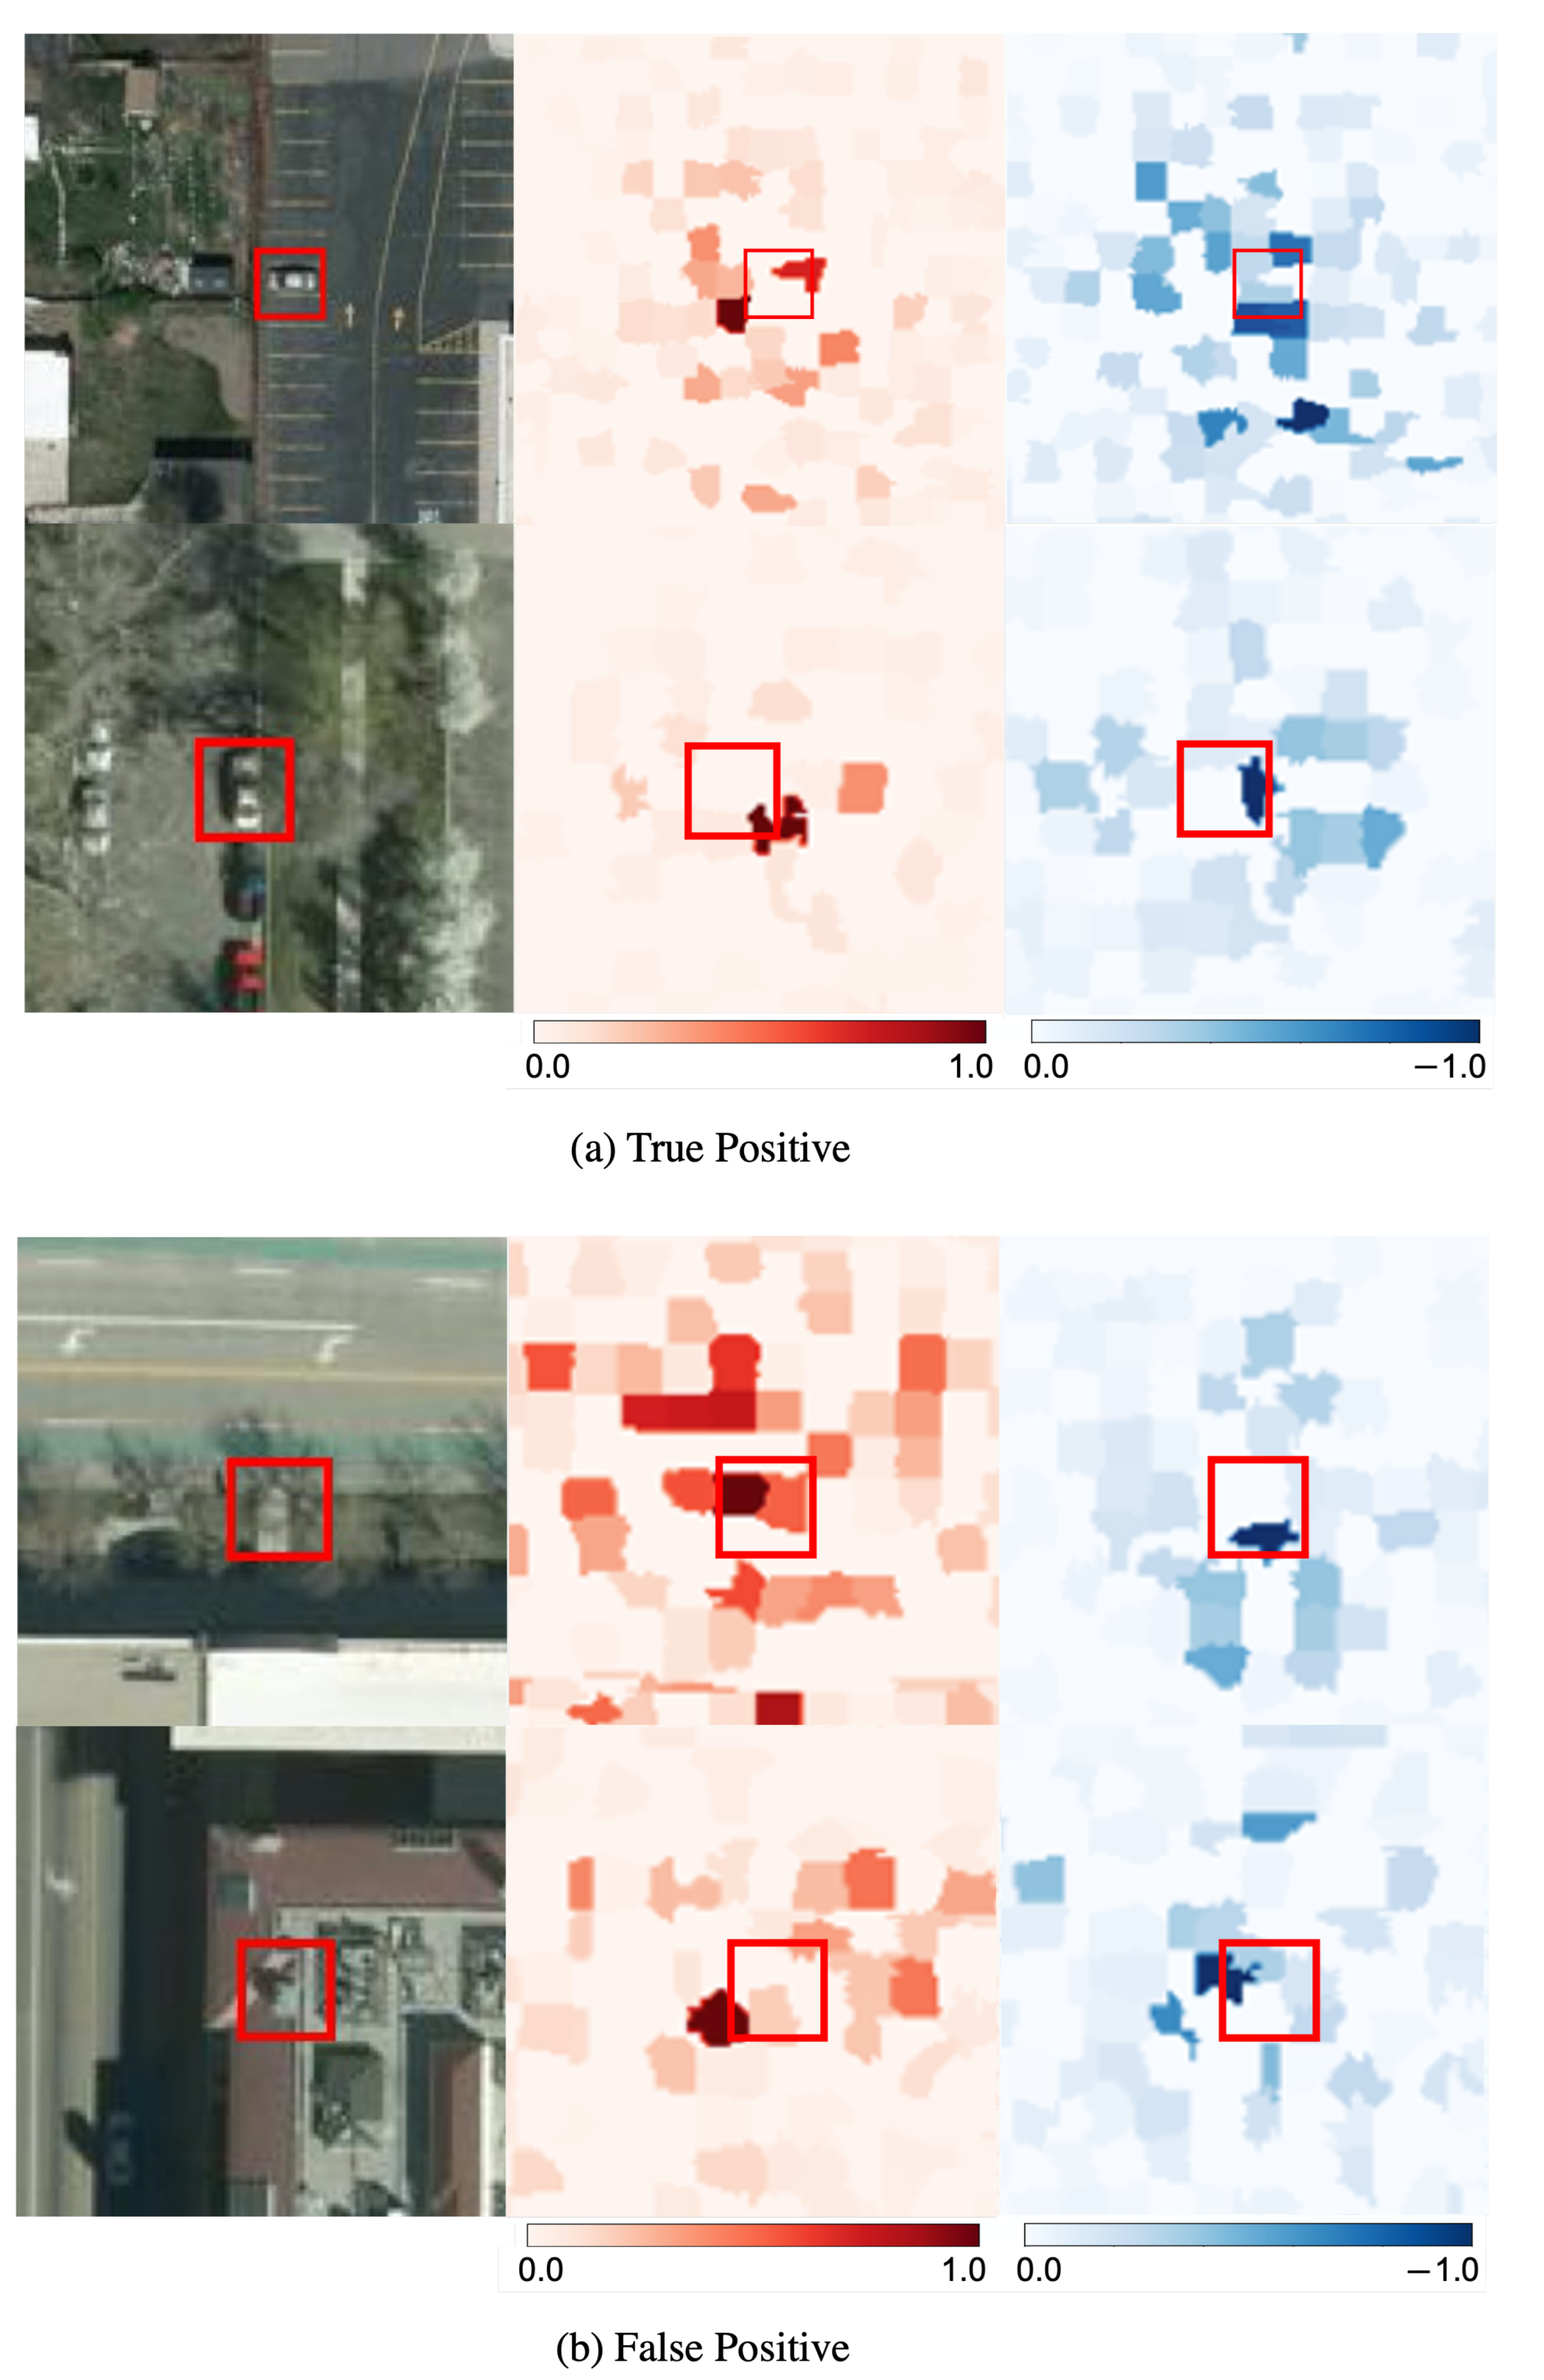
Figure 8.
Visualization results of false-negative outputs by pixel-wise Gradient SHAP. The left image shows the inferred results, the center image shows the distribution of positive values, and the right image shows negative values.
Figure 8.
Visualization results of false-negative outputs by pixel-wise Gradient SHAP. The left image shows the inferred results, the center image shows the distribution of positive values, and the right image shows negative values.
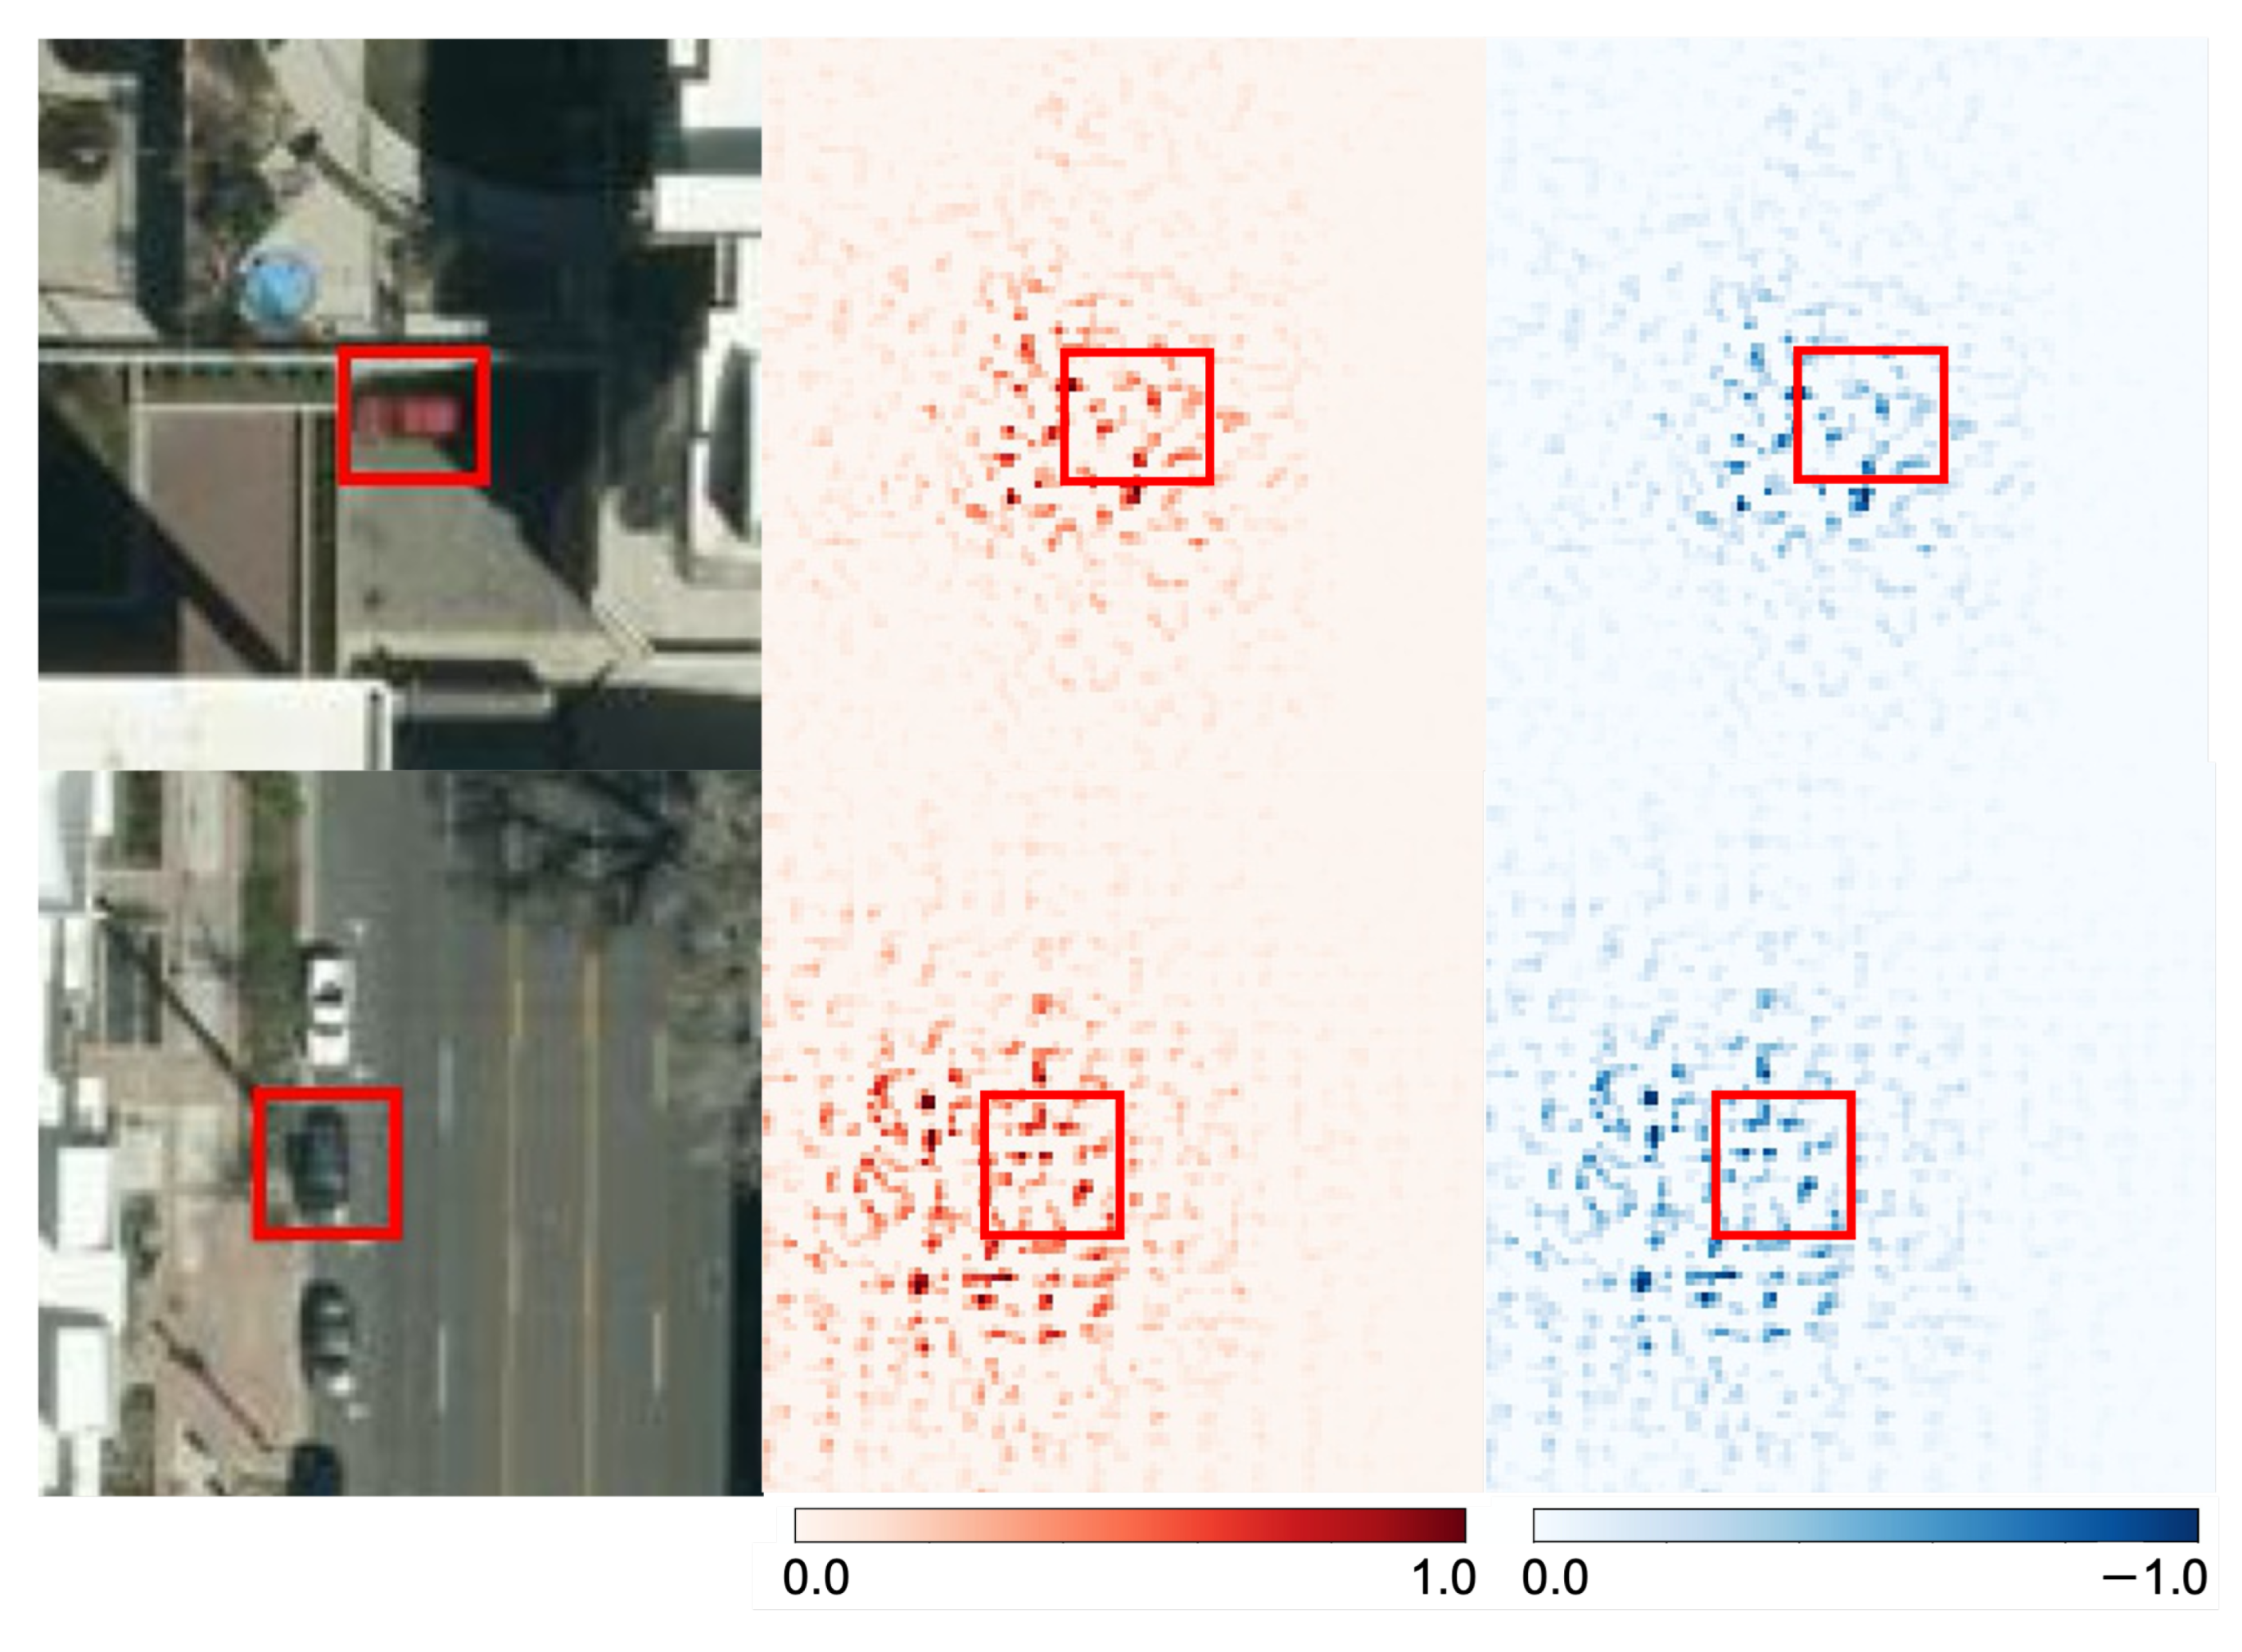
Figure 9.
Visualization results of positive outputs by pixel-wise Gradient SHAP at each step.

Table 1.
Precision, Recall, F1-score, and AP of the baseline model.
| Precision | Recall | F1-Score | AP | |
|---|---|---|---|---|
| YOLOv3 | 0.9491 | 0.7357 | 0.8289 | 0.7084 |
| Mask R-CNN | 0.9559 | 0.7801 | 0.8591 | 0.7567 |
Table 2.
, , Precision, Recall, F1-score, and AP of the training YOLOv3.
| Epoch | Precision | Recall | F1-Score | AP | ||
|---|---|---|---|---|---|---|
| 100 | 10.58 | 12.85 | 0.9414 | 0.5338 | 0.6813 | 0.5071 |
| 200 | 13.99 | 11.80 | 0.9625 | 0.6837 | 0.7995 | 0.6665 |
| 1000 | 12.83 | 10.23 | 0.9249 | 0.7229 | 0.8115 | 0.6768 |
| 2000 | 14.12 | 11.02 | 0.9491 | 0.7357 | 0.8289 | 0.7084 |
Table 3.
, , Precision, Recall, F1-score, and AP of the regularized model on each dataset.
| YOLOv3 | ||||||
|---|---|---|---|---|---|---|
| Without Regularization | ||||||
| Data | Precision | Recall | F1-Score | AP | ||
| Utah (Validation) | 14.12 | 11.02 | 0.9491 | 0.7357 | 0.8289 | 0.7084 |
| Potsdam | 8.861 | 9.013 | 0.9420 | 0.4022 | 0.5637 | 0.3893 |
| Selwyn | 7.424 | 10.57 | 0.8732 | 0.2358 | 0.3713 | 0.2155 |
| Toronto | 10.32 | 10.11 | 0.9645 | 0.4545 | 0.6189 | 0.4399 |
| With Regularization | ||||||
| Utah (Validation) | 14.87 | 11.93 | 0.9587 | 0.7609 | 0.8485 | 0.7380 |
| Potsdam | 8.199 | 10.10 | 0.9557 | 0.4270 | 0.5902 | 0.4153 |
| Selwyn | 8.833 | 9.923 | 0.8997 | 0.2720 | 0.4177 | 0.2505 |
| Toronto | 11.12 | 10.42 | 0.9648 | 0.4680 | 0.6303 | 0.4521 |
| Mask R-CNN | ||||||
| Without Regularization | ||||||
| Utah (Validation) | 15.57 | 10.96 | 0.9559 | 0.7801 | 0.8591 | 0.7567 |
| Potsdam | 9.329 | 8.333 | 0.9512 | 0.4450 | 0.6063 | 0.4258 |
| Selwyn | 7.011 | 9.521 | 0.8821 | 0.2600 | 0.4016 | 0.2502 |
| Toronto | 9.989 | 10.37 | 0.9714 | 0.4929 | 0.6540 | 0.4858 |
| With Regularization | ||||||
| Utah (Validation) | 16.66 | 12.24 | 0.9667 | 0.8059 | 0.8790 | 0.7878 |
| Potsdam | 9.465 | 10.54 | 0.9501 | 0.4897 | 0.6463 | 0.4667 |
| Selwyn | 7.232 | 9.873 | 0.8994 | 0.2928 | 0.4418 | 0.2708 |
| Toronto | 8.954 | 9.889 | 0.9659 | 0.5493 | 0.7003 | 0.5248 |
Table 4.
Precision, Recall, F1-score, and AP of YOLOv3 with each regularization method. This experiment is conducted on the Utah (Validation) dataset.
Table 4.
Precision, Recall, F1-score, and AP of YOLOv3 with each regularization method. This experiment is conducted on the Utah (Validation) dataset.
| Precision | Recall | F1-Score | AP | |
|---|---|---|---|---|
| No Regularization | 0.9491 | 0.7357 | 0.8289 | 0.7084 |
| Weight Decay | 0.9576 | 0.769 | 0.8530 | 0.7397 |
| Dropout | 0.9502 | 0.7333 | 0.8278 | 0.7095 |
| Ours | 0.9587 | 0.7609 | 0.8485 | 0.7380 |
Table 5.
, , Least-confidence score, Precision, Recall, F1-score, and AP of each model on the four-city dataset. , , and Least-confidence score were calculated on each unknown city dataset BEFORE retraining.
Table 5.
, , Least-confidence score, Precision, Recall, F1-score, and AP of each model on the four-city dataset. , , and Least-confidence score were calculated on each unknown city dataset BEFORE retraining.
| YOLOv3 | |||||||
|---|---|---|---|---|---|---|---|
| Data | LC | Precision | Recall | F1-Score | AP | ||
| Baseline (Utah) | - | - | - | 0.9422 | 0.4901 | 0.6448 | 0.4823 |
| Potsdam | 7.911 | 11.08 | 8.111 | 0.9586 | 0.5238 | 0.6774 | 0.5125 |
| Selwyn | 5.111 | 8.033 | 7.525 | 0.9392 | 0.5444 | 0.6893 | 0.5298 |
| Toronto | 9.667 | 11.01 | 8.333 | 0.9410 | 0.5143 | 0.6651 | 0.4995 |
| Mask R-CNN | |||||||
| Baseline (Utah) | - | - | - | 0.9512 | 0.5234 | 0.6752 | 0.5150 |
| Potsdam | 6.855 | 8.987 | 8.556 | 0.9603 | 0.5488 | 0.6984 | 0.5322 |
| Selwyn | 5.333 | 9.467 | 7.896 | 0.9495 | 0.5521 | 0.6982 | 0.5467 |
| Toronto | 8.024 | 5.355 | 8.736 | 0.9482 | 0.5393 | 0.6875 | 0.5222 |
Publisher’s Note: MDPI stays neutral with regard to jurisdictional claims in published maps and institutional affiliations. |
© 2022 by the authors. Licensee MDPI, Basel, Switzerland. This article is an open access article distributed under the terms and conditions of the Creative Commons Attribution (CC BY) license (https://creativecommons.org/licenses/by/4.0/).
Share and Cite
MDPI and ACS Style
Kawauchi, H.; Fuse, T. SHAP-Based Interpretable Object Detection Method for Satellite Imagery. Remote Sens. 2022, 14, 1970. https://doi.org/10.3390/rs14091970
AMA Style
Kawauchi H, Fuse T. SHAP-Based Interpretable Object Detection Method for Satellite Imagery. Remote Sensing. 2022; 14(9):1970. https://doi.org/10.3390/rs14091970
Chicago/Turabian StyleKawauchi, Hiroki, and Takashi Fuse. 2022. "SHAP-Based Interpretable Object Detection Method for Satellite Imagery" Remote Sensing 14, no. 9: 1970. https://doi.org/10.3390/rs14091970
Note that from the first issue of 2016, this journal uses article numbers instead of page numbers. See further details here.