
SAR-BagNet: An Ante-hoc Interpretable Recognition Model Based on Deep Network for SAR Image

Early Warning and Detection Department, Air Force Engineering University, Xi’an 710051, China
*
Author to whom correspondence should be addressed.
Remote Sens. 2022, 14(9), 2150; https://doi.org/10.3390/rs14092150
Submission received: 12 March 2022
/
Revised: 20 April 2022
/
Accepted: 28 April 2022
/
Published: 30 April 2022
(This article belongs to the Special Issue Explainable Deep Neural Networks for Remote Sensing Image Understanding)
Abstract
:Convolutional neural networks (CNNs) have been widely used in SAR image recognition and have achieved high recognition accuracy on some public datasets. However, due to the opacity of the decision-making mechanism, the reliability and credibility of CNNs are insufficient at present, which hinders their application in some important fields such as SAR image recognition. In recent years, various interpretable network structures have been proposed to discern the relationship between a CNN’s decision and image regions. Unfortunately, most interpretable networks are based on optical images, which have poor recognition performance for SAR images, and most of them cannot accurately explain the relationship between image parts and classification decisions. Based on the above problems, in this study, we present SAR-BagNet, which is a novel interpretable recognition framework for SAR images. SAR-BagNet can provide a clear heatmap that can accurately reflect the impact of each part of a SAR image on the final network decision. Except for the good interpretability, SAR-BagNet also has high recognition accuracy and can achieve 98.25% test accuracy.

1. Introduction
Synthetic Aperture Radar (SAR) imaging is an imaging technology that generates the equivalent synthetic antenna array through the relative displacement between the radar and imaging target. SAR imaging technology is less affected by external weather and has certain surface penetration ability, which makes it widely used in military target recognition, urban planning, environment monitoring, disaster assessment, and other fields [1,2,3,4,5]. Nowadays, it is increasingly important to obtain clear explanations of SAR images. SAR image explanation usually includes image segmentation, target detection, and recognition, among which target recognition is deemed as the most challenging task [6]. Synthetic aperture radar automatic target recognition (SAR-ATR) technology has been widely used in SAR image recognition studies in recent years. SAR-ATR can be divided into two stages: first extract the representative features of the SAR image and then distribute the image to a predetermined set of classes using a classifier. The recognition features are crucial to the SAR-ATR and have a significant impact on the success of the latter classifier. Most of the traditional SAR-ATR methods are designed based on rich theoretical models and expert knowledge [7]. These methods are highly interpretable, but the artificial design of features requires high domain knowledge and a time-consuming and laborious design process; furthermore, the features of SAR images cannot be fully utilized. Traditional SAR-ATR algorithms include, but are not limited to, the scattering center model (SCM)-based method [8], the principal component analysis (PCA)-based method [9,10], the sparse representation method [11,12], and the multi-features fusion method [13].
In recent years, with the rapid development of artificial intelligence technology, SAR-ATR based on the deep learning (DL) method has gradually become mainstream in this field. DL is also applied in SAR image despeckling [14], traffic sign recognition [15], glacial lake dynamic evolution monitoring [16], multi-scale fusion SAR image registration [17], and other fields. DL overcomes the limitation of a manually designed feature classifier and can build an end-to-end structure. In addition, DL can realize automatic multi-level feature extraction and synchronous learning of a target task, thus achieving significant performance improvement. At present, most of the mainstream deep learning methods for SAR-ATR are developed from the field of computer vision. The CNN is one of the most successful models in various computer vision fields. In SAR image target recognition, CNN has realized numerous remarkable achievements. Reference [1] used CNN for target identification on the MSTAR dataset and obtained better accuracy than a support vector machine (SVM). Reference [18] presented an automatic SAR target recognition method that combined with a CNN and an SVM. Reference [19] designed a large-margin softmax batch-normalization CNN (LM-BN-CNN) for SAR target recognition of ground vehicles, which has better convergence speed and higher recognition accuracy compared with traditional CNN structures.
Although the above CNN-based methods can achieve high recognition performance and computational efficiency in SAR image recognition, they are usually viewed as the “black box” whose inherent recognition mechanism lacks analysis or mathematical explanation [20]. In this case, the reliability of identification results is not as convincing as traditional target identification methods, which is sometimes fatal and unacceptable, especially in some special scenarios such as in the military field and in major disaster prediction. In order to better explain the mechanism of CNNs, many methods have been proposed to visualize the internal representation learned by CNNs in the last few years. Many of the methods on interpretability of CNNs are based on different ways of generating heatmaps that describe the importance of different regions on the image to the classification decisions. These methods can be further divided into three categories: gradient-based [21,22], perturbation-based [23,24], and class activation mapping (CAM) [6,25,26] methods. Gradient-based methods compute the gradient of the outputs of different units with respect to pixel inputs. Perturbation-based methods perturb parts of the input and determine which ones are most important to preserve the final decision. CAM methods visualize CNN decisions using feature maps of deep layers, which can provide a mathematically explicable heatmap to some extent. However, the above methods only find the regions of interest of CNNs and do not explain how CNNs rely on these areas for identification. In addition, these methods are post-hoc methods, without rigorous mathematical derivation, and their plausibility remains questionable. There are big risks in using these methods to explain CNNs. To address this problem, several ante-hoc models have been presented with structurally built-in interpretability. Because the prediction process itself is interpretable, no additional effort is needed to gain interpretation after training. A self-explaining neural network [27] obtains both concepts that are crucial in classification and the relevance of each concept separately through regularization; it then combines them to make a prediction. Case-based [28,29] interpretable models (e.g., ProtoPNet, XProtoNet) learn prototypes representing categories and make decisions by comparing features of a given image with the similarity of the learned prototypes. BagNets [30], which motivate our work, combine the performance and flexibility of CNNs with the interpretability of bag of feature (BoF) models and imitate the BoF model that classifies images according to the counts but not the spatial relationships of a set of local image features. However, the interpretable models mentioned above are based on optical images and cannot achieve satisfactory results in the interpretation of SAR images.
In this work, we put forward the SAR-BagNet model on the basis of the characteristics of SAR images. By controlling the receptive field and global stride specifically, we design a new recognition network and obtain a clear heatmap which can accurately reflect the impact of each part of the SAR image on the network decision. Experiment results showed its outstanding interpretability and high recognition accuracy for SAR images.
The remainder of this work is organized as follows. For a better understanding of the SAR-BagNet, Section 2 introduces the basic theory and details of CAM and BagNet. In Section 3, the design ideas and network structure of SAR-BagNet are introduced. In Section 4, we show the experimental results of SAR-BagNet and compare them with several commonly used interpretable models. In Section 5, we clarify some of the questions about our proposed model and discuss the contributions of this work. Finally, Section 6 concludes this study and looks forward to the future work.
2. Related Work
In order to explain CNNs, many methods have been proposed. In this section, we will introduce two ante-hoc interpretable methods that are closely related to our work.
2.1. CAM Methods
CAM was first proposed in [26] by Zhou, B.L., Khosla, A., et al. and plays an influential role in the interpretation of CNNs. CAM was originally designed specifically for CNNs that have a global average pooling (GAP) in the last convolution layer. The function of GAP is to compress each feature map in the last convolution layer into a single pixel value Pk, and then connect it to the full connection layer to obtain the final classification score Sc. In this case, the single pixel value Pk can be expressed as:
where represents the value of the k-th feature map of the last convolutional layer in coordinates (i, j). The final classification score Sc can be obtained from the equation:
where is the weight that corresponds to class c for the unit pooled from the feature map in the k-th channel. Then, the heatmap can be obtained by multiplying the weights of the full connection layer and the feature map of the last convolution layer. The spatial element of the CAM heatmap for class c can be obtained by:
In order to overcome the limitation of the GAP structure of CAM, many CAM variants have been proposed in recent years, such as Grad-CAM [25], Grad-CAM++ [31], Ablation-CAM [32], Score-CAM [33], etc. Grad-CAM is the most famous and widely used CAM-based method; Grad-CAM defines the weights ωgrad as:
where Z represents the number of pixels in the feature map. Thus, Grad-CAM can be applied to CNNs without changing the structure of the model as long as Sc is a differentiable function of . However, the Grad-CAM method does not clearly explain why it uses the average of gradients to weight each feature map, and there is a great risk for the interpretation of CNNs.
Overall, the original CAM is a method based on the internal mechanism of CNN, which can reflect the decision process of the network to a certain extent. However, the generated heatmap has low resolution and an unclear corresponding relationship with input, so it cannot clearly reflect the influence of each input region on the decision result. If the model itself is interpretable, then no additional methods are needed to interpret the model and the problems described above can be avoided. BagNets are an interpretable model that inspires our work; we will introduce the implementation method and principle of BagNets below.
2.2. DNN-Based BagNets Model
Before deep learning was popular in image recognition tasks, the Bag of Features (BoF) model was the preferred method for competitions. Before introducing DNN-based BagNets, we will recount the main elements of a classic BoF model here. BoF representations can be described by analogy with bag-of-words representations. Using bag-of-words, we can count the number of occurrences of words from a vocabulary in a document. This vocabulary contains important words (but not common words, such as “this” or “the”) and clusters of words (e.g., semantically similar words, such as “excellent” and “outstanding”). The counts of each word in the vocabulary are combined into a long-term vector. This is called the bag-of-words document representation because the order of all the words is lost. Similarly, BoF representation is based on a visual vocabulary that represents local image feature clusters. The term vector of an image is the number of occurrences of each visual word in the vocabulary. This term vector is used as the input of a classifier, such as multilayer perceptron (MLP) or SVM [34].
BoF models are easy to interpret if the classifier is linear. In this case, the influence of a given part of the input on the classifier is independent of the rest of the input. The word linear here refers to the combination of a linear spatial aggregation (a simple average) and a linear classifier on top of the aggregated features. The fact that the classifier and the spatial aggregation are both linear and thus interchangeable allows us to pinpoint exactly how evidence from local image patches is integrated into one image-level decision. Based on this insight, Reference [30] constructs linear DNN-based BoF models (BagNets).
DNN-based BagNets are similar to the CAM as they also use a CNN with global average pooling and a linear classifier in order to extract class-specific heatmaps. However, their latent representations are extracted from the whole image, and it is unclear how the heatmaps in the latent space are related to the pixel space. In BagNets, the receptive field of CNNs is limited to very small image patches, making it possible to trace exactly how each image patch contributes to the final decision. The basic principle of DNN-based BagNets can be shown in Figure 1. Figure 1a shows that each small image patch is input into BagNets, and then the BagNets extract features from the small image patches and generate activation in the corresponding region of the heatmap. In this case, a specific class c activations (logits) Lc of a q × q pixel patch of an image can be expressed by Equation (3). Figure 1b represents that BagNets yield one logit heatmap per class; these heatmaps are averaged spatially and the final class probability is obtained by a softmax layer. Then, the total score Sc of an image in the k-th class can be expressed as:
where n denotes the number of units in a feature map. is the weight that corresponds to class c for the unit pooled from the feature map in the k-th channel. The reason for 1/n in the equation is that there is a GAP layer behind the last convolution layer.
It can be seen from Figure 1 that the decision results of DNN-based BagNets are obtained directly from the heatmaps, so this network architecture has good interpretability.
3. Our Model
3.1. Inspiration and Motivation
Although the BagNets have excellent explicability in optical images, they are not applicable to SAR images. This is mainly because these interpretable models are based on high-resolution optical images with rich information, whereas SAR images are quite different. (1) The resolution of a SAR image is generally lower than that of an optical image and has strong noise. (2) In SAR images, the target usually occupies only a small area of the image, whereas in optical images, the target usually occupies more than half of the image area, such as the CUB-200 dataset and the CIFRA-10 dataset. These differences require that a model that can generate more refined heatmaps and have higher recognition accuracy for SAR image interpretation.
The original BagNets are able to produce a clear heatmap. However, these heatmaps are post-hoc generated and cannot truly reflect the model recognition process. The ante-hoc heatmaps generated by BagNets have a large disparity in resolution size compared to the original image. This is mainly because BagNets only considers the change of receptive field but not the change of global stride. As shown in Figure 1, the BagNet with a receptive field of 2 × 2 and global stride size of 2 only can generate a heatmap of 3 × 3 on a 6 × 6 image, which is not sufficient for SAR images. To better interpret SAR images, we need more detailed heatmaps. In addition, the BagNets are designed based on ResNet-50 and has 50 convolutional layers. Generally, for relatively large datasets, neural networks with more convolutional layers are conducive to the improvement of recognition accuracy, whereas for small datasets, overfitting is prone to occur. Due to the complexity of SAR image acquisition, it is difficult to build a large SAR image dataset, so a small network model is needed for SAR image recognition.
In order to solve the above problems, we propose the SAR-BagNet model. The detailed procedures of the SAR-BagNet and the specific difference between it and BagNets will be elucidated in what follows.
3.2. SAR-BagNet Model
For SAR image recognition, we want a network structure with both high recognition accuracy and good interpretability. In our network design process, we found three key factors that have important influence on the accuracy and interpretability of the network, i.e., receptive field, global stride, and network padding.
One of the most basic concepts in deep CNNs is the receptive field (RF). The value of each unit in the feature map depends on a region of the input of the convolutional network—this is the receptive field of the unit [35]. Assume that a CNN with n convolutional layers has no pooling layer in the middle of the convolution layer; then, the calculation formula of the receptive field on the input image corresponding to each unit in the feature map of the last convolution layer can be written as [36]:
where RFn denotes the size of the receptive field of the n-th layer to be calculated, RFn−1 denotes the calculated size of the receptive field at layer n − 1, fn denotes the size of the n-th convolution kernel, and denotes the stride corresponding to the i-th convolution layer.
In the BagNet architecture, the size of the receptive field will affect the precision of the heatmap. If the receptive field becomes smaller, the region corresponding to a unit on the heatmap will also become smaller, which will obviously increase the fineness of the heatmap. However, a smaller receptive field means that the image is segmented into smaller patches, which results in the loss of more characteristic information of the image and makes it harder for the network to classify objects.
Global stride represents the equivalent stride of a convolutional neural network on the input image. The global stride Sg of a convolutional neural network is equal to the stride multiplication of all the convolutional layers:
We can see from Figure 1 that the global stride size will affect the number of SAR images segmented into patches and the resolution of heatmap. The more patches segmented by an image, the more feature information of the image input into the network, which is conducive to improving the identification accuracy of the network.
The size of the heatmap determines the fineness of the heatmap. We can observe from Equation (3) that the size of the heatmap is the same as that of the feature map of the last convolution layer. The size Qn of the feature map of the n-th convolutional layer can be written as:
where W denotes the size of the input image and P denotes the number of turns required to pad the edges of the image. The symbol [] indicates rounding down after the calculation is completed.
During the network design process, we find that parameter P also has a great influence on SAR image recognition. In SAR-BagNet, we set P = 0 for all convolution layers; the reason for this is shown in Figure 2. Unlike colored optical images, SAR images are gray, and the high brightness boundary of SAR images and black padding boundary will create a local feature, which is manifested in the heatmap as a high active mapping at the edge. This phenomenon will cause network misjudgment, which we do not want to see. In Figure 2, the region represented by the red box is the region that generated high activation, and the corresponding region on the heatmap is shown as the darker red region. The local area represented by the green box in the SAR image has low brightness and little difference from the color of the black edges. The features formed in the green box area are not activated on the heatmap. According to the experimental results, in order to avoid introducing additional features, we set the network parameter P = 0.
When P = 0, Equation (8) becomes:
In the BagNets [30], the global stride size Sg is fixed at 8. The model only considers the influence of the change of the receptive field on the resolution of the heatmap and the recognition accuracy of the model, but it does not consider changes in global stride. Therefore, the ante-hoc heatmap obtained by BagNets has a low resolution and is not applicable to SAR images. According to Equation (9), for a given image with a size of W × W, in order to increase the value of Qn, one is to reduce the receptive field RFn and the other is to reduce the global stride size Sg. Because the effect of the receptive field on the model’s recognition accuracy and interpretability is contradictory, we explore the effect of global stride size on the model in order to obtain a model that can achieve a high recognition rate and produce a fine heatmap.
Based on the above analysis, BagNets with different global strides and different receptive fields were designed under the framework of ResNet-18 in order to achieve high accuracy and interpretability in SAR image recognition. The reason for adopting the ResNet-18 framework is that the ResNet-18 network has only 18 convolution layers, which is suitable for SAR image datasets with less data. We compared the recognition accuracy (validation sets in the MSTAR dataset) of BagNets with RF = 13, RF = 19, and RF = 25 at global stride sizes of 1, 4, and 8, respectively, and the results are shown in Figure 3.
In Figure 3, with the increase in global stride size, the recognition accuracy of different networks decreases in general. In addition, under the same global stride size, networks with larger receptive fields have higher recognition accuracy, which is consistent with the above analysis. When RF = 25 and Sg = 1, the recognition accuracy of the model is the highest. However, large receptive fields mean poor interpretability. In order to balance interpretability and high recognition accuracy, we choose the model with RF = 19, Sg = 1, which not only has a small receptive field but also a high recognition accuracy. Meanwhile, according to Equation (9), when the size W of the input image of the model is 100, the size Qn of the heatmap is 82. The size difference between the heatmap and the input image is small, which can ensure the model has good interpretability to SAR images. Based on the above experimental comparison, we proposed the SAR-BagNet model, in which the receptive field of the model is 19 and the global stride is 1. The specific SAR-BagNet structure is shown in Figure 4.
According to Equation (6), because the global stride is 1, whenever a convolution layer with 1 × 1 convolution kernel is added to the network, the size of the receiving domain remains unchanged, whereas whenever a convolution layer with 3 × 3 convolution kernel is added to the network, the size of the receiving domain increases by 2. In the SAR-BagNet architecture, there are nine convolution layers with the 3 × 3 convolution kernel, so RF = 19 can be calculated.
The SAR-BagNet is modified based on the framework of ResNet-18, replacing the original convolution kernel with 1 × 1 and 3 × 3 convolution kernels. Each convolutional layer is followed by a BatchNorm layer and ReLU layer. In the model, the stride of all convolution layers is 1 and the padding is 0; the downsampling operation is a simple 1 × 1 convolution layer with stride 1.
4. Experiments
In this section, we will compare our model with ResNet-18 [37], ProtoPNet [28], and BagNets [30] on the commonly used public MSTAR dataset. In the process of training the model, Adam is adopted as the optimizer, with learning rate LR = 1 × 10⁻³, β1 = 0.9 (the exponential decay rate for the 1st moment estimates), and β2 = 0.99 (the exponential decay rate for the 2nd moment estimates). MSTAR was launched in the mid-1990s by the Defense Advanced Research Projects Agency (DARPA). The high-resolution bunched SAR is used to collect SAR images of various former Soviet military vehicles. The MSTAR dataset includes SAR images of 10 different classes of vehicles, including 2S1 (Self-Propelled Howitzer), BDRM2 (Armored Reconnaissance vehicle), BTR60 (Armored Personnel Carrier), D7 (Bulldozer), T72 (Main Battle Tank), BMP2 (Infantry Fighting Vehicle), BTR70 (Armored Personnel Carrier), T62 (Tank), ZIL131 (Military Truck), and ZSU234 (self-propelled anti-aircraft gun), which are numbered from Class 0 to Class 9 in order. The 10 classes of targets with a depression angle of 15° were used as the training set, and the 10 classes of targets with a depression angle of 17° were used as the verification set. On the MSTAR dataset, the initial SAR images are gray scale; to avoid modification of the parameters of ProtoPNet and BagNets, all the SAR images are transformed into pseudo-RGB images (copy the gray image in all three channels). In data preprocessing, we process the training dataset using normalization, horizontal and vertical rotation, random panning, and image brightness transformation to increase the generalization ability of the model. All the SAR images are cropped to the size of 100 × 100. Because ProtoPNet was trained with 224 × 224 images, the SAR image was upsampled during the training process, and its size was increased to 224 × 224. We selected BagNet-17 and BagNet-33 from the BagNets, and the receptive fields of these two networks are 17 × 17 and 33 × 33, respectively.
4.1. Comparison and Analysis of Experimental Results
4.1.1. Comparison of Recognition Accuracy
ProtoPNet [28] and BagNets [30] are widely used interpretable models. It is important to point out that these two models have achieved similar recognition accuracy in optical image recognition tasks as traditional CNNs (e.g., Alexnet, ResNet-18). In SAR image recognition, the recognition accuracy of each model in the validation set is shown in Table 1. From Table 1, ResNet-18 obtains the highest recognition accuracy, whereas ProtoPNet obtains the lowest. It can be seen that the ProtoPNet model has a low recognition accuracy in SAR images, which is mainly because of the great difference between SAR images and optical images. In the BagNets, the recognition accuracy of BagNet-33 is higher than that of BagNet-17, which is mainly attributed to the larger receptive field of BagNet-33 than that of BagNet-17.
The recognition accuracy of the SAR-BagNet is higher than the other three and slightly lower than ResNet-18. For the ResNet-18 network, its receptive field is 432 × 432. It is generally believed that the larger the receptive field of the network is, the richer features can be extracted from the image, including not only local features but also global features. Such a large receptive field is conducive to the improvement of recognition accuracy, but it brings the problem of lack of interpretability. Due to the small receptive field of SAR-BagNet, the global features in the images cannot be extracted by the network, so the accuracy of the SAR-BagNet network is slightly lower than the ResNet-18 network, but it brings the advantage of good interpretability (see below). In some special application scenarios, some recognition accuracy can be sacrificed to obtain better interpretability.
4.1.2. Heatmap Comparison of Models
The heatmap can reflect the influence of each region in the SAR image on the model recognition result. Due to the existence of strong interference, we need a more accurate heatmap to explain the SAR image recognition. Our model is designed according to the characteristics of SAR images, which not only ensures high recognition accuracy but also generates a heatmap that can well reflect the influence of different regions of SAR images on recognition. To compare the interpretability of the models, we contrast the heatmaps generated by these models.
Because ResNet-18 has a global average pooling layer, the CAM method is used to generate the heatmap. In the BagNet model, we choose BagNet-33 with high recognition accuracy to obtain the heatmap. The heatmap for ProtoPNet is considered less convincing and reasonable in view of the low accuracy, 78.34%; thus, here only the heatmaps from ResNet-18, BagNet-33, and SAR-BagNet are shown.
In Figure 5, the red area represents a positive impact on the model’s decision results, whereas the blue area represents a negative impact on the model’s decision process. Darker areas indicate greater influence on the results. The positive and negative impact can be understood as follows: in order to distinguish a person’s gender, certain characteristics such as hair length, clothing color, height, and facial features can be used as evidence. If a man has long hair, this feature has a negative impact on the results, and conversely, it has a positive impact on the results for a woman (generally, long hair is considered a female characteristic).
When the decision results of ResNet-18 are interpreted by the CAM method, the heatmap can only give a wide range of regions. In addition, because the receptive field of ResNet-18 covers the whole image, the heatmap cannot determine the regions in the image, resulting in weak interpretability. Compared with the heatmap generated by the CAM method, the heatmap generated by the BagNet-33 model can reflect which part of the picture has a greater impact on the results, but it cannot obtain a more accurate structure of the target. The heatmap generated by our model can not only accurately reflect the influence of each patch in the image on the decision result but also reflect the influence of the small structure in the target on the decision result to a certain extent. In the heatmaps of Figure 5a,f, the edge of the target is highlighted, indicating that the position of the edge of the target has a strong positive influence on the classification results.
The heatmap generated by our model in class 3 is shown in Figure 5d; the red positions in the heatmap are not all target positions, and the red areas also appear in the background area of the SAR image. In this case, the model can also correctly classify SAR targets. This indicates that the SAR-BagNet’s recognition of the third class of the SAR image depends largely on the background information and not just the target. It is obviously unreasonable to use the background information in the third class of the target SAR image instead of the target information for classification. This phenomenon was also found in Reference [6]. The reference found that when the background information was blocked, the neural network could not recognize the target. Because the Self-Matching CAM method proposed in Reference [6] is not well interpretable, the author attributed this phenomenon to the network learning some information unrelated to the target, but this information exists in different categories of SAR images. Due to the poor interpretability of the method in Reference [6], the author does not explain what the information is. In a practical application, it is difficult to find these potential risks if an unexplained model is applied in the SAR image recognition field. This illustrates the importance of interpretability of the model in the field of SAR image recognition.
4.2. Interpretability Analysis of SAR-BagNet
4.2.1. Recognition Process of SAR-BagNet
The process of training the SAR-BagNet is the same as that of ordinary convolutional networks, and we do not need to manually segment the image. The trained SAR-BagNet will learn the features of each class. When similar category features appear, SAR-BagNet will generate strong activation mapping on the heatmap of the corresponding class. Because each image input into SAR-BagNet is a patch on the complete SAR image, it is possible to discern which class of features the patch most closely resembles based on the strength of the activation mapping generated by this patch on the heatmap of each class. The activation mapped regions of the patch on the heatmap correspond to the regions of the patch on the SAR image, so the impact of each region in the image on the recognition result can be determined from the heatmap. The complete recognition process of SAR-BagNet is shown in Figure 6.
In the process of image recognition, SAR-BagNet generates a heatmap for each class. The class activation of a patch of the input image on each class can be displayed on the heatmap, and the class activation of all patches on the heatmap constitutes the complete heatmap. The average value of the heatmap is equivalent to the matching degree of the input image and the corresponding category of the heatmap, and the images can be classified according to the average value of the heatmap.
After obtaining the heatmap, we can find the corresponding region in the original SAR image, so as to determine the contribution degree of each patch in the SAR image to the model decision. As shown in Figure 6b, SAR-BagNet controls the receptive field and global stride size so that each patch of the SAR image corresponds strictly to a certain value on the heatmap. Such correspondence ensures that the model has good interpretability.
4.2.2. Analysis of Salient Features
The principle of SAR-Bagnet is analogous to that of the BoF model. Just like the BoF model mentioned above, we want the model to cluster words with similar meanings (e.g., “excellent” and “outstanding”), i.e., the model has similar activation for words with similar meanings. For the SAR-BagNet model, we want the model to have similar activation for similar patches. We selected similar SAR images in the same classes for comparison, and the experimental results are shown in Figure 7. In Figure 7a, for similar SAR images of class 4, their corresponding heatmaps are also similar. From these heatmaps, we can see that in different SAR images, the target edge region has strong activation on the heatmap. In Figure 7b, there is an obvious line-like feature in the patch in the red box, and it may be caused by cavity scattering on the target which does not exist on targets of the other classes. In different SAR images, this feature generates strong activation on the heatmap. The experimental results show that SAR-BagNet learns some robust classification features during the training process, which are applied to the classification of SAR images by the model.
We also compared different classes of heatmaps corresponding to the same SAR image, as shown in Figure 8. In Figure 8, the same area in the SAR image can have a positive effect on the right class of the heatmap and a negative effect on the wrong class of the heatmap. For the images of class 5 and 6, it is very difficult for humans to find the category features that can correctly classify targets from SAR images. However, for the SAR-BagNet, it is easy to extract the classification features from the target, so as to carry out the correct classification. In recent years, learning imaging has been widely used in SAR imaging [38,39]. However, it is difficult to objectively evaluate the effects of learning imaging. The statistical evaluation indexes, such as image entropy and image contrast, used in natural image processing are not completely suitable for radar images and the indexes, such as mean square error, peak signal-to-noise ratio, and structural similarity, require known target reference images, which are difficult to apply to measured radar data. Most of the evaluation of the imaging effect is based on people’s subjective feelings. From the point of view of recognition, this may result in the imaging effect and the final recognition effect being inconsistent. That is, the SAR image that people think is clear may contain no or very little category information for the recognition model. SAR-BagNet can be used to objectively evaluate whether SAR objects generated by learning imaging contain category information.
4.2.3. Misclassification Interpretation of Models
In this section, we will discuss the causes of classification errors in different categories of SAR-BagNet. The classification accuracy and confusion matrix of each class of SAR-BagNet are given in Table 2 and Figure 9.
From Table 2, we can see that the recognition accuracy of SAR-BagNet in BMP2 and BTR70 is relatively low, which is 94.33% and 95.58%, respectively. It can be seen from the confusion matrix of SAR-BagNet that the misclassification of BMP2 is mostly concentrated in BTR70, whereas the misclassification of BTR70 is mostly concentrated in BMP2. In fact, the BMP2 is the infantry fighting vehicles and the BTR70 is the armored personnel carriers. The appearance of the two class of targets itself is very similar. Due to the strong noise of SAR images, the local scattering characteristics of targets are easily disturbed by noise, which leads to the error classification of SAR-BagNet when classifying according to patches on images. The BRDM2 class achieves the highest recognition accuracy; the main reason is that the BRDM2 class is very different from the other nine class targets in terms of appearance and background. The SAR-BagNet can easily extract the class information from the patch features of the BRDM2 class. For targets with small appearance differences, the recognition accuracy of the SAR-BagNet network decreases due to the lack of global features. For targets with large appearance differences, SAR-BagNet can achieve high recognition accuracy even though it only uses patch features.
We selected several incorrectly classified images and compared the heatmaps of SAR-BagNet on the true class and the predicted class. The comparison results and corresponding positions on the original image are shown in Figure 10. In Figure 10a, targets on SAR images have a stronger positive impact in the prediction class than in the true class. In Figure 10b,c, the target area in the SAR image exerts a negative impact on the heatmap of the true class and a positive impact on the prediction class. These reasons lead to the misclassification of the model. These heatmaps can reflect the influence of various parts of the target on the classification results of the model. For incorrect classifications, we can compare the heatmaps to locate the regions in the SAR images that make the network misclassify. Combined with the imaging mechanism of SAR images and the physical scattering characteristics of the target, we can explore the deeper causes of the errors and thus improve the SAR imaging algorithm and recognition model, which cannot be achieved by other uninterpreted models.
5. Discussion
In this study, we verify the effectiveness of BagNet-based methods in SAR image recognition and interpretation and propose SAR-BagNet according to the characteristics of SAR images. This architecture is not fixed but can change according to specific tasks. For example, for the ImageNet dataset, which has a large number of samples and categories, we can choose ResNet-50 or ResNet-101 as the basic framework; we then explore the interpretability and recognition accuracy of the model by the receptive field and global step size and finally select the appropriate model. The approach we propose is not just a specific model but an architecture and network design idea.
Regarding the fact that most of the red areas in the heatmap of Figure 5d are located in the background area, it is necessary to clarify here that this does not mean that SAR-BagNet does not learn the category information in class 3. As shown in Table 2, the recognition accuracy of the target in class 3 is 99.66%, which indicates that most of the class information in class 3 is located in the background area, i.e., the difference in the background can be used to distinguish class 3 from other classes. Due to the non-interpretable nature of traditional CNNs, it is unknown whether traditional CNNs make use of the third class of background information for classification. Therefore, although high recognition accuracy can be achieved by using traditional CNNs for SAR target recognition, the recognition results of the network are highly risky because it is possible that the network is using information that is not related to the target to make the judgment.
Interpretability is an important characteristic and research topic of the next generation artificial intelligence system. A model with strong interpretability enables users to better understand the decision-making process of the machine, so as to determine the confidence of the corresponding results and increase people’s trust in the system. The SAR-BagNet model architecture proposed in this work can visualize the process of SAR image recognition using a model and reduce the risk of recognition. It has strong practical significance for some fields with high reliability requirements, such as military and disaster detection fields. In addition, SAR-BagNet can show the causes of model discrimination errors, and this has certain application prospects for improving and objectively evaluating SAR imaging algorithms.
6. Conclusions
A SAR-BagNet model that can provide a novel and accurate explanation for SAR image interpretation is proposed in this work. SAR-BagNet was originally inspired by the BagNet model, but compared to the BagNet model, SAR-BagNet can generate clearer heatmaps and higher recognition accuracy. Therefore, SAR-BagNet is particularly suitable for SAR images whose resolution is low and whose texture feature is not as vivid as optical images. In addition, as the heatmap generated by the SAR-BagNet model determines the classification results, the interpretation method adopted by SAR-BagNet is the ante-hoc interpretation method. The ante-hoc interpretation method is directly faithful to the decision-making process and is more credible and reasonable than the post-hoc interpretation methods. In comparison to other interpretable models, the proposed model can precisely display the influence of each region of the SAR image on classification results rather than a rough coverage. This model will help to increase the reliability of SAR image classification results. In the following work, we will combine the heatmap generated by the SAR-BagNet with the imaging mechanism and physical characteristics of SAR images, so as to explore the deeper recognition features of SAR images.
Author Contributions
P.L. and X.H. proposed the model and network; C.F. and Z.T. conceived and designed the experiments; P.L. and X.H. wrote the manuscript. All authors have read and agreed to the published version of the manuscript.
Funding
This research received no external funding.
Data Availability Statement
The experimental dataset adopted in this work is the measured SARground stationary target data provided by the MSTAR program supported by the Defense Advanced Research Projects Agency (DARPA) of the United States. We have uploaded the MSTAR dataset to the Github repository. The code for this article has been released at: https://github.com/xwhu002/SAR-BagNet. The last accesed date is 20 April 2022.
Acknowledgments
The authors thank all the reviewers and editors for their great help and useful suggestions.
Conflicts of Interest
The authors declare no conflict of interest.
References
- Wang, Y.P.; Zhang, Y.B.; Qu, H.Q.; Tian, Q. Target Detection and Recognition Based on Convolutional Neural Network for SAR Image. In Proceedings of the 2018 11th International Congress on Image and Signal Processing, BioMedical Engineering and Informatics, Beijing, China, 13–15 October 2018. [Google Scholar]
- Cai, J.; Jia, H.; Liu, G.; Zhang, B.; Liu, Q.; Fu, Y.; Wang, X.; Zhang, R. An Accurate Geocoding Method for GB-SAR Images Based on Solution Space Search and Its Application in Landslide Monitoring. Remote Sens. 2021, 13, 832. [Google Scholar] [CrossRef]
- Cho, J.H.; Park, C.G. Multiple Feature Aggregation Using Convolutional Neural Networks for SAR Image-Based Automatic Target Recognition. IEEE Geosci. Remote Sens. Lett. 2018, 56, 1882–1886. [Google Scholar] [CrossRef]
- Cao, H.; Zhang, H.; Wang, C.; Zhang, B. Operational Flood Detection Using Sentinel-1 SAR Data over Large Areas. Water 2019, 11, 786. [Google Scholar] [CrossRef] [Green Version]
- Quan, S.; Xiong, B.; Xiang, D.; Zhao, L.; Zhang, S.; Kuang, G. Eigenvalue-based urban area extraction using polarimetric SAR data. IEEE J. Sel. Top. Appl. Earth Observ. Remote Sens. 2018, 11, 458–471. [Google Scholar] [CrossRef]
- Feng, Z.; Zhu, M.; Stanković, L.; Ji, H. Self-Matching CAM: A Novel Accurate Visual Explanation of CNNs for SAR Image Interpretation. Remote Sens. 2021, 13, 1772. [Google Scholar] [CrossRef]
- Hu, X.; Feng, W.; Guo, Y.; Wang, Q. Feature Learning for SAR Target Recognition with Unknown Classes by Using CVAE-GAN. Remote Sens. 2021, 13, 3554. [Google Scholar] [CrossRef]
- Li, T.; Du, L. SAR Automatic Target Recognition Based on Attribute Scattering Center Model and Discriminative Dictionary Learning. IEEE Sens. J. 2019, 19, 4598–4611. [Google Scholar] [CrossRef]
- Pei, J.; Huang, Y.; Huo, W.; Wu, J.; Yang, J.; Yang, H. SAR Imagery Feature Extraction Using 2DPCA-Based Two-Dimensional Neighborhood Virtual Points Discriminant Embedding. IEEE J. Sel. Top. Appl. Earth Obs. Remote Sens. 2016, 9, 2206–2214. [Google Scholar] [CrossRef]
- Mishra, A. Validation of PCA and LDA for SAR ATR. In Proceedings of the IEEE Region 10 Conference, Hyderabad, India, 19–21 November 2008; pp. 1–6. [Google Scholar]
- Zhou, Z.; Cao, Z.; Pi, Y. Subdictionary-Based Joint Sparse Representation for SAR Target Recognition Using Multilevel Reconstruction. IEEE Trans. Geosci. Remote Sens. 2019, 57, 6877–6887. [Google Scholar] [CrossRef]
- Sun, Y.; Du, L.; Wang, Y.; Wang, Y.H.; Hu, J. SAR Automatic Target Recognition Based on Dictionary Learning and Joint Dynamic Sparse Representation. IEEE Geosci. Remote Sens. Lett. 2016, 13, 1777–1781. [Google Scholar] [CrossRef]
- Srinivas, U.; Monga, V.; Raj, R.G. SAR Automatic Target Recognition Using Discriminative Graphical Models. IEEE Trans. Aerosp. Electron. Syst. 2014, 50, 591–606. [Google Scholar] [CrossRef]
- Lattari, F.; Gonzalez Leon, B.; Asaro, F.; Rucci, A.; Prati, C.; Matteucci, M. Deep Learning for SAR Image Despeckling. Remote Sens. 2019, 11, 1532. [Google Scholar] [CrossRef] [Green Version]
- Dewi, C.; Chen, R.-C.; Yu, H.; Jiang, X. Robust detection method for improving small traffic sign recognition based on spatial pyramid pooling. J. Ambient Intell. Humaniz. Comput. 2021. [Google Scholar] [CrossRef]
- Zhang, B.; Liu, G.; Zhang, R.; Fu, Y.; Liu, Q.; Cai, J.; Wang, X.; Li, Z. Monitoring Dynamic Evolution of the Glacial Lakes by Using Time Series of Sentinel-1A SAR Images. Remote Sens. 2021, 13, 1313. [Google Scholar] [CrossRef]
- Mao, S.; Yang, J.; Gou, S.; Jiao, L.; Xiong, T.; Xiong, L. Multi-Scale Fused SAR Image Registration Based on Deep Forest. Remote Sens. 2021, 13, 2227. [Google Scholar] [CrossRef]
- Wu, T.D.; Yen, J.; Wang, J.H.; Huang, R.J.; Lee, H.W.; Wang, H.F. Automatic Target Recognition in SAR Images Based on a Combination of CNN and SVM. In Proceedings of the 2020 International Workshop on Electromagnetics: Applications and Student Innovation Competition (iWEM), Makung, Taiwan, 26–28 August 2020. [Google Scholar]
- Zhou, F.; Wang, L.; Bai, X.R.; Hui, Y.; Zhou, Z. SAR ATR of Ground Vehicles Based on LM-BN-CNN. IEEE Trans. Geosci. Remote Sens. 2018, 56, 7282–7293. [Google Scholar] [CrossRef]
- Lipton, Z.C. The Mythos of Model Interpretability: In machine learning, the concept of interpretability is both important and slippery. Queue 2018, 16, 31–57. [Google Scholar] [CrossRef]
- Shrikumar, A.; Greenside, P.; Shcherbina, A.; Kundaje, A. Not just a black box: Learning important features through propagating activation differences. arXiv 2016, arXiv:1605.01713. [Google Scholar]
- Simonyan, K.; Vedaldi, A.; Zisserman, A. Deep inside convolutional networks: Visualising image classification models and saliency maps. arXiv 2013, arXiv:1312.6034. [Google Scholar]
- Fong, R.C.; Vedaldi, A. Interpretable explanations of black boxes by meaningful perturbation. In Proceedings of the IEEE International Conference on Computer Vision, Venice, Italy, 22–29 October 2017; pp. 3429–3437. [Google Scholar]
- Qi, Z.; Khorram, S.; Li, F. Visualizing Deep Networks by Optimizing with Integrated Gradients. In Proceedings of the CVPR Workshops, Long Beach, CA, USA, 16–20 June 2019. [Google Scholar]
- Selvaraju, R.R.; Cogswell, M.; Das, A.; Vedantam, R.; Parikh, D.; Batra, D. Grad-cam: Visual explanations from deep networks via gradient-based localization. In Proceedings of the IEEE International Conference on Computer Vision, Venice, Italy, 22–29 October 2017; pp. 618–626. [Google Scholar]
- Zhou, B.; Khosla, A.; Lapedriza, A.; Oliva, A.; Torralba, A. Learning deep features for discriminative localization. In Proceedings of the IEEE Conference on Computer Vision and Pattern Recognition, Las Vegas, NV, USA, 27–30 June 2016; pp. 2921–2929. [Google Scholar]
- Alvarez-Melis, D.; Jaakkola, T.S. Towards robust interpretability with self-explaining neural networks. arXiv 2018, arXiv:1806.07538. [Google Scholar]
- Chen, C.; Li, O.; Tao, C.; Barnett, A.J.; Su, J.; Rudin, C. This looks like that: Deep learning for interpretable image recognition. arXiv 2018, arXiv:1806.10574. [Google Scholar]
- Kim, E.; Kim, S.; Seo, M.; Yoon, S. XProtoNet: Diagnosis in Chest Radiography with Global and Local Explanations. In Proceedings of the IEEE/CVF Conference on Computer Vision and Pattern Recognition, Las Vegas, NV, USA, 27–30 June 2016; pp. 15719–15728. [Google Scholar]
- Brendel, W.; Bethge, M. Approximating cnns with bag-of-local-features models works surprisingly well on imagenet. arXiv 2019, arXiv:1904.00760. [Google Scholar]
- Aditya, C.; Anirban, S.; Abhishek, D.; Prantik, H. Grad-CAM++: Improved Visual Explanations for Deep Convolutional Networks. arXiv 2018, arXiv:1710.11063v34. [Google Scholar]
- Saurabh, D.; Harish, G.R. Ablation-CAM: Visual Explanations for Deep Convolutional Network via Gradient-free Localization. In Proceedings of the 2020 IEEE Winter Conference on Applications of Computer Vision (WACV), Snowmass, CO, USA, 1–5 March 2020. [Google Scholar]
- Wang, H.F.; Wang, Z.F.; Du, M.N. Methods for Interpreting and Understanding Deep Neural Networks. In Proceedings of the 2020 IEEE/CVF Conference on Computer Vision and Pattern Recognition Workshops (CVPRW), Seattle, WA, USA, 14–19 June 2020. [Google Scholar]
- O’Hara, S.; Draper, B.A. Introduction to the bag of features paradigm for image classification and retrieval. arXiv 2011, arXiv:1101.3354. [Google Scholar]
- Luo, W.; Li, Y.; Urtasun, R.; Zemel, R. Understanding the effective receptive field in deep convolutional neural networks. In Proceedings of the 30th International Conference on Neural Information Processing Systems, Barcelona, Spain, 5–10 December 2016; pp. 4905–4913. [Google Scholar]
- Dumoulin, V.; Visin, F. A guide to convolution arithmetic for deep learning. arXiv 2016, arXiv:1603.07285. [Google Scholar]
- He, K.; Zhang, X.; Ren, S.; Sun, J. Deep residual learning for image recognition. In Proceedings of the Neural Information Processing Systems 29, Barcelona, Spain, 5–10 December 2016; pp. 770–778. [Google Scholar]
- Pu, W. SAE-Net: A Deep Neural Network for SAR Autofocus. IEEE Trans. Geosci. Remote Sens. 2022, 60, 1–14. [Google Scholar] [CrossRef]
- Zhao, S.; Ni, J.; Liang, J.; Xiong, S.; Luo, Y. End-to-End SAR Deep Learning Imaging Method Based on Sparse Optimization. Remote Sens. 2021, 13, 4429. [Google Scholar] [CrossRef]
Figure 1.
The basic principle of DNN-based BagNets (the image size is 6 × 6 pixels and the model has a receptive field of 2 × 2 pixels and a global stride of 2, The blue, orange and black dots represent the convolution layer, the global average pooling layer and the full connection layer respectively. The white, pink, and orange squares show different intensities of activation, increasing in order). (a) BagNets extract class activations (logits) on each patch. (b) Evaluating all patches yields one heatmap per class.

Figure 2.
SAR image with P ≠ 0 and the corresponding heatmap. Red circle indicates highly active areas on the heatmap and green circle indicates inactive areas.
Figure 2.
SAR image with P ≠ 0 and the corresponding heatmap. Red circle indicates highly active areas on the heatmap and green circle indicates inactive areas.
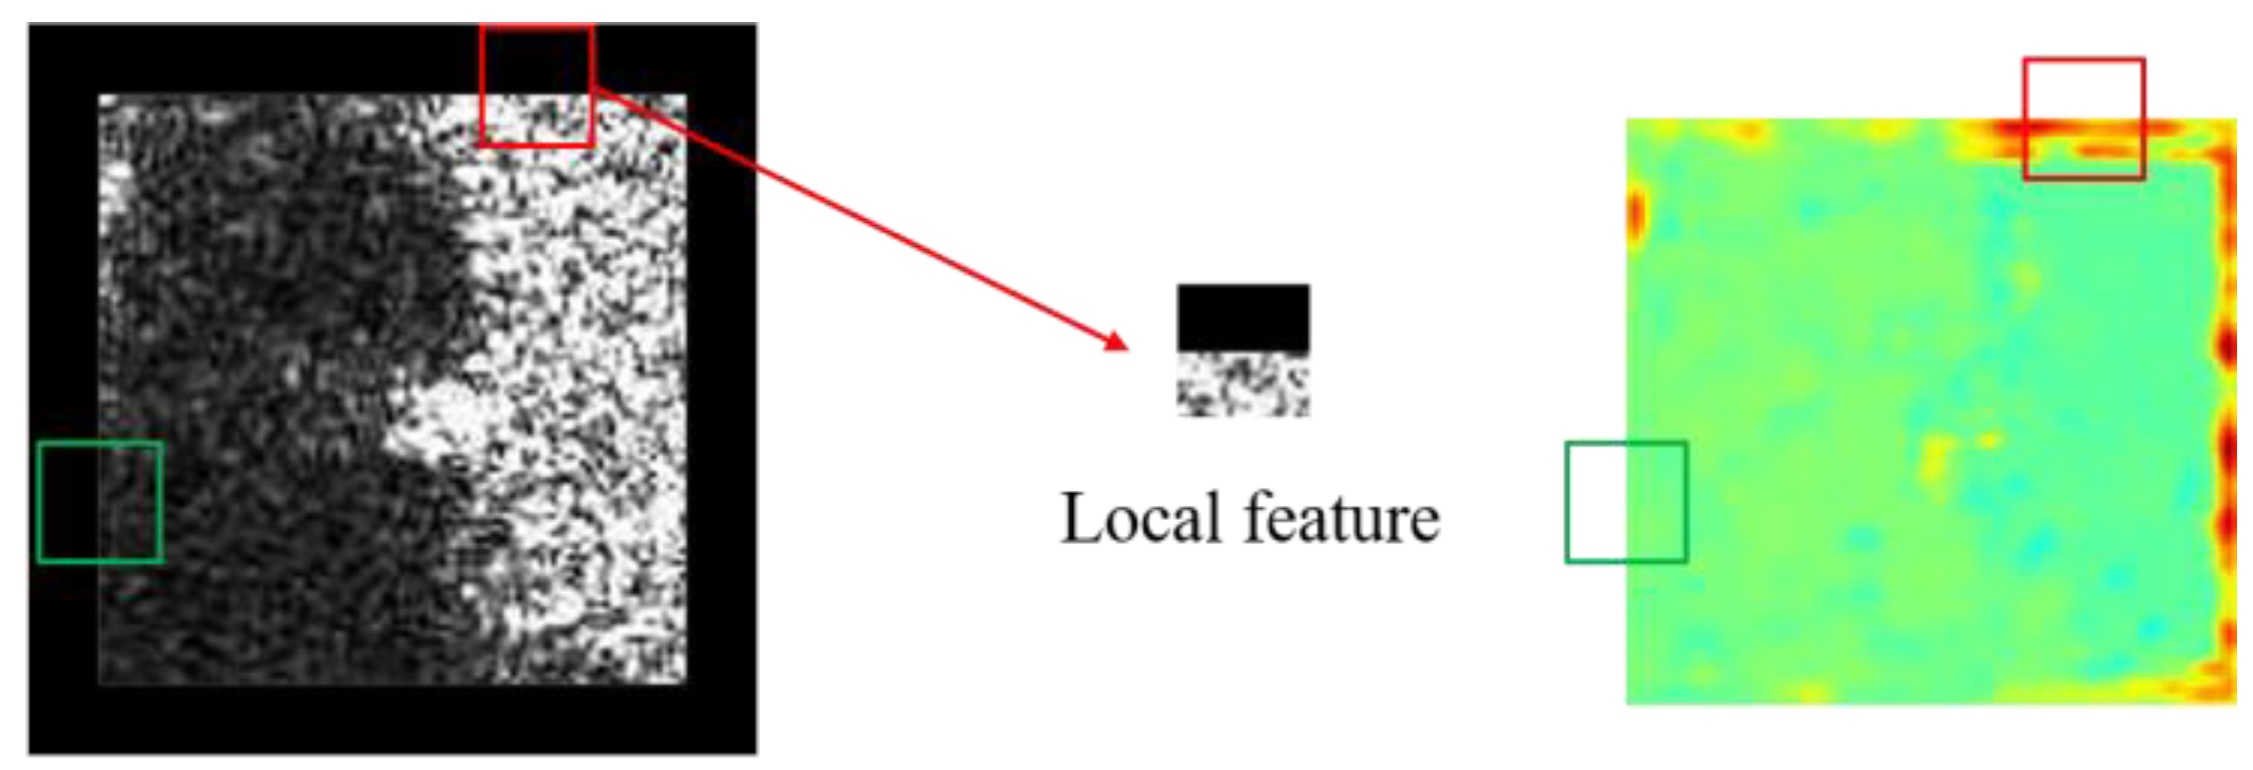
Figure 3.
Comparison of identification accuracy of models under different conditions.

Figure 4.
Architecture of SAR-BagNet.

Figure 5.
Comparison of various models for SAR images. The ten rows denote vehicles of different classes: (a) 2S1, (b) BRDM2, (c) BTR60, (d) D7, (e) T72, (f) BMP2, (g) BTR70, (h) T62, (i) ZIL131, (j) ZSU234.
Figure 5.
Comparison of various models for SAR images. The ten rows denote vehicles of different classes: (a) 2S1, (b) BRDM2, (c) BTR60, (d) D7, (e) T72, (f) BMP2, (g) BTR70, (h) T62, (i) ZIL131, (j) ZSU234.


Figure 6.
Recognition process of SAR-BagNet. (a) Schematic diagram of SAR-BagNet recognition process; below the heatmaps are the corresponding class and average value. (b) Patches in the SAR image corresponding to areas with larger values in the heatmap.
Figure 6.
Recognition process of SAR-BagNet. (a) Schematic diagram of SAR-BagNet recognition process; below the heatmaps are the corresponding class and average value. (b) Patches in the SAR image corresponding to areas with larger values in the heatmap.

Figure 7.
Heatmap comparison of similar images. (a) Heatmap comparison of similar images in Class 4. (b) Heatmap comparison of similar images in Class 9.
Figure 7.
Heatmap comparison of similar images. (a) Heatmap comparison of similar images in Class 4. (b) Heatmap comparison of similar images in Class 9.

Figure 8.
Comparison of different classes of heatmaps in the same SAR image. (a) SAR images of class 6. (b) SAR images of class 5. (c) SAR images of class 6 corresponding to heatmaps of class 6. (d) SAR images of class 6 corresponding to heatmaps of class 5.
Figure 8.
Comparison of different classes of heatmaps in the same SAR image. (a) SAR images of class 6. (b) SAR images of class 5. (c) SAR images of class 6 corresponding to heatmaps of class 6. (d) SAR images of class 6 corresponding to heatmaps of class 5.

Figure 9.
Validation set confusion matrix for SAR-BagNet.

Figure 10.
Heatmaps of true and predicted classes in SAR-BagNet for misclassification. (a) The true class is Class 0 (2S1) and the predict class is Class 9 (ZSU234). (b) The true class is Class 5 (BMP2) and the predict class is Class 6 (BTR70). (c) The true class is Class 6 (BTR70) and the predict class is Class 5 (BMP2).


Table 1.
The accuracy of the models on the validation set.
| Models | Recognition Accuracy |
|---|---|
| ResNet-18 [37] | 99.05% |
| BagNet-17 [30] | 94.15% |
| BagNet-33 [30] | 96.99% |
| ProtoPNet [28] | 78.34% |
| SAR-BagNet | 98.25% |
Table 2.
The classification accuracy of each category in the MSTAR dataset.
| Class | Accuracy (%) | Class | Accuracy (%) |
|---|---|---|---|
| 2S1 | 97.64 | BMP2 | 94.33 |
| BRDM2 | 99.99 | BTR70 | 95.88 |
| BTR60 | 99.21 | T62 | 99.33 |
| D7 | 99.66 | ZIL131 | 97.32 |
| T72 | 98.46 | ZSU234 | 99.33 |
Publisher’s Note: MDPI stays neutral with regard to jurisdictional claims in published maps and institutional affiliations. |
© 2022 by the authors. Licensee MDPI, Basel, Switzerland. This article is an open access article distributed under the terms and conditions of the Creative Commons Attribution (CC BY) license (https://creativecommons.org/licenses/by/4.0/).
Share and Cite
MDPI and ACS Style
Li, P.; Feng, C.; Hu, X.; Tang, Z. SAR-BagNet: An Ante-hoc Interpretable Recognition Model Based on Deep Network for SAR Image. Remote Sens. 2022, 14, 2150. https://doi.org/10.3390/rs14092150
AMA Style
Li P, Feng C, Hu X, Tang Z. SAR-BagNet: An Ante-hoc Interpretable Recognition Model Based on Deep Network for SAR Image. Remote Sensing. 2022; 14(9):2150. https://doi.org/10.3390/rs14092150
Chicago/Turabian StyleLi, Peng, Cunqian Feng, Xiaowei Hu, and Zixiang Tang. 2022. "SAR-BagNet: An Ante-hoc Interpretable Recognition Model Based on Deep Network for SAR Image" Remote Sensing 14, no. 9: 2150. https://doi.org/10.3390/rs14092150
Note that from the first issue of 2016, this journal uses article numbers instead of page numbers. See further details here.