Estimating Real-World Emissions of PHEVs in Norway by Combining Laboratory Measurement with User Surveys

Institute of Transport Economics, Gaustadalléen 21, NO-0349 Oslo, Norway
*
Author to whom correspondence should be addressed.
World Electr. Veh. J. 2018, 9(2), 31; https://doi.org/10.3390/wevj9020031
Submission received: 28 May 2018
/
Revised: 20 July 2018
/
Accepted: 6 August 2018
/
Published: 10 August 2018
(This article belongs to the Special Issue Selected Papers from The 30th International Electric Vehicles Symposium and Exhibition (Stuttgart, Germany))
Abstract
:The paper presents the results of experimental testing of the exhaust emission and energy consumption of two gasoline plug-in hybrid vehicles in an emission testing laboratory with different drive cycles and drive modes and at summer and winter temperatures. One was a compact vehicle with a type approval electric mode range of 50 km, the other a mid-sized vehicle with an electric mode range of 31 km. Additionally, an online survey of 2065 private plug-in hybrid vehicles (PHEV) owners investigated the usage pattern of the vehicles. Combining the laboratory tests with the user survey results provided an estimate for the reduction of CO2-emission of PHEVs in use in Norway. The main conclusion is that the PHEV is a vehicle type that needs to match well with the use pattern to produce low CO2- and local emissions. The achievable CO2-emission reduction was proportional to the range in electric drive-mode (E-mode), i.e., 50 km range resulted in about 50% reduction.
1. Introduction
Electromobility is high on the political agenda in Norway. At the end of 2017, Norway had 140,000 Battery Electric Vehicles (BEVs) and 67,000 Plug-in Hybrid Vehicles (PHEVs) on the road, and market shares for each were about 20% the last year [1]. Combined, they made up 7.5% of the total passenger vehicle fleet [1]. The majority of these vehicles are owned by private households. Most of the national incentives are directed towards BEVs, but PHEVs are also gaining popularity.
During the winter season several, Norwegian cities experience local pollution in excess of the limits specified in the European Union (EU) directive on air quality, which has been included into Norwegian law. The overall target of the EMIROAD (emissions from road transport vehicles) project was to do research on the emission effects of different vehicle technologies in general, in Nordic cities under Nordic conditions. Nothing was known prior to 2016 about PHEVs real-world impact on the environment in the use phase under Norwegian conditions, in particular, their emissions during winter conditions and the extent these vehicles are used in their “most electric” drive mode in the summer and winter. To cover this gap of knowledge, the Norwegian EMIROAD (emissions from road transport vehicles) research program initiated experimental testing of PHEV emissions and energy use under simulated Norwegian traffic and climatic conditions [2].
This article presents the results of the experimental testing of the exhaust emission and energy consumption of two gasoline plug-in hybrid vehicles in an emission testing laboratory. The aim of the testing was to uncover the impact of these PHEVs on local pollutants, CO2-emissions, and energy use in Norwegian driving conditions in the summer and winter. The usage pattern of PHEVs was established and compared with the usage pattern of BEVs and Internal Combustion Engine Vehicles (ICEVs) using data from a survey of owners of these vehicle types [3]. The usage patterns from the survey are combined with the experimental results, to produce the first real world estimate of the environmental impact from the use phase under Norwegian driving conditions of PHEVs, compared to similar ICEVs.
This articles main contribution to the research literature is the increased understanding of real driving behavior of consumers owning PHEVs, and estimates of real world emissions under demanding driving conditions, in particular in cold Nordic climates.
The article starts off in Section 2 with a presentation of the materials, methods and theoretical framework for the evaluation of the environmental characteristics of PHEVs. The results are presented in Section 3, followed by a discussion of the overall results in Section 4, and the conclusion in Section 5.
2. Materials and Methods
2.1. Theoretical Framework
A Hybrid Electric Vehicle (HEV) uses a battery and an electric motor/generator to capture brake energy to generate electricity that recharges the battery. This captured brake energy can subsequently be extracted and used in the electric motor to assist in the propulsion of the vehicle and thus save fuel. The batteries in these vehicles cannot be externally recharged, and the capacity is much smaller than for BEVs or PHEVs.
The PHEV can, on the other hand, utilize grid electricity charged into the vehicle’s batteries for propulsion over typical distances of 20–80 km, depending on the battery capacity and the vehicle configuration. Charge depletion PHEVs first drain the battery in electric drive-mode (E-mode) before starting the Internal Combustion Engine (ICE) on longer driving distances. Blended mode PHEVs allow the ICE to also run when the power in the electrical system is insufficient. The ICE supports propulsion directly on the drive shaft or indirectly through electricity produced by a generator connected the ICE.
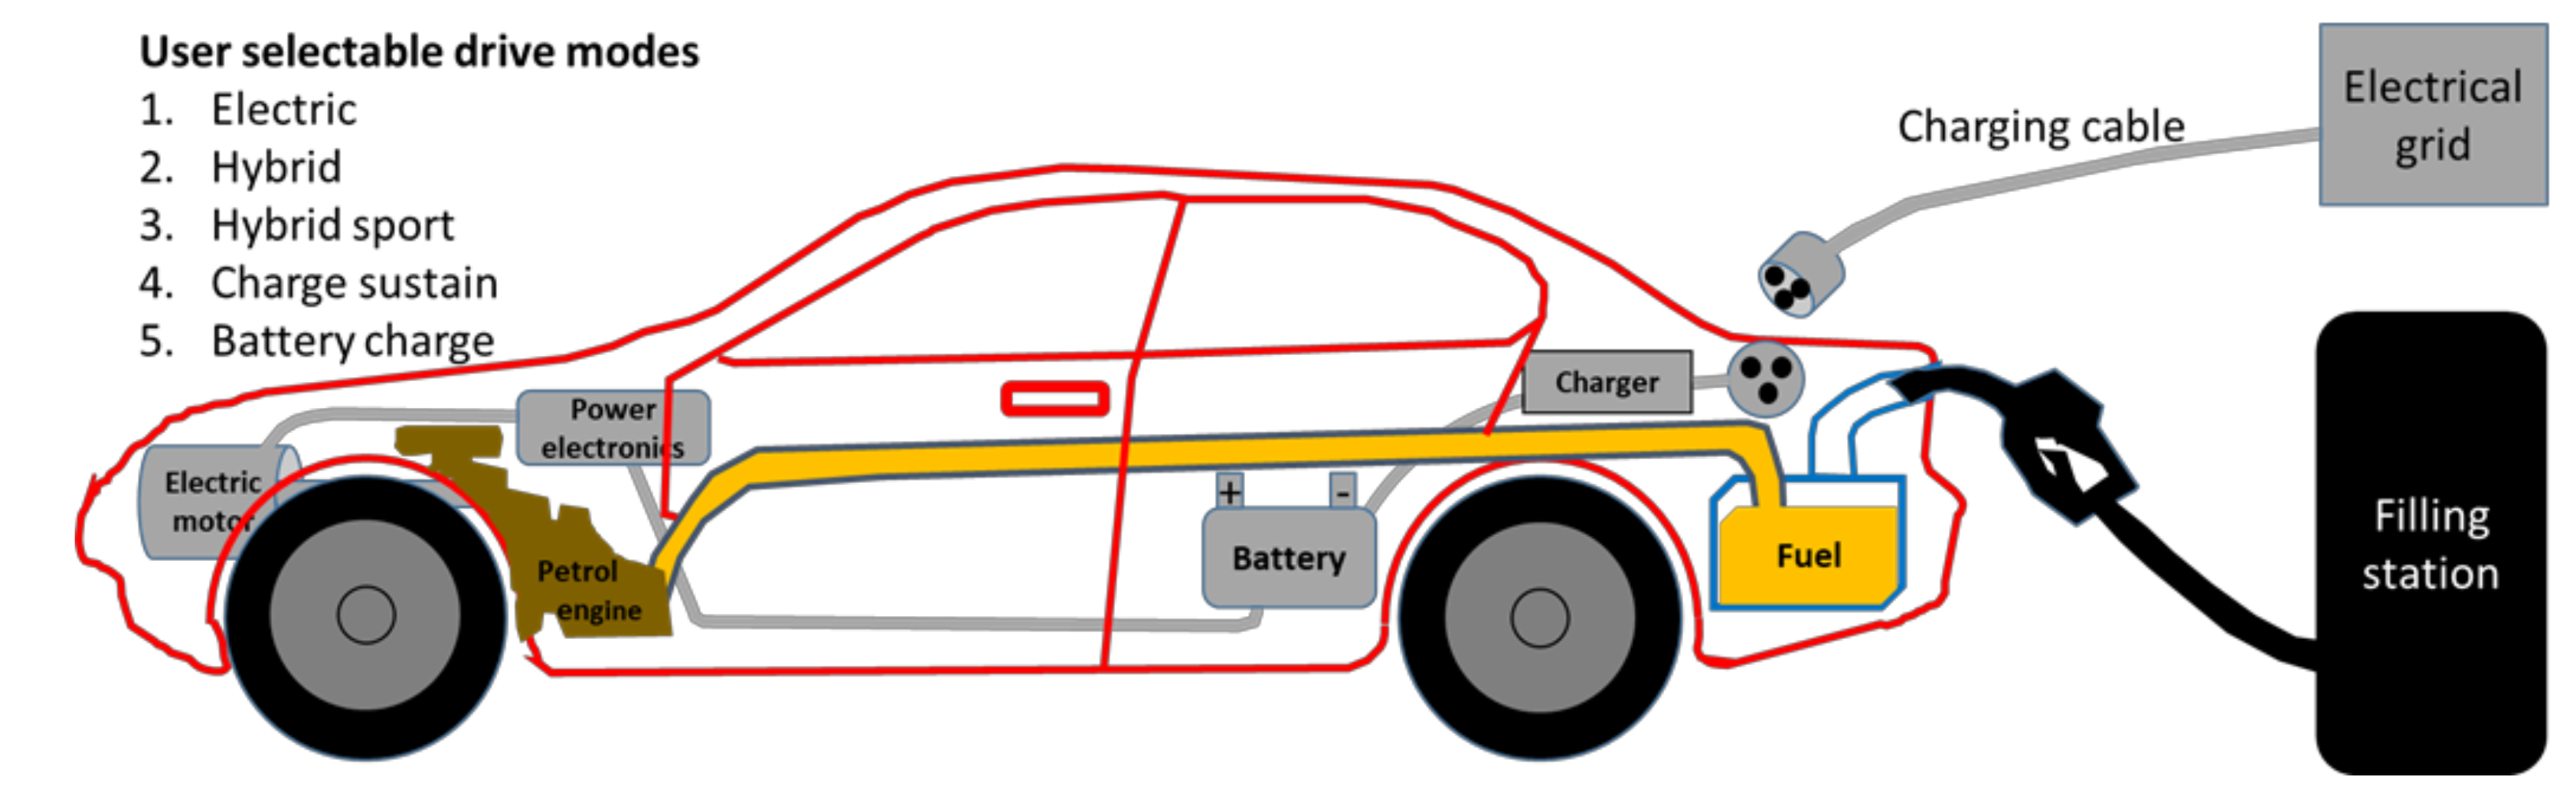
This duality of power sources and engine/motors in different configurations introduces flexibility for the user and complexity for researchers aiming to understand the environmental impacts of PHEVs. The user can select different drive modes where the ICE may operate to a larger or lesser extent, thus further complicating the picture. Figure 1 shows an example of a PHEV lay-out with an overview of typical user selectable drive modes.
The real traffic propulsion system usage patterns can be much more diversified for these PHEVs, with their multitude of user selectable drive modes, than for ICEVs, that only use an Internal Combustion Engine (gasoline or diesel) for propulsion. It is, therefore, no longer adequate to measure the energy consumption, the emission of CO2, and local pollutants in a laboratory simulating real traffic to establish an estimate of these vehicles’ environmental impacts. One also needs to take into consideration the actual usage pattern of the vehicles and the users’ selection of drive modes.
Two main drive modes exist for PHEVs. Charge Depletion (CD) in which the strategy is to use electric propulsion as much as possible until the Battery State of Charge (SOC) is too low to continue, then the vehicle enters the Charge Sustain drive mode in which the Battery charge is sustained and the vehicle essentially operates as a traditional hybrid vehicle. The potential to reduce the environmental impact of PHEVs rests on the share of driving that can be, and is, accomplished in the CD mode. This share of driving will differ substantially between summer and winter conditions due to the large differences in energy consumption caused by the heating system, the use of winter tires, and the increased driving resistance in cold climates. The range of the vehicle in the all-electric (or the most electric drive mode) is called the All Electric Range (AER), the share of driving in AER is called the utility factor (UF). In the New European Driving Cycle (NEDS) official range test used up to 2018 in Europe, the UF is essentially: AER/(AER + 25), with the factor 25 set more or less arbitrary [4].
The actual usage profile will influence emissions. Owners can charge frequently or infrequently, or drive long distances so that even frequent charging will lead to a low share of electrically-powered kilometers. Others maximize the share of driving in the electric drive mode by charging whenever possible. It is also possible to own and operate a PHEV without ever charging it from the grid.
In drive modes where the ICE is activated, the emissions may be higher than for comparably sized HEVs due to the extra weight of the larger batteries and the battery charger and other extra components, differences in the layout of the drive system, and the operation strategy of the ICE. Additional emissions could occur if the ICE starts and stops frequently and operates in short time intervals only. Some early PHEVs, such as the first generation Prius, are designed to always start the ICE when starting the vehicle under cold ambient conditions. The ICE then produces heat that can be used to defrost the windshield. As the vehicle can utilize some of the surplus heat from the ICE for heating the vehicle, the efficiency of this operation will be higher than when the ICE only supplies propulsion power.
The research literature on emissions from PHEVs mainly covers emissions and fuel consumption under warm weather conditions such as in California. Little work has been done on the operation of PHEVs in cold weather, more work has focused on BEVs due to the range decrease they experience in cold weather [5]. Plötz et al. [6] reviewed the UF for data from Germany and the United States of America (USA), including data from the California Air-Resources Board (CARB) [7] and the consumer website Spritmonitor.de. Their main conclusion is that an all-electric range of 40 km (according to the US Environmental Protection Agency range test) gives a UF of 0.5, 60 km a UF of about 0.75, and 25 km a UF of about 0.3. The CARB found that off-cycle high-power accelerations in blended mode 1st generation PHEVs can cause excessive exhaust emissions due to high-power cold starts of the ICE [8]. They also found that the overall average emission of these PHEVs could be within the emission limit values, as only a fraction of engine starts were of this type. That fraction will be smaller the longer is the range in E-mode. Smart et al. [9] found that the average UF of the General Motors (GM) Volt (Opel Ampera is the European version of the vehicle) was 72–74%, and that owners charged on average 1.4 times per day, with an average AER of 56–62 km depending on year model. Bradley and Quinn [10] found that the assumption on charging frequency significantly influences the UF. Hardman et al. [11] found that up to 80% of consumers in general charge their electric vehicles (BEVs + PHEVs) at home, with work charging being the second most important location covering 15–20% of recharge events. Nicholas et al. found that for the Chevrolet Volt, 86% of kWh’s are charged at home [12].
Fleetcarma [13] found that in their vehicle fleets, the AER range of the Chevrolet Volt decreased 48% when the ambient temperature was reduced from 20 °C to 0 °C, and that the engine started when the temperature dropped below −4 °C. Tietge et al. [14,15] found that the real CO2-emissions of PHEVs are typically more than 2 times higher than their type approval value. Volvo has stated that the V60 PHEV in Norway is operated 46.3% of the time in E-mode based on data collected from 341 vehicles driven close to 8 million km [16].
2.2. Targets and Strategy for the Measurement Program and User Survey
The purpose of the measurement program of PHEVs and the survey of PHEV owners was to obtain a basic understanding of how PHEVs operate in Norway under various real traffic and climatic conditions, in line with the overall targets of the EMIROAD research program. The tests were carried out at VTT’s emission laboratory in Finland in close co-operation with their test engineers. The data cannot be used to estimate the average emissions or energy consumptions of the total fleet of PHEVs on the road, as only two vehicles were tested. The tests were deliberately designed to be exploratory, i.e., to also find the unexpected rather than focusing on the average.
The questions that prompted the need to measure PHEVs and survey owners were:
- What is the range and energy consumption when PHEVs are driven in the electric drive mode?
- What is the share of driving that is done in E-mode?
- What is the influence of climate and driving conditions on energy use, range, and emissions?
An exploratory measurement program [2] using the combination of laboratory measurements and user survey results was designed to be able to shed light on these questions, and the following assumptions were made about PHEVs’ characteristics and environmental impacts:
- PHEVs have a pure battery electric drive mode in warm as well as cold climates.
- Battery range is sufficient for everyday traffic, i.e., longer than an average round trip to work.
- The energy consumption in non-electric modes can be higher than for comparable HEVs/ICEVs.
- Frequent starts and stops of the drive system in hybrid mode can lead to high emissions.
- The annual average energy use and CO2-emission of PHEVs will be much lower than for ICEVs.
- A pure E-mode is not necessarily better from a CO2-reduction perspective than a blended E-mode.
Pure electric propulsion does not produce exhaust emissions. Therefore, the CO2- and local emissions for pure electric propulsion is regarded as zero in the measurement program. Emissions related to production and distribution of vehicles and fuels are thus not taken into account in the analysis in this article. For a global estimation of total greenhouse gas emissions of a PHEV, WTW (well-to-wheel) emissions, including emissions from generation/extraction, conditioning, and transportation of the fuel/electricity, as well as the production of vehicles, should be accounted for. Note that this is the case both for the electricity and the liquid fuel used by the vehicle. Norway does not produce vehicles, and 96% of the electricity is produced from hydro-electric power and 2% from wind power. The European Union Emission Trading System (EU ETS) for greenhouse gases will also nullify the effect of these additional emissions [17] under the condition that the EU ETS is effective in capping CO2-emissions [18]. The emission of individual countries can, however, be affected, which is why countries and the EU now set non-ETS sector climate policy targets [19]. It is also worth noting that it is individual countries that take on the responsibilities to reduce climate gas emissions in international agreements. The borders of the analysis system will then be the emission producing processes that goes on within national borders. The zero emission assumption for pure electric propulsion used in this article is thus justifiable, when the target is to analyze national Norwegian emission impacts of replacing ICEVs with PHEVs.
2.3. Measurement Program
The test program [2] consisted of two vehicles, tested in three different drive cycles, at two ambient temperatures, and 2–4 user selectable drive modes. The characteristics of the two vehicles tested are presented in Table 1. The results have been compared to emission tests of gasoline/diesel variants of the same vehicles, see Table 2. These tests were also carried out within the EMIROAD research program.
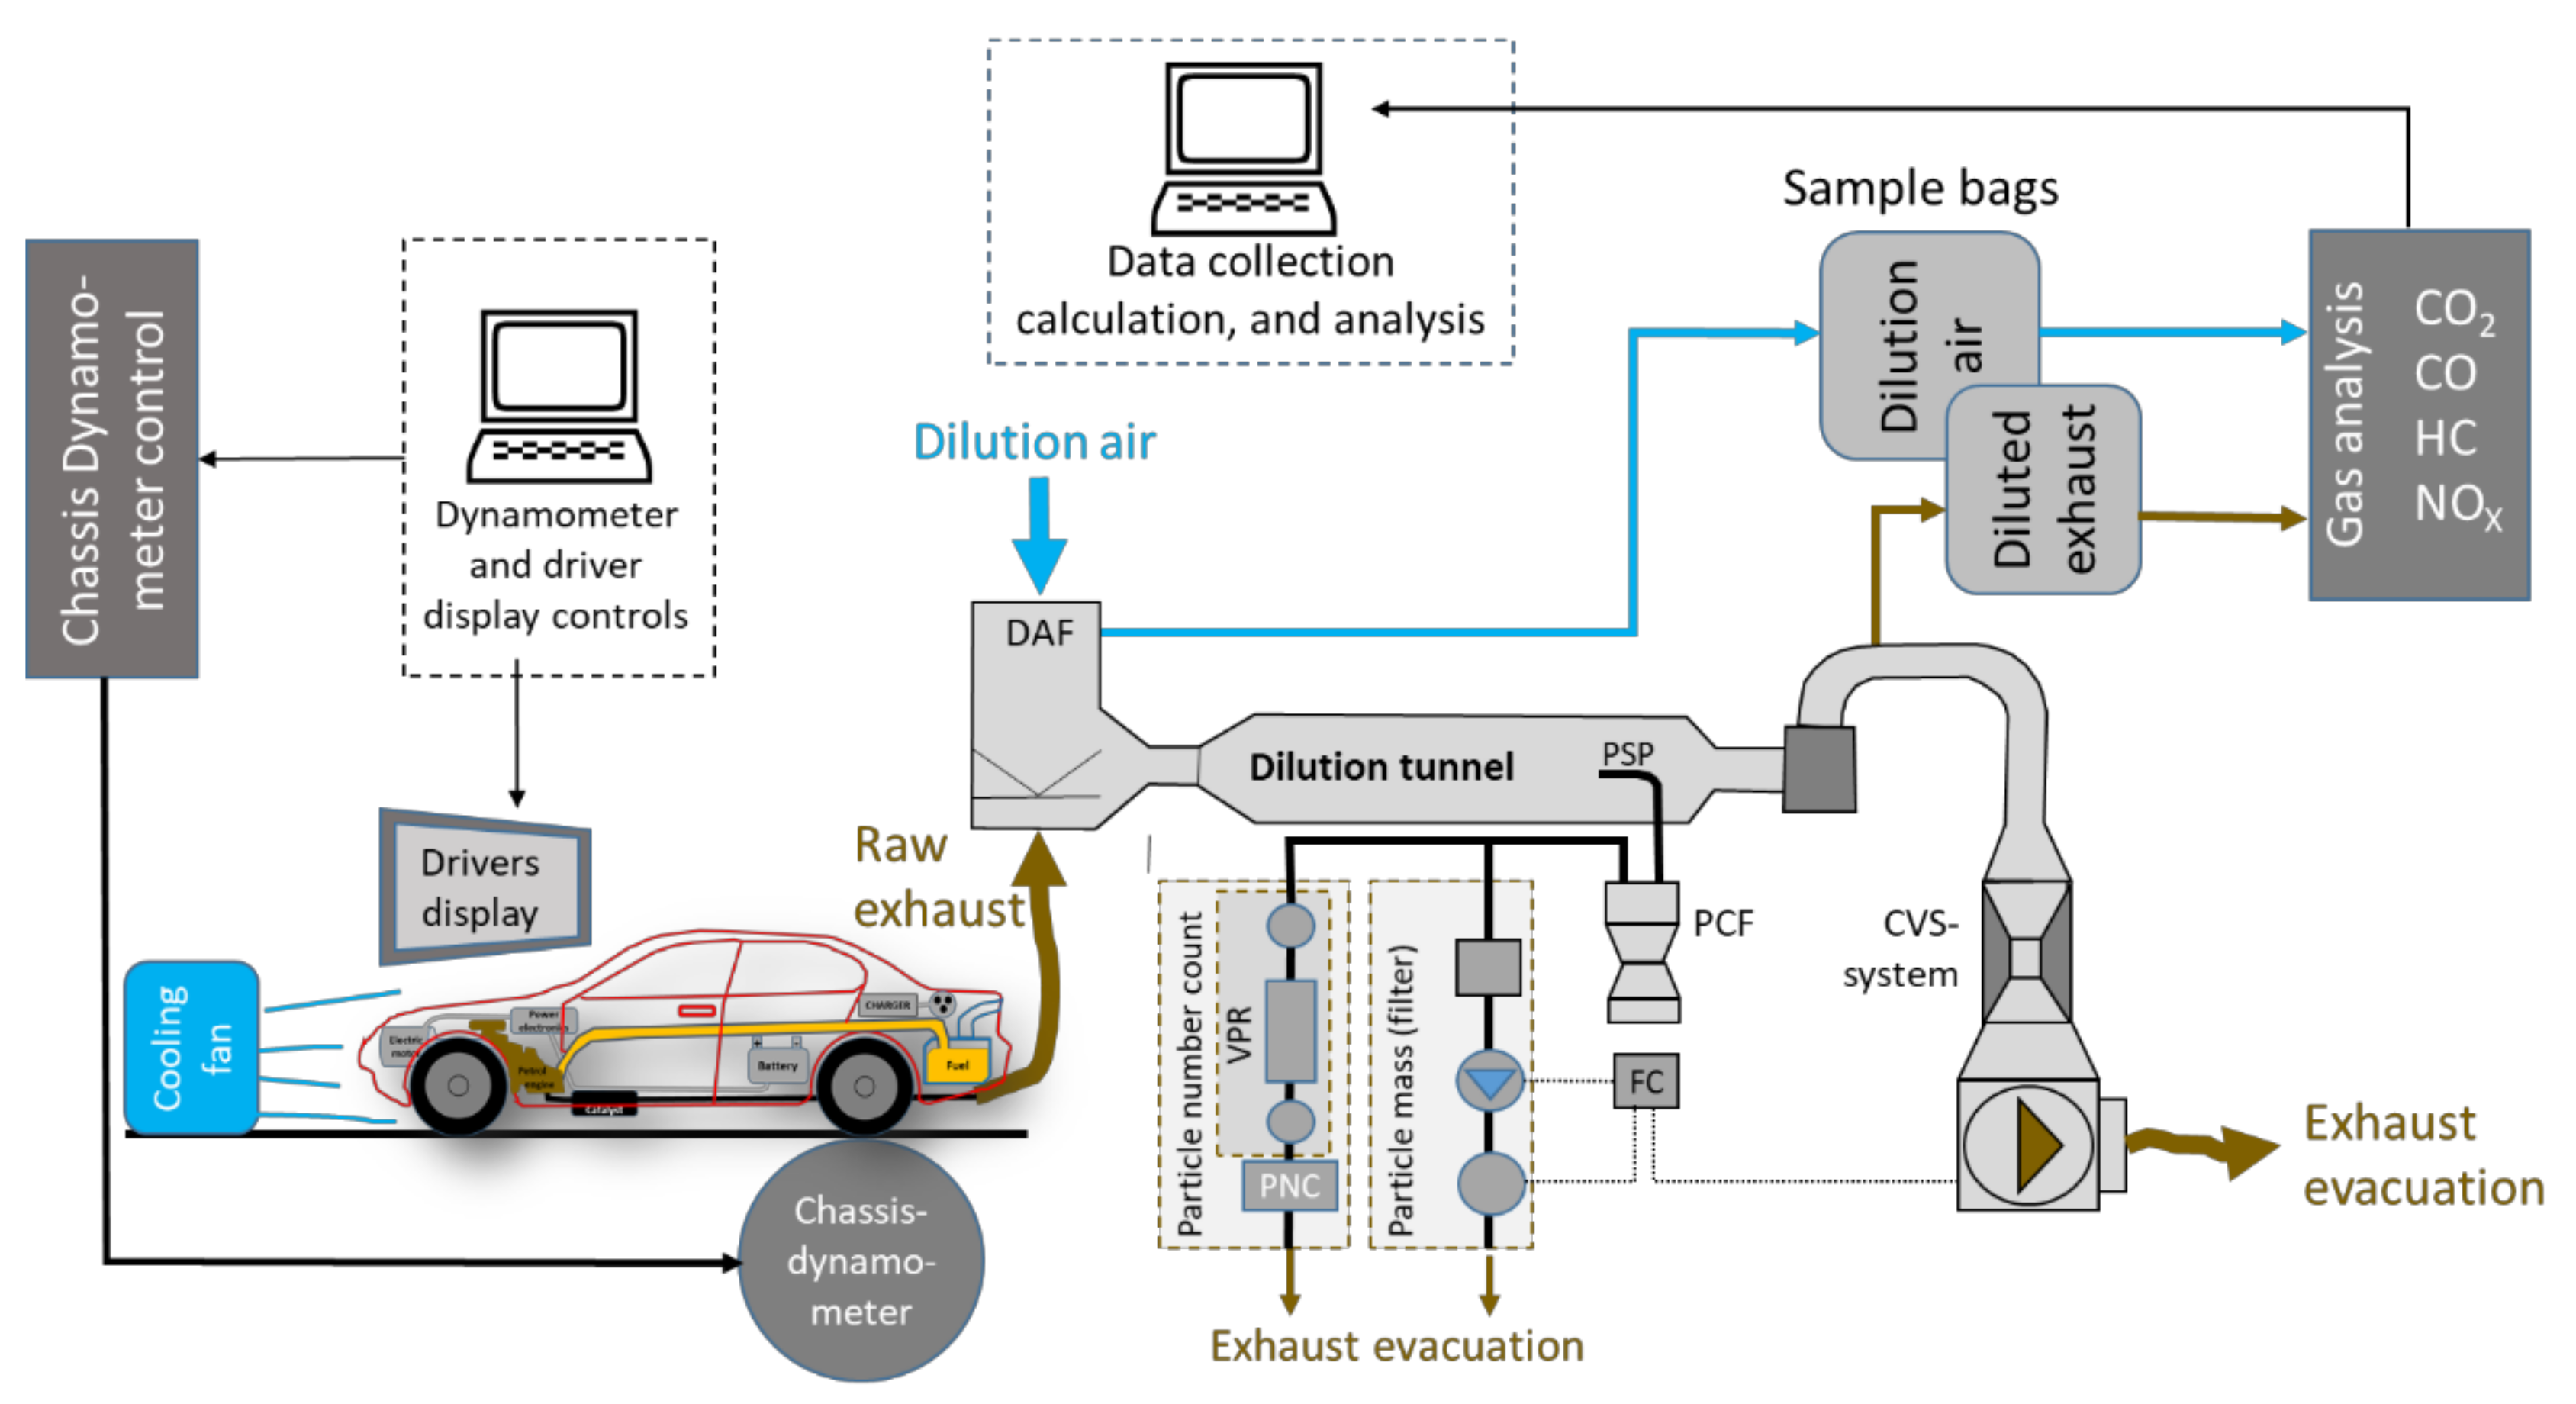
The laboratory tests included measurements of energy use, the emission of CO2, and “local” emissions, i.e., HC, CO, NOX, and particulates’ mass and number count. The test cell set up is illustrated in Figure 2.
Three different drive cycles were applied: the NEDC, Artemis Urban, and Helsinki city cycles. Table 3 presents some essential characteristics of the test cycles.
The test matrices are summarized in Table 4 and Table 5. The tests included warm and cold starts, driving in different hybrid system drive modes, and at ambient temperatures of +23 °C and −7 °C. It is thus possible to analyze:
- Implication of drive cycles, i.e., different usage and driving styles
- Implication of the vehicles selectable drive modes
- Implication of cold weather versus warm weather
- Implication of fully charged versus depleted battery
The detailed schedules for the tests are presented in Appendix A. Vehicle A spent 9 days in the laboratory, vehicle B 8 days. All cold starts where done after a full overnight soak in the laboratory at the set temperatures. Several warm start tests were done during one day of testing as seen in the schedules.
The purpose of the EMIROAD project is to measure real on-road emissions from vehicles. All vehicles in the EMIROAD program are tested as they are delivered, i.e., in road-worthy condition with various standard/extra equipment installed, with the tires that were on the vehicle when they came to the laboratory. The tire pressure is set to the manufacturers’ specified value. Climate controls are set at +21 °C, with the fan in the second lowest speed. The vehicles are in use when they are selected for the testing.
2.4. User Survey Design
In real traffic, PHEVs will be used part-time in different user selectable drive modes and with different use patterns. A user survey [3] among 2065 private Norwegian PHEV owners, 3111 BEV owners, and 2080 ICEV owners was conducted in March 2016. Among the questions were the users’ own estimates of the real E-mode range in summer and winter, the total annual km driven, the estimated share of driving done in E-mode, and the charging behavior [3]. The survey results were used to estimate a representative usage and charging pattern that is combined with the measurements to provide estimates of how these vehicles contribute to reduced CO2-emission, less energy use, and local pollution over a year of use, compared with an ICEV of similar type.
3. Results
The results are presented separately for both vehicles as only a subset of tests are directly comparable between the two vehicles.
3.1. Vehicle A
3.1.1. Electric Drive Mode
Before the testing commenced, it was assumed that the E-mode on PHEVs would enable pure electric driving. Vehicle A, however, switched on the engine occasionally when being tested at +23 °C and for long time-periods at −7 °C, with a warm start. The overall results of the warm-start tests with a fully charged battery are presented in Figure 3. The official type approval values of vehicle A and the EMIROAD measured emissions of a comparable diesel version are also shown. The engine started during the test but the CO2-emission reduction was nevertheless large compared with the diesel version of the vehicle.
Emissions of NOX and particulates were far below the emission limits, whereas the CO emission was slightly above the NEDC limit of 1 g/km when driven in the Artemis Urban test at +23 °C [2].
The driving length of the test cycles and the number of cycles driven are not the same. The diesel vehicle was tested with one drive cycle, i.e., 11 km and 4.5 km, respectively, in NEDC and Artemis Urban cycles, whereas the PHEV could be driven three complete repetitive runs in Charge Depletion mode. A complete range test was not done, as the tests were designed to measure emissions and energy consumption. Three cycles were the maximum number of cycles tested in the EMIROAD test program. Cold start effects might therefore have a bigger influence on the magnitude of emission values for the diesel vehicle.
3.1.2. Hybrid Auto Drive Mode
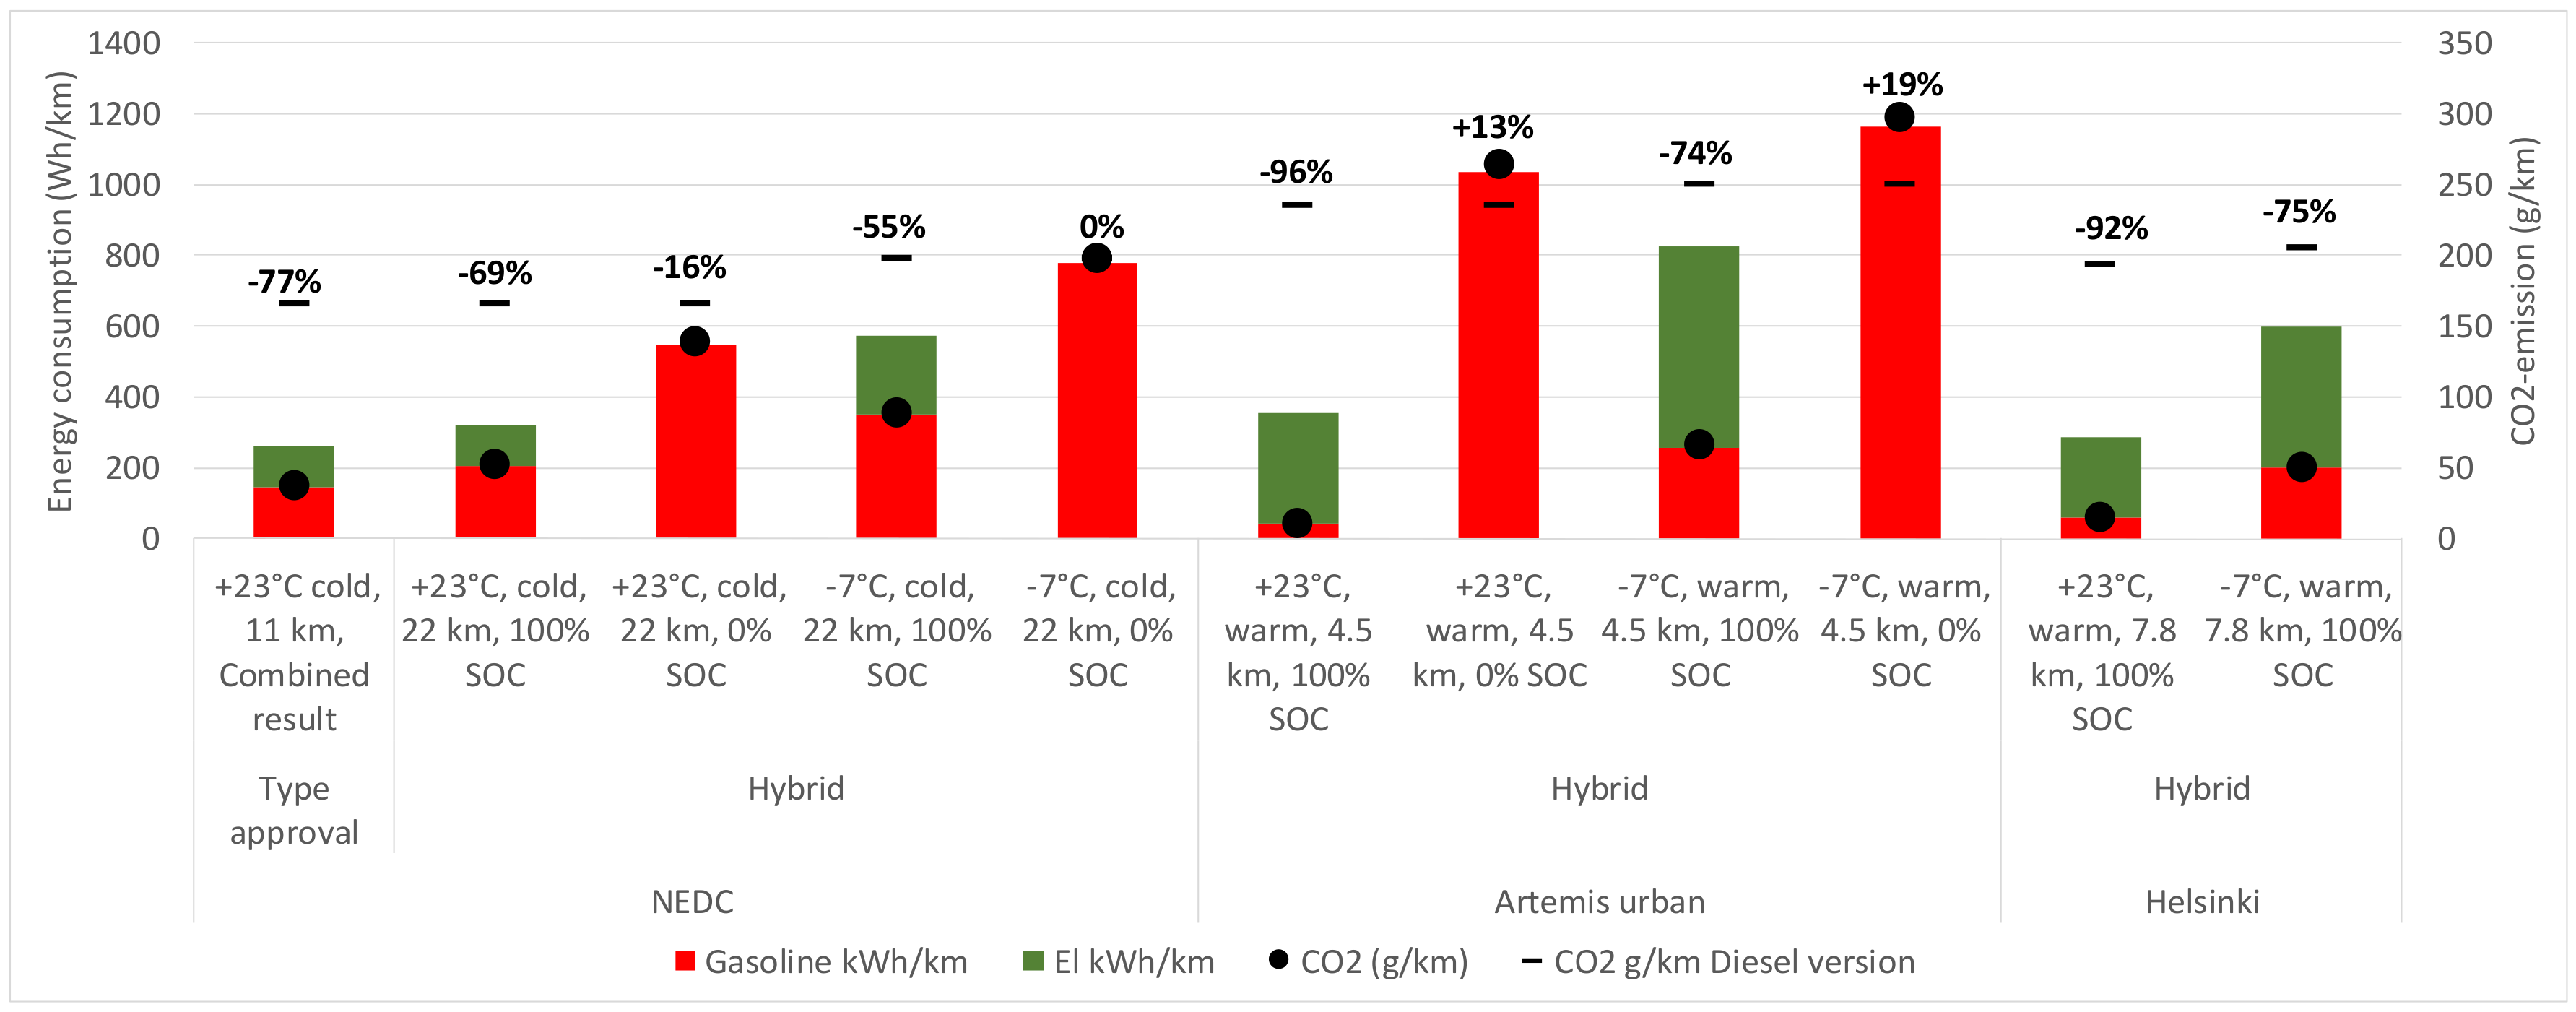
In the hybrid auto mode, the test results are less conclusive, as seen in Figure 4. In most cases, the CO2-emission was below the diesel vehicles’ emissions. An empty battery combined with high load driving resulted, however, in CO2-emissions above that of the diesel vehicle. The repeatability of the tests was good, but less than that for ICEV vehicles, likely due to the battery state of charge or state of health influencing the start-up conditions for the ICEV.
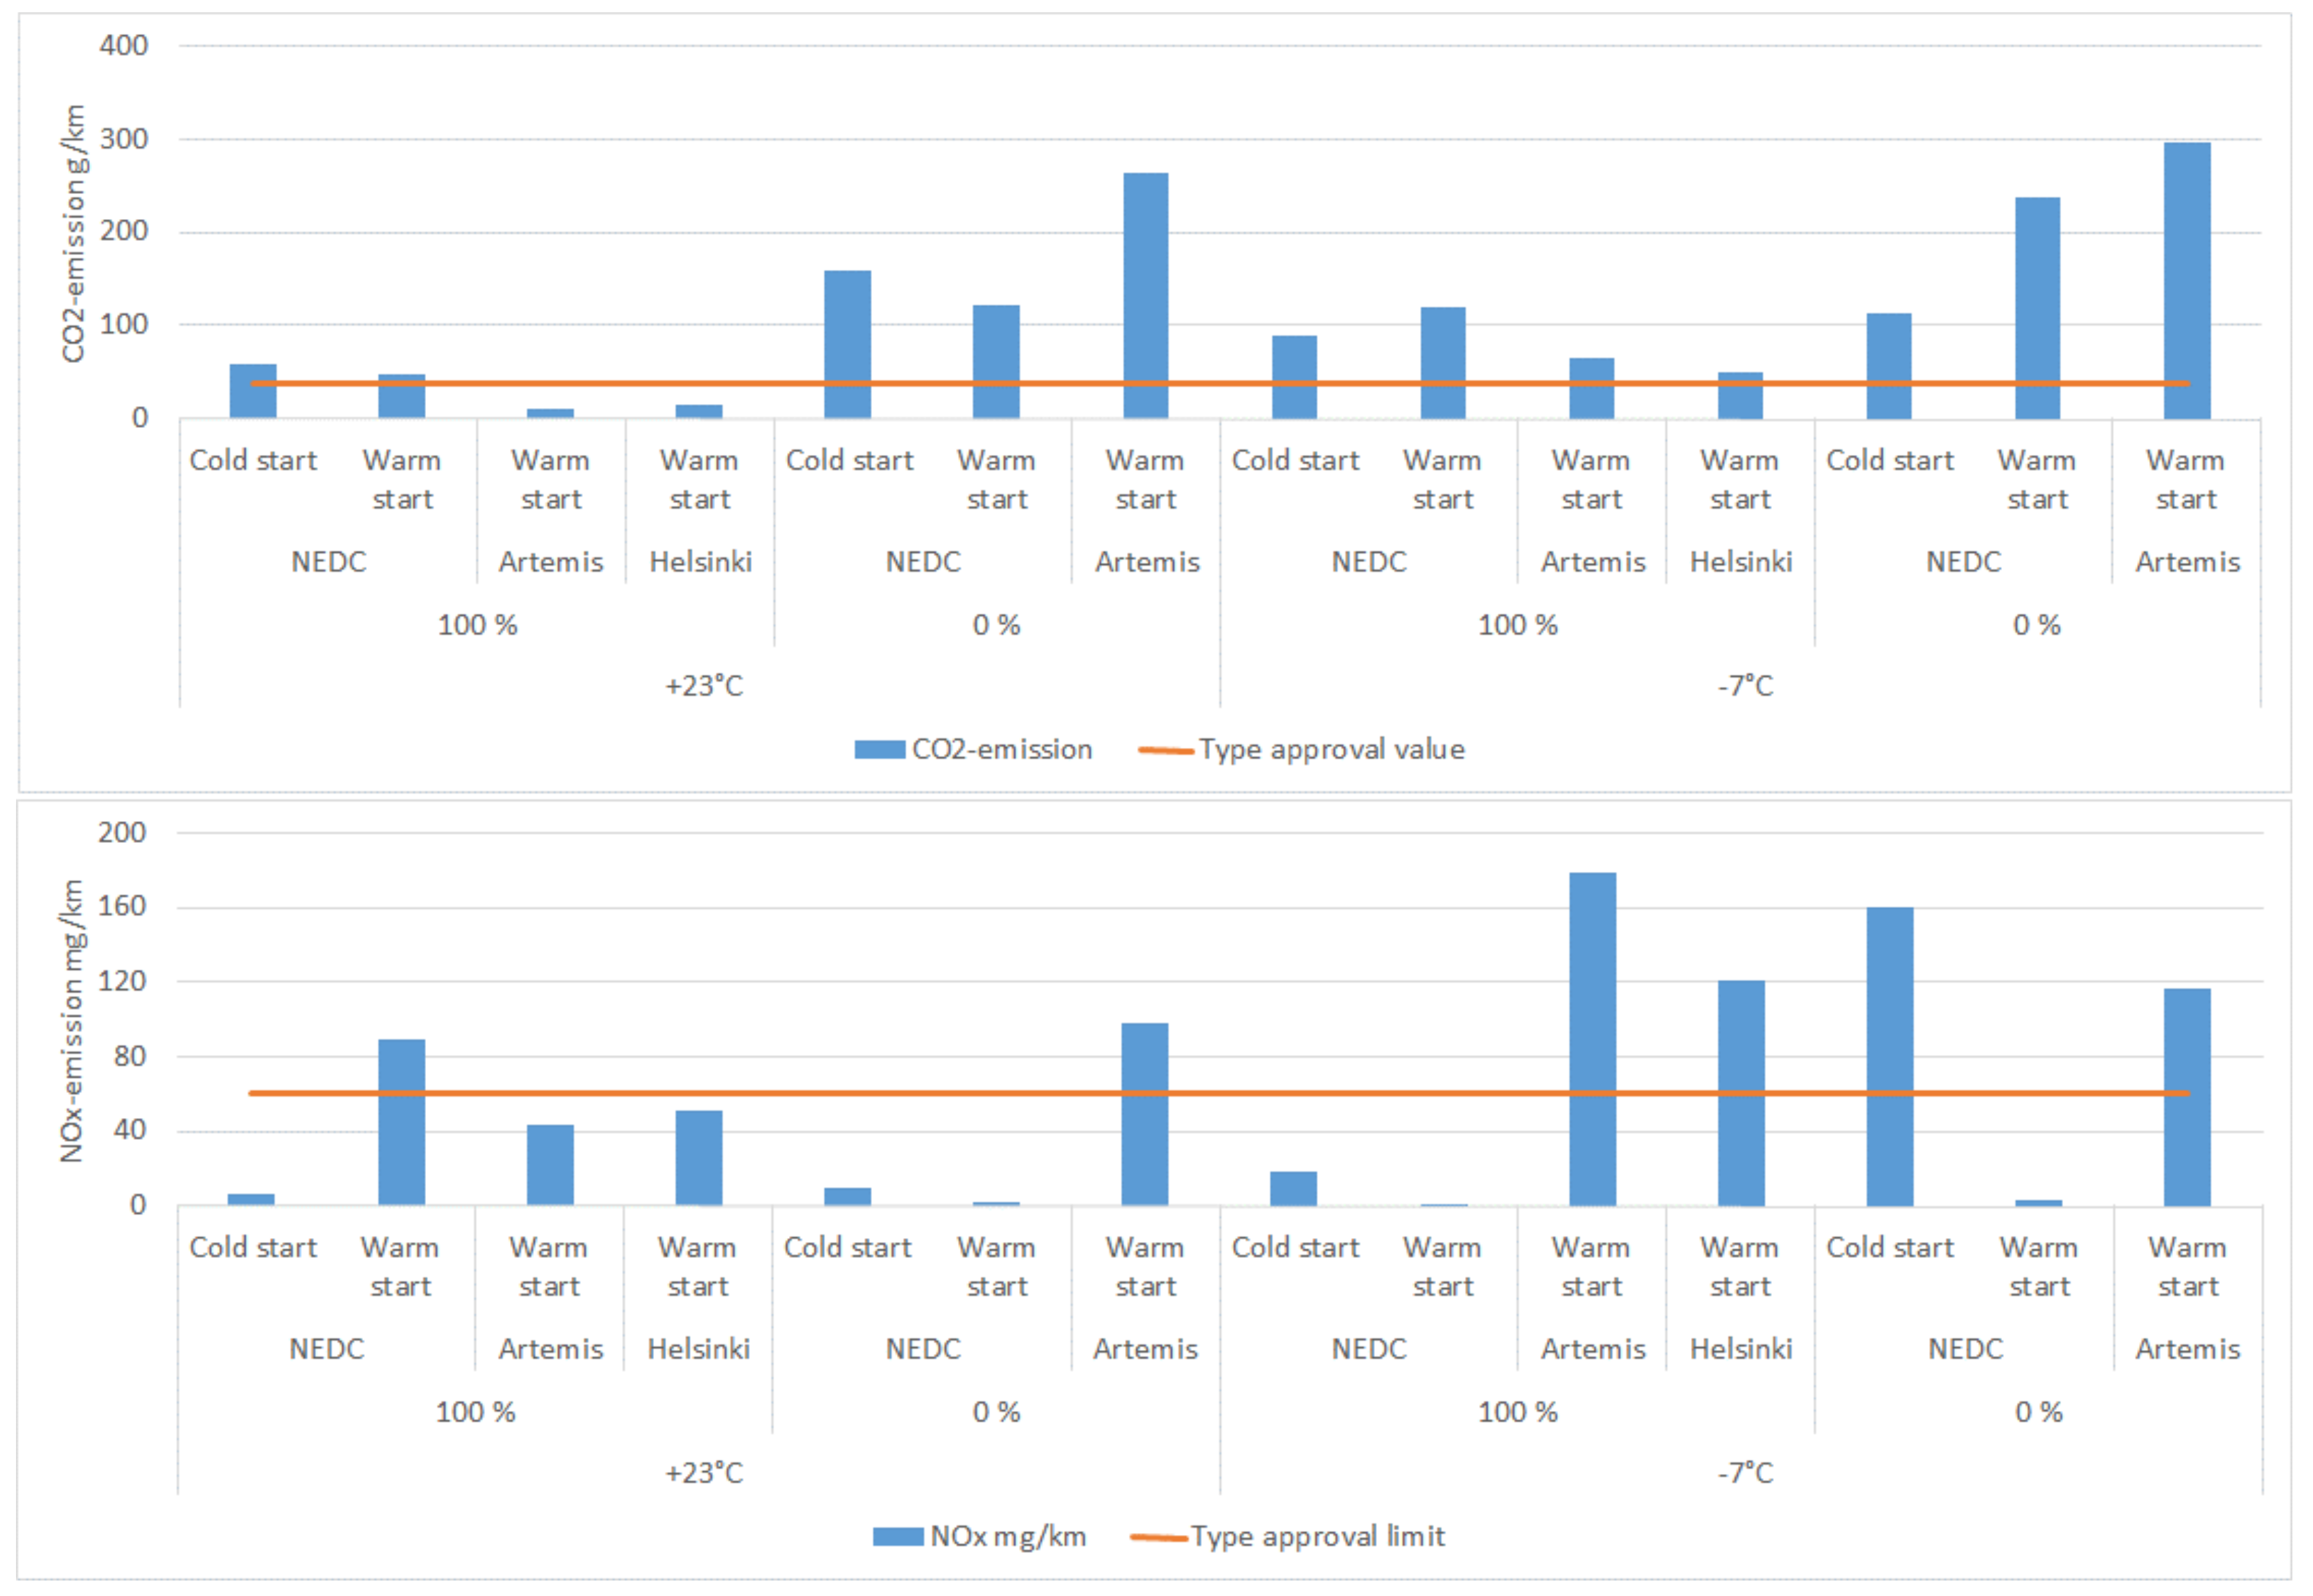
Some drive cycles, particularly at high loads and low temperatures, led to excessive local pollutants emissions as seen in Figure 5. Particulate number emissions followed particulate mass and was below the 2016 limit value, but high above the new limit introduced in September 2017 when tested in the cold. The NOX emissions during NEDC tests with warm starts was very low.
3.1.3. Other User Selectable Drive Modes
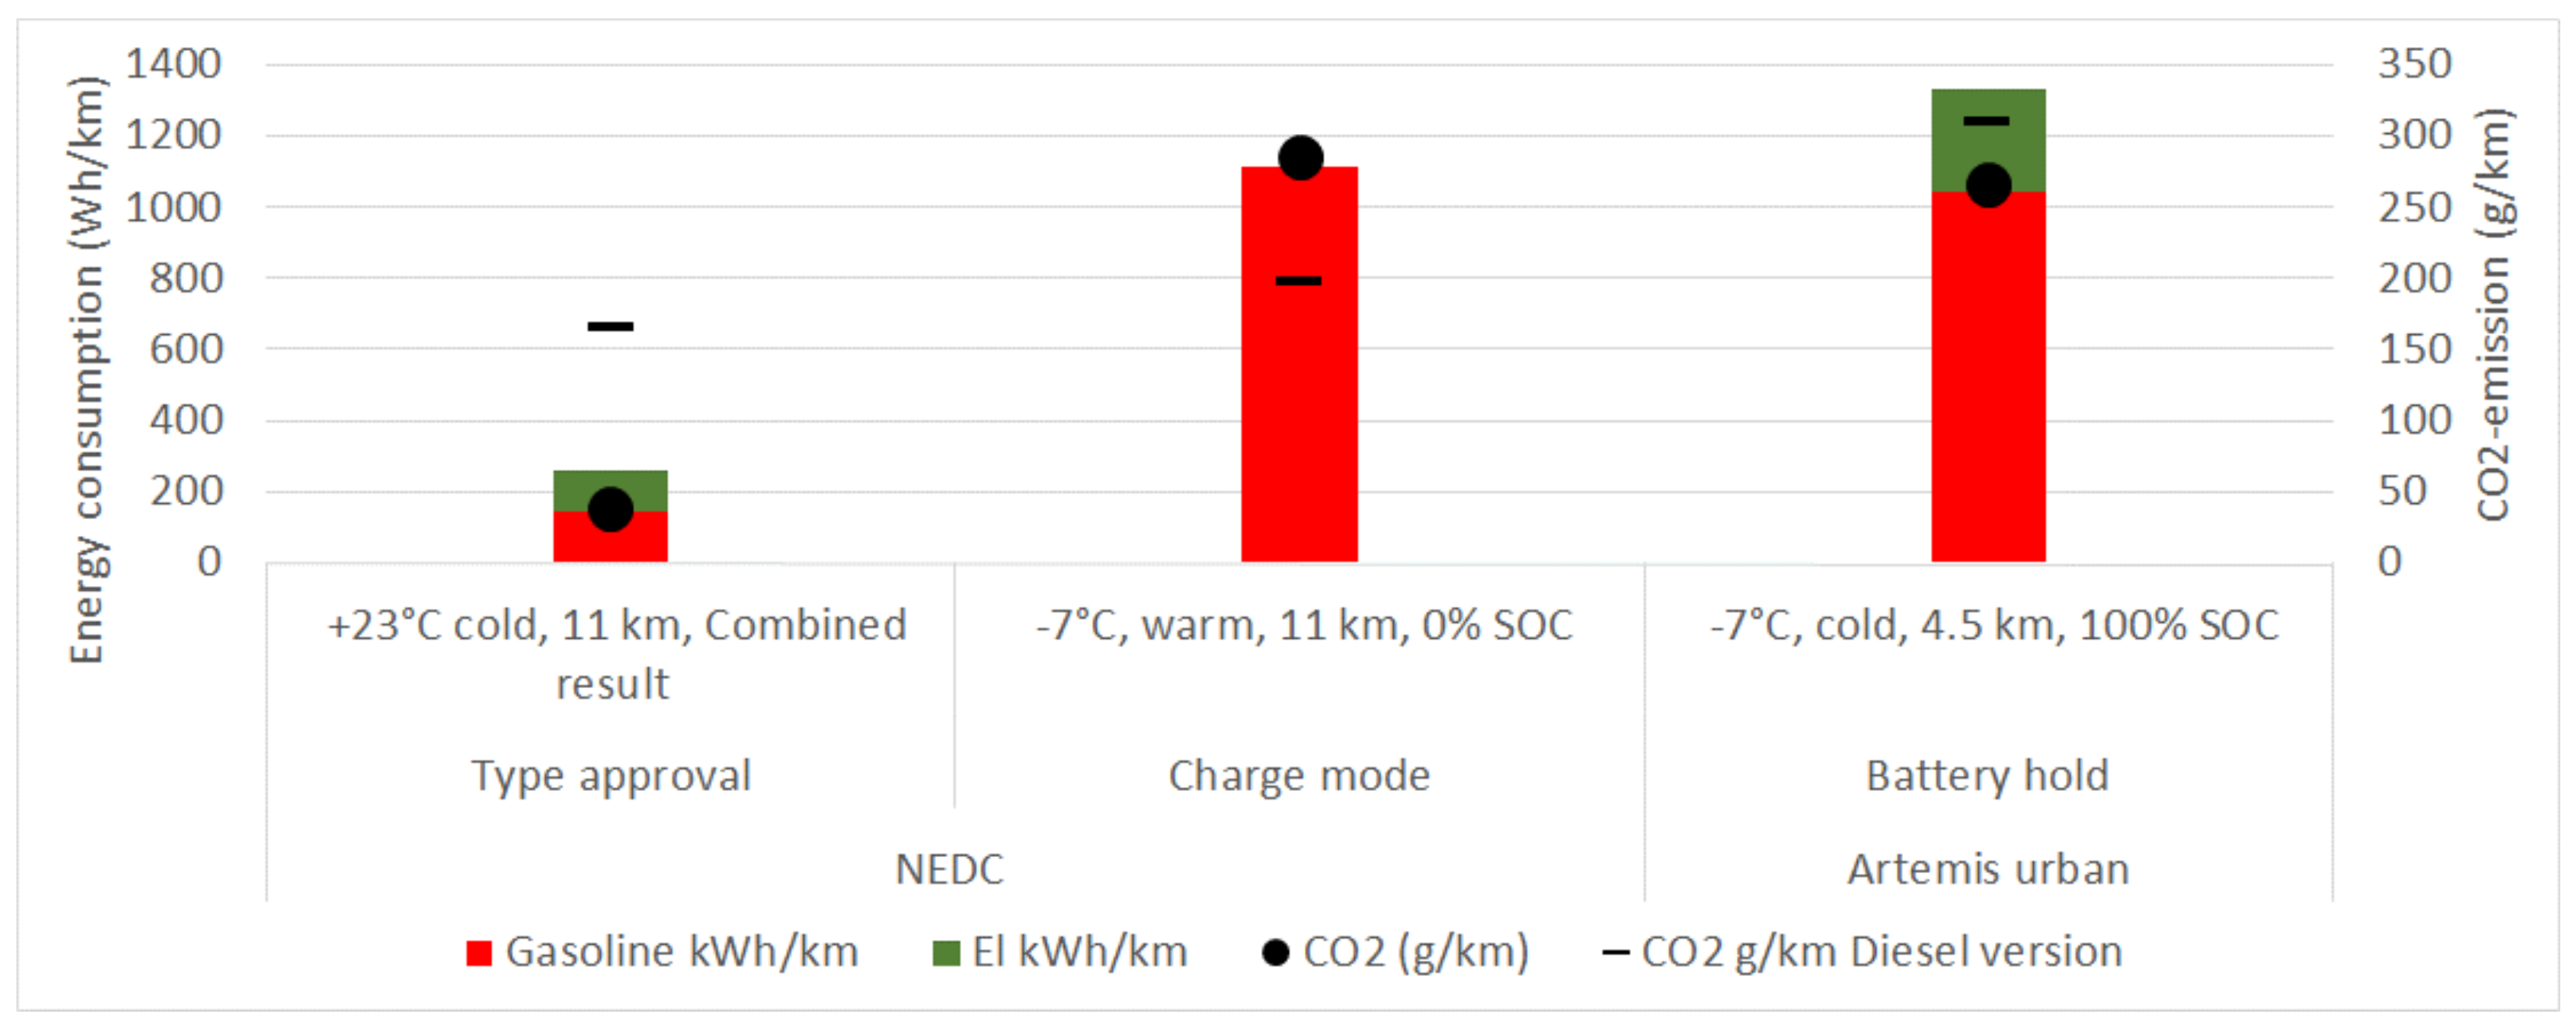
The vehicle had two drive modes that could be used to either preserve the battery capacity or recharge an empty battery for later driving in the E-mode. These drive modes were only tested at −7 °C ambient temperature, to fit with the overall schedule of the tests as seen in Appendix A, and the results thus represent winter driving. The measured energy consumption and CO2 emission was very high compared with the type approval values, as seen in Figure 6.
3.1.4. Estimate for Yearly Average
In the user survey (Figenbaum and Kolbenstvedt 2016), 74% of PHEV owners stated that they charge every day at home, another 15% do it 3–5 times /week, 5% do it weekly, 2% rarer, and 5% never charge at home. The average user thus charges 0.84 times per day (One charge per day was assumed for the “daily” response alternative). There were 66% who never charge at work (including 9% that do it less than monthly), 9% charge daily, another 7% do it 3–5 times per week, 5% do it 1–2 times/week, another 5% monthly. The average number of charges per day at home and at work then sums up to 0.99. Adding public and shopping center charging, the number reaches 1.03. The assumption of one full recharge per day was therefore used in the following calculations.
The average yearly CO2-emission and energy consumption was calculated using two different approaches. In the first method, a yearly average simplified driving pattern was constructed. It was assumed, based on data from the 2009 National Travel Survey [20], that an average driver drives 14 km to and from work every day for a total of 230 days, i.e., 6440 km per year. In addition, another 10 km is assumed to be driven locally each day all year-round, i.e., 3650 km. Local driving and commuting thus amounts to roughly 10,000 km/year. Long distance driving is assumed to make up the difference to three annual total driving distances of 12,000 km, 16,000 km, and 20,000 km. The vehicle is recharged overnight. It is assumed that the vehicle is driven in E-mode whenever possible as the energy cost of electric driving is about 1/4th of the cost of driving with gasoline (Electricity cost 0.1 Euro/kWh. Petrol cost 1.6 Euros/L). Figure 7 shows the estimate of the average yearly CO2-emission of such a driving pattern. When driving 16,000 km per year, the reduction in CO2 is 46%. Driving 12,000 km per year increases the reduction to 63%, while driving 20,000 km per year decreases it to 35%.
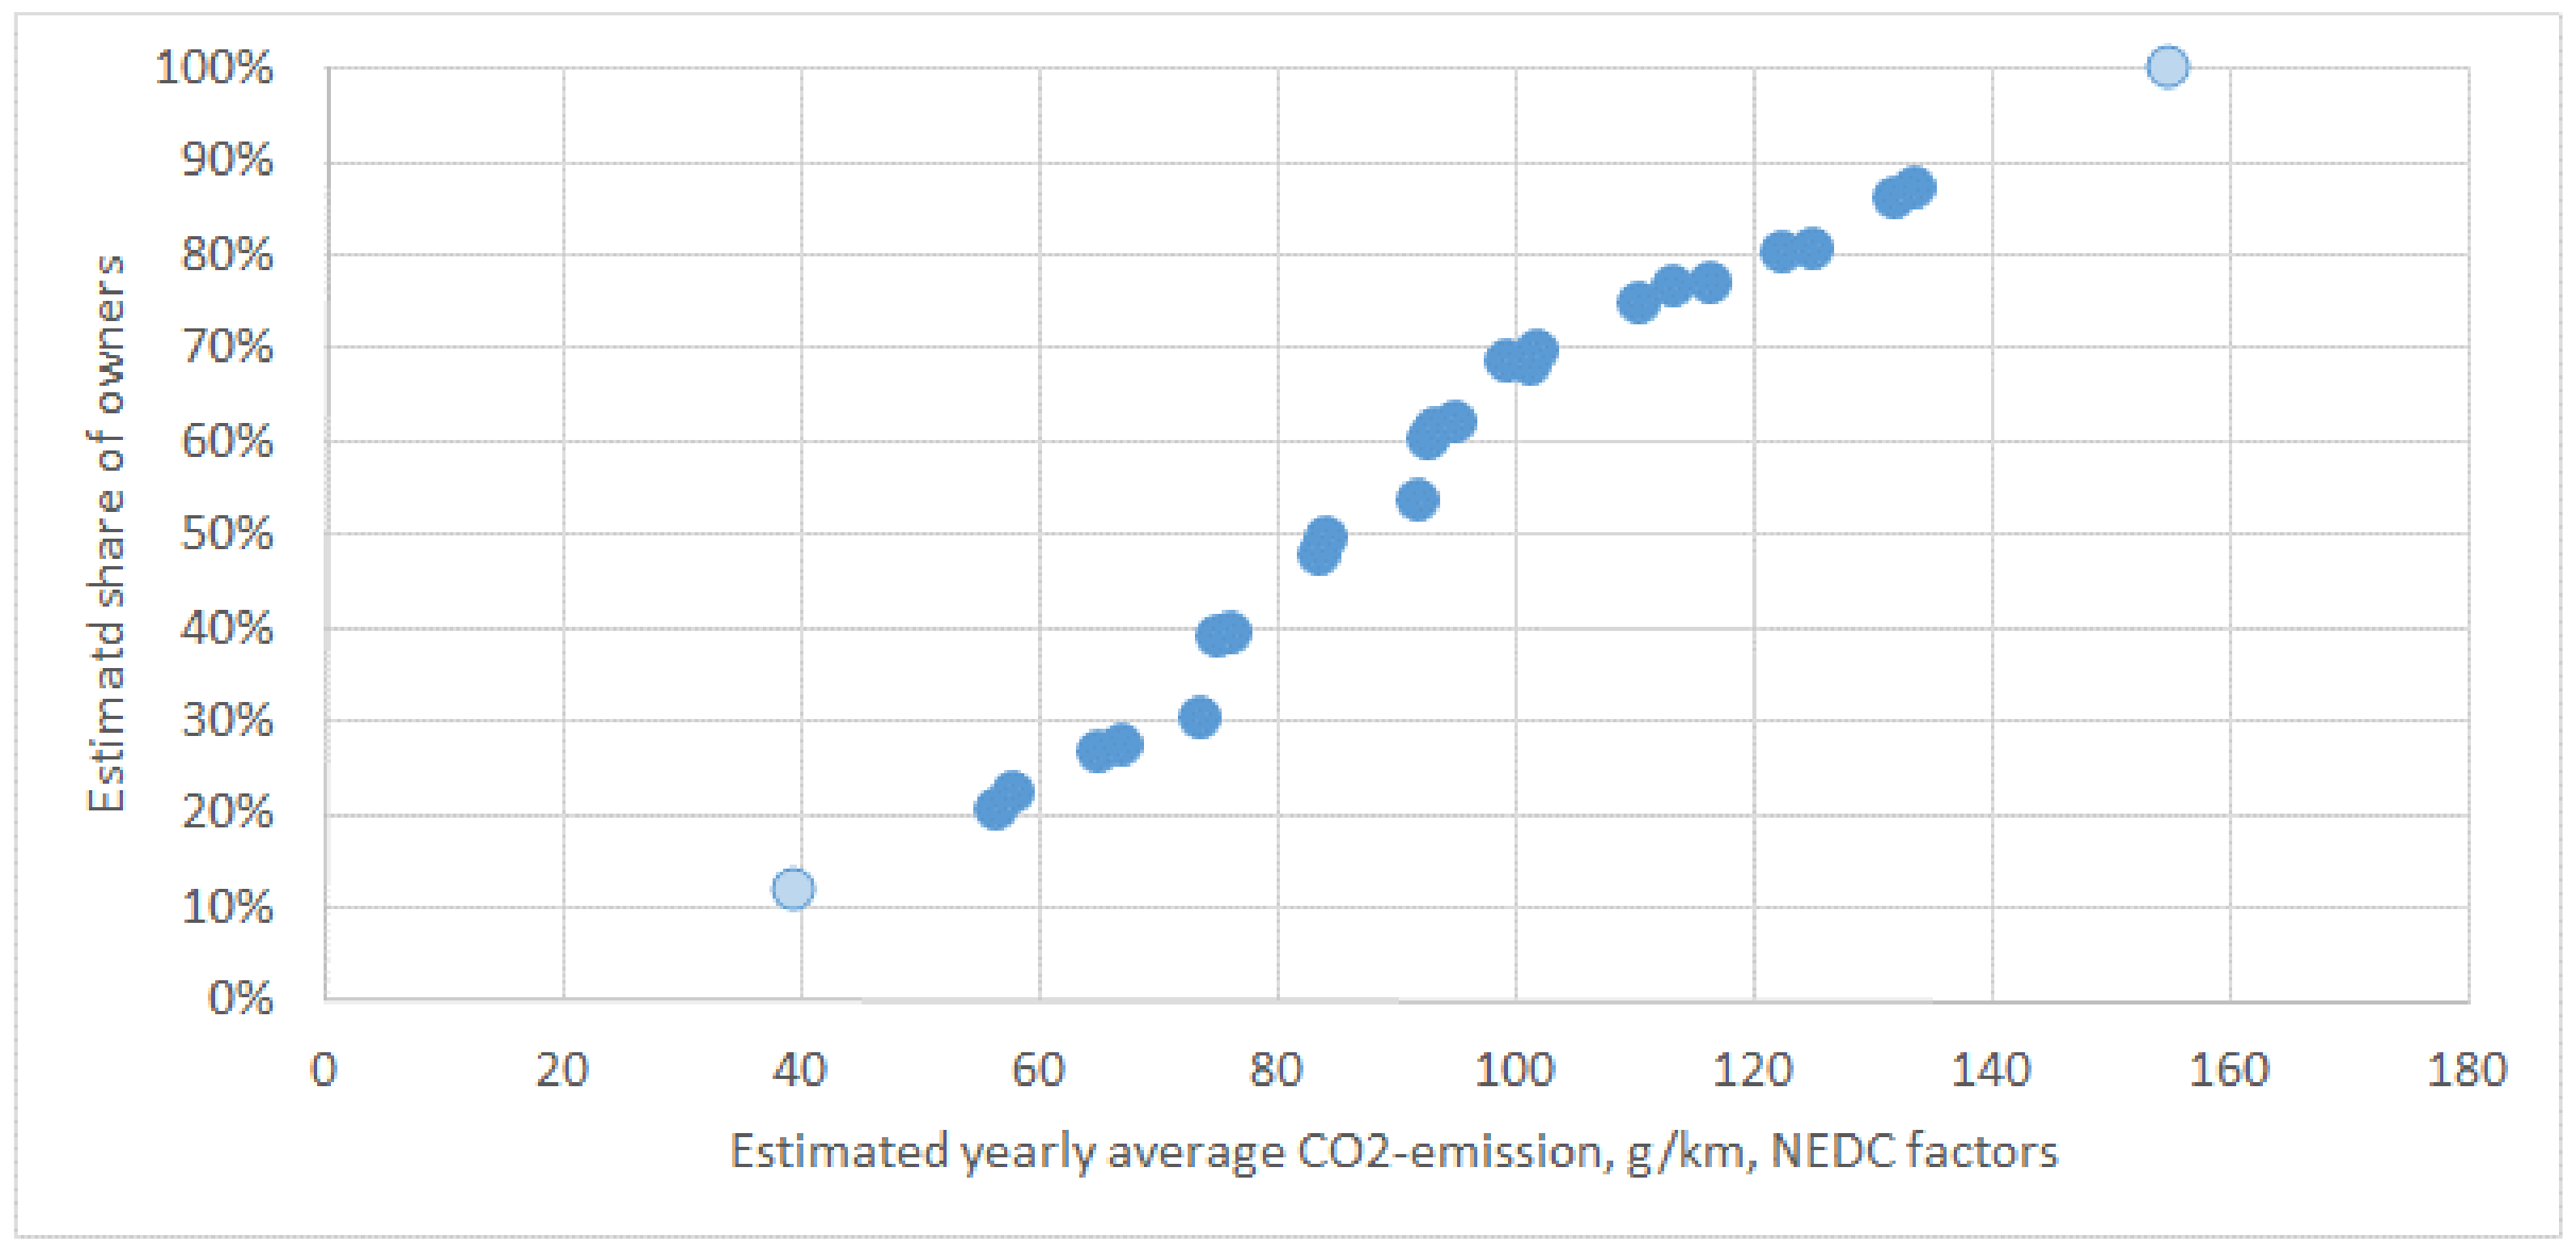
The second method, described in detail in Appendix B, utilized the users’ own estimates of the range in E-mode and the estimated share of the total annual km driven in E-mode, taken from the user survey [3]. The questions were phrased as: “Can you estimate the share of total kilometers that the vehicle is driven in E-mode (pure electric mode)?” “Can you estimate the range of the vehicle in the E-mode (pure electric mode)”. There were separate questions for the summer and the winter. The average CO2-emission was calculated to be 92 g/km, and the median was calculated as 86 g/km as seen in Figure 8. This calculation method yields a CO2-reduction of 49% compared to the similar ICEV.
There is a big uncertainty in estimates of the E-mode share of driving when they are based on the user’s own assessment. The two calculation methods nevertheless produced similar results. The CO2-emission in real averaged traffic-conditions is thus about 2.5 times higher than the type approval value. This deviation is much larger than the 42% increase found for the 2015-year-model ICEVs by Tietge et al. (2016) [14]. The German web site Spritmonitor.de [21] allows users to log fuel consumption of their vehicles over time. They register km driven (from the odometer) and fuel filled at regular intervals. The 49 registered users of the PHEV version [21] of Vehicle A, achieved a 46% reduction of CO2 under German conditions (Assuming 2.66 kg CO2/L diesel, 2.32 kg CO2/L gasoline), compared with users operating the most comparable diesel version of the same car.
3.2. Vehicle B
3.2.1. Electric Drive Mode
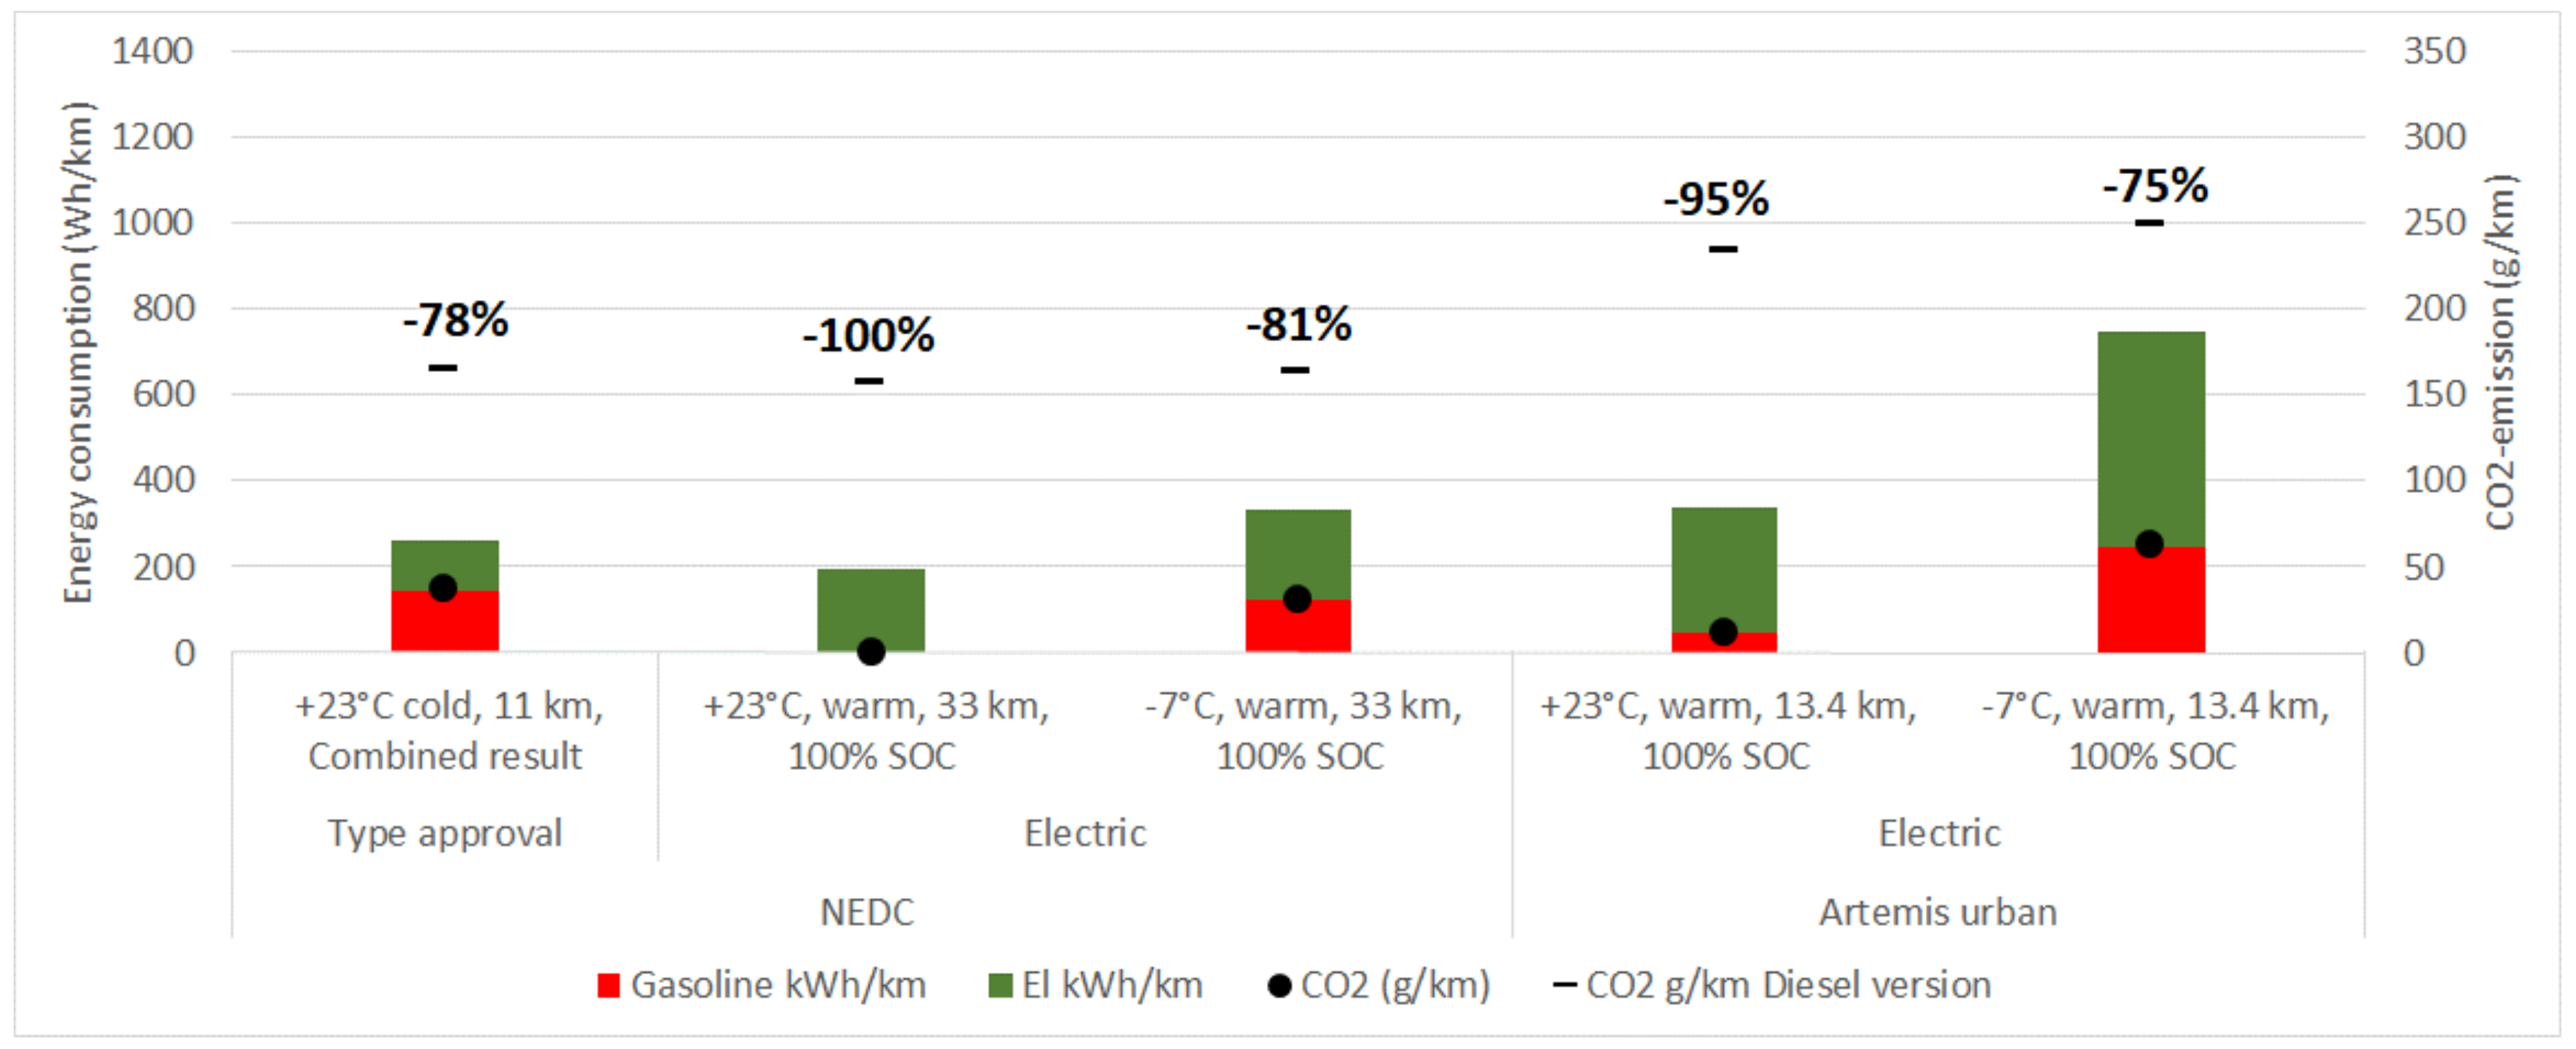
Vehicle B had a pure electric drive mode. The available power was so severely impacted at −7 °C, that the vehicle could only follow the NEDC cycle for 14.5 km before the battery was drained, as seen in Figure 9.
3.2.2. Hybrid Auto Mode
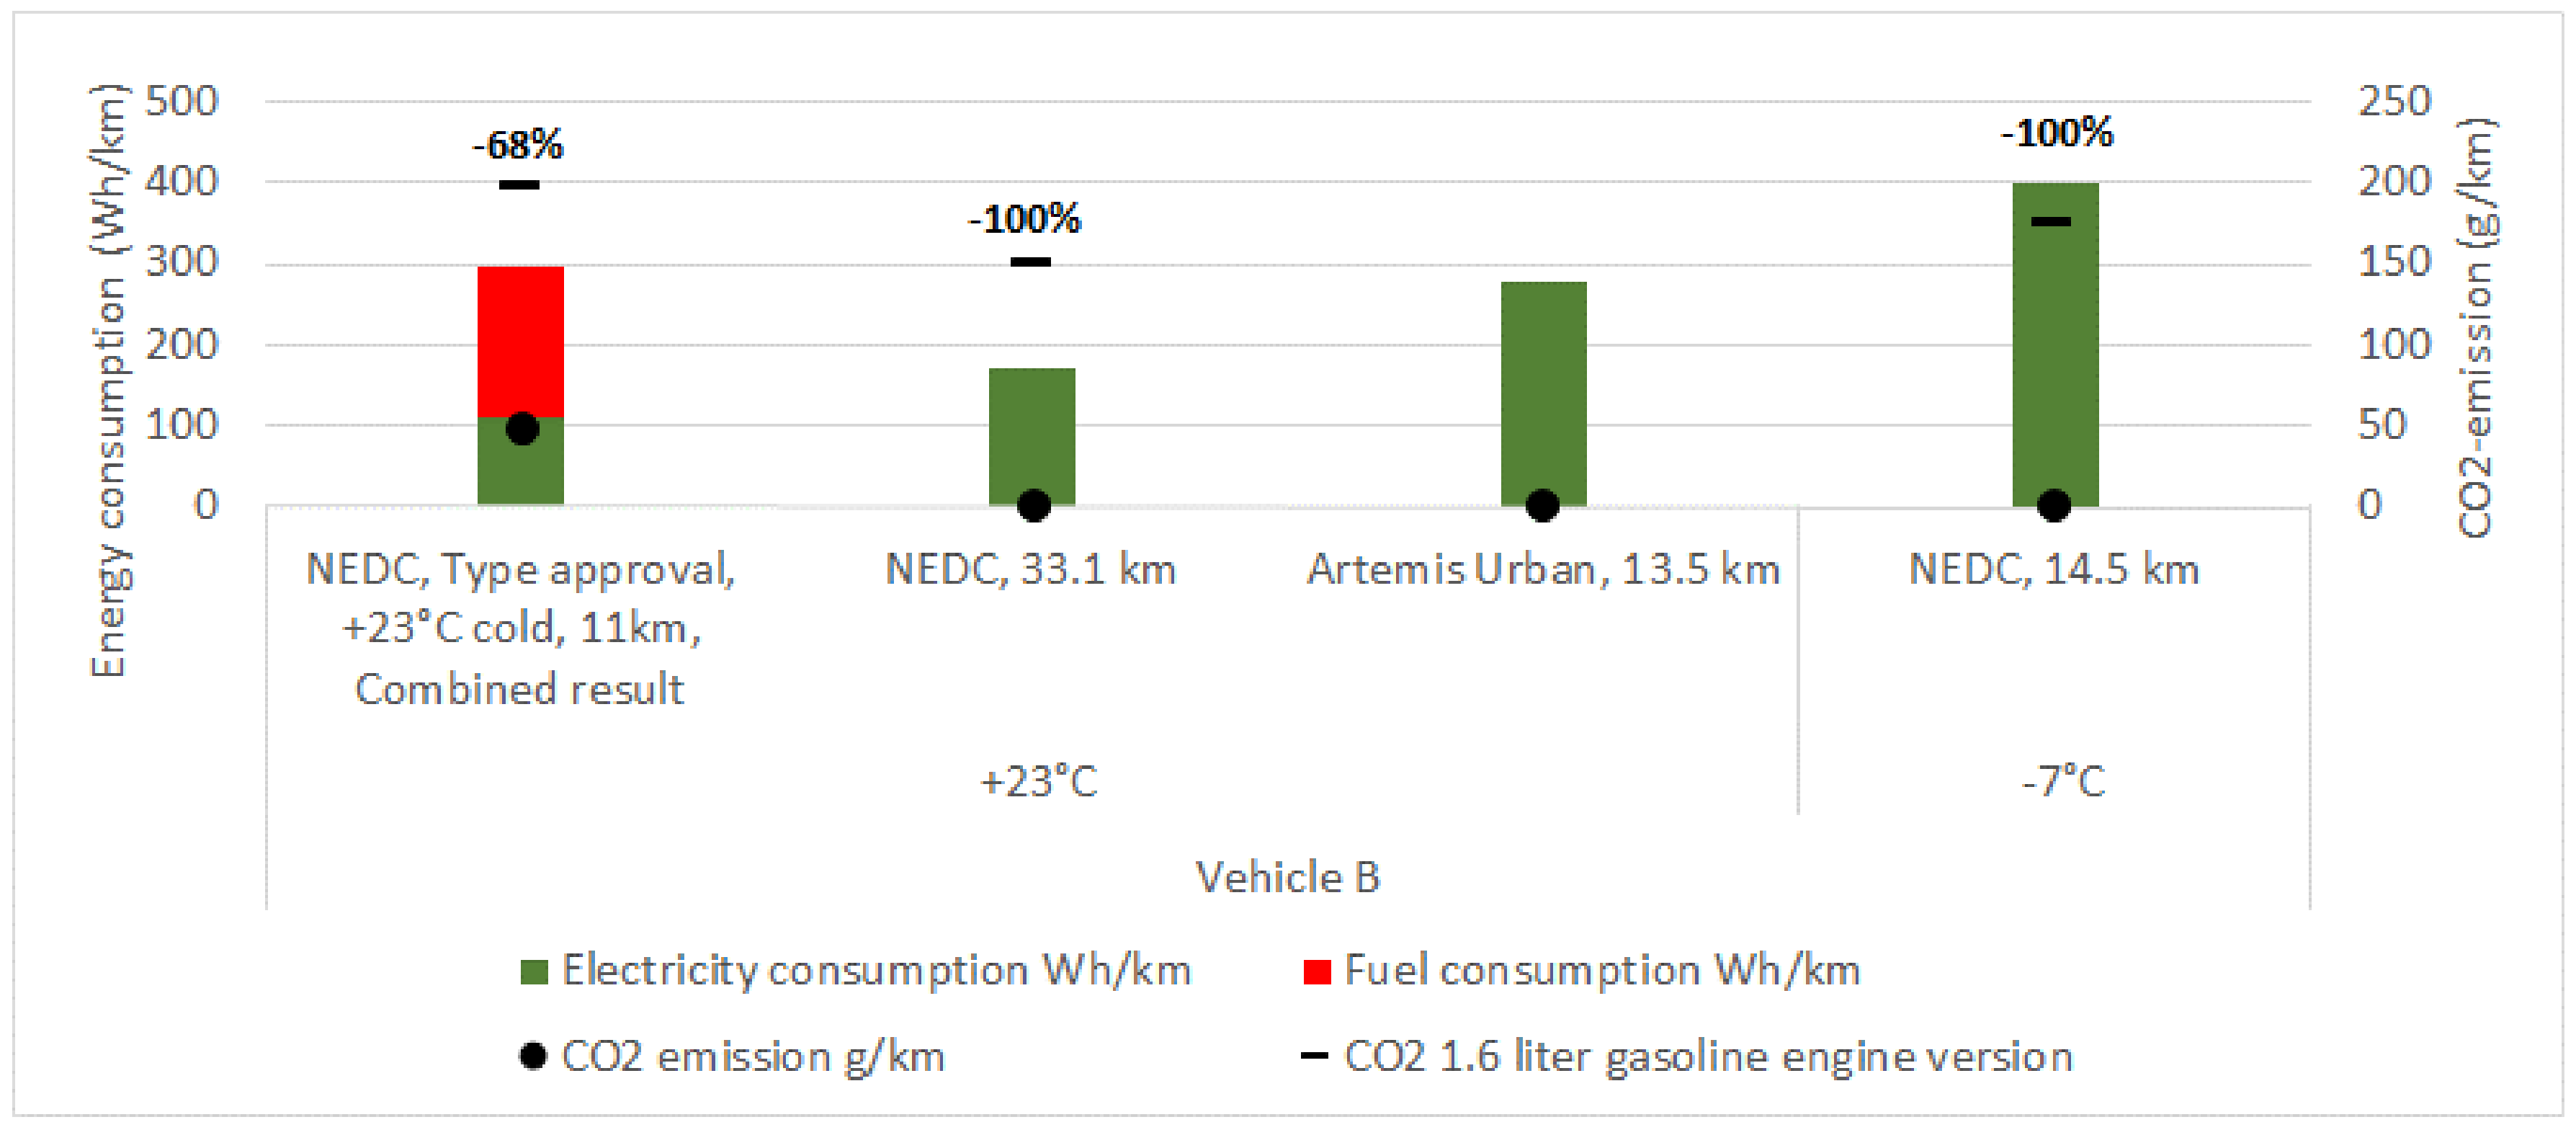
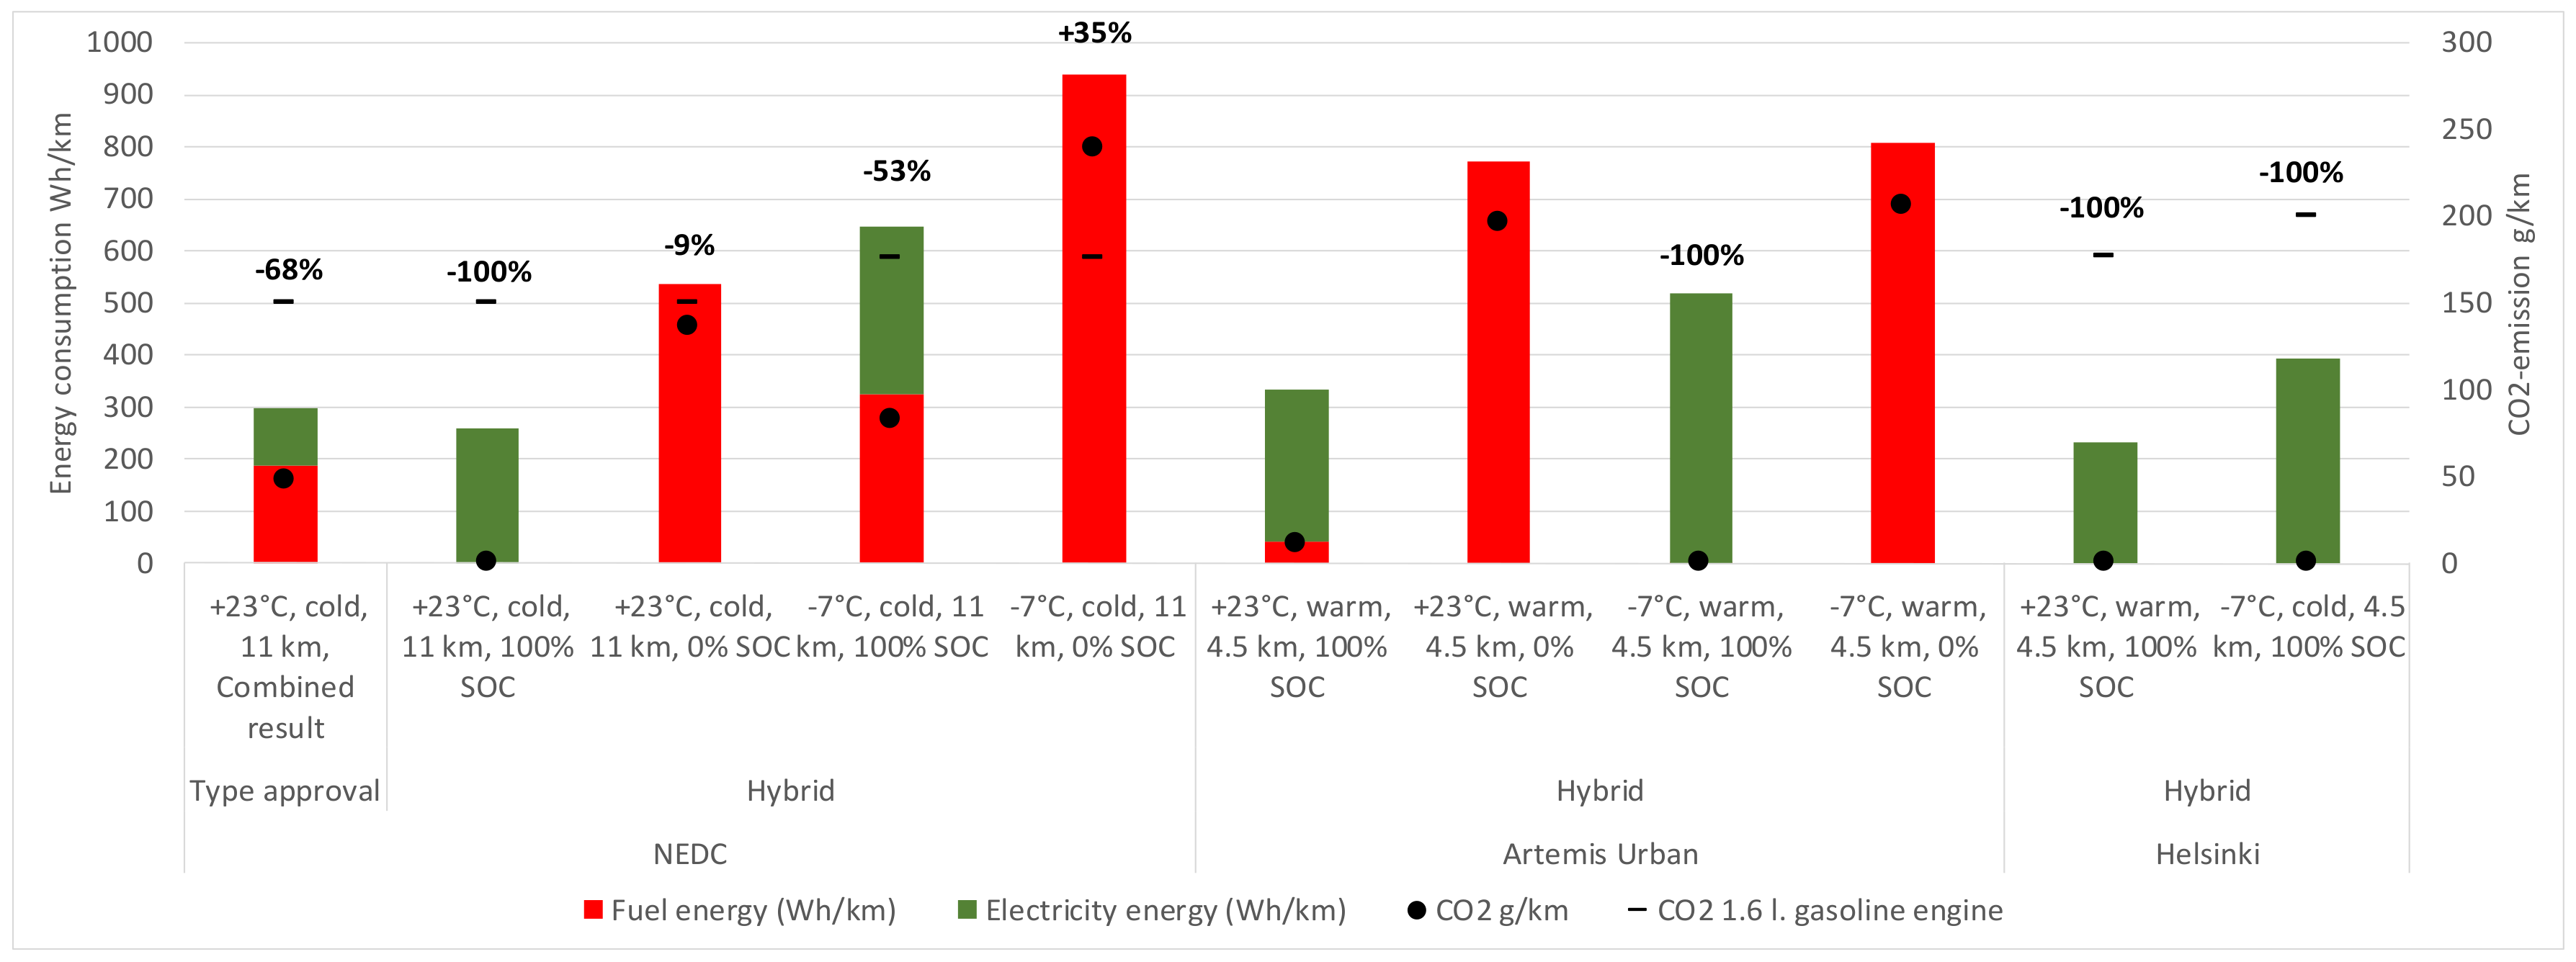
Vehicle B was apparently programmed to run only on pure electric power in the hybrid auto mode, whenever possible. Therefore, the NEDC test at +23 °C, the Helsinki-city test at +23 °C and −7 °C, and the Artemis Urban test at −7 °C, could be driven with electricity alone, when starting with 100% battery SOC. For some unknown reason, the ICE was switched on during the Artemis cycle at +23 °C, but not at −7 °C. The ICE was partly on with a CO2-emission of 82 g/km when driving in the NEDC at −7 °C. The CO2-emission and energy consumption was quite high when the vehicle was started with 0% battery SOC at an ambient temperature of −7 °C. The vehicle emitted less than the comparable gasoline engine version of the vehicle in most drive modes where comparable tests were done. The CO2-emission was, however, higher when the battery was empty and the temperature was low, as seen in Figure 10.
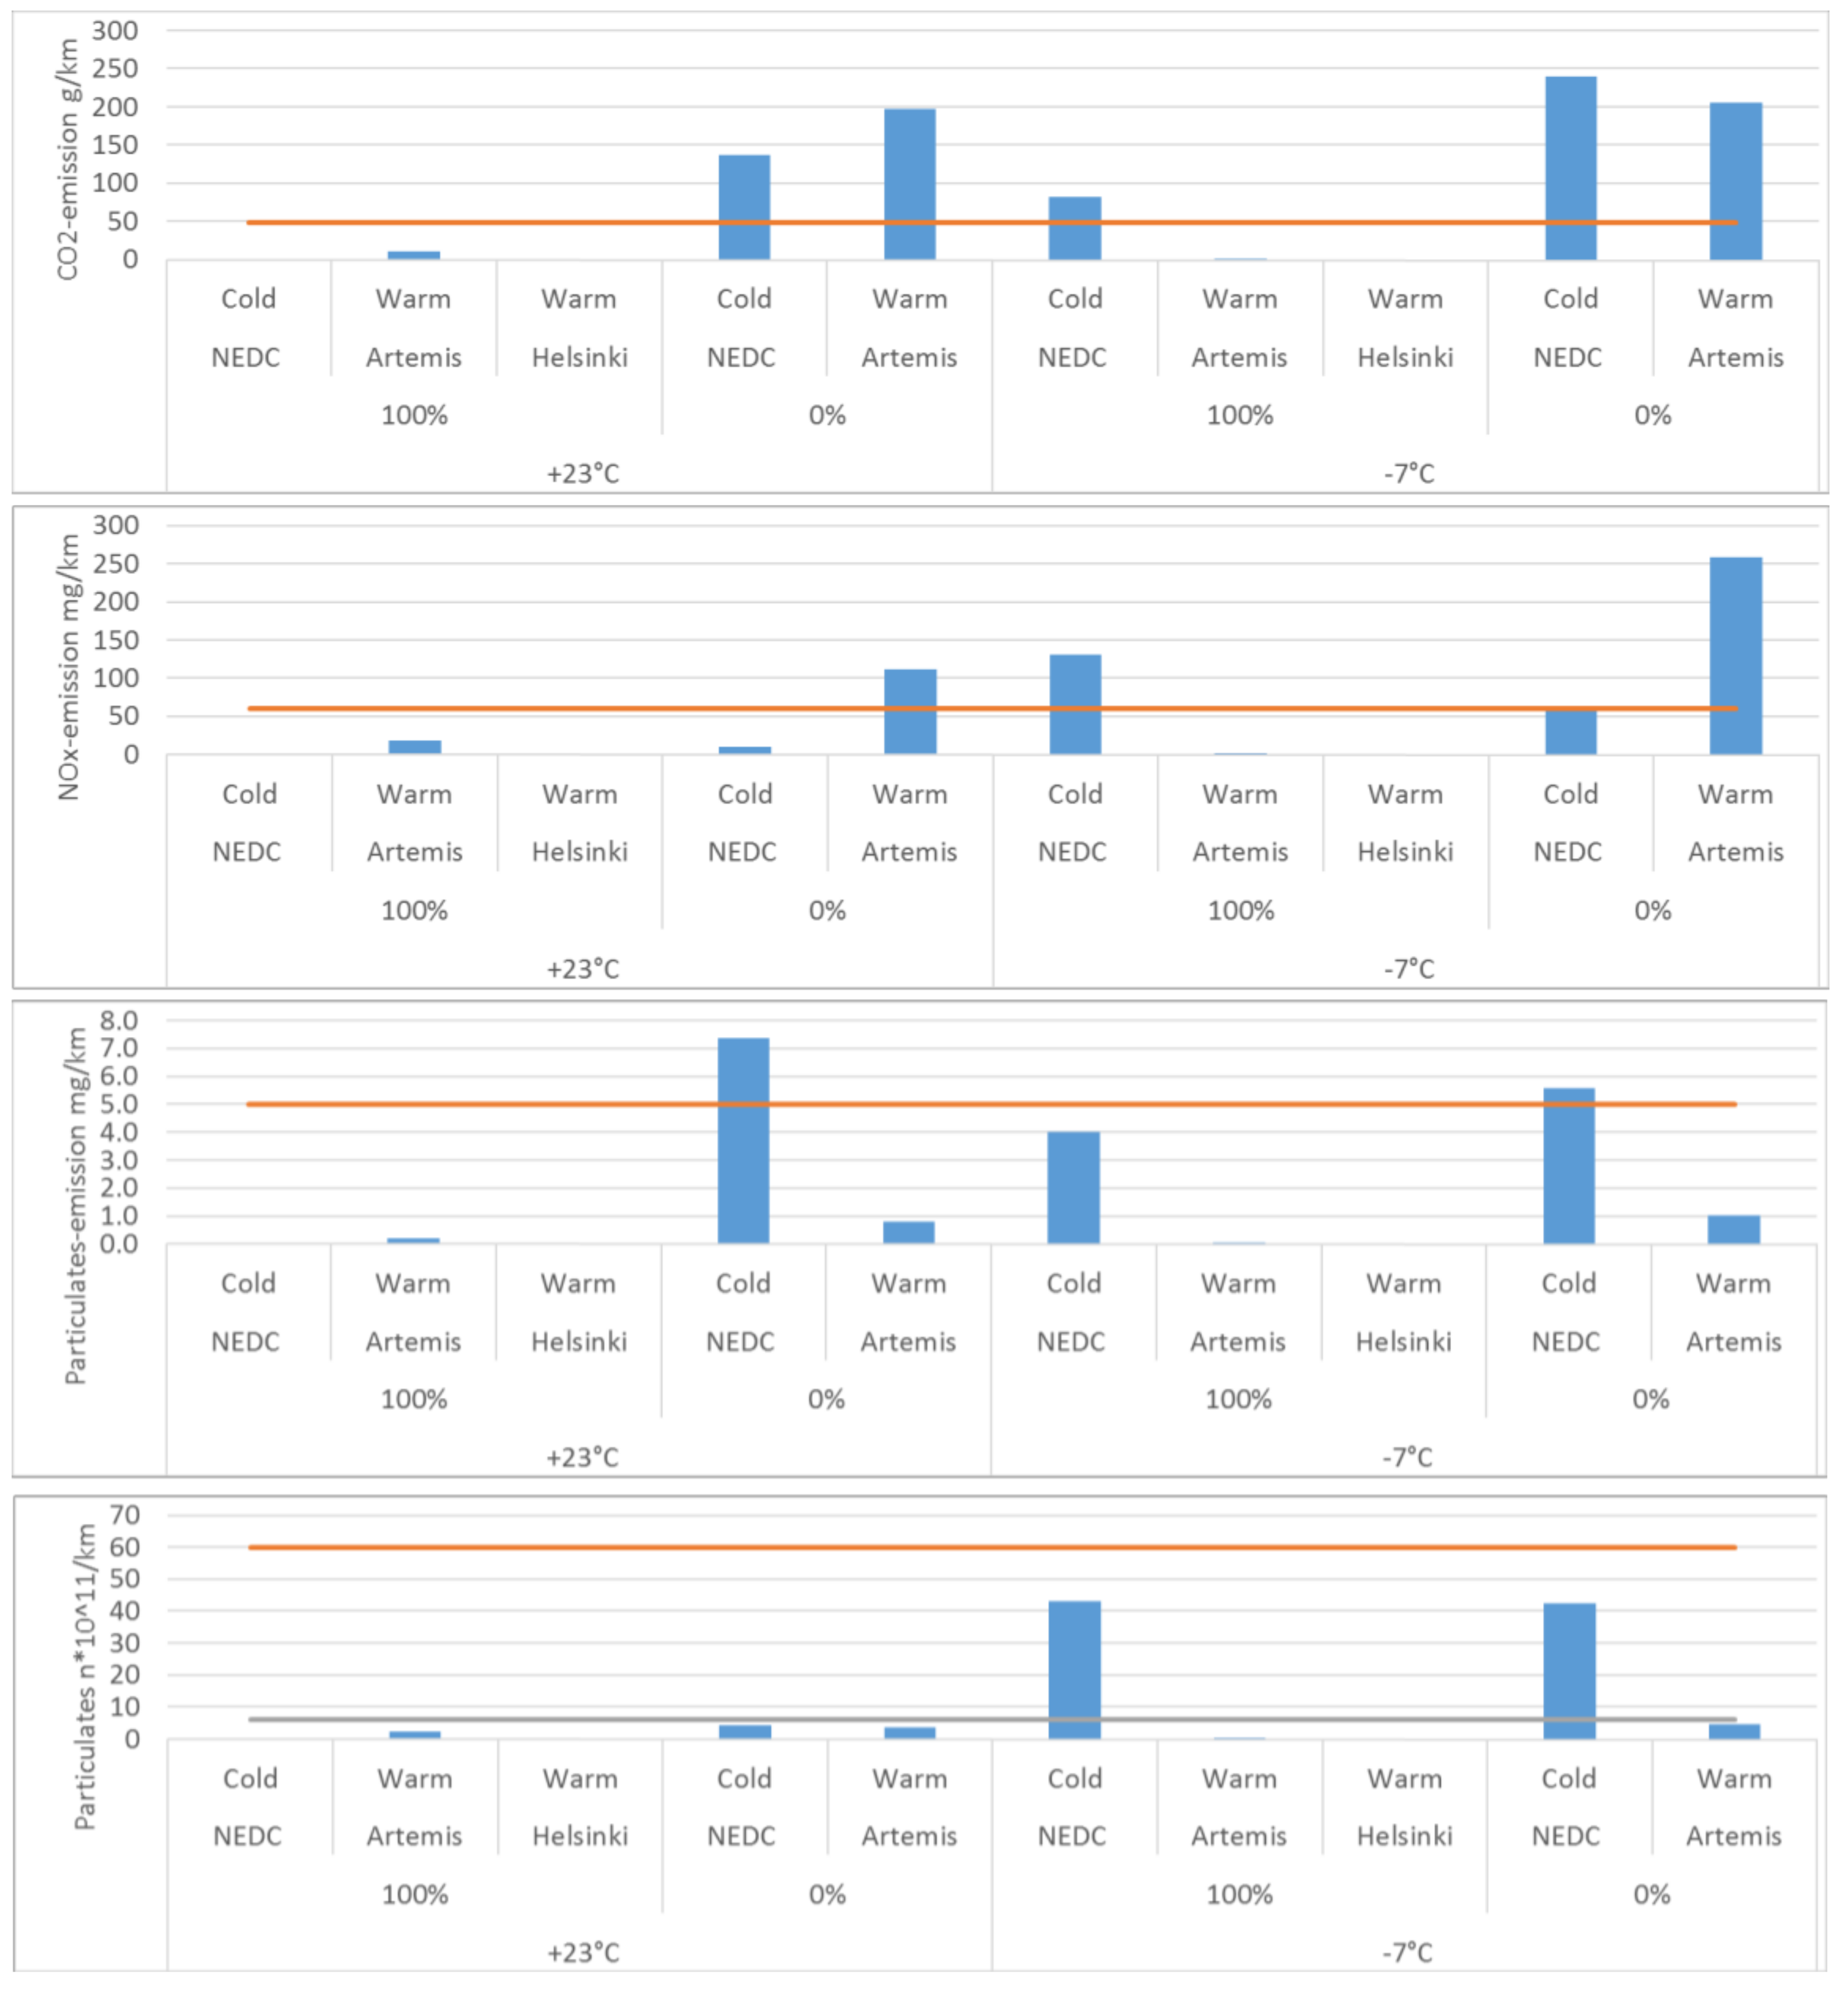
The NEDC cycle at +23 °C, the Helsinki-city cycles at +23 °C and −7 °C, and the Artemis Urban cycle at −7 °C, with 100% battery SOC at the start, could be driven with electricity only, so that no local pollutants or CO2 were emitted. When driving in high load conditions, with 0% SOC or in cold climate, some of the local emissions were above the NEDC emission limits, as seen in Figure 11. Driving according to the Artemis driving cycle resulted in high NOx-emissions for Vehicle B, while the other emissions were quite low.
3.2.3. Estimate for Yearly Average
The first calculation method for yearly average of Vehicle A was also used for Vehicle B. The users’ estimated range could however not be taken from the user survey [3] as there were not enough respondents to produce valid results. An E-mode range of 33 km in the summer and 14 km in the winter was therefore assumed based on the laboratory test results in E-mode [2].
The estimation result is shown in Figure 12. When used 16,000 km/year in this assumed usage pattern, the average CO2-emission was estimated to be 118 g/km, 2.5 times higher than the EU NEDC type approval value. The CO2-emission is 27% less than with the 1.6 L gasoline version of the vehicle and 36% less compared with a 2.2 L diesel version.
4. Discussion
PHEVs produce very different amounts of CO2-emission and local pollutants depending on configuration, manufacturer strategy, user preferences and drive mode selection, driving pattern, and driving conditions. The energy consumption and mix between electricity and gasoline varies accordingly.
The most important characteristics of PHEVs is the share of driving that can be accomplished in E-mode. This drive mode is assumed to be the primary reason for consumers to buy a PHEV rather than a HEV. Eighty-nine percent of the PHEV owners in the user survey saw electric driving locally as a primary reason to buy a PHEV [3]. The larger the share of driving in E-mode, the lower the fuel consumption, CO2-emission, and local pollution will be. The estimates of these vehicles’ average CO2-emission over a year demonstrates, however, that it is rather the range in E-mode rather than the ability to drive purely in the E-mode that is critical to achieve low average yearly CO2-emissions.
When these vehicles are used for about 15,000 km/year [3], the real-world CO2-emission would be 50% less than the emission from a similar ICEV for the compact vehicle and 30% for the mid-sized vehicle, i.e., proportional to E-mode range. The assumption is that E-mode driving is used for commuting and local driving and the “0% SOC hybrid auto mode” is used for the remaining driving.
These CO2 reduction numbers are slightly lower than the estimates that Plötz et al. [6] produced. They found that the share of electric km driven is about 60% for a 50 km electric range PHEV and about 35% for a 30 km electric range PHEV. The cold Norwegian winters, taken into account in the calculations for Norway, could be a reason for these differences.
Drivers driving longer annual distances, i.e., more than 15,000 km/year, will see a smaller reduction (Figure 7) and those that drive less will achieve a larger reduction. Aggressive driving can lead to less reduction potential based on the results measured in the Artemis Urban drive cycle (Figenbaum and Weber 2016).
In Vehicle B the electric mode is pure electric, whereas in Vehicle A it can be characterized as being “mostly” electric supported by the ICE at medium to high loads and under unfavorable climatic conditions. Driving in the hybrid mode of Vehicle B was done purely electrically in many drive cycles and driving conditions.
This observed and measured vehicle behavior does not necessary lead to the general conclusion that Vehicle B will produce less CO2-emissions per year than Vehicle A. It will depend on how the vehicles are used. Vehicle A has a longer range in E-mode and a larger battery, so overall it will be able to do more driving in electric mode than Vehicle B can do, but potentially the driving in E-mode will be more spread out over a trip. Overall, Vehicle A is expected to produce less CO2 over a year of 16,000 km of average driving than Vehicle B, due to the longer E-mode range and the larger battery.
For both vehicles, low temperatures and aggressive driving reduced the range in E-mode, and increased the energy consumption in all drive modes and drive cycles tested. The same situation applies also for ICEVs.
The emissions of NOX and particulates can be high in more demanding drive cycles such as the Artemis Urban Cycle, in low temperatures, and when driving with an empty battery. One specific case that can lead to excess local emissions was not tested. The CARB has found [8] that starting to drive a blended mode (vehicle A) PHEV in E-mode can lead to high power cold starts that cause high emissions, but all E-mode testing of vehicle A was done with a semi-warm vehicle. Due to this issue, the overall effects on local pollution of operation of vehicle A over a year remains uncertain. Vehicle B operates in pure electric CD mode and is unlikely on average to produce emissions above the emission limit value.
The cold weather tests presented in this report were done at −7 °C, so issues with potential E-mode cut-off at low ambient temperatures, as some manufacturers do to protect the battery, was not encountered. One manufacturer for instance shuts off the system at less than −10 °C. Vehicles with that type of strategy will produce higher average emissions under Norwegian conditions than estimated in this paper.
Driving in the battery charge and battery hold modes, respectively, recharging the battery, and preserving the battery SOC, resulted in very high emissions of CO2 and high energy consumption in Vehicle A. These modes will allow for a later part of the journey to be conducted with electric power, for instance in a zero-emission city zone, or in sports mode, and thus be desirable functions for some users.
Coming back to the assumptions in Section 2.1, it is evident that:
- Some PHEVs have a pure battery electric drive mode in warm as well as cold climates, others do not.
- Battery range is not sufficient to cover average everyday traffic in the winter in Norway.
- The energy consumption in non-electric modes can be higher than for comparable ICEVs/HEVs.
- The start and stop of the drive system in hybrid mode can lead to high emissions, but the average emissions will likely stay below the type approval value.
- Under Norwegian usage patterns and climatic conditions, the total energy consumption and CO2-emissions can be about 30–50% lower from PHEVs than those from comparable ICEVs.
- The partially blended electric/ICE operation of Vehicle A in E-mode is not an issue when it comes to reducing CO2-emission and energy consumption over a year. E-mode range is the most important parameter in reducing emissions.
Some PHEVs do not allow electrical operation when temperature falls below −10 °C to protect the batteries. Such behavior could not be detected, since the vehicles were tested at −7 °C. The survey only covered privately owned PHEVs. Private users are likely to utilize the PHEVs electric range capability and recharge overnight to reduce their cost of driving as it is cheaper to operate the vehicle on electricity than gasoline. People using a leased company car with fuel payed for by the company may not have the same incentive [3].
5. Conclusions
The variation in CO2-emissions was huge for these vehicles when driving in different user selectable drive modes, different drive cycles, temperatures, and SOC levels. The variation is much larger than for an ICEV, in particular for CO2. The conclusion is, therefore, that PHEVs are a vehicle type that needs to match well with the usage pattern to produce low CO2- and local pollutant emissions. The vehicles’ range in E-mode is indicative of real-world performance, as longer ranges lead to a higher share of electric mode driving and less CO2-emissions, as long as the vehicle is plugged in and charged frequently. The two vehicles produced CO2-emission reductions proportional to the range in E-mode when considering an average usage pattern. A 50 km type approved NEDC range lead to a 50% reduction estimate in real traffic conditions, and a 31 km E-mode range to about a 30% reduction, assuming daily recharging at home.
Whether the vehicle has a pure electric drive mode or not seems to be less important for the overall result than the range in E-mode. The average yearly estimated CO2-emission was about 2.5 times higher than the value stated in the type approval official CO2-emission test. Larger CO2-reductions can be achieved with optimum driving patterns, i.e., predominantly local, short-distance driving, and relatively few long distance trips. Less CO2-reduction (measured in percentage) will be achieved if drivers have a large share of long distance trips. The benefits could then become marginal compared with HEVs as PHEVs are heavier and thus have high energy consumption when used as a HEV than do regular HEVs. This issue becomes even more important when factoring in emission differences in vehicle production.
Policies that can provide users with incentives to charge their vehicle as often as possible should be considered. Enterprises that offer employees company cars should make sure that the vehicles are recharged.
Some specific user selectable drive modes and demanding driving patterns, especially in cold climate, could lead to excessive local pollutant emissions (over type approval limits). On average, vehicle B is expected to produce local emissions below the emission limit values when they are driven partly on electricity. For vehicle A, an important condition that can cause excessive emissions in E-mode, high power cold starts of the engine, was not tested and the results are inconclusive.
Charging at work or other places during the day can significantly improve the environmental benefits of the current generation of PHEVs by increasing the E-mode share of the driving over the year.
Author Contributions
Conceptualization, E.F. and C.W.; Methodology, E.F.; Formal Analysis, E.F.; Investigation, E.F.; Data Curation, C.W. Writing-Original Draft, E.F.; Writing-Review and Editing, E.F.; Visualization, E.F.; Supervision, E.F.; Project Administration, C.W.; Funding Acquisition, C.W.
Funding
The results presented here have been created within the Norwegian research program EMIROAD. The program was initiated to gain a better understanding of the emission behavior of vehicles in real traffic conditions in Norway. It ran from 2013–2016 and was financed by the Norwegian Public Roads Administration.
Acknowledgments
The authors wish to express their thanks to the VTT vehicle emission laboratory in Finland that carried out the measurement program.
Conflicts of Interest
The authors declare no conflict of interest. The founding sponsors had no role in the design of the study; in the collection, analyses, or interpretation of data; in the writing of the manuscript; and in the decision to publish the results.
Appendix A
Appendix A.1. Vehicle A

Appendix A.2. Vehicle B

Appendix B. Method Two of Calculating CO2-Emission over the Year
Table A1 shows the respondents’ estimated E-mode range during the summer and winter season. There were two questions, one for summer and one for winter, that have been cross-tabulated. Users had to choose one of the bins (0–40%, etc.).

Table A1.
Percentage of private users by estimates of share of total driving in E-mode in the winter versus summer for Vehicle A [3].
Table A1.
Percentage of private users by estimates of share of total driving in E-mode in the winter versus summer for Vehicle A [3].
| Users’ Estimate of Share of Total Driving in E-Mode in the Winter | ||||||
|---|---|---|---|---|---|---|
| 0–40% | 41–50% | 51–60% | 61–70% | >70% | ||
| Users’ estimate of share of total driving done in E-mode in the summer | 0–40% | 13% | 1% | 0% | 0% | 0% |
| 41–50% | 5% | 5% | 1% | 1% | 0% | |
| 51–60% | 3% | 6% | 7% | 2% | 1% | |
| 61–70% | 2% | 4% | 9% | 9% | 2% | |
| >70% | 1% | 3% | 4% | 8% | 12% | |
This data was combined with the estimated CO2-emissions assuming that drivers use either the pure Charge Depletion (CD) mode or the Charge Sustain (CS) mode with the CO2-emissions of Table A2 and the shares of driving under summer conditions. Table A2 was used to build Table A3.
Table A2.
Vehicle A emissions in E-mode (Charge Depletion) and in Hybrid mode (Charge Sustain mode) with empty battery. Share of driving assumed for summer and winter.
Table A2.
Vehicle A emissions in E-mode (Charge Depletion) and in Hybrid mode (Charge Sustain mode) with empty battery. Share of driving assumed for summer and winter.
| E-mode summer | 0 | g CO2/km | 0.6 | Summer share |
| E-mode winter | 31 | g CO2/km | 0.4 | Winter share |
| Hybrid mode 0% summer | 158 | g CO2/km | ||
| Hybrid mode 0% winter | 236 | g CO2/km |
Table A3.
CO2 emissions for possible combinations of Charge Depletion (CD) and Charge Sustain (CS) driving in summer and winter.
Table A3.
CO2 emissions for possible combinations of Charge Depletion (CD) and Charge Sustain (CS) driving in summer and winter.
| Winter | ||||||||
|---|---|---|---|---|---|---|---|---|
| Estimated share CS mode driving | 0.80 | 0.55 | 0.45 | 0.35 | 0.15 | |||
| Estimated share CD mode driving | 0.20 | 0.45 | 0.55 | 0.65 | 0.85 | |||
| E-mode share bins in survey | 0–40% | 41–50% | 51–60% | 61–70% | >70% | |||
| Summer | 0.80 | 0.20 | 0–40% | 155 g/km | 134 g/km | 125 g/km | 117 g/km | 100 g/km |
| 0.55 | 0.45 | 41–50% | 132 g/km | 111 g/km | 102 g/km | 94 g/km | 76 g/km | |
| 0.45 | 0.55 | 51–60% | 123 g/km | 101 g/km | 93 g/km | 84 g/km | 67 g/km | |
| 0.35 | 0.65 | 61–70% | 114 g/km | 92 g/km | 84 g/km | 75 g/km | 58 g/km | |
| 0.15 | 0.85 | >70% | 95 g/km | 74 g/km | 65 g/km | 57 g/km | 40 g/km | |
Table A4.
Resulting CO2 emissions vs. accumulated share of users.
| Annual CO2 emissions | 40 | 57 | 58 | 65 | 67 | 74 | 75 | 76 | 84 | 84 | 92 | 93 | 94 |
| Number of users | 214 | 153 | 31 | 80 | 16 | 50 | 158 | 9 | 155 | 28 | 79 | 119 | 15 |
| Accumulated users | 214 | 367 | 398 | 478 | 494 | 544 | 702 | 711 | 866 | 894 | 973 | 1092 | 1107 |
| Accumulated share of users | 12% | 20% | 22% | 26% | 27% | 30% | 39% | 39% | 48% | 49% | 54% | 60% | 61% |
| Annual CO2 emissions | 95 | 101 | 99.5 | 102 | 111 | 114 | 117 | 123 | 125 | 132 | 134 | 155 | |
| Number of users | 18 | 112 | 5 | 22 | 92 | 34 | 4 | 59 | 8 | 98 | 19 | 239 | |
| Accumulated users | 1125 | 1237 | 1242 | 1264 | 1356 | 1390 | 1394 | 1453 | 1461 | 1559 | 1578 | 1817 | |
| Accumulated share of users | 62% | 68% | 68% | 70% | 75% | 76% | 77% | 80% | 80% | 86% | 87% | 100% |
References
- Figenbaum, E. Electromobility Status in Norway: Mastering Long Distances—The Last Hurdle to Mass Adoption; TØI Report 1627/2018; Institute of Transport Economics: Oslo, Norway, 2018; ISBN 978-82-480-2135-3. Available online: https://www.toi.no/publications/electromobility-status-in-norway-mastering-long-distances-the-last-hurdle-to-mass-adoption-article34903-29.html (accessed on 27 May 2018).
- Figenbaum, E.; Weber, C. Experimental Testing of Plug-In Hybrid Vehicles—CO2-Emission, Energy Consumption and Local Pollution; TOI Report 1539/2016; Electronic Version; Institute of Transport Economics: Oslo, Norway, 2017; ISBN 978-82-480-1818-6. Available online: https://www.toi.no/publications/experimental-testing-of-plug-in-hybrid-vehicles-co2-emission-energy-consumption-and-local-pollution-article34298-29.html (accessed on 27 May 2018).
- Figenbaum, E.; Kolbenstvedt, M. Learning from Norwegian Battery Electric and Plug-In Hybrid Vehicle Users. Results from a Survey of Vehicle Owners; TOI Report 1492/2016; Institute of Transport Economics: Oslo, Norway, 2016; ISBN 978-82-480-1789-9. Available online: https://www.toi.no/publications/learning-from-norwegian-battery-electric-and-plug-in-hybrid-vehicle-users-results-from-a-survey-of-vehicle-owners-article33869-29.html (accessed on 27 May 2018).
- The ICCT. Too Low to Be True? How to Measure Fuel Consumption and CO2-Emissions to Plug-In Hybrid Vehicles, Today and in the Future. Briefing; The International Council on Clean Transportation: Berlin, Germany, 2017. [Google Scholar]
- Haakana, A.; Laurikko, J.; Granström, R.; Hagman, R. Assessing Range and Performance of Electric Vehicles in Nordic Driving Conditions—Project Final Report; Norden—Energy and Transport; Nordisk Energiforskning: Oslo, Norway, 2013. [Google Scholar]
- Plötz, P.; Funke, S.A.; Jochem, P.; Wietschel, M. CO2 Mitigation Potential of Plug-in Hybrid Electric Vehicles larger than expected. Sci. Rep. 2017, 7, 16493. [Google Scholar] [CrossRef] [PubMed]
- California Air Resources Board. California’s Advanced Clean Cars Midterm Review. Appendix G: Plug-In Electric Vehicle In-Use and Charging Data Analysis; California Air Resources Board: Sacramento, CA, USA, 2017.
- California Air Resources Board. California’s Advanced Clean Cars Midterm Review. Appendix H: Plug-In Hybrid Electric Vehicle Emissions Testing; California Air Resources Board: Sacramento, CA, USA, 2017.
- Smart, J.; Bradley, T.; Salisbury, S. Actual Versus Estimated Utility Factor of a Large Set of Privately Owned Chevrolet Volts. SAE Int. J. Altern. Powertrains 2014, 3, 30–35. [Google Scholar] [CrossRef]
- Bradley, T.H.; Quinn, C.W. Analysis of plug-in hybrid electric vehicle utility factors. J. Power Sources 2010, 195, 5399–5408. [Google Scholar] [CrossRef]
- Hardman, S.; Jenn, A.; Tal, G.; Axsen, J.; Beard, G.; Daina, N.; Figenbaum, E.; Jakobsson, N.; Jochem, P.; Kinnear, N.; et al. A review of consumer preferences of and interactions with electric vehicle charging infrastructure. Trans. Res. Part D 2018, 62, 508–523. [Google Scholar] [CrossRef]
- Nicholas, M.A.; Tal, G.; Turrentine, T.S. Advanced Plug-In Electric Vehicle Travel and Charging Behavior—Interim Report. Research Report; UC Davis: Davis, CA, USA, 2017. [Google Scholar]
- Fleetcarma. Electric Range for the Nissan Leaf & Chevrolet Volt in Cold Weather. Posted by Megan Allan. 2013. Available online: https://www.fleetcarma.com/nissan-leaf-chevrolet-volt-cold-weather-range-loss-electric-vehicle/ (accessed on 20 July 2018).
- Tietge, U.; Diaz, S.; Mock, P.; German, J.; Bandivadekar, A.; Ligterink, N. From Laboratory to Road. A 2016 Update of Official and “Real-World” Fuel Concumption and CO2 Values for Passenger Cars in Europe; White Paper; The International Council on Clean Transportation: Berlin, Germany, 2016; Available online: http://www.theicct.org/sites/default/files/publications/ICCT_LaboratoryToRoad_2016.pdf (accessed on 27 May 2018).
- Tietge, U.; Mock, P.; German, J.; Bandivadekar, A. From Laboratory to Road. A 2017 Update of Official and “Real-World” Fuel Concumption and CO2 Values for Passenger Cars in Europe; White Paper; The International Council on Clean Transportation: Berlin, Germany, 2017. [Google Scholar]
- Data from Director of PR and Communication at Volvo Norway. Available online: https://www.tu.no/artikler/sa-mye-elektrisk-kjorer-de-ladbare-hybridene-i-virkeligheten/276294 (accessed on 15 December 2015).
- Figenbaum, E. Perspectives on Norway’s supercharged electric vehicle policy. Environ. Innov. Soc. Trans. 2017, 25, 14–34. [Google Scholar] [CrossRef]
- EC. Evaluation of the EU ETS Directive; European Commission, Directorate-General for Climate-Action, Directorate B—European International Carbon Markets: Brussels, Belgium, 2015; Available online: https://www.ecologic.eu/sites/files/publication/2015/2614-04-review-of-eu-ets-evaluation.pdf (accessed on 27 May 2018).
- EU. 2018. Available online: https://ec.europa.eu/clima/policies/effort_en (accessed on 20 July 2018).
- Vågane, V.; Brechan, I.; Hjorthol, R. 2009 Norwegian National Travel Survey—Key Results; TØI Report 1130/2011; Institute of Transport Economics: Oslo, Norway, 2009; ISBN 978-82-480-1195-8. Available online: https://www.toi.no/publications/2009-norwegian-national-travel-survey-key-results-article29835-29.html (accessed on 27 May 2018).
- Spritmonitor. Data Extracted from the Database on Fuel Consumption. 2017. Available online: http://www.spritmonitor.de (accessed on 4 January 2017).
Figure 1.
Typical plug-in hybrid vehicle lay-out and user-selectable drive modes.

Figure 2.
VTT Emission laboratory set-up.

Figure 3.
Vehicle A: measured E-mode energy consumption (Wh/km) and CO2-emission (black dots) in g/km compared to those of official type approval values and EMIROAD measured CO2-emission of a comparable diesel vehicle (black hyphen). Charge Depletion drive mode starting with 100% SOC, semi-warm start (vehicle cooled down while charging after previous test). CO2-emission reduction versus diesel version is also shown (percentage).

Figure 4.
Vehicle A; hybrid auto drive mode CO2-emissions (black dots) in g/km and energy consumption (Wh/km), compared with the official type approval values. The vehicle selects by itself to drive in a Charge Depletion drive mode or a Charge Sustain drive mode. Cold = Cold start, Warm = Warm or semi-warm start depending on previous test (See schedule in Appendix A). CO2-emission (black hyphen) of the most comparable diesel engine version of the vehicle and emission reduction vs. diesel version (percentages) are also shown.

Figure 5.
Vehicle A: CO2 (g/km), NOX (mg/km), and particulates (mg/km, n × 1011) emissions per drive cycle at +23 °C and −7 °C, and 100% and 0% battery SOC, hybrid auto drive mode. The vehicle selects by itself to drive in a Charge Depletion drive mode or a Charge Sustain drive mode. Cold = Cold start, Warm = Warm or semi-warm start depending on previous test (See schedule in Appendix A). Lines represents type approval values (CO2) and NEDC type approval limits. Grey line is the particulates number limit from September 2017.

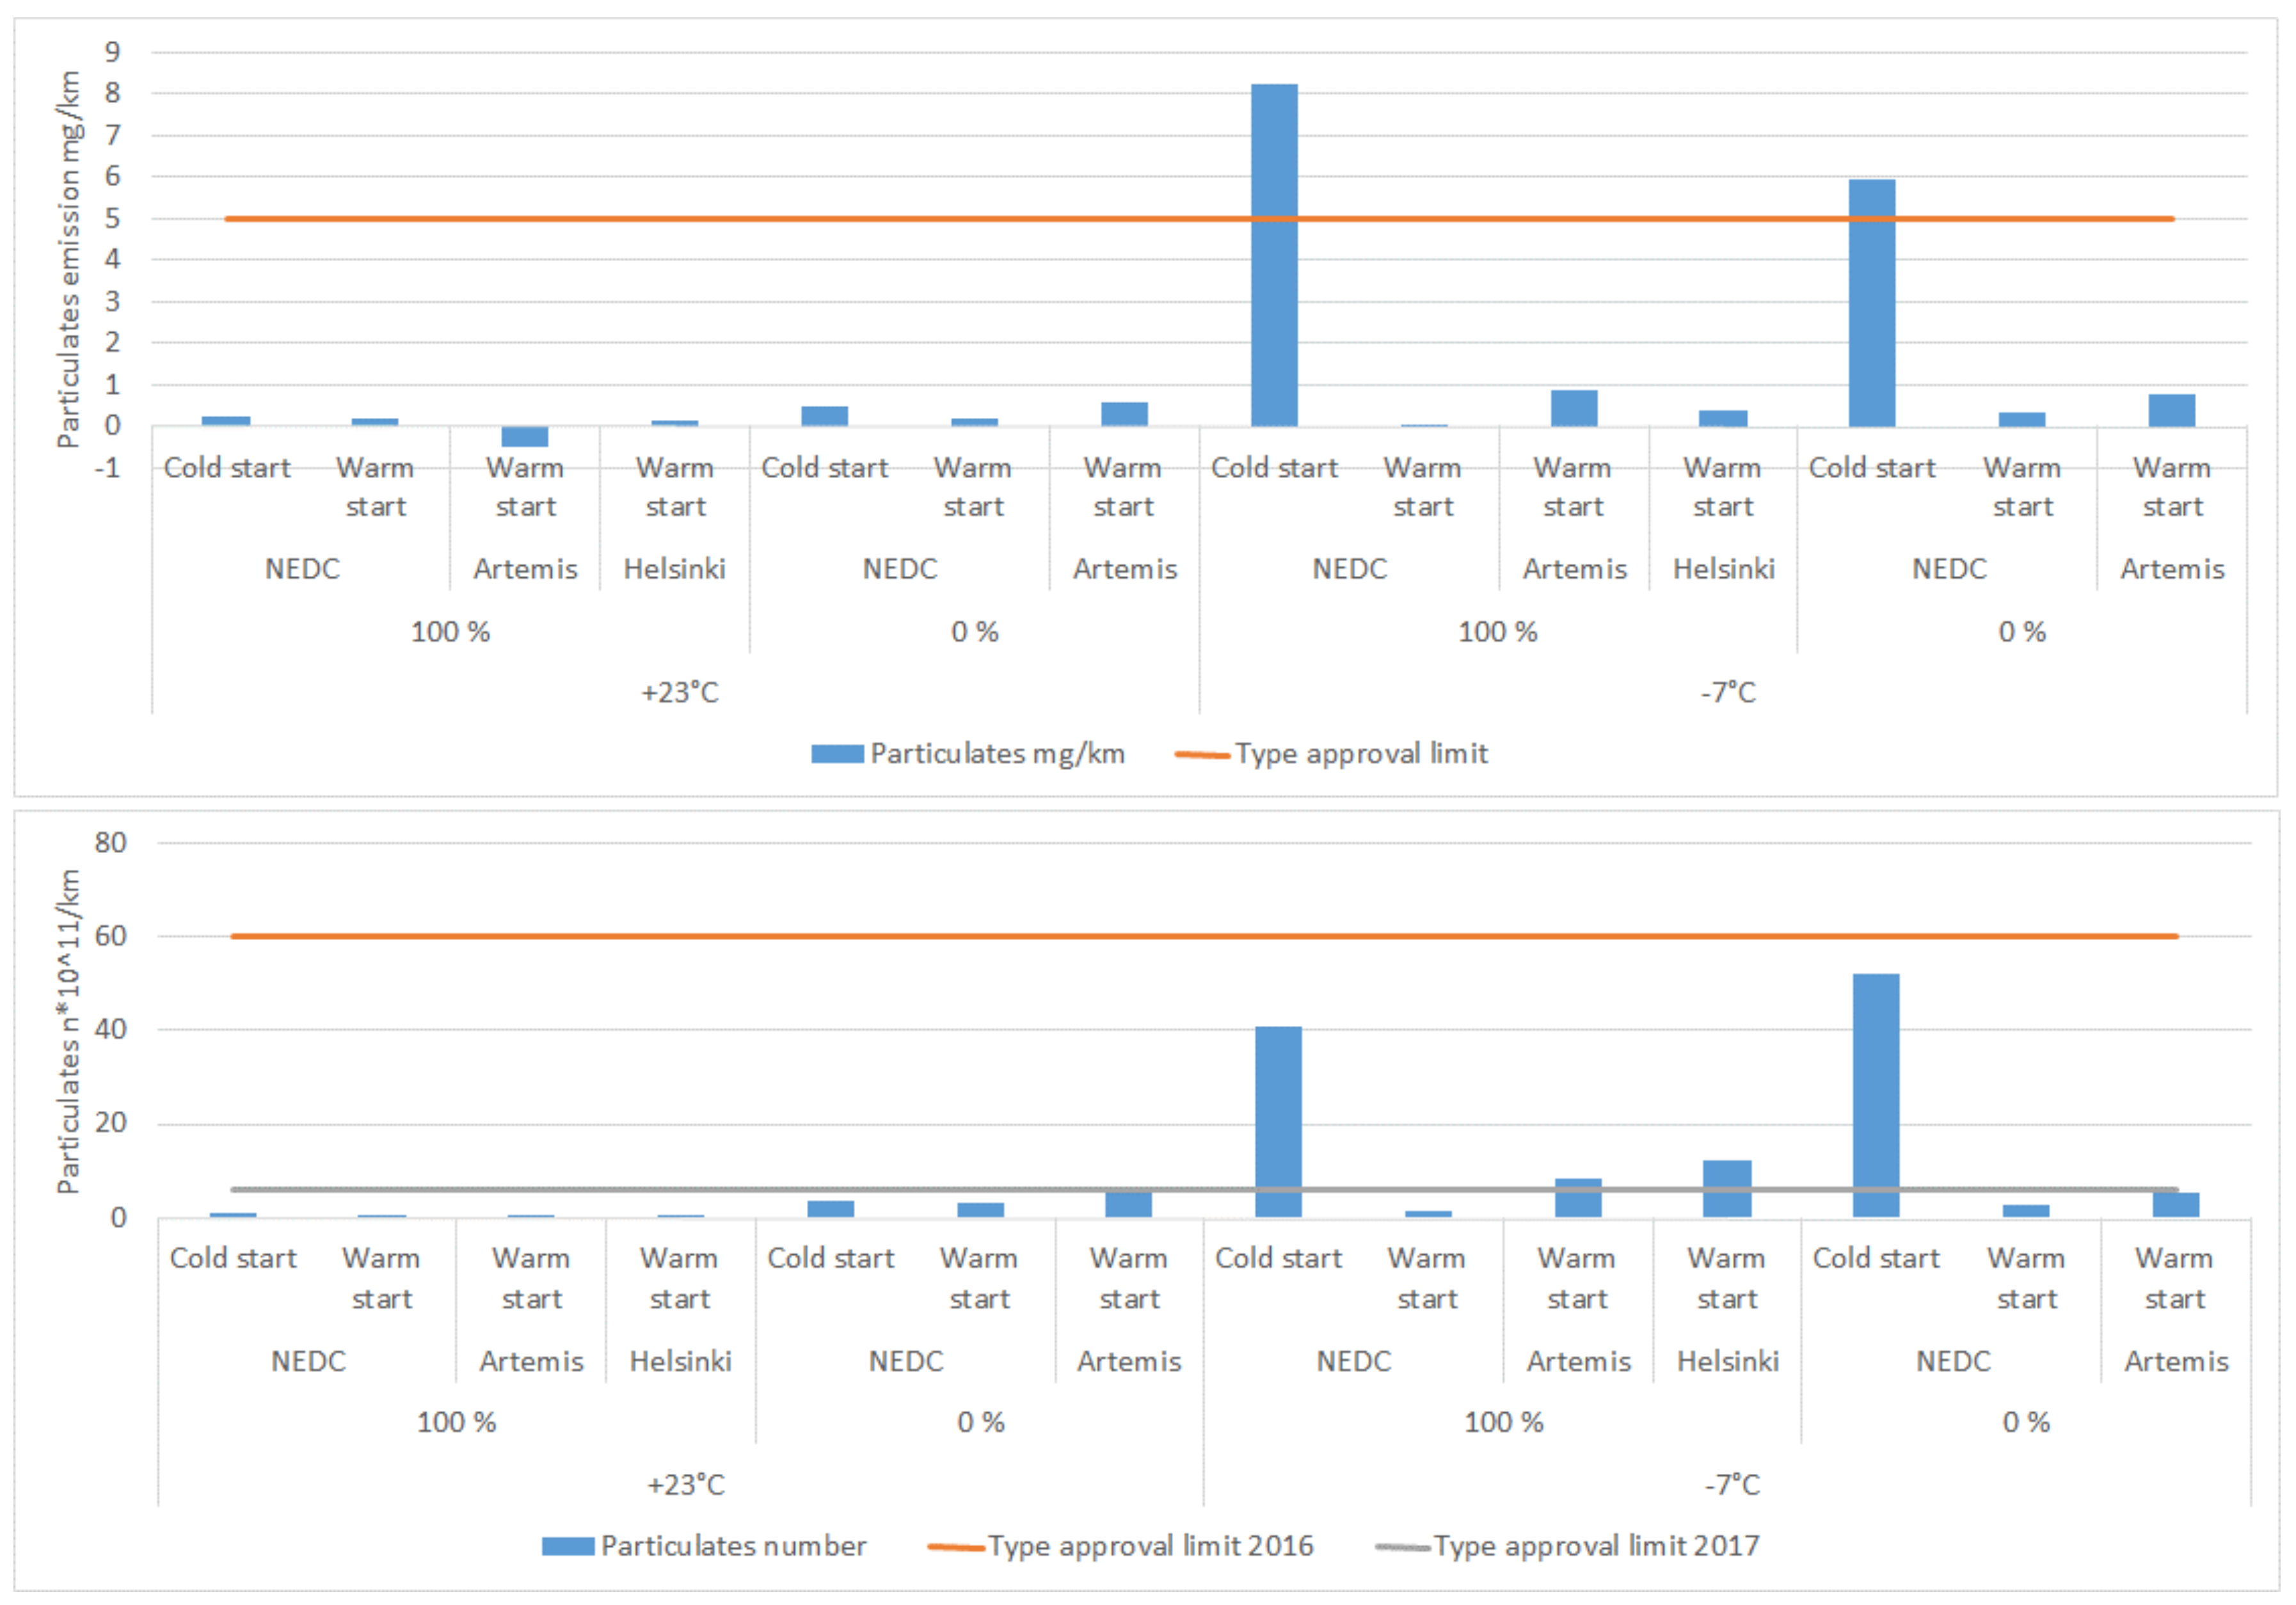
Figure 6.
Vehicle A: battery hold and battery charge modes’ energy consumption (Wh/km, gasoline and electricity) and CO2-emission (black dots) in (g/km) compared with the NEDC official type approval values and the CO2 emission (black hyphen) of the diesel version of the same vehicle. The batter charge mode is used to increase the SOC of the battery while driving. Battery hold mode keeps the battery SOC at the present value. Cold = Cold start, Warm = Warm or semi-warm start depending on previous test (See schedule in Appendix A).

Figure 7.
Vehicle A: estimated CO2-emission and E-mode share of driving over the year for a driving pattern consisting of commuting to work 14 km each way 230 days/year + 10 km additional local driving/day and assuming long distance driving the rest of the trips. E-mode NEDC driving assumed whenever possible. The vehicle was assumed to switch to the 0% SOC NEDC hybrid mode when the battery was empty. Charging overnight assumed. EMIROAD measured NEDC value of CO2-emission of comparable diesel vehicle. Results at +23 °C were weighted at 0.6 and results at −7 °C were weighted at 0.4 to take into account seasonal differences.
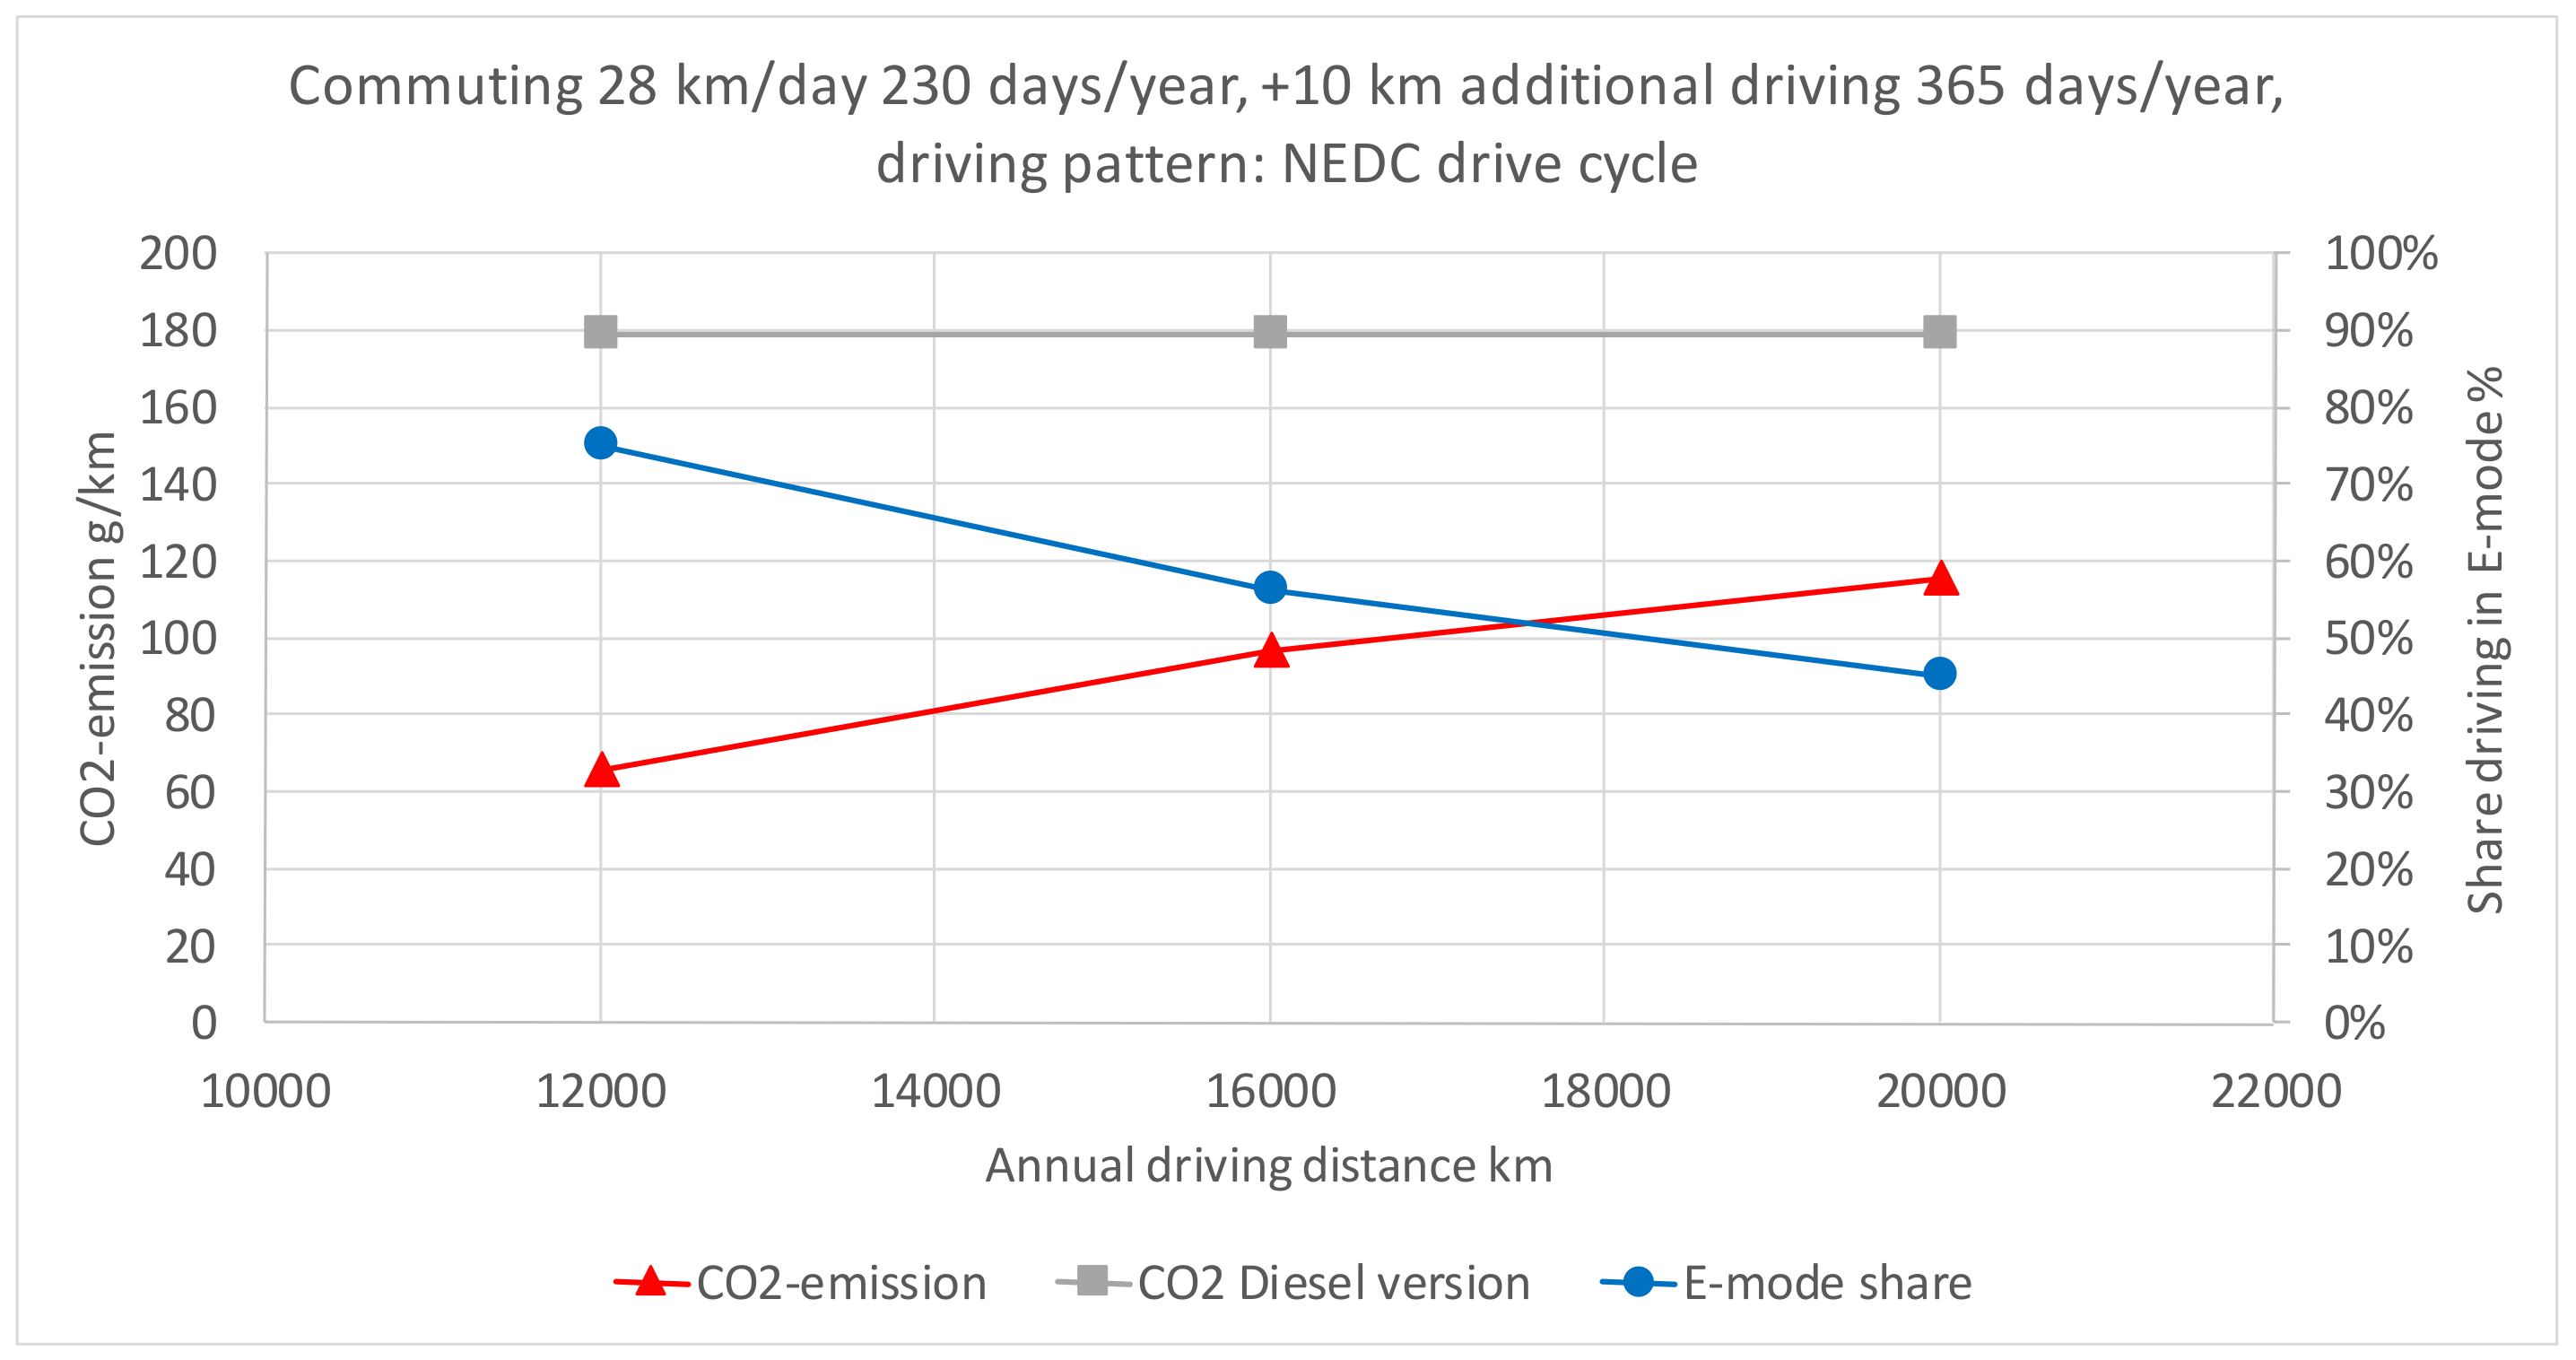
Figure 8.
Estimated share of owners below a calculated average yearly CO2-emission factor based on owners’ estimates of share of driving in E-mode summer and winter (Source: EMIROAD vehicle user survey March 2016, adapted from [2]). NEDC test results in E-mode used when calculating the emission for the estimated E-mode share of driving, and 0% SOC hybrid drive mode test results were used for all other driving. Results at +23 °C were weighted at 0.6 and results at −7 °C were weighted at 0.4 to take into account seasonal differences.

Figure 9.
Vehicle B: pure electric drive mode, energy consumption (Wh/km), and CO2-emission (black dots) in g/km at +23 °C and −7 °C, 100% SOC at start of test, Charge Depletion drive mode with semi-warm start (vehicle cooled down while charging after previous test). Comparison with official NEDC type approval values and CO2-emission (black hyphen) test results of a 1.6-L gasoline engine version of the vehicle. As the vehicle could do the tests in pure Electric Drive mode the emission reduction was 100%.

Figure 10.
Vehicle B: hybrid auto drive mode. Energy consumption (Wh/km) and CO2-emission (black dots) in g/km at +23 °C and −7 °C, 100% and 0% SOC at start of test. The vehicle selects by itself to drive in the Charge Depletion or Charge Sustain drive modes. Cold = Cold start, Warm = Warm or semi-warm start depending on previous test (See schedule in Appendix A). Comparison with official type approval values and CO2-emission (black hyphen) of 1.6 L gasoline version of the vehicle (g/km). PHEV CO2-reduction potential (percentage) over gasoline engine version.

Figure 11.
Vehicle B: CO2, NOX, and particulates mass and number emissions in g/km, mg/km, and n × 1011, respectively, per drive cycle at +23 °C and −7 °C, and 100% and 0% battery SOC, hybrid auto drive mode. The vehicle selects by itself to drive in the Charge Depletion or Charge Sustain drive modes. Cold = Cold start, Warm = Warm or semi-warm start depending on previous test (See schedule in Appendix A). Lines represents type approval values (CO2) and limit values. Orange line: CO2-emission type approval value, other gases, and particulates type approval limit. Grey line is particulates number limit from September 2017.

Figure 12.
Vehicle B: estimated CO2-emission and E-mode share over the year for driving pattern consisting of commuting to work 14 km each way 230 days/year + 10 km additional local driving/day and assuming long distance driving the rest of the trips. CO2-emission of comparable gasoline and diesel vehicles measured in the EMIROAD program. E-mode NEDC driving assumed whenever possible, i.e., for trip distances with E-mode range. The vehicle was assumed to switch to the 0% SOC NEDC hybrid mode when the battery was empty. Charging overnight assumed. Results at +23 °C were weighted at 0.6 and results at −7 °C were weighted at 0.4 to take into account seasonal differences.
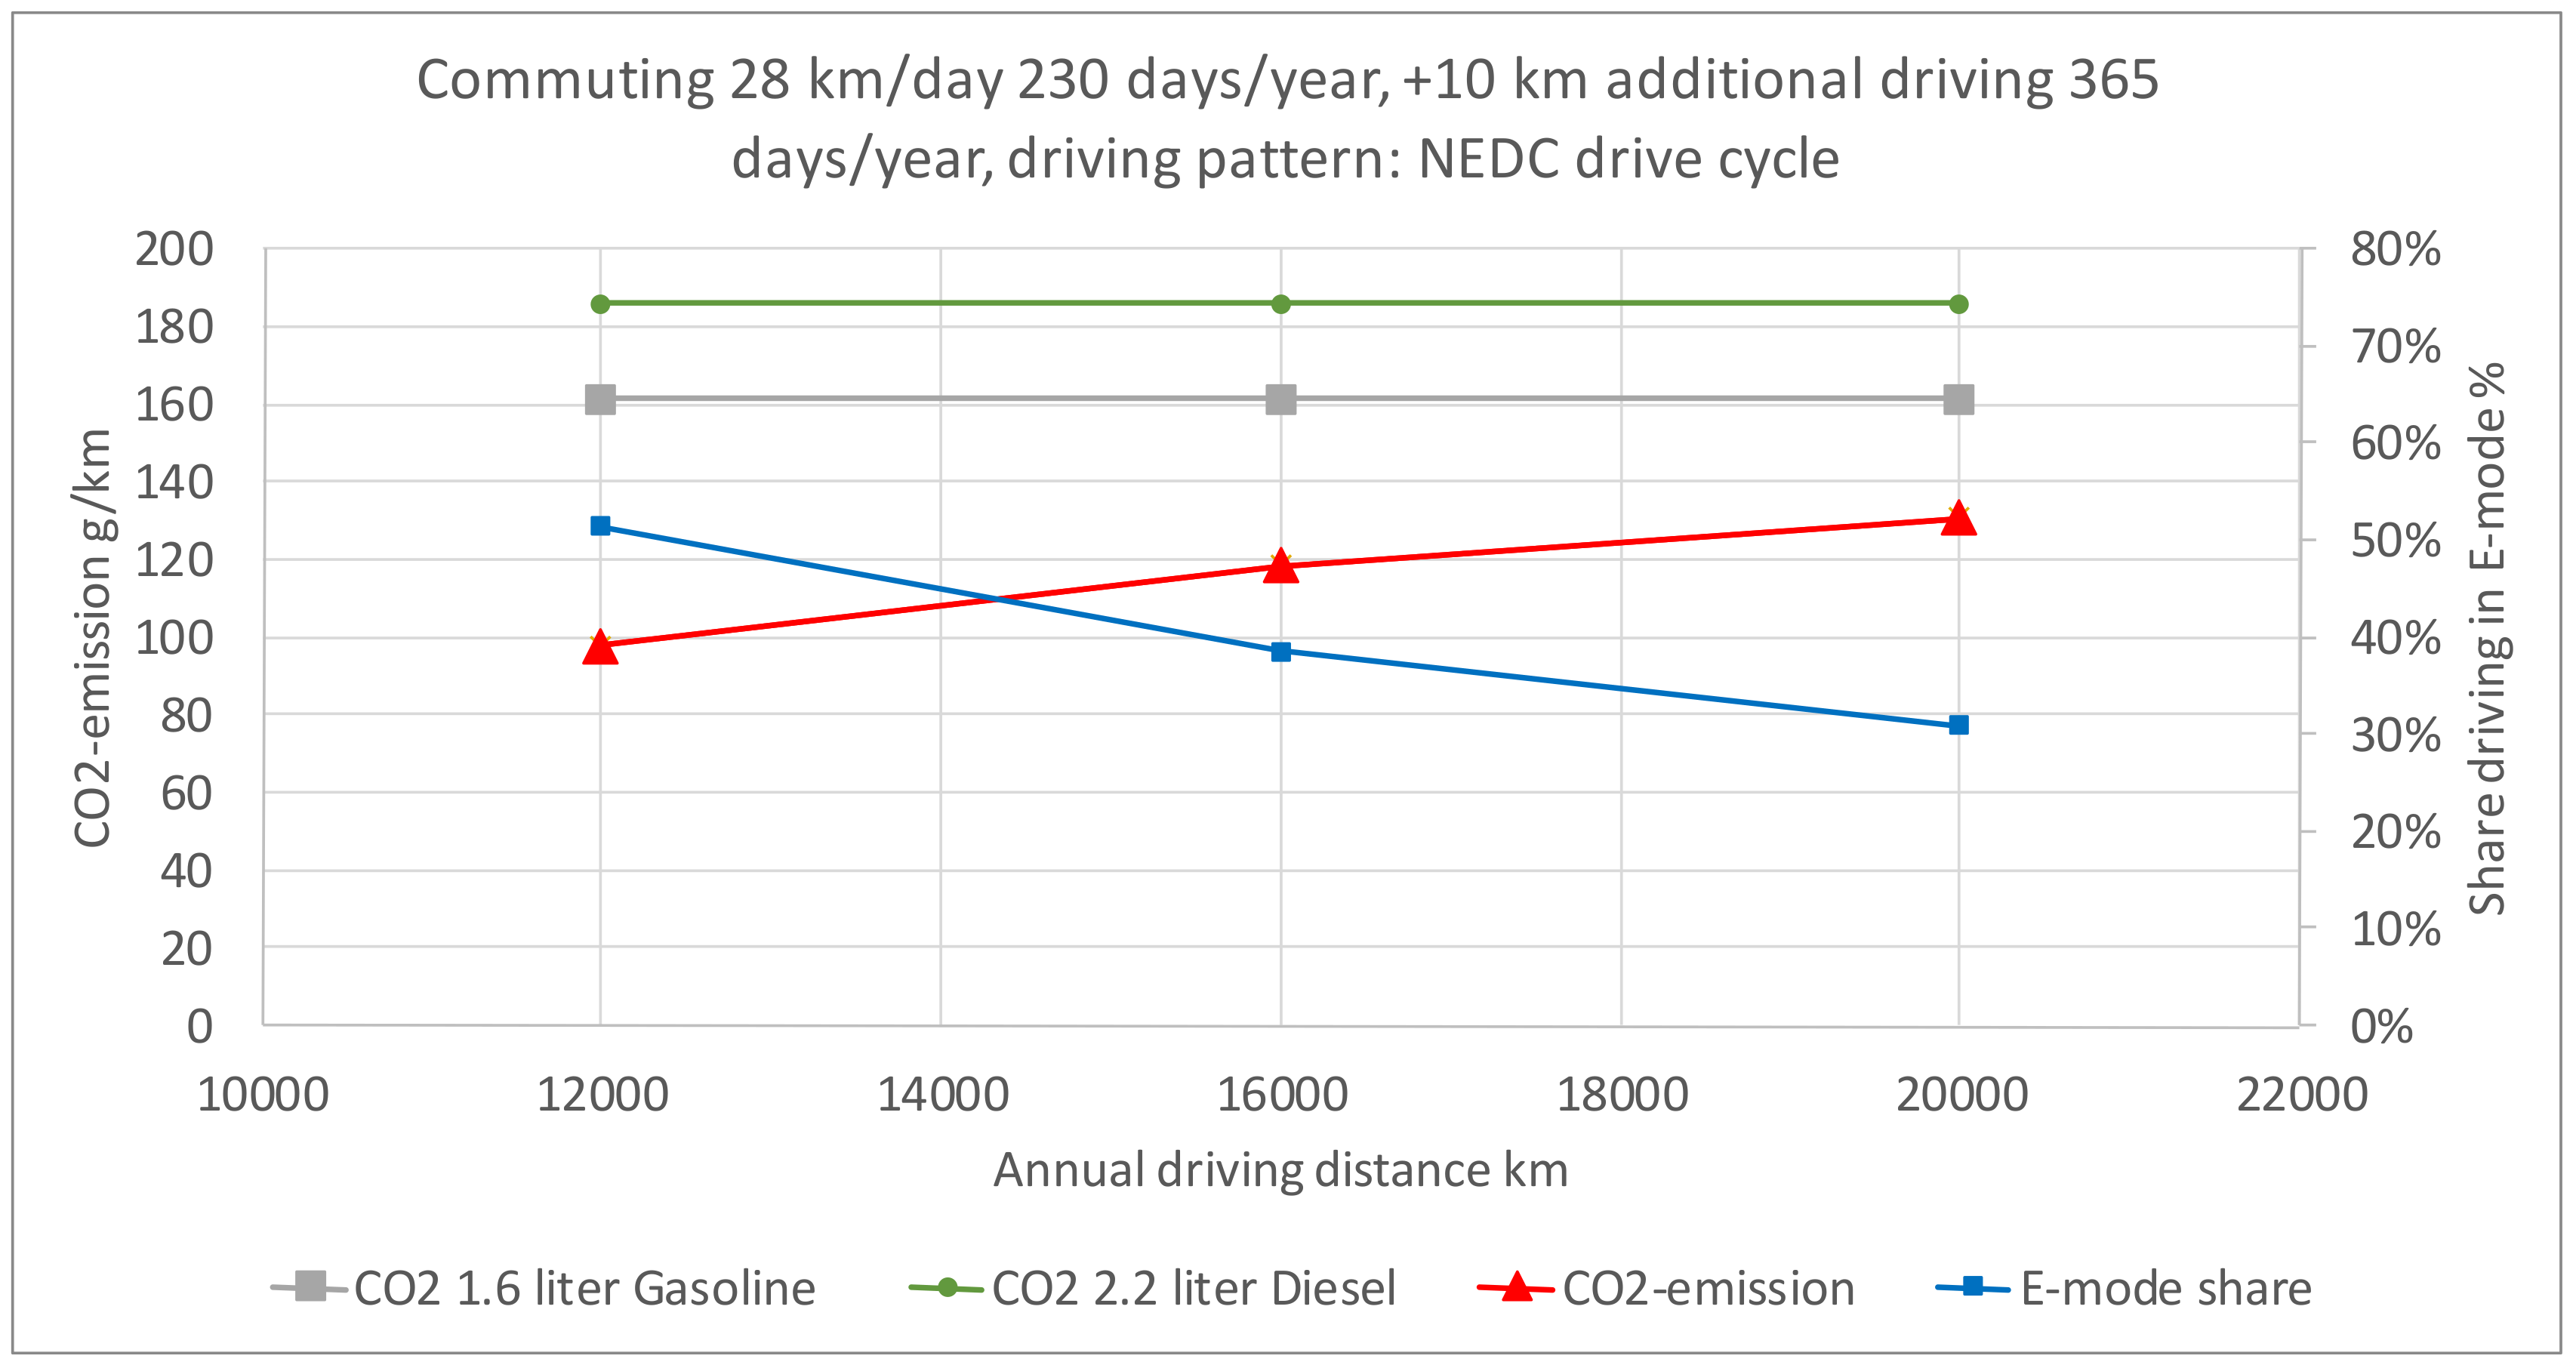
Table 1.
Tested vehicles’ characteristics. Data collected by authors, mainly manufacturers official data. E-mode = electric drive-mode.
Table 1.
Tested vehicles’ characteristics. Data collected by authors, mainly manufacturers official data. E-mode = electric drive-mode.
| Vehicle A | Vehicle B | |
|---|---|---|
| Type of powertrain | Parallel | Parallel |
| E-mode range (NEDC) type approval | 50 km | 31 km |
| CO2-emission | 37 g/km | 48 g/km |
| NOX-emission | 8.9 mg/km | 9 mg/km |
| Fuel | Gasoline | Gasoline |
| Fuel consumption | 1.6 L/100 km | 2.1 L/100 km |
| Calculated fuel energy | 14.5 kWh/100 km | 18.8 kWh/100 km |
| Electricity consumption | 11.4 kWh/100 km | 11.0 kWh/100 km |
| Battery capacity | 8.7 kWh | 6.4 kWh |
| Charge time, 3.6 kW | 2 h 15 min | 1 h 45 min |
| Acceleration 0–100 km/h | 7.6 s | 5.9 s |
| Vehicle segment | Compact | Midsized (Norwegian) |
| Model year | 2015 | 2016 |
| Emission regulation | Euro 6 | Euro 6 |
| User-selectable drive modes | E-mode (most electric mode) | Pure E-mode (100% electric) |
| Battery hold (maintain battery charge) | Battery hold (maintain battery charge) | |
| Battery charge (recharge battery) | Battery charge (recharge battery) | |
| Hybrid auto (most efficient hybrid mode) | Hybrid auto (most efficient hybrid mode) | |
| Hybrid sport (maximize power) | Hybrid sport (maximize power) |
Table 2.
Internal Combustion Engine Vehicles’ (ICEVs’) emissions that have been tested in the EMIROAD (emissions from road transport vehicles) project and are used for comparison of emissions for Vehicles A and B. PHEV = plug-in hybrid vehicle.
Table 2.
Internal Combustion Engine Vehicles’ (ICEVs’) emissions that have been tested in the EMIROAD (emissions from road transport vehicles) project and are used for comparison of emissions for Vehicles A and B. PHEV = plug-in hybrid vehicle.
| ICEV Used for Comparison with Vehicle A | ICEVs Used for Comparison with Vehicle B | |
|---|---|---|
| Fuel | Diesel variant of vehicle A | Gasoline and diesel variants of vehicle B |
| Engine | 2 L, automated gear box | 1.6 L gasoline, 2.l L diesel engine with start/stop system |
| Year model, emission class | 2013 model, Euro 5 | 2014 year-models, Euro 6 compliant |
| Other considerations | Version with closest acceleration performance | Reduced performance compared to PHEV |
Table 3.
Key characteristics of the NEDC, Helsinki-city, and Artemis Urban test cycles.
| Length (m) | Duration (s) | Average Speed (km/h) | Maximum Speed (km/h) | Percentage Stops (%) | |
|---|---|---|---|---|---|
| NEDC | 10931 | 1180 | 33 | 120 | 23 |
| Helsinki-city | 7807 | 1380 | 20 | 61 | 30 |
| Artemis Urban | 4470 | 920 | 18 | 58 | 29 |
Table 4.
Vehicle A test matrix. As/is tests ran directly after another test with electricity consumption measured as average over both tests.
Table 4.
Vehicle A test matrix. As/is tests ran directly after another test with electricity consumption measured as average over both tests.
| +23 °C | −7 °C | |||||
|---|---|---|---|---|---|---|
| Drive Cycle | Drive Mode | SOC | Cold Start | Warm Start | Cold Start | Warm Start |
| NEDC | Electric | 100% | 1 test | 2 tests | ||
| Hybrid auto | 100% | 2 tests | 2 tests | |||
| Hybrid auto | As/is | 2 tests | 2 tests | |||
| Hybrid auto | 0% | 2 tests | 2 tests | 2 tests | 2 tests | |
| Battery charge | 0% | 1 test | ||||
| Artemis Urban | Electric | 100% | 1 test | 1 test | ||
| Hybrid Auto | 100% | 2 tests | 2 tests | |||
| Hybrid Auto | 0% | 2 tests | 2 tests | |||
| Battery hold | 100% | 1 tests | ||||
| Helsinki-city | Hybrid auto | 100% | 2 tests | 2 tests | ||
Table 5.
Vehicle B test matrix.
| +23 °C | −7 °C | |||||
|---|---|---|---|---|---|---|
| Drive Cycle | Drive Mode | SOC | Cold Start | Warm Start | Cold Start | Warm Start |
| NEDC | Electric | 100% | 1 test | 1 test | ||
| Hybrid auto | 100% | 2 tests | 2 tests | |||
| Hybrid auto | 0% | 2 tests | 2 tests | |||
| Artemis Urban | Electric | 100% | 1 test | |||
| Hybrid Auto | 100% | 2 tests | 2 tests | |||
| Hybrid Auto | 0% | 2 tests | 2 tests | |||
| Helsinki-city | Hybrid auto | 100% | 2 tests | 2 tests | ||
© 2018 by the authors. Licensee MDPI, Basel, Switzerland. This article is an open access article distributed under the terms and conditions of the Creative Commons Attribution (CC BY) license (http://creativecommons.org/licenses/by/4.0/).
Share and Cite
MDPI and ACS Style
Figenbaum, E.; Weber, C. Estimating Real-World Emissions of PHEVs in Norway by Combining Laboratory Measurement with User Surveys. World Electr. Veh. J. 2018, 9, 31. https://doi.org/10.3390/wevj9020031
AMA Style
Figenbaum E, Weber C. Estimating Real-World Emissions of PHEVs in Norway by Combining Laboratory Measurement with User Surveys. World Electric Vehicle Journal. 2018; 9(2):31. https://doi.org/10.3390/wevj9020031
Chicago/Turabian StyleFigenbaum, Erik, and Christian Weber. 2018. "Estimating Real-World Emissions of PHEVs in Norway by Combining Laboratory Measurement with User Surveys" World Electric Vehicle Journal 9, no. 2: 31. https://doi.org/10.3390/wevj9020031