Prior Puma Lentivirus Infection Modifies Early Immune Responses and Attenuates Feline Immunodeficiency Virus Infection in Cats

 and
and
Abstract
:1. Introduction
2. Materials and Methods
2.1. Viral Stocks
2.2. Animals
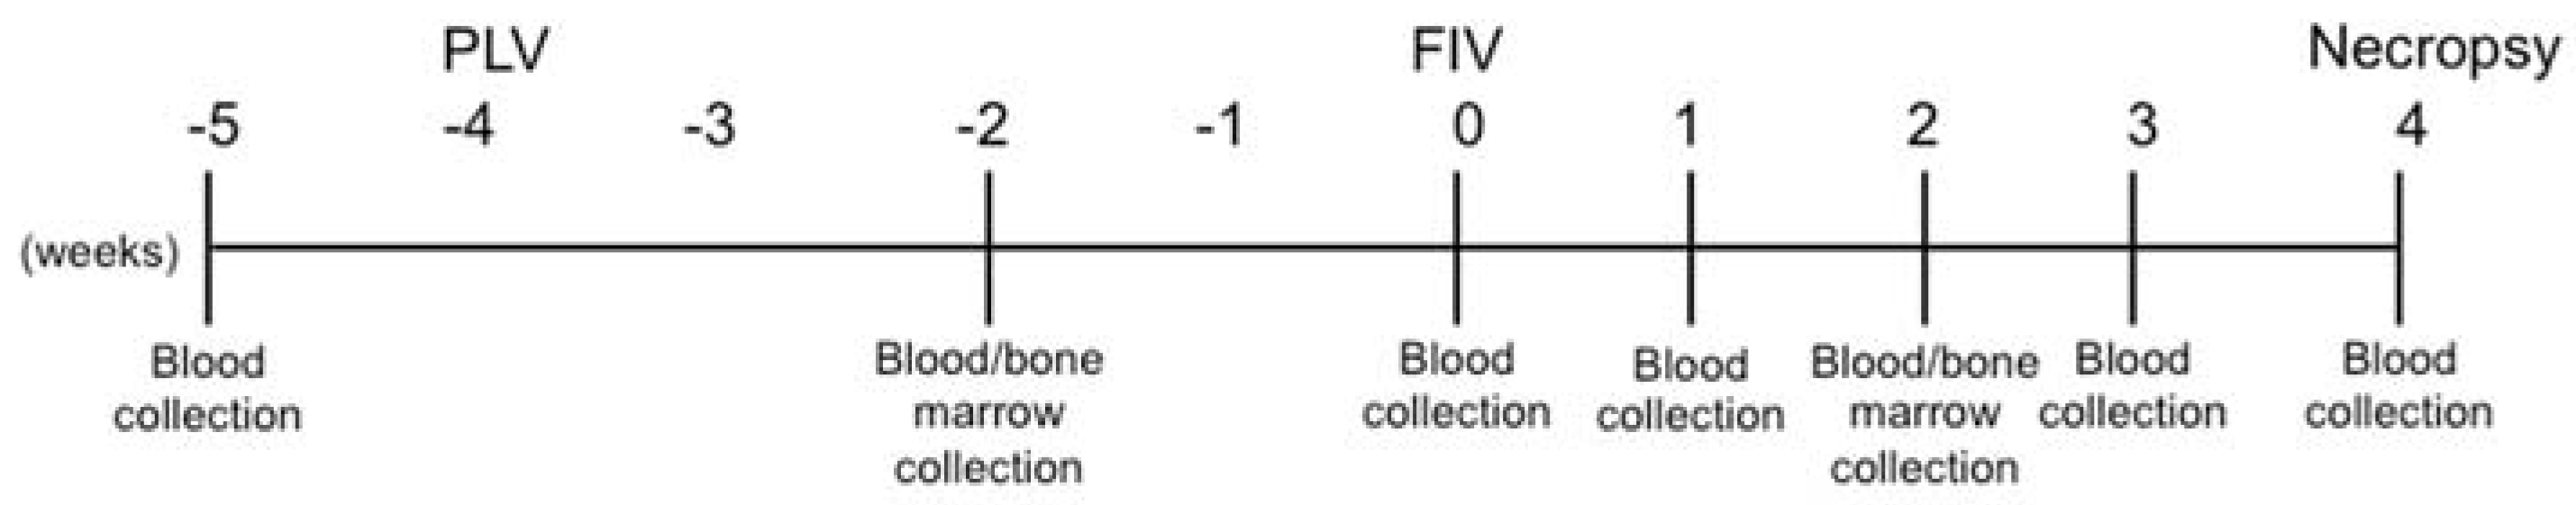
2.3. Study Design
2.4. Physical Examinations
2.5. Cell Isolation
2.6. Hematology
2.7. Flow Cytometry
2.8. Genomic DNA Extraction
2.9. RNA Extraction & cDNA Synthesis
2.10. Quantitation of Proviral Load, mRNA Viral Load, & Cytokine Transcripts by Real-Time qPCR
2.11. Statistical Analyses
3. Results
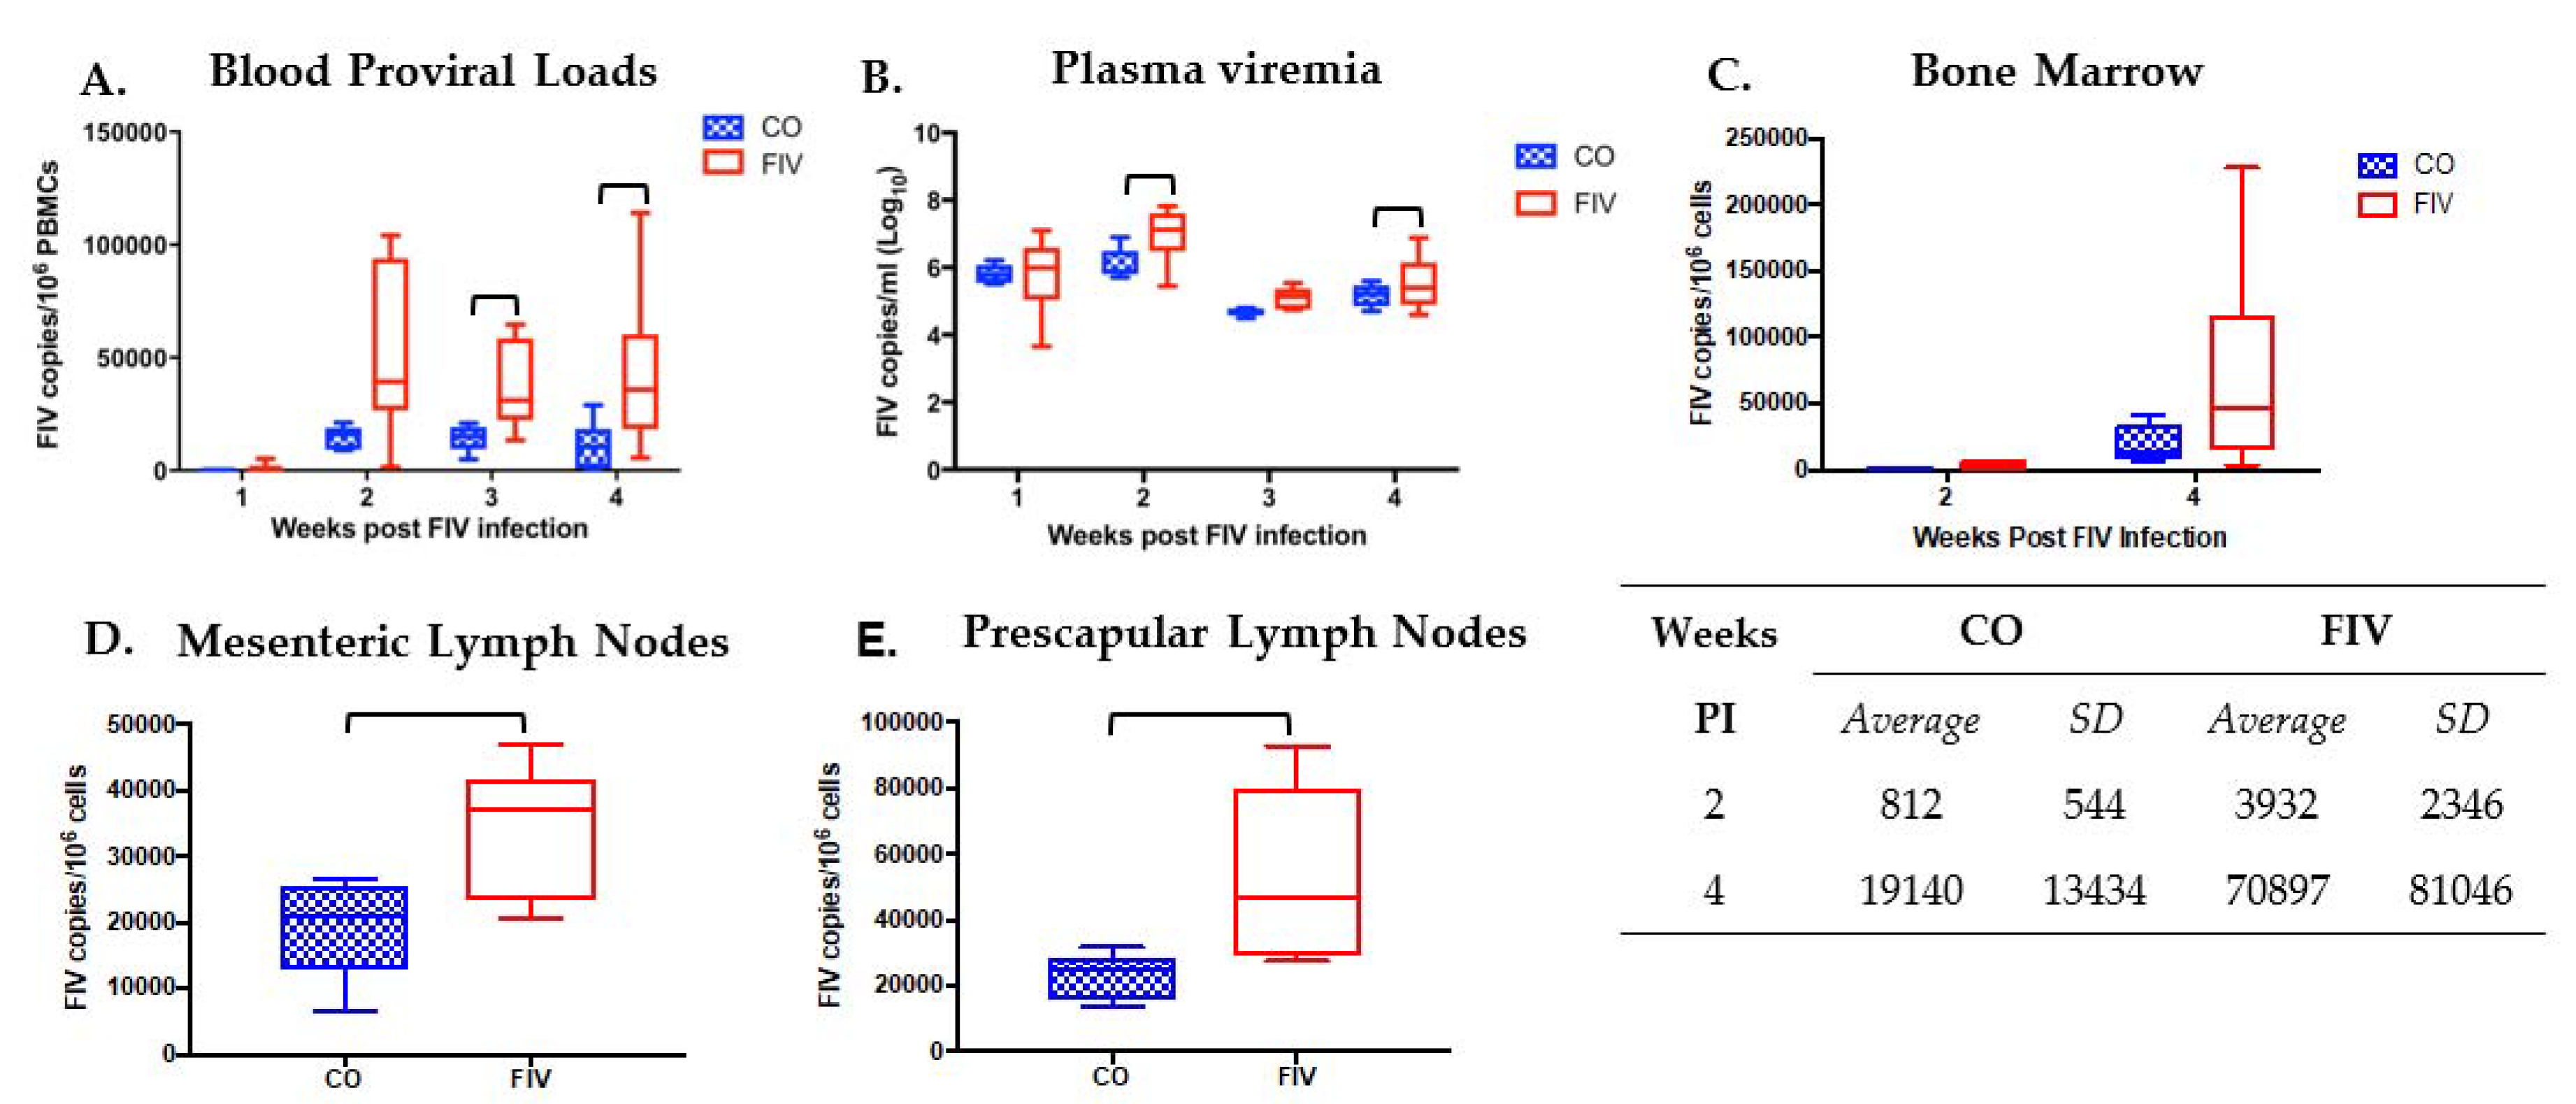
3.1. Prior PLV Infection Results in Lower FIV Proviral Loads in PBMC, Bone Marrow, and LNs, and Decreased Plasma Viremia
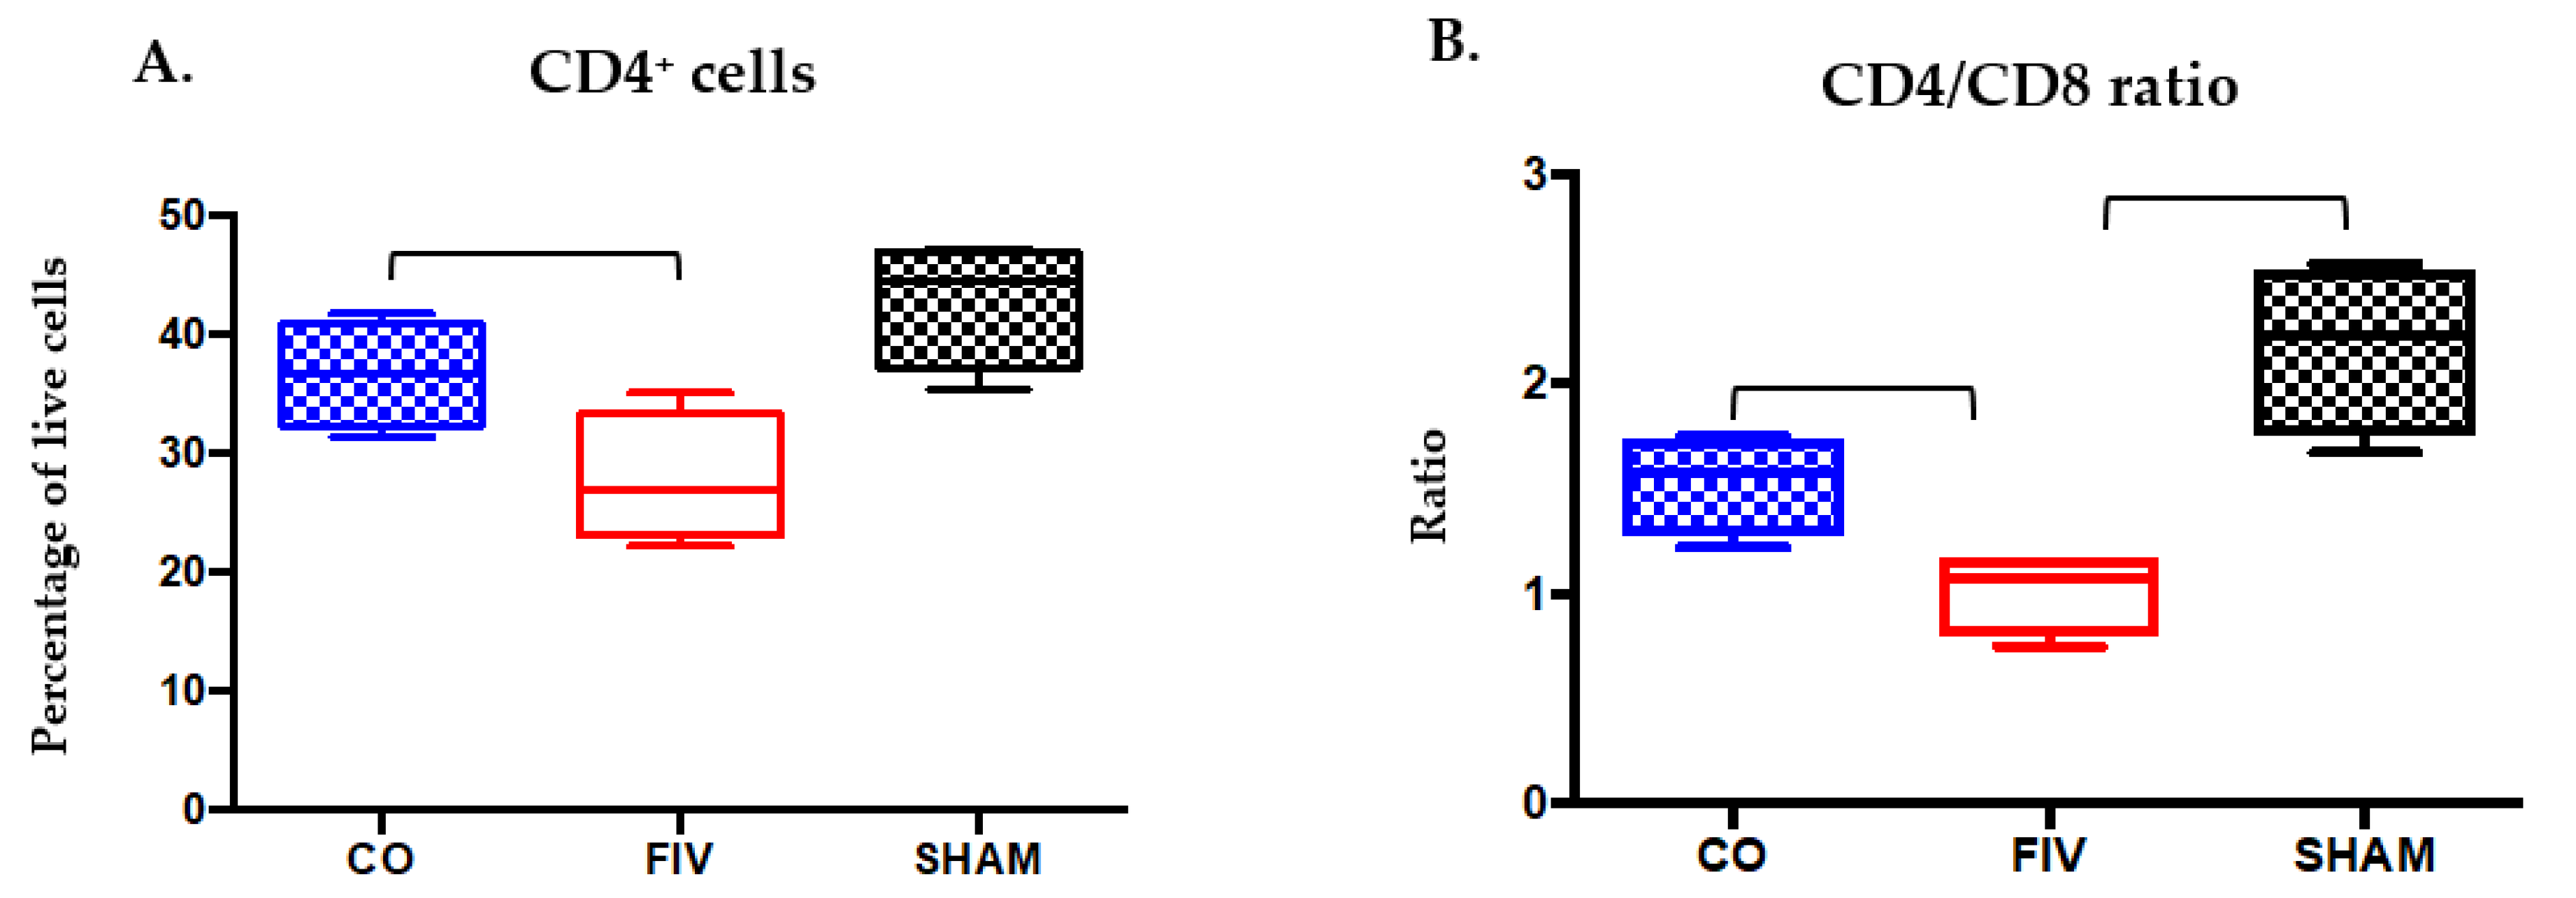
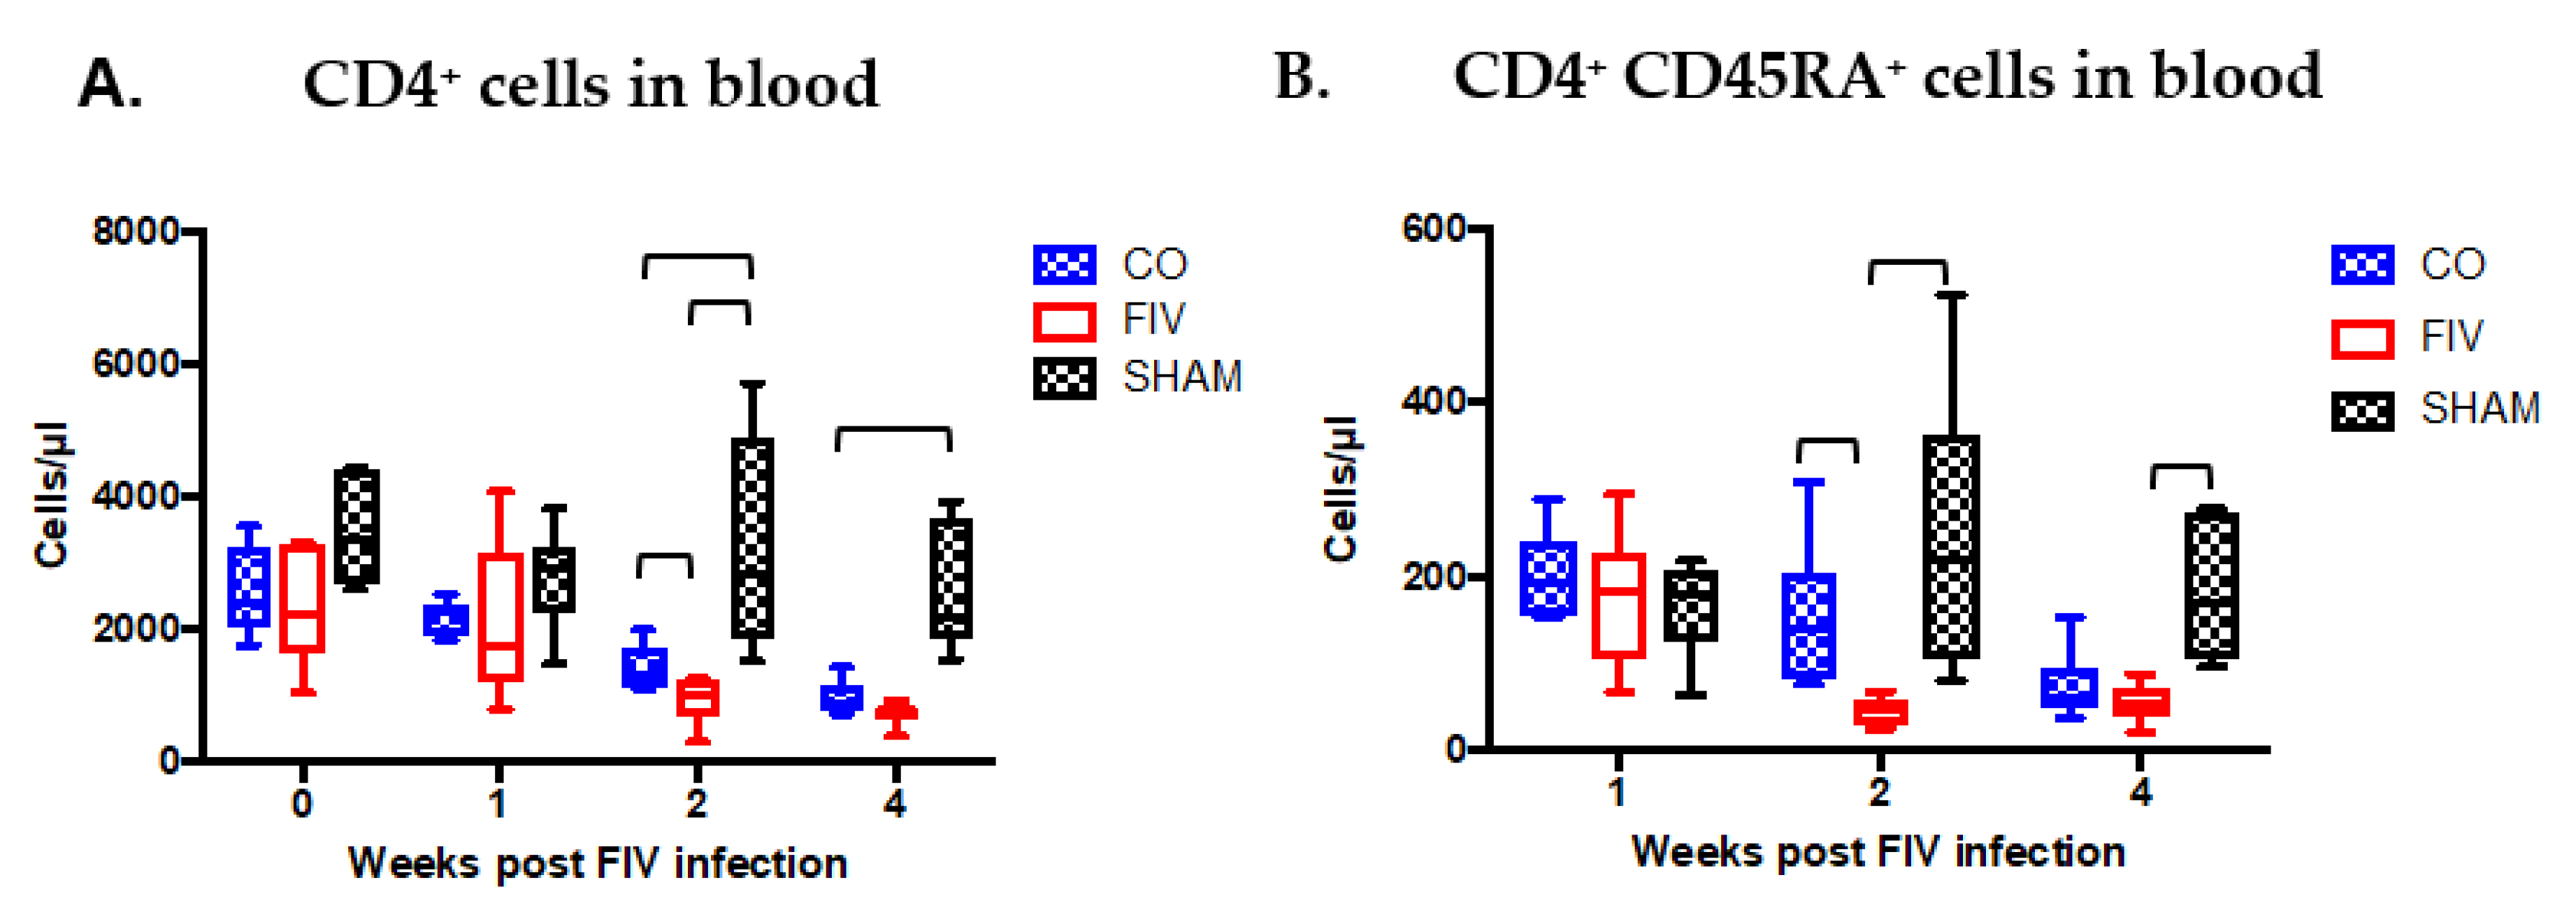
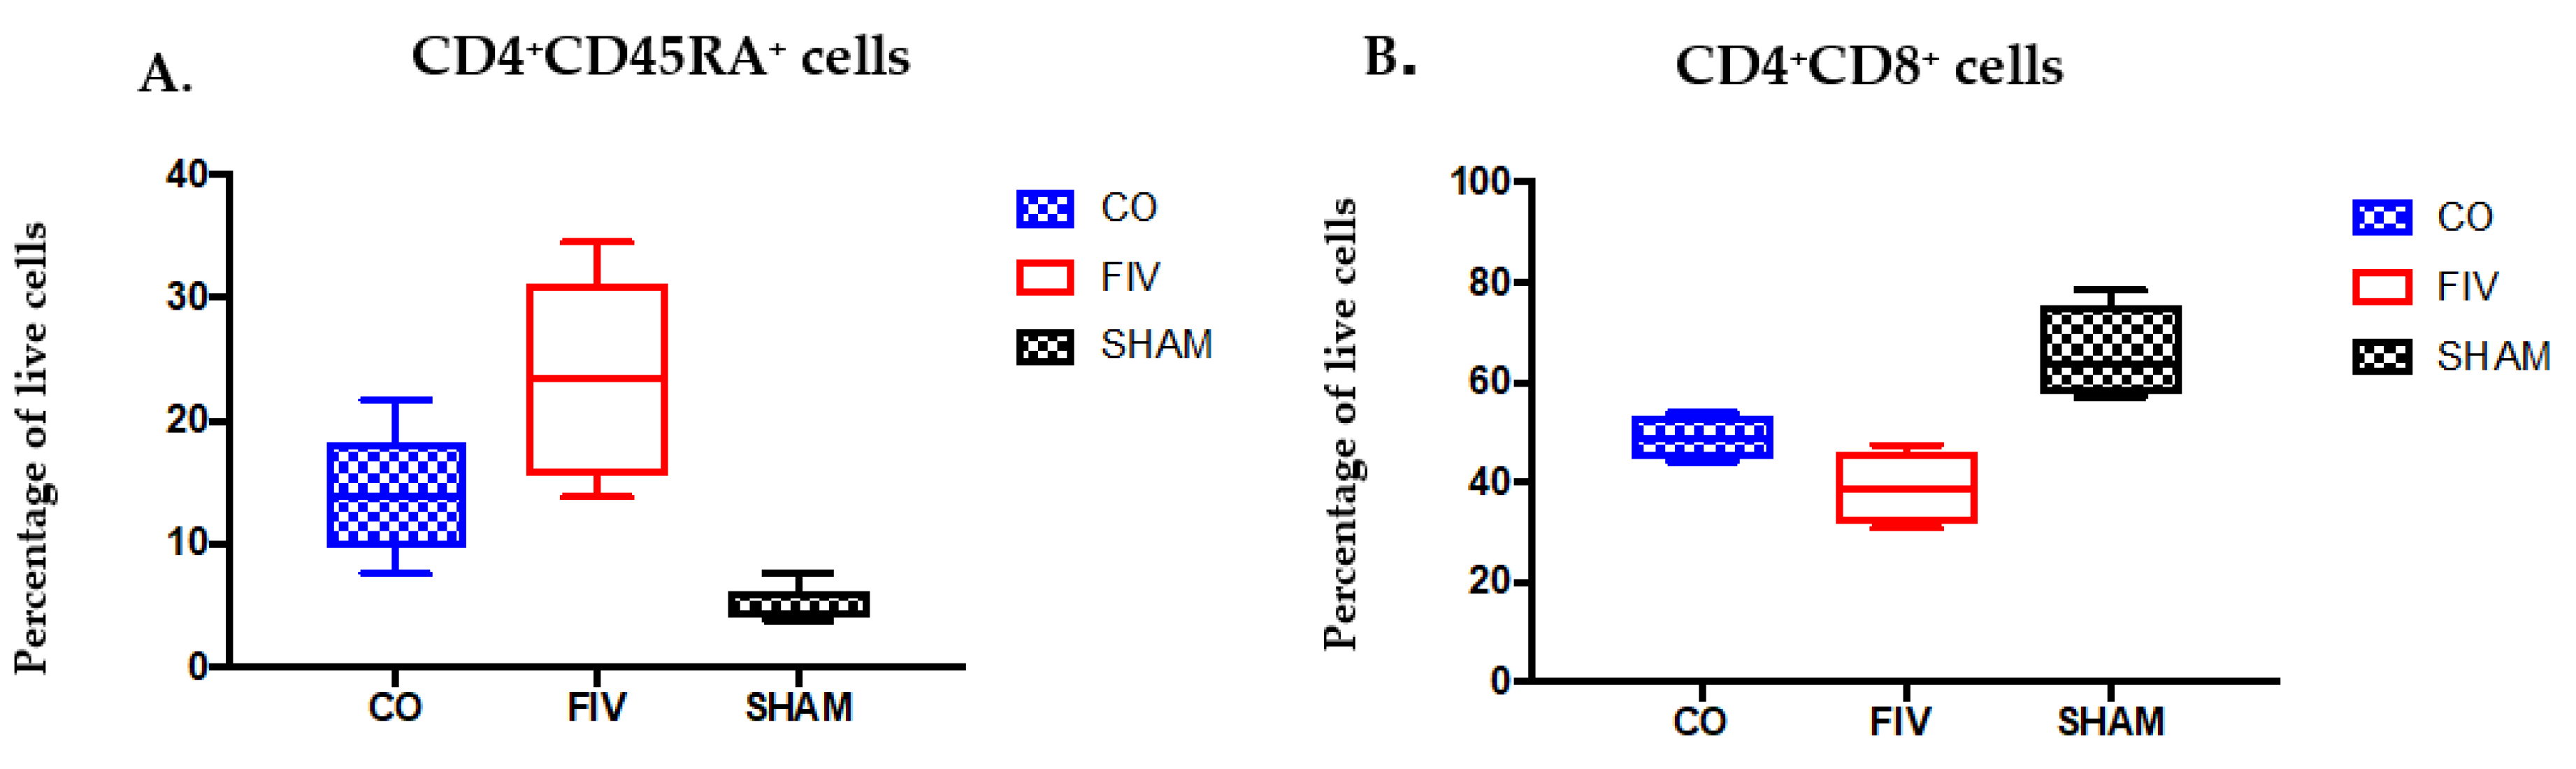
3.2. Global and Naïve CD4+ T Cells are Preserved by Co-Infection Compared to FIV Infection
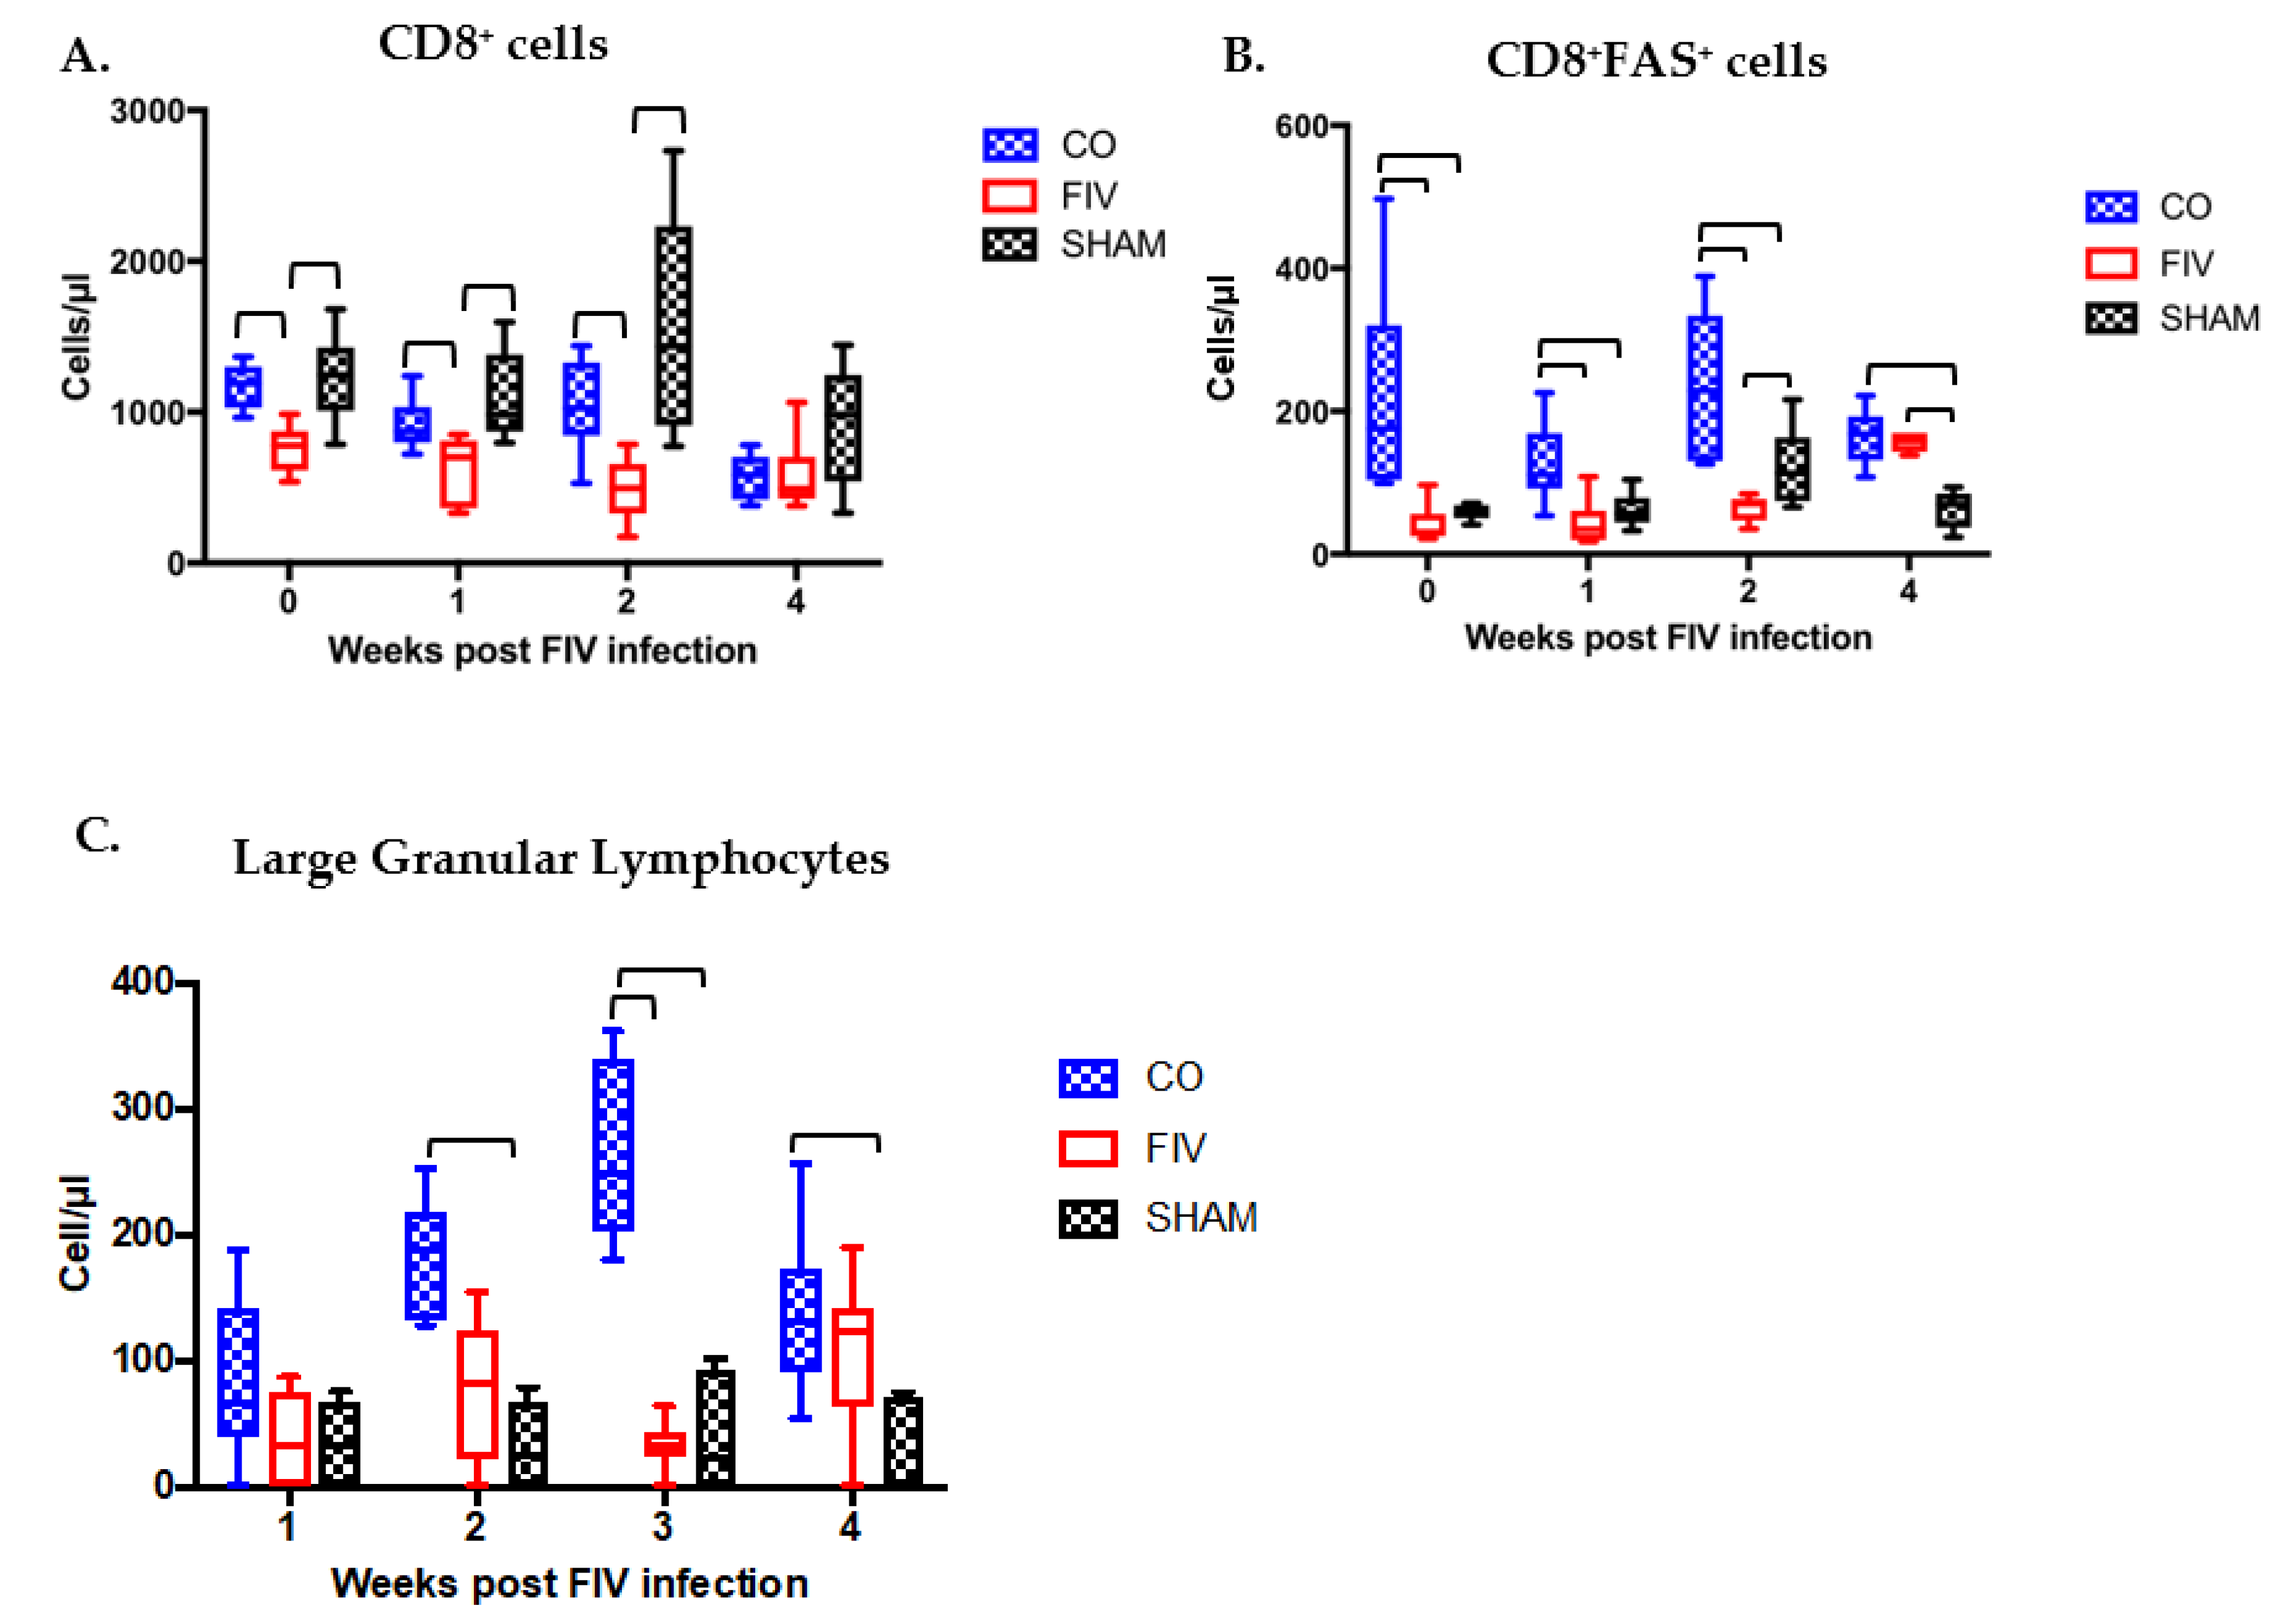
3.3. Prior PLV Infection Resulted in Greater CD8+ Cell, CD8+FAS+ cell, and large granular lymphocytes Numbers During Early FIV Infection Compared With SHAM Animals
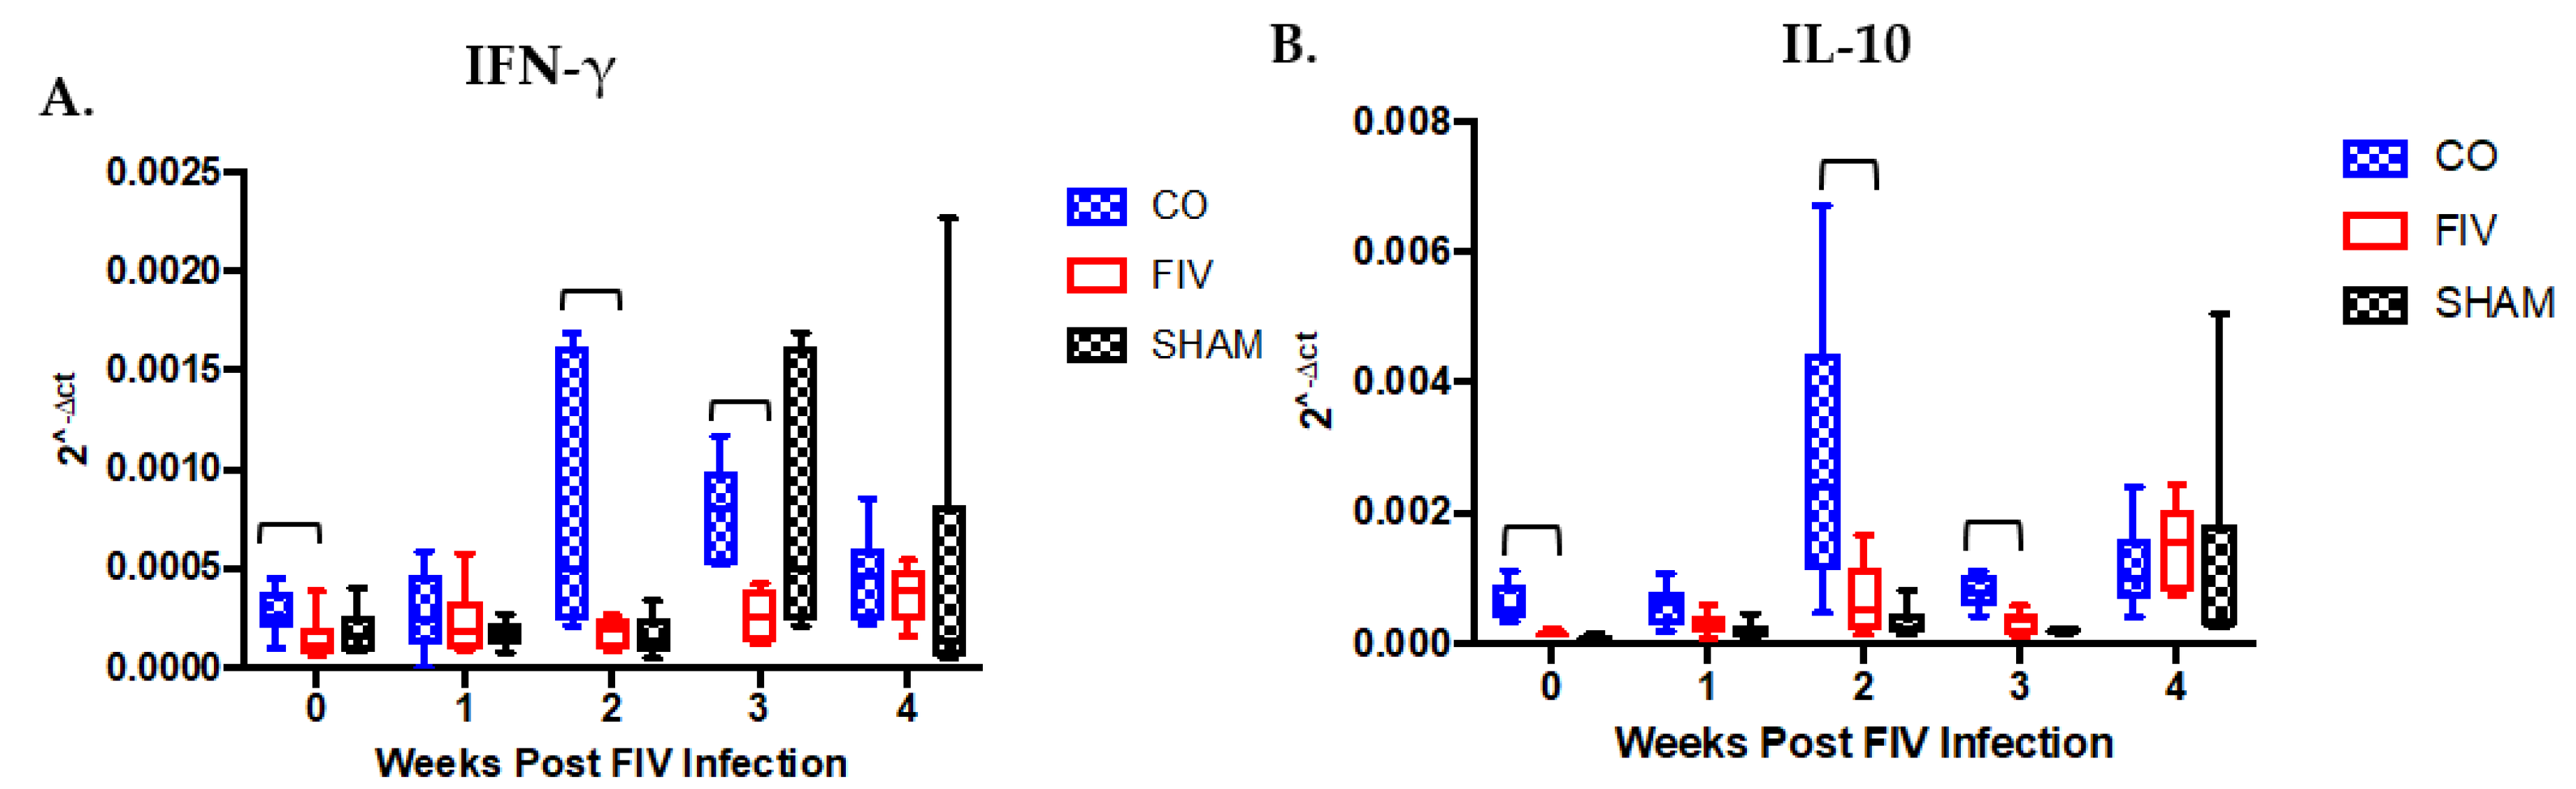
3.4. Cytokine Differences in PBMC Between Co-Infected and FIV-Infected Cats FIV PI
3.5. Tissue Lymphocyte Phenotypes Differ Between Co-Infected and FIV-Infected Cats
3.5.1. Thymus
3.5.2. Prescapular Lymph Node
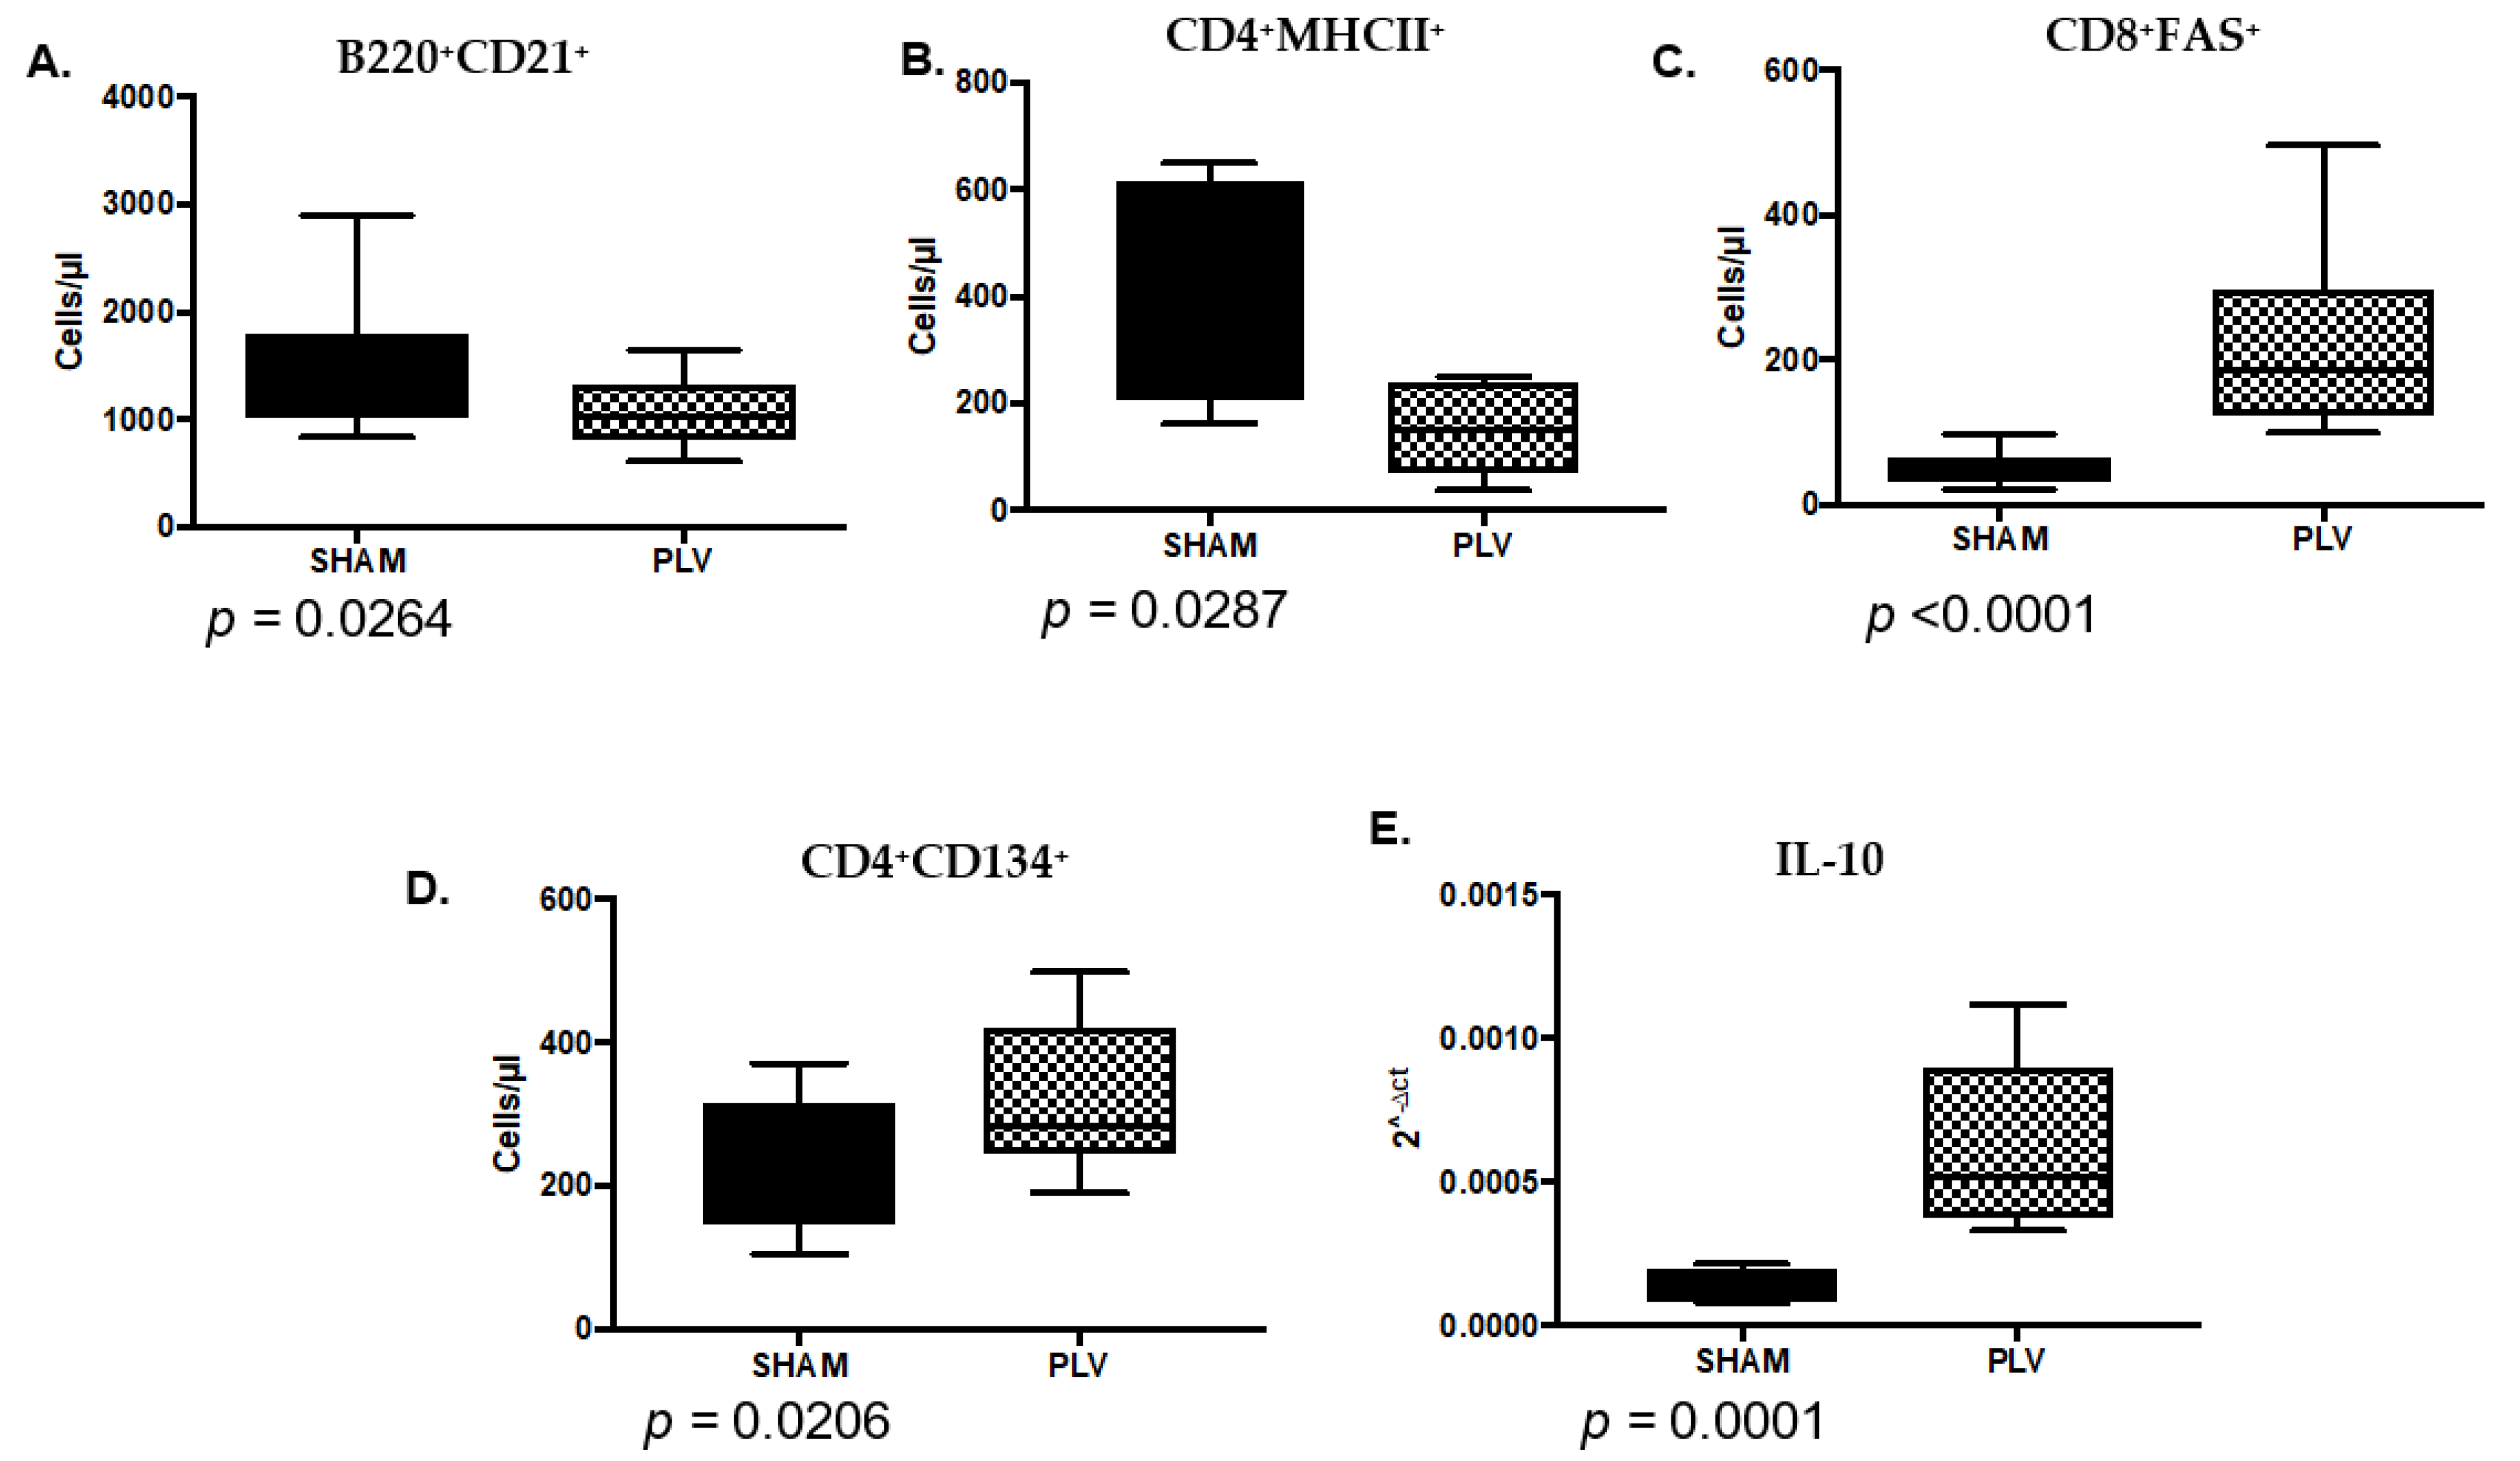
3.6. PLV Infection Alters the Immune Landscape at the Time of FIV Inoculation
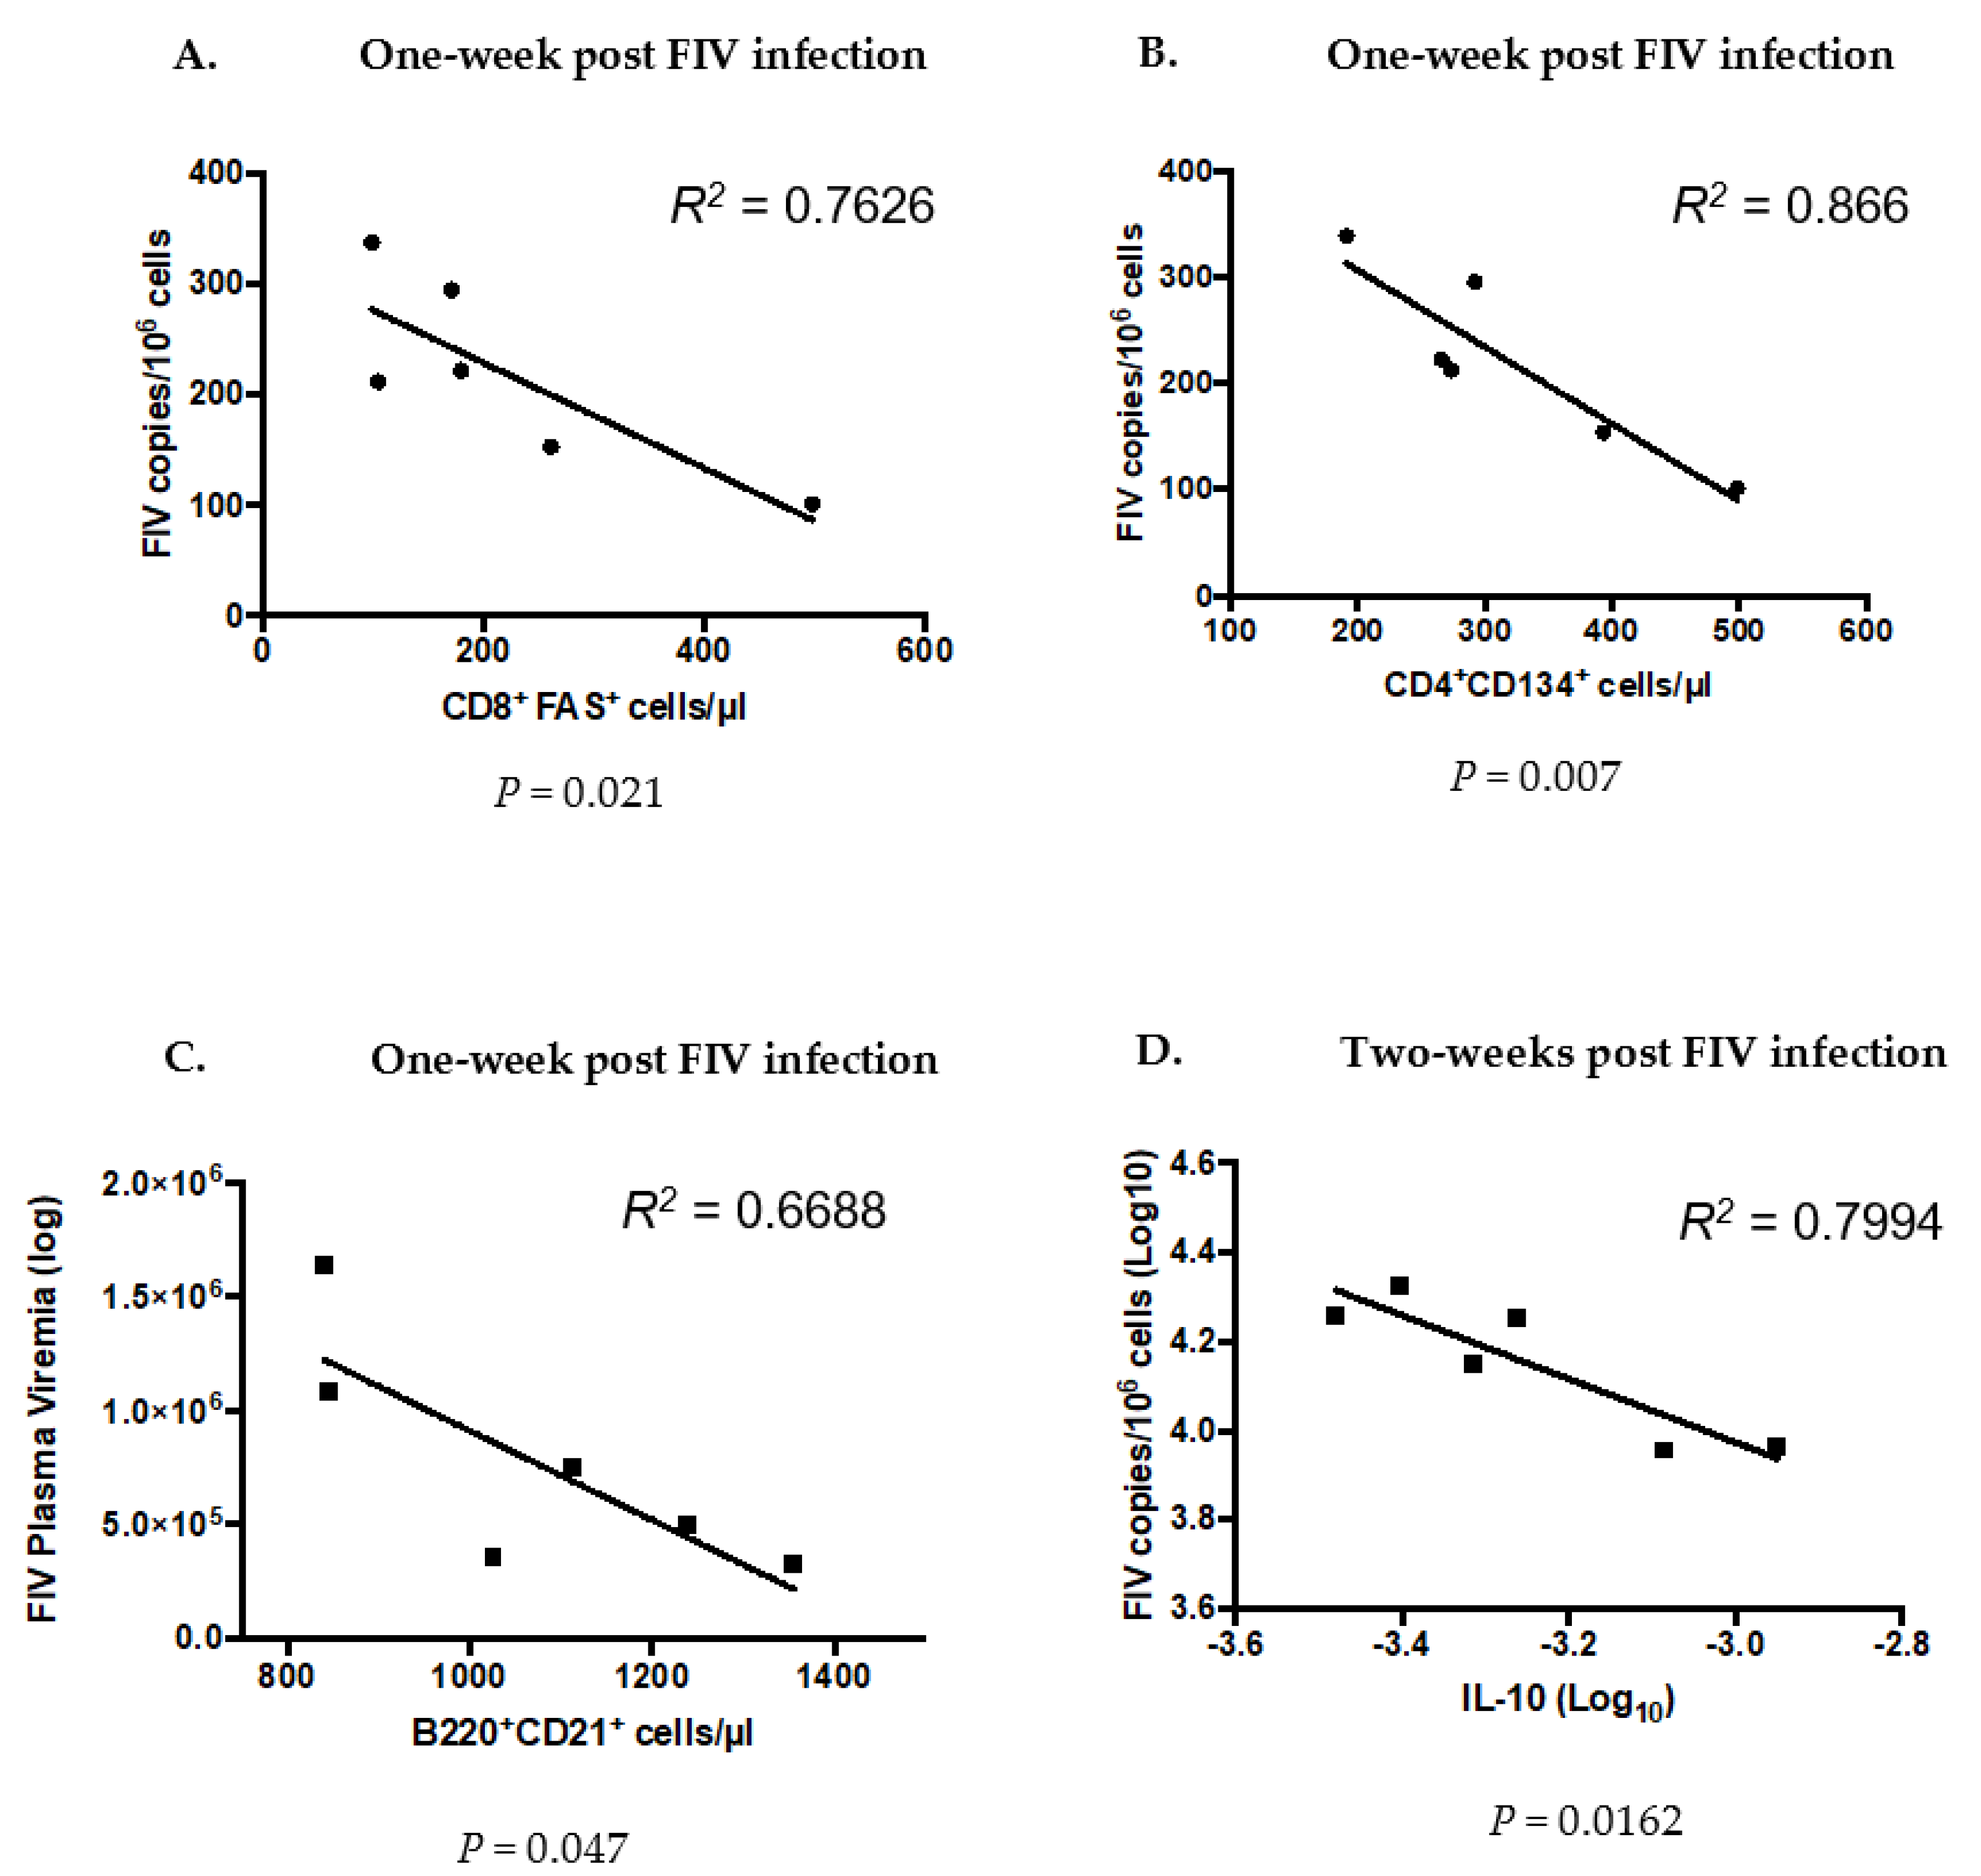
3.7. Significant Differences Between Co- and FIV-Infected Cats at the Time of FIV Exposure Predict Future Outcomes of FIV Infection
4. Discussion
Supplementary Materials
Acknowledgments
Author Contributions
Conflicts of Interest
References
- Novotney, C.; English, R.V.; Housman, J.; Davidson, M.G.; Nasisse, M.P.; Jeng, C.R.; Davis, W.C.; Tompkins, M.B. Lymphocyte population changes in cats naturally infected with feline immunodeficiency virus. AIDS 1990, 4, 1213–1218. [Google Scholar] [CrossRef] [PubMed]
- Walker, C.; Canfield, P.J.; Love, D.N. Analysis of leucocytes and lymphocyte subsets for different clinical stages of naturally acquired feline immunodeficiency virus infection. Vet. Immunol. Immunopathol. 1994, 44, 1–12. [Google Scholar] [CrossRef]
- Lee, J.S.; Bevins, S.N.; Serieys, L.E.; Vickers, W.; Logan, K.A.; Aldredge, M.; Boydston, E.E.; Lyren, L.M.; McBride, R.; Roelke-Parker, M.; et al. Evolution of puma lentivirus in bobcats (Lynx rufus) and mountain lions (Puma concolor) in north america. J. Virol. 2014, 88, 7727–7737. [Google Scholar] [CrossRef] [PubMed]
- VandeWoude, S.; Apetrei, C. Going wild: Lessons from naturally occurring T-lymphotropic lentiviruses. Clin. Microbiol. Rev. 2006, 19, 728–762. [Google Scholar] [CrossRef] [PubMed]
- Terwee, J.A.; Yactor, J.K.; Sondgeroth, K.S.; Vandewoude, S. Puma lentivirus is controlled in domestic cats after mucosal exposure in the absence of conventional indicators of immunity. J. Virol. 2005, 79, 2797–2806. [Google Scholar] [CrossRef] [PubMed]
- VandeWoude, S.; Hageman, C.L.; Hoover, E.A. Domestic cats infected with lion or puma lentivirus develop anti-feline immunodeficiency virus immune responses. J. Acquir. Immune Defic. Syndr. 2003, 34, 20–31. [Google Scholar] [CrossRef] [PubMed]
- Terwee, J.A.; Carlson, J.K.; Sprague, W.S.; Sondgeroth, K.S.; Shropshire, S.B.; Troyer, J.L.; VandeWoude, S. Prevention of immunodeficiency virus induced CD4+ T-cell depletion by prior infection with a non-pathogenic virus. Virology 2008, 377, 63–70. [Google Scholar] [CrossRef] [PubMed]
- Zheng, X.; Carver, S.; Troyer, R.M.; Terwee, J.A.; VandeWoude, S. Prior virus exposure alters the long-term landscape of viral replication during feline lentiviral infection. Viruses 2011, 3, 1891–1908. [Google Scholar] [CrossRef] [PubMed]
- Wood, B.A.; Carver, S.; Troyer, R.M.; Elder, J.H.; VandeWoude, S. Domestic cat microsphere immunoassays: Detection of antibodies during feline immunodeficiency virus infection. J. Immunol. Methods 2013, 396, 74–86. [Google Scholar] [CrossRef] [PubMed]
- Roy, S.; Lavine, J.; Chiaromonte, F.; Terwee, J.; VandeWoude, S.; Bjornstad, O.; Poss, M. Multivariate statistical analyses demonstrate unique host immune responses to single and dual lentiviral infection. PLoS ONE 2009, 4, e7359. [Google Scholar] [CrossRef] [PubMed]
- Padhi, A.; Ross, H.; Terwee, J.; Vandewoude, S.; Poss, M. Profound differences in virus population genetics correspond to protection from cd4 decline resulting from feline lentivirus coinfection. Viruses 2010, 2, 2663–2680. [Google Scholar] [CrossRef] [PubMed]
- Liu, Y.; Chiaromonte, F.; Ross, H.; Malhotra, R.; Elleder, D.; Poss, M. Error correction and statistical analyses for intra-host comparisons of feline immunodeficiency virus diversity from high-throughput sequencing data. BMC Bioinform. 2015, 16, 202. [Google Scholar] [CrossRef] [PubMed]
- Sondgeroth, K.; Leutenegger, C.; Vandewoude, S. Development and validation of puma (Felis concolor) cytokine and lentivirus real-time pcr detection systems. Vet. Immunol. Immunopathol. 2005, 104, 205–213. [Google Scholar] [CrossRef] [PubMed]
- Pedersen, N.C.; Leutenegger, C.M.; Woo, J.; Higgins, J. Virulence differences between two field isolates of feline immunodeficiency virus (FIV-APetaluma and FIV-CPGammar) in young adult specific pathogen free cats. Vet. Immunol. Immunopathol. 2001, 79, 53–67. [Google Scholar] [CrossRef]
- Ertl, R.; Birzele, F.; Hildebrandt, T.; Klein, D. Viral transcriptome analysis of feline immunodeficiency virus infected cells using second generation sequencing technology. Vet. Immunol. Immunopathol. 2011, 143, 314–324. [Google Scholar] [CrossRef] [PubMed]
- Shimojima, M.; Miyazawa, T.; Ikeda, Y.; McMonagle, E.L.; Haining, H.; Akashi, H.; Takeuchi, Y.; Hosie, M.J.; Willett, B.J. Use of CD134 as a primary receptor by the feline immunodeficiency virus. Science 2004, 303, 1192–1195. [Google Scholar] [CrossRef] [PubMed]
- Schnittman, S.M.; Psallidopoulos, M.C.; Lane, H.C.; Thompson, L.; Baseler, M.; Massari, F.; Fox, C.H.; Salzman, N.P.; Fauci, A.S. The reservoir for HIV-1 in human peripheral blood is a T cell that maintains expression of CD4. Science 1989, 245, 305–308. [Google Scholar] [CrossRef] [PubMed]
- Huddleston, C.A.; Weinberg, A.D.; Parker, D.C. OX40 (CD134) engagement drives differentiation of CD4+ T cells to effector cells. Eur. J. Immunol. 2006, 36, 1093–1103. [Google Scholar] [CrossRef] [PubMed]
- Dean, G.A.; Reubel, G.H.; Moore, P.F.; Pedersen, N.C. Proviral burden and infection kinetics of feline immunodeficiency virus in lymphocyte subsets of blood and lymph node. J. Virol. 1996, 70, 5165–5169. [Google Scholar] [PubMed]
- Carreno, A.D.; Mergia, A.; Novak, J.; Gengozian, N.; Johnson, C.M. Loss of naive (CD45RA+) CD4+ lymphocytes during pediatric infection with feline immunodeficiency virus. Vet. Immunol. Immunopathol. 2008, 121, 161–168. [Google Scholar] [CrossRef] [PubMed]
- Blaak, H.; van’t Wout, A.B.; Brouwer, M.; Hooibrink, B.; Hovenkamp, E.; Schuitemaker, H. In vivo HIV-1 infection of CD45RA(+)CD4(+) T cells is established primarily by syncytium-inducing variants and correlates with the rate of CD4(+) T cell decline. Proc. Natl. Acad. Sci. USA 2000, 97, 1269–1274. [Google Scholar] [CrossRef] [PubMed]
- Den Braber, I.; Mugwagwa, T.; Vrisekoop, N.; Westera, L.; Mogling, R.; de Boer, A.B.; Willems, N.; Schrijver, E.H.; Spierenburg, G.; Gaiser, K.; et al. Maintenance of peripheral naive T cells is sustained by thymus output in mice but not humans. Immunity 2012, 36, 288–297. [Google Scholar] [CrossRef] [PubMed]
- Miyake, A.; Ibuki, K.; Enose, Y.; Suzuki, H.; Horiuchi, R.; Motohara, M.; Saito, N.; Nakasone, T.; Honda, M.; Watanabe, T.; et al. Rapid dissemination of a pathogenic simian/human immunodeficiency virus to systemic organs and active replication in lymphoid tissues following intrarectal infection. J. Gen. Virol. 2006, 87, 1311–1320. [Google Scholar] [CrossRef] [PubMed]
- Sprague, W.S.; TerWee, J.A.; VandeWoude, S. Temporal association of large granular lymphocytosis, neutropenia, proviral load, and fasl mrna in cats with acute feline immunodeficiency virus infection. Vet. Immunol. Immunopathol. 2010, 134, 115–121. [Google Scholar] [CrossRef] [PubMed]
- Sprague, W.S.; Apetrei, C.; Avery, A.C.; Peskind, R.L.; Vandewoude, S. Large granular lymphocytes are universally increased in human, macaque, and feline lentiviral infection. Vet. Immunol. Immunopathol. 2015, 167, 110–121. [Google Scholar] [CrossRef] [PubMed]
- Killian, M.S.; Johnson, C.; Teque, F.; Fujimura, S.; Levy, J.A. Natural suppression of human immunodeficiency virus type 1 replication is mediated by transitional memory CD8+ T cells. J. Virol. 2011, 85, 1696–1705. [Google Scholar] [CrossRef] [PubMed]
- Javed, A.; Leuchte, N.; Neumann, B.; Sopper, S.; Sauermann, U. Noncytolytic CD8+ cell mediated antiviral response represents a strong element in the immune response of simian immunodeficiency virus-infected long-term non-progressing rhesus macaques. PLoS ONE 2015, 10, e0142086. [Google Scholar] [CrossRef] [PubMed]
- Blackburn, S.D.; Wherry, E.J. Il-10, T cell exhaustion and viral persistence. Trends Microbiol. 2007, 15, 143–146. [Google Scholar] [CrossRef] [PubMed]
- Fan, J.; Bass, H.Z.; Fahey, J.L. Elevated IFN-gamma and decreased IL-2 gene expression are associated with HIV infection. J. Immunol. 1993, 151, 5031–5040. [Google Scholar] [PubMed]
- Zimmerli, S.C.; Harari, A.; Cellerai, C.; Vallelian, F.; Bart, P.A.; Pantaleo, G. HIV-1-specific IFN-gamma/IL-2-secreting CD8 T cells support CD4-independent proliferation of HIV-1-specific CD8 T cells. Proc. Natl. Acad. Sci. USA 2005, 102, 7239–7244. [Google Scholar] [CrossRef] [PubMed]
- Feng, Y.M.; Wan, Y.M.; Liu, L.X.; Qiu, C.; Ma, P.F.; Peng, H.; Ruan, Y.H.; Han, L.F.; Hong, K.X.; Xing, H.; et al. HIV-specific IL-2(+) and/or IFN-gamma(+) CD8(+) T cell responses during chronic HIV-1 infection in former blood donors. Biomed. Environ. Sci. BES 2010, 23, 391–401. [Google Scholar] [CrossRef]
- Montoya, C.J.; Velilla, P.A.; Chougnet, C.; Landay, A.L.; Rugeles, M.T. Increased IFN-gamma production by NK and CD3+/CD56+ cells in sexually HIV-1-exposed but uninfected individuals. Clin. Immunol. 2006, 120, 138–146. [Google Scholar] [CrossRef] [PubMed]
- Dean, G.A.; Pedersen, N.C. Cytokine response in multiple lymphoid tissues during the primary phase of feline immunodeficiency virus infection. J. Virol. 1998, 72, 9436–9440. [Google Scholar] [PubMed]
- Roff, S.R.; Noon-Song, E.N.; Yamamoto, J.K. The significance of interferon-gamma in HIV-1 pathogenesis, therapy, and prophylaxis. Front. Immunol. 2014, 4, 498. [Google Scholar] [CrossRef] [PubMed]
- Kornfeld, C.; Ploquin, M.J.; Pandrea, I.; Faye, A.; Onanga, R.; Apetrei, C.; Poaty-Mavoungou, V.; Rouquet, P.; Estaquier, J.; Mortara, L.; et al. Antiinflammatory profiles during primary siv infection in african green monkeys are associated with protection against aids. J. Clin. Investig. 2005, 115, 1082–1091. [Google Scholar] [CrossRef] [PubMed]
- Legrand, F.A.; Nixon, D.F.; Loo, C.P.; Ono, E.; Chapman, J.M.; Miyamoto, M.; Diaz, R.S.; Santos, A.M.; Succi, R.C.; Abadi, J.; et al. Strong HIV-1-specific T cell responses in HIV-1-exposed uninfected infants and neonates revealed after regulatory T cell removal. PLoS ONE 2006, 1, e102. [Google Scholar] [CrossRef] [PubMed] [Green Version]
- Killian, M.S.; Teque, F.; Walker, R.L.; Meltzer, P.S.; Killian, J.K. CD8(+) lymphocytes suppress human immunodeficiency virus 1 replication by secreting type I interferons. J. Interferon Cytokine Res. 2013, 33, 632–645. [Google Scholar] [CrossRef] [PubMed]


| Cell Receptor | Species Against | Source Antibody Clone | Isotype | Dilution |
|---|---|---|---|---|
| CD4 | Anti-feline | Southern Biotech Clone 3-4F4 | Mouse IgG1 | 1:100 |
| CD8 | Anti-feline | Southern Biotech Clone fCD8 | Mouse IgG1 | 1:100 |
| CD134 | Anti-feline | Serotec Clone 7D6 | Mouse IgG1 | 1:10 |
| B220 | Anti-mouse | Southern Biotech Clone RA3-6B2 | Rat IgG2a | 1:100 |
| FAS | Anti-feline | R&D Systems Clone 431014 | Mouse IgG1 | 1:500 |
| CD21 | Anti-human | BD Pharmingen Clone B-ly4 | Mouse IgG1 | 1:5 |
| CD45RA | Anti-feline | Calvin Johnson Auburn University | Mouse IgG1 | 1:7 |
| MHC II (HLA-DR, DP, DQ) | Anti-human | BD Pharmingen Clone TÜ39 | Mouse IgG1 | 1:10 |
| CD25 | Anti-feline | Wayne Thompkins North Carolina State University | Mouse IgG2a | 1:20 |
| CD14 | Anti-human | Bio-Rad Clone TÜK4 | Mouse IgG1 | 1:20 |
| Cell Subsets Examined | Tissue Compartments Examined | Proposed Function |
|---|---|---|
| CD4+ | Blood, Thymus, MLN, PLN | T cells, helper of cytotoxic |
| CD8+ | Blood, Thymus, MLN, PLN | Cytotoxic T cells, NKT cells |
| CD14+ | Blood, Thymus, MLN, PLN | Monocytes, Macrophages, myeloid DC |
| CD4+ CD134+ | Blood, Thymus, MLN, PLN | Activated CD4+ T cells |
| CD8+ FAS+ | Blood | Activated CD8+ T cells |
| CD4+ MHC II+ | Blood, Thymus, MLN, PLN | Activated CD4+ T cells |
| CD4+ CD45RA+ | Blood, Thymus | Naïve CD4+ T cells |
| CD8+ CD45RA+ | Blood, Thymus | Naïve CD8+ T cells |
| CD4+ CD8+ | Thymus | Double-positive T cells |
| CD4− CD8− | Thymus | Double-negative T cells |
| CD4+ CD25+ | Blood | Activated or Regulatory CD4+ T cells |
| B220+ CD21+ | Blood | B cells |
© 2018 by the authors. Licensee MDPI, Basel, Switzerland. This article is an open access article distributed under the terms and conditions of the Creative Commons Attribution (CC BY) license (http://creativecommons.org/licenses/by/4.0/).
Share and Cite
Sprague, W.S.; Troyer, R.M.; Zheng, X.; Wood, B.A.; Macmillan, M.; Carver, S.; VandeWoude, S. Prior Puma Lentivirus Infection Modifies Early Immune Responses and Attenuates Feline Immunodeficiency Virus Infection in Cats. Viruses 2018, 10, 210. https://doi.org/10.3390/v10040210
Sprague WS, Troyer RM, Zheng X, Wood BA, Macmillan M, Carver S, VandeWoude S. Prior Puma Lentivirus Infection Modifies Early Immune Responses and Attenuates Feline Immunodeficiency Virus Infection in Cats. Viruses. 2018; 10(4):210. https://doi.org/10.3390/v10040210
Chicago/Turabian StyleSprague, Wendy S., Ryan M. Troyer, Xin Zheng, Britta A. Wood, Martha Macmillan, Scott Carver, and Susan VandeWoude. 2018. "Prior Puma Lentivirus Infection Modifies Early Immune Responses and Attenuates Feline Immunodeficiency Virus Infection in Cats" Viruses 10, no. 4: 210. https://doi.org/10.3390/v10040210