Abstract
The research conducted in this study presented for the first time results of physico-chemical properties and in vitro antimicrobial activity of hydroxyapatite plant essential oil against Gram-positive bacteria (methicillin-resistant Staphylococcus aureus (MRSA) and S. aureus 0364) and Gram-negative bacteria (Escherichia coli ATCC 25922). The samples were studied by scanning electron microscopy (SEM) and Fourier transform infrared (FTIR) spectroscopy to determine the morphology and structure of the nanocomposites of hydroxyapatite coated with basil (HAp-B) and lavender (HAp-L) essential oils (EOs). The values of the BET specific surface area (SBET), total pore volume (VP) and pore size (DP) were determined. The results for the physico-chemical properties of HAp-L and HAp-B revealed that lavender EOs were well adsorbed on the surface of hydroxyapatite, whereas basil EOs showed a poor adsorption on the surface of hydroxyapatite. We found that the lavender EOs hydroxyapatite (HAp-L) exhibited a very good inhibitory growth activity. The value of the minimum inhibitory concentration (MIC) related to growth bacteria was 0.039 mg/mL for MRSA, 0.02 mg/mL for S. aureus and 0.039 mg/mL E. coli ATCC 25922. The basil EO hydroxyapatite (HAp-B) showed poor inhibition of bacterial cell growth. The MIC value was 0.625 mg/mL for the HAp-B sample in the presence of the MRSA bacteria, 0.313 mg/mL in the presence of S. aureus and 0.078 mg/mL for E. coli ATCC 25922.
1. Introduction
Hydroxyapatite (HAp) is a calcium phosphate compound and the best known biomaterial in terms of its morphological and compositional similarity with human hard tissue. From a thermodynamic point of view, hydroxyapatite is the most stable calcium phosphate with regard to the physiological conditions of the human body, including temperature, body fluids composition and human pH. The outstanding properties of HAp nanopowders, such as their biocompatibility, bioactivity, osteoconductivity and nontoxicity, have been demonstrated [].
Hydroxyapatite inorganic components (Ca10(PO4)6(OH)2) resemble, in the most favorable way, the natural biological apatite found in bone. Therefore, it is of interest in medicine and biomedical engineering for bone regeneration and dental applications. As a result of its biocompatibility, hydroxyapatite can be used for coating metal prostheses or dental implants, which is favorable for a successful osteointegration process. On the other hand, it is well known that the risk of postoperative infections [,,] can be drastically reduced by incorporating antibacterial agents in the chemical structure of hydroxyapatite.
Essential oils are complex biostructures, and contain a lot of chemical compounds from different chemical classes: terpenoids, ketones, aldehydes, and esters, either saturated or with different levels of unsaturation, their chemical composition depending on the plant’s origin and quality, harvest time, climate, soil and especially extraction process [,,,,]. About 90% of the bioactive components of EOs are monoterpenes. In oxygenated form, the chemical constituents of EOs exhibit a better bioactivity.
Essential oils have been used since ancient times. Over the years, EOs have been approved for use in cosmetics, pharmaceuticals, perfumery and food and medicine industries, and are some of the most commonly used natural products. On the other hand, aromatherapy, a branch of alternative medicine, argues that essential oils can be particularly active healing remedies with specific actions for various maladies. Moreover, they can be a natural alternative to synthetic drugs, which produce countless side effects. Today, by combining science with ancient wisdom, we can gain a deeper understanding of and, at the same time, access to the therapeutic benefits that essential oils possess []. The essential oils of basil and lavender are among the best known because of their applicability in various fields of activity. Lavender EOs contains volatile molecules of particular interest to the cosmetics industry, perfumes and aromatherapy, while basil EOs are commonly used in the food industry.
In recent years, because of the excessive use of antibiotics, bacteria and viruses are becoming more resistant to drugs. On the other hand, viruses and bacteria have changed a lot over time, and antibiotics cannot treat most of the diseases they cause. Even if bacteria adapt and become resistant to antibiotics, medical and pharmaceutical specialists are trying to find new products that can be used to develop medicines to fight back against pathogens. More than that, chemically synthetized drugs present a certain toxicity and involve a potential risk to humans. In this context, researchers are continuously trying to find new molecules to fight against bacterial strains.
Recent studies in this field [] have shown that essential oils are encouraging for use in medicine and biomedical applications due to their antibacterial, antifungal and antiviral properties and their ability to prevent the growth of different pathogens. Lavender oil chemical components were proved to be inhibitors of M. smegmatis and E. coli microorganisms []. Basil oils (Ocimum basilicum) exhibit antibacterial activity against Brochothrix thermosphacta, E. coli, L. innocua, L. monocytogenes, P. putida, S. typhimurium, S. putrefaciens and M. flavus microorganisms [].
In this context, the results presented in this paper evidence the physicochemical properties and antibacterial activities of hydroxyapatite-lavender essential oil (HAp-L) and hydroxyapatite-basil essential oil (HAp-B) nanocomposites. The morphology of the surfaces of the hydroxyapatite nanoparticles coated with essential oils was analyzed by Scanning Electron Microscopy (SEM). The influence of the basil and lavender essential oils on the molecular structure of the HAp was investigated using Fourier Transform Infrared Spectroscopy measurements. The antibacterial effect of hydroxyapatite coated with basil (HAp-B) and lavender (HAp-L) essential oil nanopowders (pressed into pellets) against Gram-positive (MRSA, S. aureus) and Gram-negative (E. coli) bacteria was also studied.
2. Materials and Methods
The plant EOs used in this study were lavender oil, naturally obtained from Lavandula angustifolia L. (Sigma Aldrich, St. Louis, MO, USA), and basil oil, linalol type, obtained from Ocimum basilicum L. (Sigma Aldrich). The essential oils were used as purchased without any dilution.
The Ca10(PO4)6(OH)2 hydroxyapatite powders (HAp) were synthesized by an adapted coprecipitation method maintaining the molar ratio Ca:P = 1:67 [] and using as precursors calcium nitrate (Ca(NO3)2∙4H2O, Sigma Aldrich, St. Louis, MO, USA), ammonium hydrogen phosphate ((NH4)2HPO4; Wako Pure Chemical Industries Ltd., Richmond, VA, USA), ammonium hydroxide (NH4OH, Wako Pure Chemical Industries Ltd., Richmond, VA, USA), and double distilled water. Ca(NO3)2·4H2O and (NH4)2HPO4 were dissolved in deionized water and stirred vigorously for 2 h. The solution containing P was then added dropwise into the Ca-containing solution, and the new obtained mixture was magnetically stirred for 2 h at a temperature of 100 °C. During the reaction, the pH value was constantly kept at 10. The final product was washed with deionized water several times. The obtained material (HAp) was dried for 48 h at 100 °C. The HAp-B and HAp-L samples were obtained by mixing HAp powder with basil and lavender essential oil. HAp, HAp-B and HAp-L powders were pressed into pellets with a diameter of 6 mm.
The morphology of the samples was investigated by Scanning Electron Microscopy (SEM) using a HITACHI S4500 microscope (Hitachi, Ltd., Tokyo, Japan). Prior to recording the images, the powder samples were evenly dispersed in a specimen holder using as double coated conductive carbon tape conductive adhesive. The sample holder containing the samples was introduced into the vacuum chamber, and all SEM images were recorded using a 5 kV electron acceleration voltage and an Everhart-Thornley detector (ETD). The 3D surface plots of the SEM images were obtained using Image J software (ImageJ 1.51j8, National Institutes of Health, Bethesda, MD, USA) [].
The specific surface area (SBET) cumulative pore volume (Vp) and diameter of the pores (Dp) of the HAp, HAp-B, HAp-L samples were determined using an ASAP 2020 instrument from the nitrogen adsorption-desorption isotherm. The measurements were performed at 77 K. The specific surface areas of the HAp, HAp-B, and HAp-L samples were determined by Brunauer-Emmett-Teller (BET) method []. The total pore volume (VP) and pore size (DP) were calculated using the Barrett, Joyner, and Halenda (BJH) method [].
The spectra of HAp-B and HAp-L samples were acquired using a Perkin Elmer spectrometer (Waltham, MS, USA) SP 100 equipped with an Attenuated Total Reflection (ATR) accessory, in the spectral range of 400–4000 cm−1 with a 4 cm−1 resolution. The samples were placed on the ATR accessory without any preparation. The background spectrum was acquired in air and taken as reference background spectrum. Before and after the spectral analysis of each sample, the ATR diamond crystal was cleaned with an isopropyl alcohol solution. The ATR plate cleaning was verified by recording the background spectrum after each sample measurement and comparing it with the reference background spectrum. The acquired transmission IR spectra were transformed into absorption spectra according to the A = log (1/T) using the Perkin Elmer spectrometer, SPECTRUM software (Version 6.4.1, Perkin Elmer, Waltham, MS, USA). The fine structure of the obtained absorption spectra of the HAp, HAp-B, and HAp-L samples was revealed by peak fitting analysis. The first step performed in the peak fitting analysis procedure was the baseline correction of the experimental infrared spectrum, followed by the second-order derivative calculation for peak wavenumbers finding. Secondly, during the fitting analysis process, a Lorentz-type profile curve was used for each identified peak. A sum of all the Lorentz fitted curves was generated by multiple iteration of the nonlinear least-squares data-fitting algorithm of the calculation software. If the sum of all the fitted curves is set correctly, the algorithm gives a valid and convergent solution. The theoretical curve obtained as a result of peak fitting analysis versus experimental IR curve was presented and analysed [,].
The tested microorganism strains that were used in this study were Gram-positive bacteria methicillin-resistant Staphylococcus aureus (MRSA) and Staphylococcus aureus 0364 (S. aureus 0364) and Gram-negative bacteria Escherichia coli ATCC 25922, (E. coli ATCC 25922). The qualitative antibacterial assays were performed using microbial suspensions obtained from 15–18 h solid cultures on tryptone soy agar (TSA). The cultures were then transferred to fresh Mueller-Hinton agar (MHA) and incubated for 2–3 h to reach the exponential growth phase. The bacterial suspensions were adjusted to 0.5 McFarland standard (1 × 10⁸ CFU/mL) and were spread on Mueller-Hinton agar plates evenly using a sterile swab. Hydroxyapatite, and hydroxyapatite coated with lavender and basil EOs pellets were placed directly, aseptically and distinctively onto the previously inoculated MHA plates. Agar plates were incubated at 37 °C for 18–24 h and the inhibition zones formed were measured in mm [,]. The quantitative studies regarding the antibacterial activity of the HAp, HAp-B and HAp-L powders were performed by microdilution broth method in 96 multi-well plates [,,]. The materials were solubilized in DMSO and two-fold dilutions of the samples ranging from 5 to 0.01 mg/mL were carried out in Mueller-Hinton broth (MHB). Each tube was inoculated with microbial suspension adjusted to 0.5 McFarland and a volume of 100 μL of each sample dissolved in DMSO as described above were added to the first well and a serial two-fold dilution was performed. After incubation at 37 °C for 18–24 h, the minimum inhibitory concentration (MIC) values and minimum bactericidal concentration (MBC) values were determined by measuring the absorbance of the microbial suspensions at 620 nm.
3. Results and Discussion
The microstructure of the HAp sample and the influence of the basil and lavender EOs on the hydroxyapatite nanoparticles’ shape and distribution were investigated by SEM.
The respective morphologies of the hydroxyapatite coated with EOs of basil (HAp-B) and lavender (HAp-L) are shown in Figure 1a–c. In Figure 1a, the uniform ellipsoidal shape of HAp nanoparticles and their distribution can be observed in the investigated sample. By covering HAp with EOs, the nanoparticles agglomerated, as can be observed in Figure 1b,c. The particles’ shape remained ellipsoidal for both HAp-B and HAp-L samples, while the sample surfaces were affected.
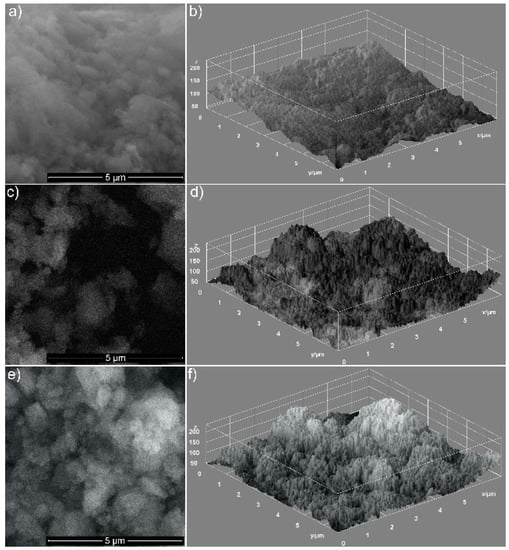
Figure 1.
The SEM images of HAp (a), HAp-B (c) and HAp-L (e). 3D surface plot of SEM images of HAp (b), HAp-B (d) and HAp-L (f) samples.
Information on the uniformity and the homogeneity of the analyzed samples is provided in Figure 1b,d,f. The SEM images are shown as 3D surface plots (Figure 1b,d,f) of HAp, HAp-B and HAp-L samples obtained using Image J software (ImageJ 1.51j8, National Institutes of Health, Bethesda, MD, USA) [] are also presented. The distribution of the HAp nanoparticles covered with EOs became non-uniform, and it seemed that the porosity of the HAp nanoparticles increased. An obvious increase in porosity was noticed for HAp-L samples, while a clear change in the porosity of HAp-B samples was not observed. This behavior could suggest that basil EO had poor adsorption on the surface of hydroxyapatite nanoparticles.
The particle size, structure, and morphology can have a significant influence on both materials and the efficiency of their use. Properties such as SBET, VP and DP are significant material characteristics in numerous applications, including pharmaceutical and medical products. To determine the total pore volume (VP) and pore size (DP) of the HAp, HAp-B, HAp-L samples, the Barrett, Joyner, and Halenda (BJH) method was used. Moreover, the values of the specific surface area (SBET) of the samples were determined by the BET method. The nitrogen physisorption results, including the SBET, VP and DP of the HAp, HAp-B, HAp-L samples, are given in Table 1.

Table 1.
Specific surface area SBET, pore volume VP, mean pore diameter DP.
The BET surface areas increased from HAp to HAp-L. The SBET value for HAp-B is close to that of HAp. As expected, the pore volume VP increased from HAp to HAp-L. The results regarding the porosity of the materials were similar to those observed by SEM analysis. These materials could have high potential for use in a variety of applications, due to the possibility of obtaining particles with a controlled size and shape.
The IR spectra of HAp, HAp-B and HAp-L samples and IR band assignments for HAp, HAp-B and HAp-L are presented in Figure 2, Figure 3 and Figure 4 and Table 2.
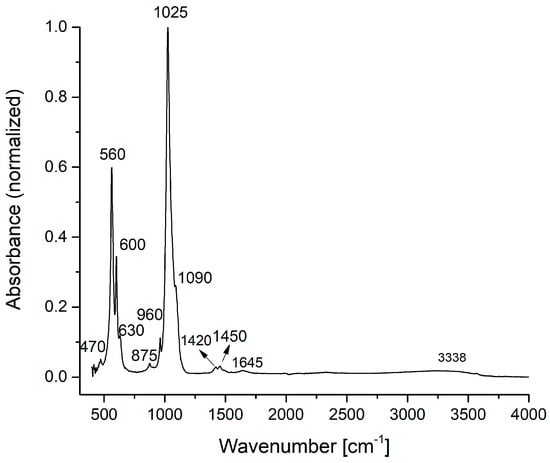
Figure 2.
FTIR spectra of the HAp sample.
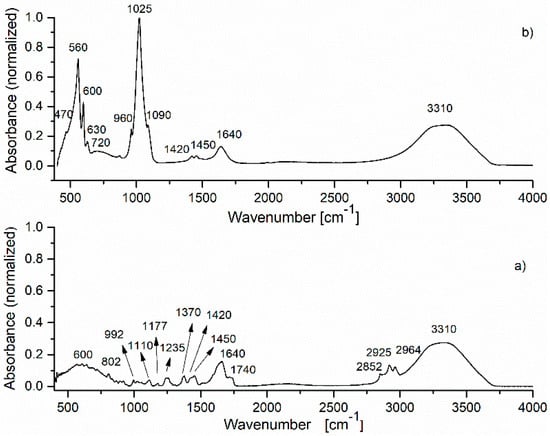
Figure 3.
FTIR spectrum of: (a) basil essential oil; (b) HAp-B sample.
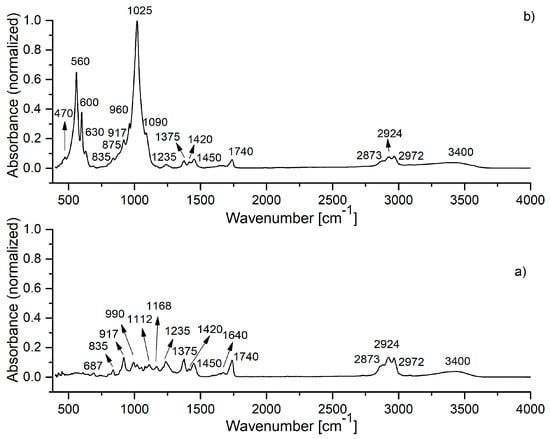
Figure 4.
FTIR spectrum of: (a) lavender EO; (b) HAp-L sample.
Table 2.
The FTIR bands associated to the vibrational groups present in the HAp, HAp-B, HAp-L samples.
In the IR absorption spectrum from Figure 2, the main characteristic vibrational bands of the HAp nanoparticles can be identified. The spectrum was normalized from 0 to 1 using the SPECTRUM software of the Perkin Elmer SP 100 spectrometer. The fundamental vibrational modes of [PO4]3− groups of the apatitic structure appear at 470 cm−1 (ν1), 560, 600, 630 cm−1 (ν4), 960 cm−1 (ν1), 1025, 1090 cm−1 (ν3) [,]. The IR bands from 875, 1420, 1450 cm−1 can be attributed to the vibrations of the [CO3]2− carbonate group []. The [CO3]2− group absorption band presence in the HAp IR spectrum was due to the formation of carbonated groups in the HAp powder during the chemical synthesis. The weak and broad IR bands from 1645 and 3338 cm−1 characterize the O–H vibration from the water absorbed into the HAp structure.
The IR spectra of the basil EO and HAp-B samples are presented in Figure 3. According to Figure 3a [,], in the spectrum of basil EO, the main characteristic IR absorption bands were observed. In the 2800–3400 cm−1 spectral region, the IR peaks of –CH2 stretching (2852, 2925, 2964 cm−1) and C–H stretching (3310 cm−1) vibrations were identified. The intense IR band at 1640 cm−1 was attributed to the C=C stretching vibration and the 1740 cm−1 absorption band is characteristic of C=O stretching vibrations. The most relevant absorption bands from the 500–1500 cm−1 spectral region are: 600, 802 (C–H vibrations), 1110, 1177, 1235 cm−1 (C–O stretching vibrations), 992, 1370, 1420, 1450 cm−1 (C–H bending vibrations) [].
The spectrum of the HAp-B sample was dominated by the IR bands specific to HAp. The IR spectral absorption bands of basil EO were usually present in the 2700–3200 cm−1 and 600–1850 cm−1 spectral regions. As the 600–1850 cm−1 spectral range was mainly dominated by the IR bands characteristic to HAp, only a few IR bands specific to basil oil were indicated in the HAp-B absorption spectrum shown in Figure 3 and subsequently in Table 2, like 720 cm−1 (C–H vibrations), 1640 cm−1 (O–H vibrations) respectively 3310 cm−1 (O–H vibrations). The broad IR band from 720 cm−1 observed in Figure 3a appears to be due to the overlapping of the basil EO absorption bands in the 600–800 cm−1 spectral region.
Furthermore, the normalized absorption IR spectra of basil EO and HAp-B presented in Figure 3 could provide a quantitative evaluation of the basil EO absorption into the HAp sample. By comparing the IR spectrum of HAp (Figure 2) with the IR spectrum of HAp-B (Figure 3b), wavenumber differences can be noticed, especially in the 1400–4000 cm−1 range. On the other hand, in the IR spectrum of the HAp-B sample, the bands specific to basil EO were not clearly highlighted, although there are many IR-specific bands of basil EO in the 400–1400 cm−1 region. This is also the case concerning the IR bands at 2852, 2925, and 2964 cm−1. In the spectrum of the HAp-B sample, only the basil EO IR absorption bands of 1640 and 3310 cm−1, attributed to O-H vibrations, were visible (Figure 2). These bands were partially overlaid with the 1645 and 3338 cm−1 IR bands characteristic to HAp (Figure 2). These results could indicate a poor absorption of basil EO into the HAp structure. The absorption intensities of the 1640 and 3310 cm−1 IR bands in the basil EO spectrum were 0.15 and 0.26, respectively. In the HAp-B spectrum, the intensities of these absorption bands were 0.13 and 0.27, respectively.
The IR spectra of lavender EO and HAp-L samples are presented in Figure 4. The IR spectrum in Figure 4a reveals the characteristic IR absorption bands of lavender EO [,]. In the spectral region of 2800–3400 cm−1, the IR peaks at 2873, 2924, 2972 cm−1 were ascribed to –CH2 stretching, while the band at 3400 cm−1 was attributed to O–H stretching vibrations. The most intense IR band in the spectrum appears at 1740 cm−1 (C=O stretching vibrations). The 1640 cm−1 IR band belongs to the C=C stretching vibration. In the 400–1500 cm−1 region, the following IR peaks were identified: 687, 835, 917 cm−1 (C–H vibrations), 990 cm−1 (–CH2 vibrations), 1112, 1168, 1235 cm−1 (C–O stretching vibrations), 1375, 1420, 1450 cm−1 (C–H bending vibrations) [].
In Figure 4b, the IR spectrum of the HAp-L samples reveals absorption bands characteristic to both HAp and lavender EO. All the characteristic IR absorption bands for HAp were present in the spectrum. In addition to the HAp IR spectral bands, the IR bands specific to lavender EO can also be observed in Figure 4b. Thus, the bands at 692, 917, 1375 cm−1 correspond to C–H vibrations, while the band at 1640 cm−1 was associated with the C=C stretching vibrations [,]. The 1235 cm−1 IR band belongs to the C–O stretching vibration of the ester group, and the 1740 cm−1 band was related to the C=O stretching vibration. The IR bands from 1375 cm−1 and those in the 2800–3000 cm−1 range were due to the bending and stretching of the C–H vibrations in methyl and methylene groups, as was indicated in Table 2. The broad band at 3400 cm−1 (O–H) indicated an alcohol presence [,].
The HAp-L IR spectrum from Figure 4b reveals the IR bands of lavender EO even in the 400–1500 cm−1 spectral region, which is dominated mainly by the HAp IR bands. In the wavenumber range 1500–4000 cm−1, the lavender EO IR bands at 1740, 2873, 2924, 2972 and 3400 cm−1 specific to C=O stretching, methylene stretching and O–H vibrations can be clearly identified. The values of the absorption intensities of the IR bands characteristic to lavender EO in both lavender EO and HAp-L IR spectra, as measured from the IR spectra in Figure 4 in the 1200–4000 cm−1 spectral region, are presented in Table 2. The absorption bands at 1235, 1375, 1740, 2873, 2924, 2972 cm−1 are the only ones that are not overlaid with the HAp IR bands. Comparison of the intensities of these absorption bands in both spectra from Figure 4 can give a quantitative estimation of the degree of the lavender EO absorption into the HAp structure. Moreover, the spectra from Figure 4 and the data presented in Table 3 indicate better absorption of lavender EO into the HAp structure in comparison with the basil EO.
Table 3.
Absorption intensities of lavender EO IR bands in lavender EO and HAp-L IR spectra.
According to previous studies [,] regarding the IR analysis of essential oils such as lavender and basil essential oils, there are several absorption bands in the 800–1200 cm−1 range. In the IR spectrum of the HAp-B and HAp-L samples, only some of these were observed. The same comportment was observed in the case of the HAp sample.
Thus, in order to discover the complete molecular structural information of the HAp, HAp-B and HAp-L samples, we performed a peak fitting analysis of their IR spectra in the 800–1200 cm−1 spectral range. As a first step in the peak fitting analysis procedure, the second derivative of the IR spectrum was calculated.
The HAp-B IR deconvoluted spectrum is presented in Figure 5, together with the second derivative curve in the 800–1200 cm−1 spectral range. The 960, 1009, 1023, 1041, 1062 and 1091 cm−1 IR absorption bands can be attributed to the P-O vibrations in the [PO4]3− group, while the IR band at 992 cm−1 can be assigned to the C–H vibrational deformations present in basil EO [,].
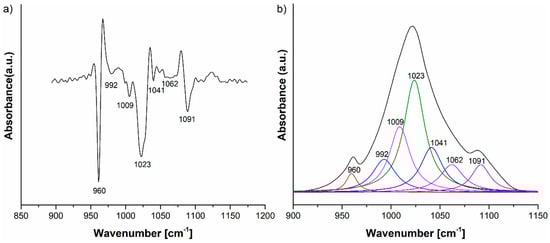
Figure 5.
(a) Second derivative and (b) FTIR deconvoluted spectra of the HAp-B IR spectrum in the 800–1200 cm−1 domain.
In the case of the HAp-L IR deconvoluted spectrum (Figure 6b), the peaks from 835, 875 cm−1 are attributed to the C–O vibrations in the [CO3]2− group, an impurity in the synthesis of the HAp. The peak at 835 cm−1 could also be assigned to the C–H vibrations into the lavender EO spectrum (Figure 4). The 920, 945, 960, 1020, 1050 and 1090 cm−1 IR peaks belong to the P–O vibrations in the [PO4]3− group [,]. In addition to the peaks previously identified in the IR spectrum of HAp-L, the peak fitting analysis revealed some peaks related to the structure of the lavender EO, namely 917 and 990 cm−1, assigned to C-H vibrational deformations in accordance with [,].
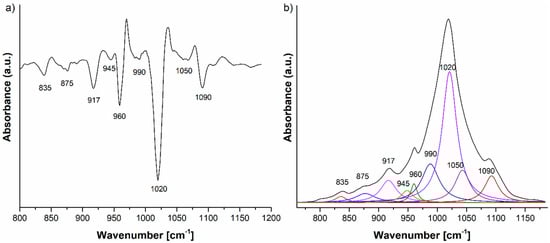
Figure 6.
(a) Second derivative and (b) FTIR deconvoluted spectrum of the HAp-L IR spectrum in the 800–1200 cm−1 domain.
The second derivative and, consequently, the deconvoluted IR spectra of the HAp-B, HAp-L and HAp samples in the 800–1200 cm−1 spectral region indicate slight differences in the wavenumbers of the IR peaks belonging to the P–O vibrations (Figure 5a and Figure 6a). The ν3 fundamental vibrational mode of [PO4]3− group is usually formed in the 1000–1100 cm−1 range [], so this implies that some interactions take place between the atoms and molecules of the HAp and basil EO structure and the HAp and lavender EO structure.
The IR spectrum of the HAp-B sample in Figure 3b, as well as the second derivative and the deconvoluted IR spectra from Figure 5, indicate only a few IR bands specific to basil EO in comparison with the bands specific to lavender EO. In [,], it was shown that the basil and lavender EOs have many characteristic IR bands in the 800–1800 cm−1 spectral region. In the HAp-B IR spectrum, there were a few IR bands specific to the basil EO (Table 2, Figure 3 and Figure 5). In the IR spectrum of HAp-L, more IR bands specific to lavender EO were identified (Table 2, Figure 4 and Figure 6). This emphasizes the fact that the lavender EO was better adsorbed on the surface of hydroxyapatite compared to basil EO.
The antibacterial activity of the HAp samples and HAp coated with essential oil of basil and lavender samples was assessed using Methicillin-Resistant Staphylococcus aureus (MRSA) and Staphylococcus aureus 0364 (S. aureus 0364) and Gram-negative bacteria, Escherichia coli ATCC 25922, (E. coli ATCC 25922) bacterial strains. The qualitative antibacterial results of the tested samples obtained by an adapted disc diffusion method are illustrated in Figure 7, and the inhibition zone diameters measured in mm are presented in Table 4.
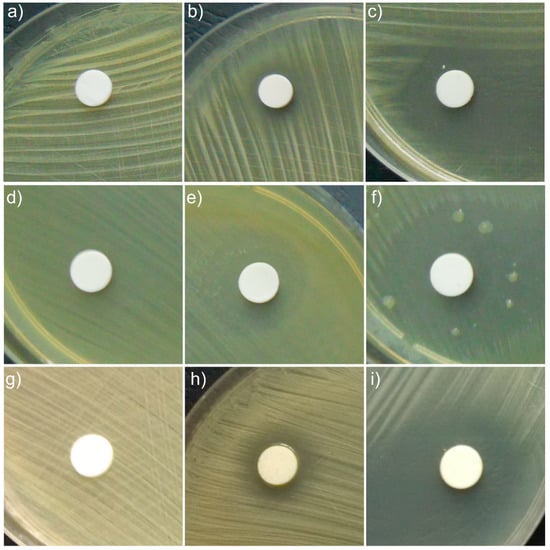
Figure 7.
Qualitative assay of the inhibitory activity of HAp, HAp-B and HAp-L samples against MRSA (a–c), E. coli ATCC 25922 (d–f) and S. aureus 0364 (g–i) bacterial strains.
Table 4.
Inhibition zone diameters of HAp, HAp-B and HAp-L samples against MRSA, S. aureus 0364 and E. coli ATCC 25922 bacterial strains.
The results of the antibacterial assays emphasized that HAp pellet powders exhibited no antimicrobial activity against the tested Gram-positive and Gram-negative bacterial strains.
The results indicated that HAp-L displayed good antibacterial activity against MRSA, S. aureus 0364 and E. coli ATCC 25922 microbial strains, while the antibacterial activity of HAp-B samples against MRSA, S. aureus 0364 and E. coli ATCC 25922 was not so well evidenced. It can be observed that HAp-L was strongly inhibitory against all tested bacterial strains (Figure 7c,f,i). The results also suggested that HAp-B was moderately inhibitory against S. aureus 0364 (Figure 7h) and weakly inhibitory to MRSA, (Figure 7b). The HAp-B sample showed the best antimicrobial activity against the E. coli ATCC 25922 bacterial strain (Figure 7e). Due to the fact that the HAp powders presented no inhibitory effect on the growth of the tested bacterial strains, the antibacterial activity of the HAp-B and HAp-L samples was attributed to the basil and lavender EOs. According to the manufacturer’s data, the basil essential oil (W212000 Aldrich) used in this study was mainly composed of eugenol, 32.4%; limonene, <0.1%; linalool, 41.9%; and methyl chavicol, 0.9% []. The lavender essential oil (61718 Aldrich) was comprised of over 100 constituents, including linalool, perillyl alcohol, linalyl acetate, camphor, limonene, tannins, triterpenes, coumarins 3,4,5, cineole, and flavonoids, etc. [,]. Both essential oils, purchased from Sigma Aldrich, had as a major constituent linalool, which has been reported to possess a strong antimicrobial activity []. Studies regarding the synergy between the components of essentials oils are still scarce. However, numerous results in this area have reported that the antimicrobial activity of a given essential oil is strongly influenced by just one or two main components, and also by the interactions between the major and minor components present in the oil composition []. Therefore, the distinctive behavior of the antimicrobial activity of HAp-B and HAp-L samples attributed to the basil and lavender EOs could be related both to the different interactions between the two oils constituents with the HAp powders and to the synergy between the constituent elements of each oil, separately. The effectiveness of essential oils in inhibiting bacterial growth is strongly depended on the nature of functional groups and orientation. Various mechanisms explaining the antimicrobial activity of EOs have been reported in the literature. EOs can disrupt the cell membrane of a microorganism by simply increasing membrane permeability, destabilizing the cellular architecture causing the breakdown of membrane integrity, which disrupts many vital cellular activities []. Therefore, the antimicrobial activity of EOs differs depending on the type of EO, as well as the targeted microbial strain, depending on their structure (Gram positive, Gram negative and fungi). It has been reported that sandalwood and vetiver EOs have strong inhibitory effects on the Gram-positive bacterial strains, while they do not exhibit any antibacterial activity against Gram-negative bacterial strains [,]. On the other hand, EOs obtained from cinnamon, clove, pimento, thyme, oregano, and rosemary have been reported to be effective against Salmonella typhi (Gram negative), Staphylococcus aureus (Gram positive), and Pseudomonas aeruginosa (Gram negative) bacterial strains []. Moreover, Myrtus communis EO has been described as being effective in the case of S. aureus, L. monocytogenes, Enterococcus durans, B. subtilis, Mycobacterium tuberculosis, P. aeruginosa, S. typhi, E. coli, K. pneumoniae, and Mycobacterium avium bacterial strains, which belong both to the Gram-negative as well as the Gram-positive bacterial strains [,]. Even though there are numerous studies regarding the antibacterial activity of EOs, there is no substantial evidence that definitely supports EOs presenting stronger antimicrobial activity against Gram-positive bacteria compared to Gram-negative bacteria. The different behavior of HAp-B and HAp-L samples could also be due to different adsorption on the hydroxyapatite surface of the two EOs (basil and lavender) as can be seen in the studies presented above.
These findings are in good agreement with studies regarding the antibacterial activity of lavender EO, which was demonstrated to exhibit in vitro activity against MRSA (methicillin-resistant Staphylococcus aureus) even at low concentrations [,,,,,,]. In recent studies on the antimicrobial activity of EOs from plants against selected pathogenic and saprophytic microorganisms [], it was concluded that essential oils extracted from oregano, basil, and coriander plants exhibit a noticeable inhibitory effect against P. aeruginosa, S. aureus, and Yersinia enterocolitica even at low concentrations. On the other hand, M. Sienkiewicz et al. [], following studies on the use of essential oils of rosemary as effective antibacterial agents, reported that basil EO exhibited strong antibacterial activity against E. coli clinical strains.
The antibiotic resistances of the tested microorganisms have been investigated and reported in numerous studies [,,,,,]. In their research, A.W. Khan et al. [] identified a zone with an average inhibition diameter of 23 mm for E. coli ATCC 25922 when tested against antibiotic discs of tetracycline (30 µg). More than that, the antibiotic resistance of different types of MRSA has been investigated by Trzcinsky et al. []. They showed that the diameter of the inhibition zone is closely related to clinical isolation, reporting an area with an average inhibition diameter of 6 to 17 mm when the antibiotic resistance of different types of MRSA was tested with tetracycline antibiotic discs (30 μg). The antibiotic resistance of S. aureus control strains against antibiotic discs of tetracycline (30 µg) has also been tested previously [,], indicating that the diameter of the inhibition zone was between 19 and 28 mm.
The antibacterial activity of the HAp-B and HAp-L samples was also confirmed by measuring the inhibition zone diameters (Table 4). The antimicrobial activity of HAp. HAp-B and HAp-L ranged from no inhibition for HAp sample to 25.83 ± 0.9 mm for the HAp-L sample in the case of S. aureus 0364 bacterial strain. The results suggested that HAp-L presented a stronger antibacterial activity against all tested microbial strains. In the case of HAp-B sample, the E. coli bacterial strain proved to be the most susceptible, presenting a diameter inhibition zone of 14.65 ± 0.5 mm.
The goal of this research was to obtain significant information about the antibacterial effect of nanopowders of hydroxyapatite coated with basil (HAp-B) and lavender (HAp-L) EOs against MRSA, S. aureus and E. coli bacterial strains (Figure 8).
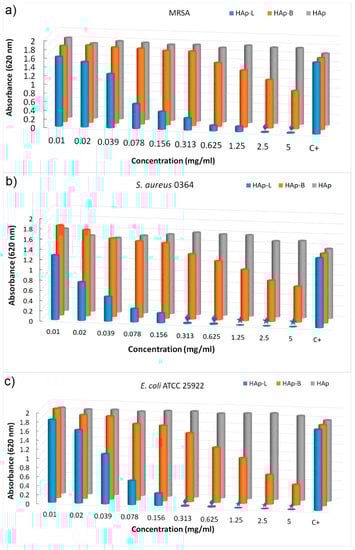
Figure 8.
Graphic representation of absorbance values of the microbial culture obtained in the presence of the plant EO-coated HAp (HAp-B and HAp-L) on different bacterial strains such as MRSA (a), S. aureus (b) and E. coli (c), quantified by the A620 nm values.
The effect of nanopowders of HAp-B and HAp-L on cell viability was appraised on different Gram-positive (MRSA and S. aureus) and Gram-negative (E. coli) bacteria (Figure 8a–c). The effects of the HAp-B and HAp-L samples tested against MRSA cell growths at different concentrations from 0.01 to 5 mg/mL are presented in Figure 8a. For HAp-L the growth of MRSA cell was diminished at concentrations greater than 0.02 mg/mL. A slow decrease in MRSA cell growth was observed for HAp-B samples. HAp-B leads to a decrease in MRSA cell growth at concentrations greater than 0.625 mg/mL. It was noticed that at concentrations lower than 0.625 mg/mL, HAp-B did not have any effect on the inhibition of MRSA cell growth. An evolution of S. aureus cell growth in the presence of the HAp-B and HAp-L was also monitored (Figure 8b). Impaired cell growth of S. aureus was observed at concentrations between 0.313 and 5 mg/mL for the HAp-B sample. Likewise, a decrease in cell growth of S. aureus was observed, starting at the lowest concentration (0.01 mg/mL), in the presence of the HAp-B sample. Additionally, the inhibitory effect of the HAp-B and HAp-L was also evaluated against E. coli bacterial cells (Figure 8c). The HAp-L inhibited the E. coli growth starting with a concentration equal to 0.02 mg/mL while the HAp-B inhibited the E. coli growth starting with a concentration equal to 0.078 mg/mL.
Taking into account the fact that the MIC is the lowest concentration of a chemical that prevents visible growth of a bacterium, it can be said that the smallest concentration of HAp-L nanopowders at which the visible inhibition of MRSA bacterial growth was evidenced was 0.039 mg/mL. The MIC value for the HAp-B sample related to the MRSA was 0.625 mg/mL. On the other hand, the visible inhibition of S. aureus bacterial growth was observed at 0.02 mg/mL for the HAp-L sample. The value of MIC related to the growth of S. aureus bacteria was registered at 0.313 mg/mL for the HAp-B sample. For HAp-L, a clear inhibition of E. coli bacterial growth at 0.039 mg/mL was observed, but the MIC value was recorded at 0.02 mg/mL. The MIC value for E. coli bacterial growth was recorded at 0.078 mg/mL for the HAp-B sample. According to Tripathi [], MBC is the concentration that leads to microbial death. In agreement with Tripathi, the MBC values at which the growth of S. aureus and E. coli was stopped by HAp-L were at concentrations of 1.25 mg/mL. On the other hand, Taylor et al. [], in their studies on “determination of minimum bactericidal concentrations of oxacillin for Staphylococcus aureus: influence and significance of technical factors”, defined MBC as the smallest concentration that kills bacteria with a reduction of 99.9%. Pankey and Sabath [], in their studies on “Clinical relevance of bacteriostatic versus bactericidal mechanisms of action in the treatment of Gram positive bacterial infections”, confirmed Taylor’s theory of MBC determination. In agreement with Taylor et al. [] and Pankey and Sabath [], the MBC value at which the development of S. aureus and E coli bacterial cells was stopped in the presence of HAp-L was 0.625 mg/mL. For MRSA, we could say that the growth of these bacterial cells was stopped at 2.5 mg/mL in the presence of HAp-L according to Taylor et al. [] and Pankey and Sabath []. A slight decrease in the cellular viability of various Gram-positive bacteria (MRSA and S. aureus) and Gram-negative (E. coli) in the presence of HAp-B was evidenced without any reduction in cellular development by 99.9%.
Taking into account the fact that antibacterial agents that are considered bactericidal may only exhibit bacteriostatic activity in vitro [] depending on the concentration at which the antibacterial materials were tested, the behavior of the HAp-B sample could be explained by the fact that the major component of the HAp-B samples was hydroxyapatite and the basil EO was poorly adsorbed onto the surface of hydroxyapatite nanoparticles.
Considering previous studies, the research presented in this paper contains the first study that highlights the MIC and MBC values of hydroxyapatite coated with lavender or basil EOs. The determination of MIC and MBC plays an important role in clinical applications when tracking bacterial response to antibiotic therapy [,]. In accordance with the research and controversy related to the bactericidal or bacteriostatic activity of materials with antibacterial properties, the studies presented in this work represent only a stage of our research on the determination of antimicrobial properties of materials based on hydroxyapatite coated with EOs (HAp-EOs). Current and future studies can provide useful information on the bacteriostatic or bactericidal activity of HAp-EOs on a wide range of bacterial strains in order to predict a favorable clinical outcome.
4. Conclusions
In this paper, the influence of the basil and lavender EOs on the morphological, physico-chemical and antibacterial properties of the HAp was analysed. The morphology of the HAp sample changed as particles agglomerated when coated with EOs. The FT-IR spectral investigations of the HAp-B and HAp-L samples revealed the presence of IR absorption bands specific to both HAp and EOs. This suggested that both basil and lavender EOs were incorporated into the HAp sample, which is in agreement with the SEM analysis and nitrogen adsorption-desorption. However, there was a reduced number of IR bands specific to basil EO present in the HAp-B sample in comparison with those specific to lavender EO identified in the HAp-L sample. The results obtained revealed that both HAp-B and HAp-L exhibited good antimicrobial activity. HAp-L and HAp-B were found to be effective in inhibiting the growth of S. aureus, E coli and MRSA bacterial strains. The results of this study suggested that the best antibacterial activity could be observed for the samples of hydroxyapatite coated with lavender EO. In conclusion, the determination of MIC and MBC values is relevant in clinical applications and allows a better understanding of the action of antibiotic agents. These results could significantly contribute to the development of new applications for the cosmetic and pharmaceutical industry. On the other hand, their use in bone reconstruction could help reduce the number of postoperative infections after various implants. Important future goals include the determination of the active antimicrobial components within the EO as well as the mechanisms involved in the process of inhibiting bacterial growth. The understanding of these mechanisms and the development of novel antimicrobial agents based on EOs available in nature presents tremendous potential for the discovery of alternatives to conventional antibiotics.
Acknowledgments
We thank A. Richard from the “Centre de Microscopie Electronique” of the University of Orléans for assistance in SEM data acquisition. This work was supported by a grant of the Romanian Ministry of Research and Innovation, CCCDI-UEFISCDI, through the project “Improvement of Life Quality by Developing new Technologies Based on Efficient Nanoparticles in Water and Soil Decontamination-PN-III-P1-1.2-PCCDI-2017-0134”, Contract Nr. 23PCCDI/2018.
Author Contributions
D.P. conceived and designed the experiments; S.L.I., F.B. and C.C. performed the in vitro experiments; D.P., S.L.I. and F.B. analyzed the in vitro data; A.G. and R.G. performed the FTIR experiments; M.S.M.-H. and G.P. performed the SEM experiments; D.P., M.S.M.-H and S.L.I, analyzed the SEM data; D.P., A.G. and R.G. analyzed the FTIR data; G.P. and C.C. contributed to the financial support for the article processing charge; D.P. wrote the paper; all authors have read the final and revised version of the manuscript.
Conflicts of Interest
The authors declare no conflict of interest.
References
- Predoi, D.; Predoi, M.V.; Iconaru, S.L.; El Kettani, M.E.C.; Leduc, D.; Prodan, A.M. Ultrasonic Measurements on β Cyclodextrin/Hydroxyapatite Composites for Potential Water Depollution. Materials 2017, 10, 681. [Google Scholar] [CrossRef] [PubMed]
- Iconaru, S.L.; Prodan, A.M.; Buton, N.; Predoi, D. Structural Characterization and Antifungal Studies of Zinc-Doped Hydroxyapatite Coatings. Molecules 2017, 22, 604. [Google Scholar] [CrossRef] [PubMed]
- Hui, L.; He, L.; Huan, L.; Xiao, L.; Zhou, L.; Guo, A. Chemical composition of lavender essential oil and its antioxidant activity and inhibition against rhinitisrelated bacteria. Afr. J. Microbiol. Res. 2010, 4, 309–313. [Google Scholar]
- Predoi, M.V. Guided waves dispersion equations for orthotropic multilayered pipes solved using standard finite elements code. Ultrasonics 2014, 54, 1825–1831. [Google Scholar] [CrossRef] [PubMed]
- Stoica, P.; Chifiriuc, M.C.; Rapa, M.; Bleotu, C.; Lungu, L.; Vlad, G.; Grigore, R.; Bertesteanu, S.; Stavropoulou, E.; Lazar, V. Fabrication, characterization and bioevaluation of novel antimicrobial composites based on polycaprolactone, chitosan and essential oils. Rom. Biotechnol. Lett. 2015, 20, 10521–10535. [Google Scholar]
- Samfira, I.; Rodino, S.; Petrache, P.; Cristina, R.T.; Butu, M.; Butnariu, M. Characterization and identity confirmation of essential oils by mid infrared absorbtion spectrophometry. Dig. J. Nanomater. Biostruct. 2015, 10, 557–566. [Google Scholar]
- Chouhan, S.; Sharma, K.; Guleria, S. Antimicrobial Activity of Some Essential Oils—Present Status and Future Perspectives. Medicines 2017, 4, 58. [Google Scholar] [CrossRef] [PubMed]
- Swamy, M.K.; Akhtar, M.S.; Sinniah, U.R. Antimicrobial Properties of Plant Essential Oils against Human Pathogens and Their Mode of Action: An Updated Review. Evid.-Based Complement. Altern. Med. 2016, 2016, 3012462. [Google Scholar] [CrossRef] [PubMed]
- Ciobanu, C.S.; Constantin, L.V.; Predoi, D. Structural and physical properties of antibacterial Ag-doped nano-hydroxyapatite synthesized at 100 °C. Nanoscale Res. Lett. 2011, 6, 613. [Google Scholar] [CrossRef] [PubMed]
- Rasband, W. Available online: http://imagej.nih.gov/ij (accessed on 10 January 2018).
- Barrett, E.P.; Joyner, L.G.; Halenda, P.P. The determination of pore volume and area distributions in porous substances. I. computations from nitrogen isotherms. J. Am. Chem. Soc. 1951, 73, 373–380. [Google Scholar] [CrossRef]
- Brunauer, S.; Emmet, P.H.; Teller, E. Adsorption of gases in multimolecular layers. J. Am. Chem. Soc. 1938, 60, 309–319. [Google Scholar] [CrossRef]
- Groza, A.; Surmeian, A. Characterization of the oxides present in a polydimethylsiloxane layer obtained by polymerisation of its liquid precursor in corona discharge. J. Nanomater. 2015, 2015, 204296. [Google Scholar] [CrossRef]
- Butoi, B.; Groza, A.; Dinca, P.; Balan, A.; Barna, V. Morphological and Structural Analysis of Polyaniline and Poly(O-anisidine) Layers Generated in a DC Glow Discharge Plasma by Using an Oblique Angle Electrode Deposition Configuration. Polymers 2017, 9, 732. [Google Scholar] [CrossRef]
- Clinical and Laboratory Standards Institute. Methods for Dilution Antimicrobial Susceptibility Tests for Bacteria That Grow Aerobically, Approved Standard, 9th ed.; CLSI: San Diego, CA, USA, 2012. [Google Scholar]
- Clinical and Laboratory Standards Institute (CLSI). Performance Standard for Antimicrobial Susceptibility Testing; Twenty Second Informational Supplement M100; CLSI: San Diego, CA, USA, 2014. [Google Scholar]
- Limban, C.; Chifiriuc, M.C. Antibacterial Activity of New Dibenzoxepinone Oximes with Fluorine and 663 Trifluoromethyl Group Substituents. Int. J. Mol. Sci. 2011, 12, 6432–6444. [Google Scholar] [CrossRef] [PubMed]
- Limban, C.; Marutescu, L.; Chifiriuc, M.C. Synthesis, Spectroscopic Properties and Antipathogenic Activity 665 of New Thiourea Derivatives. Molecules 2011, 16, 7593–7607. [Google Scholar] [CrossRef] [PubMed]
- Chifiriuc, M.C.; Palade, R.; Israil, A.M. Comparative analysis of disk diffusion and liquid medium 667 microdillution methods fortesting the antibiotic susceptibility patterns of anaerobic bacterial strains 668 isolated from intrabdominal infections. Biointerface Res. Appl. Chem. 2011, 1, 209–220. [Google Scholar]
- Iconaru, S.L.; Motelica-Heino, M.; Predoi, D. Study on Europium Doped Hydroxyapatite Nanoparticles by Fourier Transform Infrared Spectroscopy and Their Antimicrobial properties. J. Spectrosc. 2013, 2013, 284285. [Google Scholar] [CrossRef]
- Popa, C.L.; Groza, A.; Chapon, P.; Ciobanu, C.S.; Ghita, R.V.; Trusca, R.; Ganciu, M.; Predoi, D. Physicochemical Analysis of the Polydimethylsiloxane Interlayer Influence on a Hydroxyapatite Doped with Silver Coating. J. Nanomater. 2015, 2015, 250617. [Google Scholar] [CrossRef]
- Coates, J. Interpretation of Infrared Spectra, A Practical Approach, Encyclopedia of Analytical Chemistry; Meyers, R.A., Ed.; John Wiley & Sons Ltd.: Chichester, UK, 2000; pp. 10815–10837. [Google Scholar]
- Lafhal, S.; Vanloot, P.; Bombarda, I.; Kister, J.; Dupuy, N. Identification of metabolomic markers of lavender and lavandin essential oils using mid-infrared spectroscopy. Vib. Spectrosc. 2016, 85, 79–90. [Google Scholar] [CrossRef]
- Balasubramaian, K.; Kodam, K.M. Encapsulation of therapeutic lavender oil in an electrolyte assisted polyacrylonitrilenanofibres for antibacterial applications. RSC Adv. 2014, 4, 54892–54901. [Google Scholar] [CrossRef]
- Theophile, T. Infrared Spectroscopy—Materials Science, Engineering and Technology; InTech: London, UK, 2012; ISBN 978-953-51-0537-4. [Google Scholar]
- Available online: https://www.sigmaaldrich.com/catalog/product/aldrich/w212000?lang=en®ion=RO (accessed on 23 March 2018).
- Available online: https://www.sigmaaldrich.com/catalog/product/aldrich/61718?lang=en®ion=RO (accessed on 23 March 2018).
- Available online: https://www.sigmaaldrich.com/technical-documents/articles/analytical applications/gc/gc-analysis-of-lavender-flower-essential-oil-g006356.html (accessed on 23 March 2018).
- Herman, A.; Tambor, K.; Herman, A. Linalool Affects the Antimicrobial Efficacy of Essential Oils. Curr. Microbiol. 2016, 72, 165–172. [Google Scholar] [CrossRef] [PubMed]
- García-García, R.; López-Malo, A.; Palou, E. Bactericidal action of binary and ternary mixtures of carvacrol, thymol, and eugenol against Listeria innocua. J. Food Sci. 2011, 76, M95–M100. [Google Scholar] [CrossRef] [PubMed]
- Bassolé, I.H.N.; Lamien-Meda, A.; Bayala, B.; Tirogo, S.; Franz, C.; Novak, J.; Nebié, R.C.; Dicko, M.H. Composition and antimicrobial activities of Lippia multi-flora Moldenke, Mentha piperita L. and Ocimum basilicum L. essential oils and their major monoterpene alcohols alone and in combination. Molecules 2010, 15, 7825–7839. [Google Scholar] [CrossRef] [PubMed]
- Hammer, K.A.; Carson, C.F. Antibacterial and antifungal activities of essential oils. In Lipids and Essential Oils as Antimicrobial Agents; Thormar, H., Ed.; John Wiley & Sons: London, UK, 2011; pp. 255–306. [Google Scholar]
- Raut, J.S.; Karuppayil, S.M. A status review on the medicinal properties of essential oils. Ind. Crops Prod. 2014, 62, 250–264. [Google Scholar] [CrossRef]
- Conner. Naturally occurring compounds. In Antimicrobials in Foods; Davidison, P.M., Branen, A.L., Eds.; Marcel Dekker: New York, NY, USA, 1993; pp. 441–468. [Google Scholar]
- Aleksic, V.; Knezevic, P. Antimicrobial and antioxidative activity of extracts and essential oils of Myrtus communis L. Microbiol. Res. 2014, 169, 240–254. [Google Scholar] [CrossRef] [PubMed]
- Zanetti, S.; Cannas, S.; Molicotti, P. Evaluation of the antimicrobial properties of the essential oil of Myrtus communis L. against clinical strains of Mycobacterium spp. Interdiscip. Perspect. Infect. Dis. 2010, 2010, 931530. [Google Scholar] [CrossRef] [PubMed]
- Kadhim, M.J.; Sosa, A.A.; Hameed, I.H. Evaluation of anti-bacterial activity and bioactive chemical analysis of Ocimum basilicum using Fourier transform infrared (FT-IR) and gas chromatography-mass spectrometry (GC-MS) techniques. J. Pharmacogn. Phytochem. 2016, 8, 127–146. [Google Scholar]
- Cavanagh, H.M.A.; Wilkinson, J.M. Biological activities of Lavender essential oil. Phytother. Res. 2002, 16, 301–308. [Google Scholar] [CrossRef] [PubMed]
- Inouye, S.; Takizawa, T.; Yamaguchi, H. Antibacterial activity of essential oils and their major constituents against respiratory tract pathogens by gaseous contact. J. Antimicrob. Chemother. 2001, 47, 565–573. [Google Scholar] [CrossRef] [PubMed]
- Nelson, R.R. In vitro activity of five plant essential oils against methicillin resistant Staphylococcus aureus and vancomycin resistant Enterococcus faecium. J. Antimicrob. Chemother. 1997, 40, 305–306. [Google Scholar] [CrossRef] [PubMed]
- Sienkiewicz, M.; Łysakowska, M.; Pastuszka, M.; Bienias, W.; Kowalczyk, E. The Potential of Use Basil and Rosemary Essential Oils as Effective Antibacterial Agents. Molecules 2013, 18, 9334–9351. [Google Scholar] [CrossRef] [PubMed]
- Khan, A.W.; Hossain, S.J.; Uddin, S.N. Isolation, identification and determination of antibiotic susceptibility of Vibrio parahaemolyticus from Shrimp at Khulna Region of Bangladesh. Res. J. Microbiol. 2007, 2, 216–227. [Google Scholar]
- Trzcinski, K.; Cooper, B.S.; Hryniewicz, W.; Dowson, C.G. Expression of resistance to tetracyclines in strains of methicillin-resistant Staphylococus aures. J. Antimicrob. Chemother. 2000, 45, 763–770. [Google Scholar] [CrossRef] [PubMed]
- Elgayyar, M.; Draughon, F.A.; Golden, D.A.; Mount, J.R. Antimicrobial Activity of Essential Oils from Plants against Selected Pathogenic and Saprophytic Microorganisms. J. Food Prot. 2001, 64, 1019–1024. [Google Scholar] [CrossRef] [PubMed]
- Shiferaw, S.; Ahmad, M. Prevalence and antibiotic susceptibility of Staphylococcus aureus from lactating cow’s milk in Bahir Dar dairy farms. Afr. J. Microbiol. Res. 2016, 10, 1444–1454. [Google Scholar]
- Mahmoud, A.H.; Samy, M.N.; Abdelmohsen, U.R.; Abd El-Baky, R.M. Effect of tobacco tar on Staphylococcus aureus and Candida albicans biofilm formation. Afr. J. Microbiol. Res. 2000, 11, 372–384. [Google Scholar]
- Tripathi, K.D. Essentials of Medical Pharmacology, 7th ed.; Jaypee Brothers Medical Publishers: New Delhi, India, 2013; pp. 696–697. [Google Scholar]
- Taylor, P.C.; Schoenknecht, F.D.; Sherris, J.C.; Linner, E.C. Determination of minimum bactericidal concentrations of oxacillin for Staphylococcus aureus: Influence and significance of technical factors. Antimicrob. Agents Chemother. 1983, 23, 142–150. [Google Scholar] [CrossRef] [PubMed]
- Pankey, G.A.; Sabath, L.D. Clinical relevance of bacteriostatic versus bactericidal mechanisms of action in the treatment of Gram positive bacterial infections. Clin. Infect. Dis. 2004, 38, 864–870. [Google Scholar] [CrossRef] [PubMed]
- Lamb, H.M.; Figgitt, D.P.; Faulds, D. Quinupristin/dalfopristin: A review of its use in the management of serious gram-positive infections. Drugs 1999, 58, 1061–1097. [Google Scholar] [CrossRef] [PubMed]
- Bär, W.; Bäde-Schumann, U.; Krebs, A.; Cromme, L. Rapid method for detection of minimal bactericidal concentration of antibiotics. J. Microbiol. Methods 2009, 77, 85–89. [Google Scholar] [CrossRef] [PubMed]
© 2018 by the authors. Licensee MDPI, Basel, Switzerland. This article is an open access article distributed under the terms and conditions of the Creative Commons Attribution (CC BY) license (http://creativecommons.org/licenses/by/4.0/).