
Oil-Immersed Power Transformer Condition Monitoring Methodologies: A Review


1
School of Electrical Engineering, Computing, Mathematical Sciences, Curtin University, Perth, WA 6845, Australia
2
BHP, Perth, WA 6000, Australia
*
Author to whom correspondence should be addressed.
Energies 2022, 15(9), 3379; https://doi.org/10.3390/en15093379
Submission received: 1 April 2022
/
Revised: 29 April 2022
/
Accepted: 1 May 2022
/
Published: 6 May 2022
Abstract
:A power transformer is one of the most critical and expensive assets in electric power systems. Failure of a power transformer would not only result in a downtime to the entire transmission and distribution networks but may also cause personnel and environmental hazards due to oil leak and fire. Hence, to enhance a transformer’s reliability and extend its lifespan, a cost-effective and reliable condition monitoring technique should be adopted from day one of its installation. This will help detect incipient faults, extend a transformer’s operational life, and avoid potential consequences. With the global trend to establish digital substation automation systems, transformer online condition monitoring has been given much attention by utilities and researchers alike. Several online and offline condition monitoring techniques have been recently proposed for oil-immersed power transformers. This paper is aimed at providing a state-of-the-art review for the various condition monitoring technologies used for oil-immersed power transformers. Concept of measurements and analysis of the results along with the future trend of condition monitoring techniques are presented.
1. Introduction
Oil-immersed power transformers are widely used in the power systems due to their ability to handle higher voltage levels than dry-type transformers. Owing to the fact that power transformers are constantly operating under harsh thermal, electrical, and mechanical stresses, they are prone to several types of faults. Faults such as windings and core mechanical deformation, partial discharge, overheating, and arcing result in deterioration to the transformer’s mechanical integrity and/or degradation to the dielectric insulation system [1]. While the transformer may operate normally with incipient faults, some faults such as winding axial displacement can progress rapidly and lead to catastrophic consequences if not detected and rectified at an early stage [2]. Short-circuit faults and overloading can further increase the probability of unexpected failures of power transformers.
A survey on the power transformer failures within Australia was conducted by the University of Queensland in the year 2017 [3]. The survey was conducted on 6057 power transformers that represented 98% of the Australian fleet. Collected data show that 199 transformer failures, representing 3.29% of the analyzed transformers, were reported during the period 2000 to 2015. The statistics reveal a high number of non-catastrophic failures occurred in the 30 to 49 years age group while a higher catastrophic failure rate occurs in age groups 0 to 9 years and above 49 years. The causes of the failures have been divided into five major groups: bushings, on-load tap changer (OLTC), windings, insulation system, and others, with the failure distribution profile as shown in Figure 1 [3]. This survey shows the necessity to adopt a reliable condition monitoring technique for various power transformer components. Figure 2 shows the main components of the power transformer along with the required parameters to monitor each component [4,5].
Over the years, a wide variety of sensor technologies that can be used for online or offline fault diagnostic methods have been developed for power transformer condition monitoring systems [6]. In Section 2 of this paper, nine typical offline power transformer diagnostic methods are presented.
Compared to offline testing methods, online condition monitoring has several advantages including timely information about transformer health conditions, incipient fault detection that helps asset managers make a proper and timely decision, reduction of the probability of unplanned downtime due to catastrophic failures, decrease the loss of production costs due to transformer outage, and minimize the risk for personnel since they need less frequent access to the high voltage substation. Therefore, it is necessary to keep improving the online condition monitoring methods for oil-immersed power transformers. Four commonly known online methods are presented in Section 3 of this paper. Figure 3 shows all offline and online condition monitoring methods for oil-immersed power transformers currently used by the industry. The purpose of this comprehensive review is to present and discuss various online/offline condition monitoring methods for power transformers.
2. Offline Condition Monitoring Methods
2.1. Degree of Polymerization of Insulation Paper
The insulation paper and pressboard within the transformer is made of cellulose polymer. With transformer aging over the time, the structure of cellulose polymer as shown in Figure 4 becomes fragile, causing paper insulation to lose its dielectric and mechanical strength. The length of the cellulose chain is measured by the number of monomer units in the polymer, also known as degree of polymerization (DP). The quality of cellulose is a function of the DP value that can be measured using average viscosity method [7,8].
In general, new transformers indicate around 1000–1400 DP values [9]. When DP drops to 100–250, it is considered the end of the paper’s life which corresponds to the end of the transformer’s life [9]. To measure the DP, paper samples are collected from different spots of the transformer windings, which is impractical for operating transformers. Therefore, this method is only performed during planning for transformer replacement. Other indirect methods, such as Furan analysis, can be used to estimate the paper DP value.
2.2. Furan Analysis
Furan analysis is a feasible diagnostic tool to assess the paper insulation condition for oil-immersed power transformers. Cellulose degradation due to high temperature, oxygen, moisture and acid contents generates five chemical furan compounds as listed in Table 1 [10,11].
The concentration of these furan compounds in parts per million (ppm) can be measured using high-performance liquid chromatography (HPLC) or gas chromatography-mass spectrometry (GC/MS) in a laboratory environment [12,13]. From industry practice, 2-FAL is considered as the main compound due to its high generation rate and stability in the oil [10]. A strong correlation between 2-FAL measurements and DP value as shown in Table 2 has been reported in the literatures and IEEE guides [12,14]. This correlation facilitates a non-intrusive diagnostic option to replace the DP test. However, this test is normally performed in the lab by trained personnel and expensive equipment. Additionally, there is no standard code correlating furan to DP for biodegradable oil and thermally upgraded paper yet.
A new method based on ultraviolet-to-visible (UV-Vis) spectroscopic technology along with artificial intelligence is proposed in [15] to estimate the concentration of the 2-FAL compound in a transformer oil sample. UV-Vis spectroscopic diagnostic is based on the absorbance of the light by the contaminations in transformer oil [16]. Hence, this technology can also be used to assess the quality of transformer oil and quantify the reduction in its lifetime [16,17]. The proposed UV-Vis spectroscopic method is low cost, easy to perform by unexperienced personnel, and can be conducted onsite or implemented online. However, this method has not been tested widely on operational transformers.
2.3. Interfacial Tension Analysis and Acidity
Interfacial tension (IFT) analysis and acidity number measurement are used to assess oil quality. Contaminations and degradation products can affect insulating oil’s physical and electrical properties and hence reduce IFT of the oil. Additionally, when oil is oxidized, one of the by-products is acid [18]. To perform IFT measurement, a planar ring with circumference d is inserted into a container filled with insulating oil and water mixture. It then measures the interfacial force (F, dyne/cm) required to lift the ring 10 mm upward through the oil–water interface [18]. IFT analysis is detailed in standard ASTM D971. In general, transformers ≤ 69 kV with IFT ≤ 22 dynes/cm; and transformers > 69 kV with IFT ≤ 25 dynes/cm are considered to approach the end of insulating oil service life. The conventional IFT test requires a trained person and expensive equipment to conduct the measurements. Therefore, the test is normally performed in a laboratory environment. There has been research on using UV-Vis spectrum method to determine the IFT value of a transformer oil sample [19]. This spectroscopic measurement is based on measuring energy level in atoms and molecules. The measurements can then be analyzed using an artificially intelligent software tool to estimate the IFT value. This method has an online application feasibility but has not been tested in the practical field yet.
Acidity number, also known as neutralization number (NN), is a reflection of the acids in the insulating oil. The measurement represents the mass of potassium hydroxide (KOH) in milligrams (mg) needed to neutralize the acid in one gram (gm) of the oil. The NN increases as the transformer ages. The limitation of NN is stated in standard ASTM D974. In general, transformers ≤ 69 kV with NN ≥ 0.20 mg KOH/gm; transformers of rated voltage between 69 kV, 230 kV with NN ≥ 0.15 mg KOH/gm; and transformers ≥ 230 kV with NN ≥ 0.10 mg KOH/gm are considered to be in critical condition in terms of oil quality.
2.4. Oil Dielectric Breakdown Voltage
Oil dielectric breakdown voltage (BDV) test is a common method used to determine the breakdown voltage of insulating oil. As a transformer ages, the insulating oil degrades and decomposes, resulting in moisture, sludge, gases, and impurities that decrease the dielectric strength of the insulating oil [20].
The BDV test can be performed on-site using a mobile test device. According to the standard IEC 60156, the test is conducted by applying a steady incremental voltage of 2 kV/s until breakdown occurs at the electrode, which is immersed in the insulating oil sample. The test is repeated at least six times and the average value of the measurements is considered as the oil BDV [21]. The correlation of the transformer oil dielectric strength and the oil BDV is detailed in the standard IEEE C57.106 [22]. In general, an oil of BDV that is less than 30 kV calls for further investigation and correction action [23].
An online BDV test unit is currently under development. The idea is to install the detection unit near a transformer and connect it to the main oil tank, allow oil to continuously circulate in a closed loop through the measuring unit.
2.5. Insulation Resistance Test
The insulation resistance (IR) test is designed to evaluate the insulation resistance of power transformers. IR value reveals the insulation degradation due to contamination, moisture, and severe cracking. The test is performed by applying a constant DC voltage for 10 min between windings or windings and ground [24,25]. IR values are measured every minute or less in MΩ using a metering instrument called Megger or Megohmmeter. Typical trend of IR measurements is shown in Figure 5 [25]. A single IR result is not enough to determine the insulation status [26]. An insulator is considered to be a capacitor where, with the application of voltage, a charging current will flow. If the insulation is contaminated, the charging time is typically 1 min [25]. After 10 min of testing, the IR value can reach a stable level. Historical trending results for IR are useful to monitor insulation condition over years [26]. If the IR value drops from the previous test, further investigation and analysis will be required.
Polarization index (PI) is another parameter used to evaluate the insulation condition. The common calculation of PI uses IR measurements taken in 1 min (IR1min) and 10 min (IR10min) as given by (1) [25,27]. A sharp decline in PI is an indication to severe insulation degradation [26].
The limitation of the IR test is its inability to identify the IR value of each individual insulation system such as bushings, paper, and oil.
2.6. Dissipation Factor Measurement
Dissipation factor (DF) analysis is used to assess bushings and insulation condition. This offline test is performed periodically on bushings and windings [28]. The insulation is a dielectric material, which can be considered in an ideal case as a pure capacitor. Over time, the permittivity of the material changes due to aging, and it causes capacitive current variations. Additionally, resistive leakage current increases due to the deterioration of the material.
Dissipation factor, also known as power factor or tan delta, presents the ratio between the capacitance current and resistive current components through the insulation. Figure 6a shows a simple equivalent model of a dielectric structure. On an isolated transformer, AC voltage up to 10 kV is energized through the bushings [29]. Ideal insulation shows the capacitive current leading the applied voltage by 90 degrees as shown in Figure 6b [30]. Hence, the total current I equals the capacitive current IC, and the DF (tan δ) is zero.
However, some leakage current (resistive current IR) through the insulation surface increases due to the contamination or carbonization in the insulation, and it represents the resistive loss, also called Watt-loss. The term tan delta (tan δ) presents the ratio between the resistive IR and capacitive IC current components, and power factor (cos θ) represents the fraction of IR with respect to the total current I.
The DF and power factor (PF) calculations are given by (2) and (3), (3) respectively [29,30]. Any changes in these values indicate power dissipated in the insulation. Lower DF and PF means lower dielectric losses [13]. For mineral-oil-immersed power transformers in normal condition, PF is lower than 0.5%. PF value between 0.5% and 1% could be acceptable, whereas a PF value over 1% is an indication of insulation degradation [13].
The value of DF represents the average index of the dielectric integrity considering both capacitive and resistive currents in the apparatus. For detailed analysis of insulation quality, the trend of IC and IR variation is investigated. The main drawback of DF analysis is that it provides an average condition of insulation integrity, and the results are sensitive to the ambient temperature [13]. This test is generally performed on-site during commissioning, regular maintenance, or malfunction investigation. The results of DF measurement are compared to previous DF rates for analyzing the trend of insulation degradation.
Online PF measurement is available for assessing the insulation condition of bushings. Figure 7 shows the equivalent circuit for a bushing’s PF setup [29]. The bushing has dielectric resistance RX shunted by a capacitance CX, with bushing tap U2 connected to the ground through an impedance ZM. The voltage U2 is compared to a reference voltage U1. Bushing condition changes result in changes in the amplitude and phase of U2 with respect to the reference voltage.
2.7. Dielectric Response Methods
Impurities such as moisture and aging by-products in oil-paper insulation system increase the dielectric losses [31]. Moisture content and contaminations such as sludge result in polarization within the dielectric molecules [32]. Moisture, temperature, aging, and other factors lead to different characteristics of polarization. These phenomena can be identified by the dielectric response methods listed below [33]:
- Recovery/return voltage measurements (RVM)
- Dielectric spectroscopy in time domain—polarization/depolarization currents (PDC)
- Dielectric spectroscopy in frequency domain/frequency domain spectroscopy (FDS)
These three techniques are elaborated below.
2.7.1. Recovery/Return Voltage Measurement
Recovery voltage measurement (RVM) is utilized to analyze the slow polarization process of the oil and paper insulation [33,34]. The basic measuring circuit for RVM is shown in Figure 8a. By applying a step DC voltage U0 and closing switch S1, the insulation is charged for a specific time period tc. This results in a polarization current flow through the insulation after which the insulation is short-circuited by opening switch S1 and closing switch S2 for a certain time td, allowing depolarization current to flow. Switch S2 is opened after the short-circuit period while switch S3 is closed to measure the recovery voltage. The charging/discharging time and recovery voltage are shown in Figure 8b. The initial slope dUr/dt of the recovery voltage reveals the polarization characteristics [34,35].
Interpretation of RVM results is based on the magnitude and position of the maximum recovery voltage [36]. In the polarization spectrum profile shown in Figure 9, parameters such as the maximum recovery voltage Urmax along with the central time constant are utilized for assessing the insulation condition [37,38,39]. The central time constant is the charging time to the peak value of the recovery voltage.
In general, an insulation system with a higher moisture content has a relatively shorter charging and discharging time. On the other hand, an insulation system with lower moisture content has a relatively slow polarization response [37]. RVM from factory acceptance testing (FAT) can be used as a reference to monitor the trend of insulation state with future test results.
2.7.2. Polarization/Depolarization Currents
Polarization/depolarization currents (PDC) method is also a time domain analysis to assess the transformer’s insulation condition. PDC measures the polarization and depolarization currents [40]. The basic test circuit is similar to RVM, only the measured parameters are the currents as shown in Figure 10a. The polarization current ip is measured when switch S1 is closed and switch S2 is open. The depolarization current id is measured when S1 is open and S2 is closed. Figure 10b shows that the test is performed by applying a step DC voltage U0, to charge the insulation for a specific period tp, then short-circuit the insulation for a certain time td. Water content and contamination increase the insulation conductivity. Higher values of conductivity raise the polarization and depolarization currents [36,41]. Figure 11 shows the variation in the polarization and depolarization currents (Ip and Id) corresponding to insulation conductivity. Insulation with higher conductivity has higher PDC values [40]. The advantage of PDC method over RVM and frequency domain spectroscopy is its ability to assess paper and oil’s status separately.
2.7.3. Frequency Domain Spectroscopy
In the frequency domain spectroscopy (FDS) method, an AC voltage is applied to the test object with a frequency starting from 1 kHz to 1 mHz as shown in the basic circuit of Figure 12a. The voltage and current measurements are recorded at each testing frequency point. Dielectric parameters such as relative complex permittivity, complex capacitance, and dissipation factor (tan δ) can be obtained from this test [42]. These parameters reflect the polarization characteristics of an oil-paper insulation system.
In Figure 12b, a typical dielectric response of the oil-paper insulation system is presented as a dielectric dissipation factor (tan δ) curve. The variation of dissipation factor with frequency indicates the aging and moisture content in both paper and oil insulation. According to the curve, the response for oil insulation dominates the frequency range of 0.1 Hz to 10 Hz, and dissipation factor increases towards the lower frequencies [43].
2.8. Sweep Frequency Response Analysis
Sweep frequency response analysis (SFRA) is mainly used to assess the mechanical integrity of a power transformer. Ideally, this test should be performed after the installation of the transformer to record its healthy frequency response signature that can be compared with future signatures to detect any anomalies [44]. The measurement is conducted using a frequency response analyzer that injects a low AC voltage (10 V) of wide frequency range (up to 2 MHz) into the terminal of each phase while measuring the response at the other terminal. The frequency response signature could be in the form of winding impedance, admittance, or transfer function (in dB) as shown in Figure 13, which also shows the phase angle of the three phases of the low-voltage windings. The measured response is compared with the reference signature to detect any variations. If the refence signature is not available, other methods such as comparison with the signature of a sister transformer or phase-to-phase comparison is used.
While the SFRA measurement is well developed and standardized, analysis of the obtained results is still a challenging task. Some attempts have been published in the literature in order to identify and quantify mechanical faults based on SFRA signature. Most of these techniques are developed based on artificial intelligence [45], statistical coefficients [46], and the estimation of transformer equivalent circuit parameters [47]. While the current industry practice only looks at the SFRA magnitude signature, some studies proposed the integration of SFRA magnitude and phase angle plots into 2D or 3D plots to facilitate the application of digital signal processing techniques and improve the accuracy of the interpretation process [48].
The main drawback of the SFRA measurement technique is its offline nature that calls for taking operating transformers out of service. Some attempts were published in the literature for the possibilities of using the natural switching operation, lightning, and impulse signal for online SFRA measurements [49,50]. However, none of these techniques has been implemented in real field applications yet. The main issue of implementing online SFRA measurements is the requirement to impose a signal of a wide frequency range to the electricity grid in which the power frequency should be maintained at 50 or 60 Hz. Some studies proposed the use of transformer I–V Lissajous patterns at the power frequency [51] as an alternative online technique to the offline SFRA method. However, this method has not been tested in real field applications yet.
2.9. Transformer Turns Ratio Test
The transformer turns ratio (TTR) test can be used to determine insulation failure between turns, core structure insulation failure, or inter-winding insulation failure. TTR test is normally performed during commissioning and planned maintenance periods [52].
TTR test needs to be checked on each tap position and calculated for all three phases. To calculate the voltage ratio Vratio, a reduced voltage Vp is applied to the primary side, resulting in a voltage Vs on the secondary side. The primary and secondary terminal voltages are proportional to the respective number of turns, the primary side Np, and the secondary side Ns. Therefore, the ideal turns ratio is given by (4) [53].
The measurements are compared to the ratios on the nameplate for all windings and tap positions. The limitation of the difference ∆ratio given by (5) should be within 0.5%, and for new transformers, this tolerance is within 0.1% [30].
The TTR is a popular offline method due to the availability of test devices [54]. It is also an important test for transformers operating in parallel. If the turns ratio of two parallel transformers is not equal, the voltage difference between transformer outputs will generate circulating current through busbars. Even small turns ratio error will cause significant equalization current and result in excess heat and power losses [54].
3. Online Condition Monitoring Methods
3.1. Dissolved Gas Analysis
Dissolved gas analysis (DGA) is one of the widely used methods to detect transformer internal faults [55]. This method has been developed based on the fact that under harsh operating conditions, insulating oil and paper decompose and release certain gases that dissolve in the oil and decrease its dielectric strength [56]. The fault gases include hydrogen (H2); methane (CH4); ethane (C2H6); ethylene (C2H4); acetylene (C2H2); carbon monoxide (CO); and carbon dioxide (CO2). Oxygen (O2) and nitrogen (N2), which are not produced by faults, are also measured. The amount and type of these gases can be used to identify and quantify different types of faults. Table 3 summarizes the fault types and the key gasses corresponding to each fault.
The conventional offline DGA measurement is conducted in a laboratory environment using gas chromatography (GC) [57]. While this technique is very accurate, it involves several standards that must be followed since the collection of oil samples occurs from operating transformers, transporting the sample, and storing it [58]. Moreover, this technique incurs a running cost, takes a relatively long time, and has to be conducted by an expert. As such, several online DGA sensors, such as online GC, photo-acoustic spectroscopy (PAS), and online hydrogen detection, have been developed over the last few years [59].
To perform online DGA, the monitoring sensor is placed in direct contact with the transformer and a pump is required to circulate the oil through the measuring unit. It usually takes three steps: gas extraction, gas detection, and data analysis.
3.1.1. Gas Extraction
A gas extraction device is installed for the online GC and PAS detection. The headspace technique is a matured membrane-based dissolved gas-in-oil analysis method. It applies negative pressure to the top space for the dissolved oil extraction [60]. This technology is highly efficient, has a low risk of gas pollution, and is easy to maintain. Figure 14 shows a diagram of the working principle for a Teflon-coated membrane (Teflon AF2400) [61,62]. The membrane acts as a physical barrier, only allowing gas to migrate between the gas phase and liquid phase. A quality membrane should offer excellent gas permeability, oleophobic characteristics, and chemical and thermal stability.
3.1.2. Gas Detection
Gas Chromatographic (GC)
The most common GC detectors are thermal conductivity detector (TCD) and flame ionization detector (FID). These types of detectors are normally used as a combined method in a laboratory environment due to their limitations. For example, TCD sensitivity to detect hydrocarbon gases is low. FID is insensitive to hydrogen and requires several types of carrier/auxiliary gases including hydrogen, which is not allowed to be used inside substations due to its potential flammable hazards. A solid oxide fuel cell (SOFC) sensor is a newly developed online GC detector [63]. It has high sensitivity and good repeatability to detect H2, CO, CH4, C2H4, C2H6, and C2H2. The sensitivity to detect C2H2 is 0.05 ppm, while it is 0.5 ppm in the case of FID and TCD sensors.
Figure 15 shows the basic framework of an online DGA system using GC with a SOFC detector. From the diagram, the dissolved gas mixture is firstly separated from oil in a gas extraction unit. Since different gases have different adsorption coefficients [64], the gas mixture of H2, CO, CH4, C2H4, C2H6, and C2H2 is separated when passing through a chromatographic column and detected by the SOFC sensor. The voltage output of the SOFC detector, as shown in Figure 16, is then sent to a data acquisition unit to be converted into digital signals representing the concentration of each gas.
Photo-Acoustic Spectroscopy (PAS)
Although GC technique can accurately detect the dissolved gases, it consumes carrier gases. Additionally, after extended use, it requires calibration and replacing of the chromatographic column and sensors due to the change in their properties [65]. A photo-acoustic spectroscopy (PAS) sensor uses indirect absorption spectroscopy and overcomes GC’s limitation.
Figure 17 shows the principle of PAS that is based on photo-acoustic effect. The dissolved gases inside an enclosure container absorb light energy and increase the gas molecules’ kinetic energy, resulting in a temperature increment on the macroscopic level. This heat leads to pressure fluctuations (sound waves) and can be detected by a sensitive microphone. The concentrations of the gases are measured based on the amplitude of the photo-acoustic signal detected by the microphone [66,67,68].
The schematic diagram of a PAS unit is shown in Figure 18 [59]. In this system, the light from the laser source passes through the light chopper and is measured using a photo-acoustic cell. The light chopper wheel rotates and switches the light on and off. The frequency of the light chopper is measured with a photo detector and is used as a reference frequency. The performance of the PAS detection unit mainly depends on the laser light source characteristics. If the frequency of the light coincides with the gas absorption band, the gas molecules will absorb part of the light. According to the Beer Lambert Law, the higher the concentration of the gas in the cell, the more light will be absorbed. Figure 19 shows the electromagnetic spectrum of light. The spectrum includes γ-radiation, X-ray, ultraviolet (UV), visible light, infrared red light, microwaves, and radio waves. The absorption spectrum for gas molecules mostly falls into three regions: near infrared (NIR), middle infrared (MIR), and far infrared (FIR) [69]. The system uses various types of laser light sources to increase the detection sensitivity. An optical microphone is used to reduce the electromagnetic interference from the harsh environment around the transformer. It also uses an optical power meter to monitor and avoid the power drift of the light source under long operational periods [70].
Online Hydrogen (H2) Detection
Table 4 shows that dissolved H2 in transformer oil samples can be a result of partial discharge, thermal faults, and arcing [58]. According to this table, the increase of H2 concentration can be used as an indicator for most major faults. In a transformer’s normal operation, H2 concentration should be lower than 100 ppm [71]. Although GC and PAS techniques are capable of detecting hydrogen, these techniques require a gas extraction component. An online hydrogen sensor is used directly in contact with transformer oil without a gas and oil separation membrane. Therefore, it requires fewer components to manufacture. The cost-effective hydrogen sensor offers an option for lower budget condition monitoring.
Using gas-sensitive detection materials is a fundamental principle for the H2 detector. Over the years, there has been substantial research in metal-hydrogen catalytic effects [72]. In 1868, Thomas Grahab discovered the absorption of hydrogen by palladium (Pd) during electrolysis [73]. Studies show that Pd has high hydrogen solubility and is superior as a gate material for small amounts of hydrogen at room temperature [73]. When H2 molecules come in contact with a Pd surface, H2 atoms diffuse into a Pd lattice and form palladium hydride (PdHx), as shown in Figure 20 [74,75]. As a result, H2 absorption causes volume expansion in the Pd structure and leads to a change in resistance (∆R), then the signal conditioning circuit converts the resistance variation into hydrogen concentration [75,76].
In a palladium–hydrogen system, if incorporated H2 atoms exceed the maximum H2 solubility in the Pd layer, this can cause hysteretic behaviour in the resistance with irreversible structural changes in the Pd layer [76]. This affects the sensor performance and results in a loss of long-term stability. Hence, a variety of Pd alloys such as Pd–Mg, Pd–Au, Pd–Ag, and Pd–Ni have been studied [71]. Pd combined with Ni has already been implemented in industrial hydrogen sensors, e.g., Siemens Energy’s SITRAM Guard hydrogen sensor.
3.1.3. DGA Data Interpretation
The various DGA diagnostic techniques currently used by worldwide utilities include (a) Key Gas Method (KGM); (b) Rogers’ Ratio Method (RRM); (c) Doernenburg Ratio Method (DRM); and d) Duval Triangle Method (DTM) [77]. Currently, all the DGA interpretation guides are based on laboratory results. There is no widely accepted guideline for online DGA [77,78].
- (a)
- Key Gas Method
According to IEEE Std C57.104—2019, Key Gas Method (KGM) can be used to diagnose four types of faults: thermal degradation, overheating in oil and cellulose, partial discharge (PD), and arcing as shown in Table 5. For thermal degradation fault diagnosis, if the hotspot temperature exceeds 300 °C, the key gas C2H4 along with C2H6, CH4, and H2 will be formed. When the temperature is over 700 °C, C2H2 will be formed [79].
For overheating in oil and cellulose fault diagnosis, CO along with C2H4, C2H6, CH4, and H2 will be found in the oil. For partial discharge fault diagnosis, H2 along with CH4, and a much smaller amount of C2H4 and C2H6, will be found in the oil.
High-energy arcing can produce high temperatures between 2000 °C to 3000 °C or even higher [80,81]. When the temperature exceeds 700 °C, the key gas C2H2 will be formed along with H2, CH4, C2H4, and C2H6, and CO, which comes from insulating paper breakdown, will be found in the oil [79].
The limitation of KGM is its conservative nature as it relies more on the absolute concentration of the gas rather than gas evolution. The failure rate is about 50% for inconclusive or wrong fault identification [77]. Additionally, CO is not always a good indicator for thermal fault in insulating paper.
- (b)
- Rogers’ Ratio Method
Rogers’ ratio method (RRM) uses the three gas ratios C2H2/C2H4, CH4/H2, and C2H4/C2H6 to identify five different faults as shown in Table 6. Compared to KGM, RRM can further diagnose three levels of thermal faults: low temperature, temperatures less than 700 °C, and temperatures over 700 °C. For instance, if the ratio of C2H4/C2H6 falls between 1.0 to 3.0 and the ratio CH4/H2 is larger than 1.0, then the transformer health condition is considered to be in case 4—thermal fault less than 700 °C. RRM has limited capabilities to identify faults even when the concentration of some gases is high [77].
- (c)
- Doernenburg Ratio Method
Doernenburg ratio method (DRM) uses four gas ratios—CH4/H2, C2H2/C2H4, C2H2/CH4, and C2H6/C2H2—to identify three different faults: thermal decomposition, corona, and arcing, as shown in Table 7.
From the table, if the ratio CH4/H2 is more than 1.0, the ratio C2H2/CH4 is compared with the threshold limit (0.3) and the ratio C2H6/C2H2 is compared with the threshold limit (0.4). If C2H2/CH4 is larger than 0.3, it is more likely to be an arcing fault. To apply DRM, at least one of the four key gases used in the ratios (H2, CH4, C2H2, and C2H6) needs to exceed twice the relevant L1 concentration shown in Table 8 [59]. DRM is an old diagnosis method and due to its low accuracy, it is not commonly used nowadays [77].
- (d)
- Duval Triangle Method
Duval triangle method (DTM) uses the graphical triangle shown in Figure 21 to diagnose various fault types. This method employs the concentration of three gases: CH4, C2H2 and C2H4, which are presented as the triangle sides with a percentage from 0% to 100%. In DTM, the entire triangular area has been subdivided into seven fault regions labelled PD, D1, D2, T1, T2, T3, and DT with a detailed code as given in Table 9 [77].
Using (6)–(8), the gas concentration in percentage can be calculated and used in the Duval Triangle to locate the fault region. An example is given in Figure 21, when %CH4 is 34.5%, %C2H4 is 31%, and %C2H2 is 34.5%, the possible fault is D2—discharge of high energy, according to Table 9.
Although the classic Duval Triangle can diagnose the basic faults, misclassification can happen when the located point is close to the boundaries between adjacent sections. Additionally, the analysis of the Duval Triangle can be inaccurate for a transformer with a load tap changer and a non-mineral liquid transformer. Hence, various modified Duval Triangles along with other geometrical shapes such as the pentagon have been introduced [6,59,77,78].
Duval pentagon method (DPM) is similar to DTM. Instead of three key gases, DPM employs five key gases: H2, CH4, C2H2, C2H4, and C2H6 and can diagnose six fault types (PD, D1, D2, T1, T2, and T3) along with stray gassing (S) in mineral oil as shown in Figure 22. This method also exhibits misdiagnosing for faults close to the boundaries between adjacent sections.
Online DGA method has been implemented for the online condition monitoring system. However, all diagnostic methods are initially designed to determine a single fault. When the transformers experience multiple faults, they are difficult to identify with certainty [77]. Therefore, developing new diagnostic methods based on artificial intelligent methods can improve the accuracy of such systems [58,69].
3.2. Partial Discharge
Partial discharge (PD) is a localized dielectric discharge that partially bridges the insulation between conductors or between conductors and earth [82]. In oil-immersed transformers, PD can occur in insulating paper, oil, or at the interface of oil–paper insulation. During long-term operation, moisture, gas bubbles, and electrode burrs are generated inside the transformer, resulting in PD phenomena [83]. Additionally, the insulation defects due to overvoltage can cause PD and accelerate insulation aging [83].
Over time, PD activity deteriorates the transformer performance and leads to further degradation to the dielectric insulation system. Once PD has started, it can propagate throughout the insulation until complete breakdown [84]. Hence, early detection of PD during operation is important to prevent transformer failure. Accuracy of the online PD detection techniques in power transformers is based on several parameters such as electromagnetic emission, acoustic emission, and chemical changes [83]. These techniques are elaborated below.
3.2.1. Ultrahigh-Frequency (UHF) Detection
PD events produce electromagnetic pulses with frequencies within the UHF range (300 MHz to 3 GHz) [85]. In general, the interference signal frequency range on-site is below 400 MHz [83]. Hence, UHF sensors are widely used due to their high sensitivity and immunity to noise [86,87]. This method was developed for gas-insulated switchgear (GIS) in 1988 and in 1997, it starts to be applied for power transformers [88].
UHF sensors can be mounted inside or outside the wall surface of the tank or through an oil drain valve. In order to pinpoint the PD sources, multiple UHF sensors around a transformer tank are utilized [89]. Localization of the PD source can be achieved by time differences of arrival (TDOA), which measures and compares the captured signals arrival time from different sensor locations [89,90].
UHF sensors are considered to be antennas that receive electromagnetic (EM) waves from PD sources. The original UHF signals pass through a filter to eliminate noise [88,91]. An amplifier is connected to the filter in order to maintain measurement sensitivity. The signals are transmitted by coaxial cables to the detector and sampled by data acquisition (DAQ) as per the process shown in Figure 23.
UHF has two common methods: tuned UHF narrowband or medium band measurement with variable centre frequency; and UHF broadband measurement with fixed bandwidth [92,93]. Figure 24a shows an example of PD signal measured by tuned UHF narrowband/medium band method [92]. The lower trace in the figure is the background noise while the upper trace is the actual PD signal. It is worth mentioning that the interference noise disturbs both the upper and lower traces [92]. Figure 24b shows a PD signal measured by the broadband UHF method with fixed bandwidth [92]. The setting of this is easy to adapt, however, it has lower signal-to-noise ratio (SNR) [92].
UHF detection has advantages of immunity against electromagnetic disturbances compared to the conventional methods presented in IEC 60270 [88]. Therefore, UHF sensors have been employed for on-site PD detection. However, it is uncertain to identify the correlation of the UHF signal magnitude to the amount of charge in pC, which results in a lack of suitable calibration methods [88].
3.2.2. Optical Detection
The acoustic emission (AE) method measures the amplitude, attenuation, or phase delay of acoustic signals that are produced from PD. Ultrasonic AE frequency lies between the 20 kHz to 500 kHz range [85]. The traditional AE sensors’ detection element is lead zirconate titanate (PZT)-based material [94]. It is difficult to ensure the sensitivity and accuracy of PD detection, especially if it is highly affected by the electromagnetic interference (EMI) [95,96]. Optical fibres have advantages of anti-EMI. The traditional optical sensor is designed to detect the light from a PD event. However, this type of optical sensor is unable to localize the PD source. To overcome these drawbacks, optical sensors based on AE have become more popular. In addition, optical sensors can be installed inside the transformer tank walls due to its compact size and the lack of using metal materials [83,95].
There are three main types of optical technology: extrinsic Fabry–Perot (FP) based sensor, dual-beam interference based sensor (intrinsic interferometer) and Fibre Bragg Grating (FBG) based sensor. A brief comparison of various optical detection technologies is given in Table 10 [83,94,96].
The Fabry–Perot interferometer sensor is a typical fibre-optic interferometer [96]. In the sensor structure shown in Figure 25, the light from a laser light source propagates into the sensing probe through a fibre coupler. The first reflection of the light occurs in the FP cavity which is at the end of the fibre core. A small amount of incident light returns along the original path of the fibre core. Most of the light undergoes the second reflection at the quartz membrane of the FP cavity. The second reflection also returns back to the fibre coupler. By adjusting the quartz membrane, the two beams of light can be of the same frequency, amplitude, and direction at the fibre coupler. The PD event changes the quartz membrane shape and the phase of the second reflected light and can be detected by a photo-detector, which generates an electrical signal as shown in Figure 26 [83,97].
The working principle of dual-beam interferometers such as the Mach–Zehnder sensor, Michelson sensor, and Sagnac sensor is similar to the Fabry–Perot interference sensor, as they all have an interference optical structure [83]. In the Mach–Zehnder sensor structure, the light in fibre coupler 1 is divided into two beams, through reference and sensing fibres, and interfere again in fibre coupler 2 as shown in Figure 27.
Different from the Mach–Zehnder sensor, in the Michelson sensor structure, the two light beams pass through the reference and sensing fibres, then are reflected by a Faraday rotating mirror back to the previous path as shown in Figure 28. So, when the sensing fibre is deformed by PD, it causes a phase difference between the two light beams [83].
In the Sagnac sensor structure, the light is divided at the fibre coupler as shown in Figure 29. The two beams of light are travelling in opposite directions through the sensing fibre. Then, the two light beams interfere at the fibre coupler. The PD event results in a phase difference between the two optical signals [83,98].
Different from interferometers, Fibre Bragg Grating (FBG) sensors have a diffraction optical structure. This detection technology is of a reflective structure in the core of an optical fibre as shown in Figure 30 [99]. It reflects particular wavelengths of light and transmits all others.
Any change in Bragg wavelength (λB) caused by PD is converted into an equivalent change in optical intensity [83]. The optical intensity differences can be detected by photodetector and converted into a voltage signal. The Fibre Bragg Grating sensor structure is shown in Figure 31.
The optical sensors have advantages of being able to survive in harsh environments such as in high temperatures and against chemical corrosion [96]. This offers an option to install the optical sensors inside the transformer, which further reduces the external noise interference. The geometric PD sensors’ location can be determined by utilizing multiple optical sensors either around the transformer tank or in a sensor array [100,101,102]. Overall, optical sensors have been proven to be effective techniques for PD detection.
3.2.3. Transient Earth Voltage Detection
Transient Earth voltage (TEV) is a relatively new PD detection method [103]. TEV sensor can detect two frequency ranges: several 100 MHz from the surface current and several 10MHz from the PD current [103].
When a PD event occurs, the lower frequency component can be detected as current, which flows from the external ground to the TEV sensor. The electromagnetic radiation from the PD source also propagates as a surface current on the tank wall. Due to the skin effect, this current travels from inside of the transformer wall, leaks out from joints such as bushings, and is detected by the TEV sensor as shown in Figure 32 [103,104,105].
Although the mechanism and propagation process of the TEV signal are not fully understood yet [106], it is still considered as another online PD detection method. As a non-intrusive method, the major advantage of a TEV sensor is that it can be easily attached to the outer surface of the transformer tank wall without any operation interruption.
3.2.4. High-Frequency Current Transformer
A high-frequency current transformer (HFCT) is another non-intrusive PD sensor. HFCT can be clamped onto the ground connection(s) of a power transformer [107]. HFCT measures the short transient current pulses that flow through the Earth conductor due to PD activity.
A typical HFCT sensor has a copper wire wound around a ferrite core and is connected to a 50-Ω BNC connector as shown in Figure 33. The transformer Earth cable carries a transient current passing through the middle of the ferrite core. This current on the primary side produces an electromagnetic flux around the cable. Then, the flux induces a current and voltage on the secondary winding [99,108].
3.3. Thermal Measurements
The thermal measurements are used to detect temperature rise in the transformer winding and insulation mediums [109]. When the transformer is in operation, the heat generated from windings and core circulates with oil. The hotter oil flows to the top of the tank and is cooled down then flows downward to the tank bottom. The traditional method of thermal monitoring is to measure top oil temperature and estimate the hot-spot temperature (HST) [110].
The temperature of the top oil of the tank can be measured by using a resistance thermometer or thermocouple sensor. HST is the maximum temperature measured from the winding insulation of the transformer. For new transformers, optical sensors can be directly installed in the spacers of winding disks to measure HST [111]. However, for already assembled units, it is not practical to install optical probes inside the winding structure. HST values can be estimated based on the following techniques: thermal equivalent circuits (TECs) [111] and stochastic, numerical, and practical experiment techniques [109]. TECs are based on the thermal-electrical analogy, and widely used due to their simplicity. The most commonly used estimation method is presented in Clause 7 of IEEE Std C57.91 [9]. The continuous improvement on artificial intelligent technologies will help online thermal analysis become more accurate in order to handle complex applications [112].
An infrared thermograph application is a non-destructive thermal detection method that uses a thermal camera to detect infrared radiation emission. Abnormal conditions such as a cooling system fault, short-circuit current, or poor joint contact can be monitored online [113]. However, this method only scans the surface radiation and detects the transformer’s external temperature as shown in Figure 34. Although the infrared thermograph method can be used for fast detection of temperature rise, its sensitivity is concerning, especially for detecting HST.
3.4. Vibration Analysis
Vibration analysis is used to detect internal mechanical faults such as deformation or aging of the contacts in a transformer based on changes in vibration response [114]. The vibration response can be measured by an accelerometer, which is the most commonly used type. The output of the accelerometer is a voltage signal measured in mV, which contains noise. Therefore, for accurate results, the signal needs to pass through filters [115]. When a transformer is in good condition, the measurements can be recorded as a fingerprint for future comparisons [116]. A healthy transformer always produces a periodic vibration signal [114].
Vibration response analysis is an online method and can be used as a complement to offline methods such as SFRA [117]. However, vibration response is detected from individual measurement points on the tank, which results in inconsistent signatures.
4. Challenges and Opportunities
While several developments have been made to various condition monitoring and fault diagnosis techniques currently used by the industry, a lot of challenges still need to be solved through comprehensive research and field trials.
For instance, there is no practical online method to replace the offline SFRA measurements. While some research efforts can be found in the literature to identify and quantify mechanical faults within a transformer through its V-I characteristics at the power frequency [118], the practical feasibility of this technique has not been assessed yet. Additionally, in the current SFRA method, the analysis of the results is not always a straightforward process due to the lack of widely accepted interpretation codes. The use of artificially intelligent (AI) and effective digital signal processing techniques may result in reliable, consistent, and automated code to analyze frequency response analysis signatures [119]. Optimization and digital image processing techniques may also be used to improve the accuracy of the analysis [120,121].
While measurements and analyses of dissolved gases are well matured for mineral oil, research effort still needs to be conducted to develop reliable DGA codes for biodegradable insulating oil and thermally upgraded insulation paper. The currently used interpretation codes are not consistent and may result in a different conclusion to the same oil sample. Combining these techniques in one AI code can improve the detection accuracy of the DGA method [122]. The accuracy of current online DGA sensors depends on several environmental and operating conditions, which calls for more research in this area to increase the accuracy of such sensors and enable them to measure other oil parameters such as Furan content, acidity, IFT, and BDV [17].
With the global trend to increase the reliance on renewable energy sources, more fluctuation in the generated power and voltage is expected due to the intermittency of such sources. Moreover, the load demand will exhibit uncertainty in magnitude and location with the increased number of plug-in electric vehicles that also result in increased harmonics in the power grids due to the power electronic interface. Such factors will have a significant impact on the transformer condition monitoring and fault diagnosis techniques. For example, if the oil is sampled for DGA measurement during a ramping period in the generation and/or load, inaccurate values will be revealed [80,123]. On the other hand, the harmonics in the voltage signal can be employed for online frequency response analysis.
The use of multi-sensors to measure different diagnostic parameters may also call for active research on wireless energy transfer to charge such sensors [124]. While the power required by each individual sensor is small, the use of a large number of online sensors may represent an additional burden to the network.
It is worth mentioning that with the worldwide efforts to reduce greenhouse gas emissions and establish more DC and smart grids, the adoption of solid-state transformers and advanced power electronic interfacing systems will be given much attention in the very near future and the use of classical magnetic-core based transformers may be diminished [125,126].
5. Conclusions
Oil-immersed power transformer is a critical and expensive asset in power systems. Failures of power transformers result in huge repair costs, environment disaster, and human injury or death. Therefore, reliable condition monitoring techniques must be adopted to avoid such consequences. The conventional offline condition monitoring techniques have been used for many years. Due to the offline line nature, the tests can only be performed during scheduled maintenance and the opportunity to detect incipient faults could be missed. The online condition monitoring technologies are relatively new and have been given much attention by the industry and researchers. In addition, the power industry is moving towards digital operation, which calls for more stable and accurate online condition monitoring systems. Over the years, researchers and developers have invented various online monitoring sensors and diagnostic methods such as DGA, PD, thermal measurements, and vibration analysis.
This paper covers working principles of commonly used offline and online methods. To design a most suitable condition monitoring system for a power transformer, it is important to understand the functions, measuring ranges, suitable diagnostic methods, and advantages and limitations of each technique. The future generations of condition monitoring systems would be comprehensive and could provide users with more precise information. In such systems, it is expected to not only provide information about the health condition of the transformer, but also to suggest a reliable asset management scheme and estimate transformer remnant life based on the measured parameters.
Author Contributions
Methodology, L.J.; software, L.J.; validation, L.J., D.K. and A.A.-S.; formal analysis, L.J., D.K. and A.A.-S.; investigation, D.K.; resources, L.J. and A.A.-S.; data curation, A.A.-S.; writing—original draft preparation, L.J.; writing—review and editing, L.J., D.K. and A.A.-S.; supervision, A.A.-S.; project administration, A.A.-S.; funding acquisition, S.K. All authors have read and agreed to the published version of the manuscript.
Funding
This research received no external funding.
Institutional Review Board Statement
Not applicable.
Informed Consent Statement
Not applicable.
Data Availability Statement
Not applicable.
Acknowledgments
Authors sincerely acknowledge the support from BHP for providing a scholarship to the first author to conduct her research on high voltage assets condition monitoring methodologies. Authors also acknowledge the support from Curtin University, Australia for facilitating research resources.
Conflicts of Interest
The authors declare no conflict of interest.
References
- Islam, M.M.; Lee, G.; Hettiwatte, S.N. A review of condition monitoring techniques and diagnostic tests for lifetime estimation of power transformers. Electr. Eng. 2017, 100, 581–605. [Google Scholar] [CrossRef]
- Aljohani, O.; Abu-Siada, A. Application of DIP to Detect Power Transformers Axial Displacement and Disk Space Variation Using FRA Polar Plot Signature. IEEE Trans. Ind. Inform. 2017, 13, 1794–1805. [Google Scholar] [CrossRef] [Green Version]
- Martin, D.; Marks, J.; Saha, T. Survey of Australian power transformer failures and retirements. IEEE Electr. Insul. Mag. 2017, 33, 16–22. [Google Scholar] [CrossRef]
- Samimi, M.H.; Ilkhechi, H.D. Survey of different sensors employed for the power transformer monitoring. IET Sci. Meas. Technol. 2020, 14, 1–8. [Google Scholar] [CrossRef]
- Ahmed, A.-S. Power Transformer Condition Monitoring and Diagnosis; The Institution of Engineering and Technology: Stevenage, UK, 2018. [Google Scholar]
- Soni, R.; Mehta, B. Review on asset management of power transformer by diagnosing incipient faults and faults identification using various testing methodologies. Eng. Fail. Anal. 2021, 128, 105634. [Google Scholar] [CrossRef]
- Saha, T.K. Review of modern diagnostic techniques for assessing insulation condition in aged transformers. IEEE Trans. Dielectr. Electr. Insul. 2003, 10, 903–917. [Google Scholar] [CrossRef] [Green Version]
- Li, S.; Ge, Z.; Abu-Siada, A.; Yang, L.; Li, S.; Wakimoto, K. A New Technique to Estimate the Degree of Polymerization of Insulation Paper Using Multiple Aging Parameters of Transformer Oil. IEEE Access 2019, 7, 157471–157479. [Google Scholar] [CrossRef]
- IEEE Std C57.91-2011 (Revision of IEEE Std C57.91-1995); IEEE Guide for Loading Mineral-Oil-Immersed Transformers and Step-Voltage Regulators. IEEE: Piscataway, NJ, USA, 2012; pp. 1–123. [CrossRef]
- Cheim, L.; Platts, D.; Prevost, T.; Xu, S. Furan analysis for liquid power transformers. IEEE Electr. Insul. Mag. 2012, 28, 8–21. [Google Scholar] [CrossRef]
- Abu-Siada, A. Correlation of furan concentration and spectral response of transformer oil-using expert systems. IET Sci. Meas. Technol. 2011, 5, 183–188. [Google Scholar] [CrossRef]
- Das, N.; Abu-Siada, A.; Islam, S. New approach to estimate furan contents in transformer oil using spectroscopic analysis. In Proceedings of the 2012 22nd Australasian Universities Power Engineering Conference (AUPEC), Bali, Indonesia, 26–29 September 2012; pp. 1–4. [Google Scholar]
- IEEE Std C57.152-2013; IEEE Guide for Diagnostic Field Testing of Fluid-Filled Power Transformers, Regulators, and Reactors. IEEE: Piscataway, NJ, USA, 2013; pp. 1–121. [CrossRef]
- Feng, D.; Wang, Z.; Jarman, P. Transmission power transformer assessment using furan measurement with the aid of thermal model. In Proceedings of the 2012 IEEE International Conference on Condition Monitoring and Diagnosis, Bali, Indonesia, 23–27 September 2012; pp. 521–524. [Google Scholar] [CrossRef] [Green Version]
- Abu-Siada, A.; Lai, S.P.; Islam, S.M. A Novel Fuzzy-Logic Approach for Furan Estimation in Transformer Oil. IEEE Trans. Power Deliv. 2012, 27, 469–474. [Google Scholar] [CrossRef]
- Karthik, R.; Raja, T.S.R.; Shunmugam, S.S. Performance evaluation of transformer oil using uv-visible spectrophotometer. Acta Sci. Technol. 2014, 36, 245–250. [Google Scholar] [CrossRef] [Green Version]
- Polanský, R.; Hahn, P.; Kadlec, P.; Moravcová, D.; Prosr, P. Quantifying the Effect of Catalysts on the Lifetime of Transformer Oil. Appl. Sci. 2020, 10, 1309. [Google Scholar] [CrossRef] [Green Version]
- Bakar, N.A.; Abu-Siada, A. A novel method of measuring transformer oil interfacial tension using UV-Vis spectroscopy. IEEE Electr. Insul. Mag. 2016, 32, 7–13. [Google Scholar] [CrossRef]
- Baka, N.A.; Abu-Siada, A.; Islam, S.; El-Naggar, M.F. A new technique to measure interfacial tension of transformer oil using UV-Vis spectroscopy. IEEE Trans. Dielectr. Electr. Insul. 2015, 22, 1275–1282. [Google Scholar] [CrossRef] [Green Version]
- Cui, H.; Yang, L.; Li, S.; Abu-Siada, A.; Yan, W.; Qu, G.; Li, S.; Zhu, Y.; Yue, W. Effect of Temperature and Pre-stressed Voltage on Breakdown of Oil-Impregnated Paper. In Proceedings of the 2018 Condition Monitoring and Diagnosis (CMD), Perth, WA, Australia, 23–26 September 2018; pp. 1–5. [Google Scholar] [CrossRef]
- Suleiman, A.A.; Muhamad, N.A.; Bashir, N.; Murad, N.S.; Arief, Y.Z.; Phung, B.T. Effect of moisture on breakdown voltage and structure of palm based insulation oils. IEEE Trans. Dielectri. Electr. Insul. 2014, 21, 2119–2126. [Google Scholar] [CrossRef]
- IEEE Std C57.106-2015 (Revision of IEEE Std C57.106-2006); IEEE Guide for Acceptance and Maintenance of Insulating Mineral Oil in Electrical Equipment. IEEE: Piscataway, NJ, USA, 2016; pp. 1–38. [CrossRef]
- Li, S.; Yang, L.; Li, S.; Zhu, Y.; Cui, H.; Yan, W.; Ge, Z.; Abu-Siada, A. Effect of AC-voltage harmonics on oil impregnated paper in transformer bushings. IEEE Trans. Dielectr. Electr. Insul. 2020, 27, 26–32. [Google Scholar] [CrossRef]
- Juris, J.S.; Duran, I.C.; Marulanda, A.R. Correlation between Insulation Resistance and Dissolved Gas Analysis Tests in Power Transformers. In Proceedings of the 2020 IEEE PES Transmission & Distribution Conference and Exhibition—Latin America (T&D LA), Montevideo, Uruguay, 28 September–2 October 2020; pp. 1–6. [Google Scholar] [CrossRef]
- Karimi, H.T.F. Measurement variations of insulation resistance/polarization index during utilizing time in HV electrical machines—A survey. Measurement 2015, 59, 21–29. [Google Scholar] [CrossRef]
- IEEE Std 43-2013 (Revision of IEEE Std 43-2000); IEEE Recommended Practice for Testing Insulation Resistance of Electric Machinery. IEEE: Piscataway, NJ, USA, 2014; pp. 1–37. [CrossRef]
- Marques, A.P.; Azevedo, C.H.B.; dos Santos, J.A.L.; Sousa, F.R.d.C.; Moura, N.K.; Ribeiro, C.J.; Dias, Y.A.; Rodrigues, A.; Rocha, A.S.; Brito, L.d.C. Insulation resistance of power transformers—method for optimized analysis. In Proceedings of the 2017 IEEE 19th International Conference on Dielectric Liquids (ICDL), Manchester, UK, 25–29 June 2017; pp. 1–4. [Google Scholar] [CrossRef]
- Malpure, B.D.; Baburao, K. Failure Analysis & Diagnostics of Power Transformer Using Dielectric dissipation factor. In Proceedings of the 2008 International Conference on Condition Monitoring and Diagnosis, Beijing, China, 21–24 April 2008; pp. 497–501. [Google Scholar] [CrossRef]
- Setayeshmehr, A.; Akbari, A.; Borsi, H.; Gockenbach, E. On-line monitoring and diagnoses of power transformer bushings. IEEE Trans. Dielectr. Electr. Insul. 2006, 13, 608–615. [Google Scholar] [CrossRef]
- Faria, G.; Pereira, M.; Lopes, G.; Villibor, J.; Tavares, P.; Faria, I. Evaluation of Capacitance and Dielectric Dissipation Factor of Distribution Transformers—Experimental Results. In Proceedings of the 2018 IEEE Electrical Insulation Conference (EIC), San Antonio, TX, USA, 17–20 June 2018; pp. 336–339. [Google Scholar] [CrossRef]
- Abu-Siada, A.; Islam, S. A new approach to identify power transformer criticality and asset management decision based on dissolved gas-in-oil analysis. IEEE Trans. Dielectr. Electr. Insul. 2012, 19, 1007–1012. [Google Scholar] [CrossRef]
- Wang, D.; Zhou, L.; Yang, Z.-X.; Cui, Y.; Wang, L.; Jiang, J.; Guo, L. A New Testing Method for the Dielectric Response of Oil-Immersed Transformer. IEEE Trans. Ind. Electr. 2020, 67, 10833–10843. [Google Scholar] [CrossRef]
- Boss, P.; Csepes, G.; Der Houhanessian, V.; Filippini, J.; Guuinic, P.; Gafvert, U.; Zaeng, W. Dielectric response methods for diagnostics of power transformers. IEEE Electr. Insul. Mag. 2003, 19, 12–18. [Google Scholar] [CrossRef]
- Zhang, T.; Tan, X.; Zhang, B.; Xu, X. Study on Moisture and Aging of Oil-Paper Insulation Using Relative Initial Slope of Recovery Voltage. IEEE Trans. Appl. Supercond. 2016, 26, 1–4. [Google Scholar] [CrossRef]
- Saha, T.K.; Tong, Y.Z. Experience with return voltage measurements for assessing insulation conditions in service-aged transformers. IEEE Trans. Power Deliv. 2003, 18, 128–135. [Google Scholar] [CrossRef] [Green Version]
- Fofana, I.; Bouaicha, A.; Farzaneh, M. Aging Characterization of Transformer Oil-Pressboard Insulation using Modern Diagnostic Techniques. Eur. Trans. Electr. Power 2011, 11, 1110–1127. [Google Scholar] [CrossRef]
- Talib, M.A.; Ghazali, N.A.M.; Christie, M.; Zakaria, W.; Hashim, I.; Uthman, S.; Jamali, M.N. Diagnosis of transformer insulation condition using recovery voltage measurements. In Proceedings of the National Power Engineering Conference, PECon 2003, Bangi, Malaysia, 15–16 December 2003; pp. 329–332. [Google Scholar] [CrossRef]
- Linhjell, D.; Lundgaard, L.; Gafvert, U. Dielectric response of mineral oil impregnated cellulose and the impact of aging. IEEE Trans. Dielectr. Electr. Insul. 2007, 14, 156–169. [Google Scholar] [CrossRef]
- Saha, T.K.; Darveniza, M.; Hill, D.J.T.; Le, T.T. Electrical and chemical diagnostics of transformers insulation. A. Aged transformer samples. IEEE Trans. Power Deliv. 1997, 12, 1547–1554. [Google Scholar] [CrossRef]
- Saha, T.K.; Purkait, P. Investigation of polarization and depolarization current measurements for the assessment of oil-paper insulation of aged transformers. IEEE Trans. Dielectr. Electr. Insul. 2004, 11, 144–154. [Google Scholar] [CrossRef] [Green Version]
- Liu, J.; Zhang, D.; Wei, X.; Karimi, H.R. Transformation Algorithm of Dielectric Response in Time-Frequency Domain. Math. Probl. Eng. 2014, 2014, 547105. [Google Scholar] [CrossRef]
- Zhang, T.; Li, X.; Lv, H.; Tan, X. Parameter Identification and Calculation of Return Voltage Curve Based on FDS Data. IEEE Trans. Appl. Supercond. 2014, 24, 1–5. [Google Scholar] [CrossRef]
- Kumara, S.; Bandara, K.; Wickramasuriya, P.; Yousuf, F.; Ekanayake, C.; Fernando, M.; Wang, Z.; Gubanski, S.M. Frequency Domain Measurements for Diagnosis of Power Transformers: Experiences from Australia, Malaysia, Sri Lanka and UK. CIGRE Sci. Eng. (CSE) 2021, 2021, 82–107. [Google Scholar]
- Abu-Siada, A.; Aljohani, O. Detecting incipient radial deformations of power transformer windings using polar plot and digital image processing. IET Sci. Meas. Technol. 2018, 12, 492–499. [Google Scholar] [CrossRef] [Green Version]
- Bigdeli, M.; Abu-Siada, A. Clustering of transformer condition using frequency response analysis based on k-means and GOA. Electr. Power Syst. Res. 2022, 202, 107619. [Google Scholar] [CrossRef]
- Al-Ameri, S.M.A.N.; Kamarudin, M.S.; Yousof, M.F.M.; Salem, A.A.; Banakhr, F.A.; Mosaad, M.I.; Abu-Siada, A. Understanding the Influence of Power Transformer Faults on the Frequency Response Signature Using Simulation Analysis and Statistical Indicators. IEEE Access 2021, 9, 70935–70947. [Google Scholar] [CrossRef]
- Abu-Siada, A.; Mosaad, M.I.; Kim, D.; El-Naggar, M.F. Estimating Power Transformer High Frequency Model Parameters Using Frequency Response Analysis. IEEE Trans. Power Deliv. 2020, 35, 1267–1277. [Google Scholar] [CrossRef]
- Aljohani, O.; Abu-Siada, A. Application of digital image processing to detect transformer bushing faults and oil degradation using FRA polar plot signature. IEEE Trans. Dielectr. Electr. Insul. 2017, 24, 428–436. [Google Scholar] [CrossRef]
- Zhao, X.; Yao, C.; Zhao, Z.; Abu-Siada, A. Performance evaluation of online transformer internal fault detection based on transient overvoltage signals. IEEE Trans. Dielectr. Electr. Insul. 2017, 24, 3906–3915. [Google Scholar] [CrossRef]
- Behjat, V.; Vahedi, A.; Setayeshmehr, A.; Borsi, H.; Gockenbach, E. Diagnosing Shorted Turns on the Windings of Power Transformers Based Upon Online FRA Using Capacitive and Inductive Couplings. IEEE Trans. Power Deliv. 2011, 26, 2123–2133. [Google Scholar] [CrossRef]
- Zhao, X.; Yao, C.; Zhou, Z.; Li, C.; Wang, X.; Zhu, T.; Abu-Siada, A. Experimental Evaluation of Transformer Internal Fault Detection Based on V–I Characteristics. IEEE Trans. Ind. Electr. 2020, 67, 4108–4119. [Google Scholar] [CrossRef]
- Iwanusiw, O.W.; Eng, P. The Art and Science of Transformer Ratio Measurement. In Proceedings of the 2018 IEEE Electrical Insulation Conference (EIC), San Antonio, TX, USA, 17–20 June 2018; pp. 390–394. [Google Scholar] [CrossRef]
- Razzaq, A.S.A.; Yousof, M.F.M.; Al-Ameri, S.M.; Talib, M.A.; Mshkil, A.J. Interpretation of Inter-Turn Fault in Transformer Winding Using Turns Ratio Test and Frequency Response Analysis. Int. J. Electr. Electron. Eng. Telecommun. 2022, 11, 218–225. [Google Scholar]
- Osmanbasic, E. Importance of using high test voltage for transformer turns ratio test. Transform. Mag. 2021, 8, 98–105. [Google Scholar]
- Abu-Siada, A.; Arshad, M.; Islam, S. Fuzzy logic approach to identify transformer criticality using dissolved gas analysis. In Proceedings of the IEEE PES General Meeting, Minneapolis, MN, USA, 25–29 July 2010; pp. 1–5. [Google Scholar] [CrossRef]
- Norazhar, A.B.; Abu-Siada, A.; Islam, S. A review on chemical diagnosis techniques for transformer paper insulation degradation. In Proceedings of the 2013 Australasian Universities Power Engineering Conference (AUPEC), Hobart, TAS, Australia, 29 September–3 October 2013; pp. 1–6. [Google Scholar] [CrossRef] [Green Version]
- Abu-Siada, A. Improved Consistent Interpretation Approach of Fault Type within Power Transformers Using Dissolved Gas Analysis and Gene Expression Programming. Energies 2019, 12, 730. Available online: https://www.mdpi.com/1996-1073/12/4/730 (accessed on 22 February 2019). [CrossRef] [Green Version]
- Abu-Siada, A.; Hmood, S.; Islam, S. A new fuzzy logic approach for consistent interpretation of dissolved gas-in-oil analysis. IEEE Trans. Dielectr. Electr. Insul. 2013, 20, 2343–2349. [Google Scholar] [CrossRef] [Green Version]
- Bakar, N.A.; Abu-Siada, A.; Islam, S. A review of dissolved gas analysis measurement and interpretation techniques. IEEE Electr. Insul. Mag. 2014, 30, 39–49. [Google Scholar] [CrossRef]
- Chow, J.; Lee, R.; Wong, E.; Leung, K.; Lai, G. Novel engineering techniques to overcoming traditional challenges in online condition monitoring systems for power transformer. HKIE Trans. 2018, 25, 248–254. [Google Scholar] [CrossRef]
- Ma, L.-C.; Chen, C.; Lin, J.Y.S. Teflon AF2400 Hollow Fiber Membrane Contactor for Dissolved Gas-in-Oil Extraction: Mass Transfer Characteristics. Ind. Eng. Chem. Res. 2020, 59, 16795–16804. [Google Scholar] [CrossRef]
- Ma, L.-C.; Chen, C.; Chen, C.-H.; Tung, K.-L.; Lin, J.Y.S. Gas Transport Properties of Teflon AF2400/Ceramic Composite Hollow Fiber Membranes in Dissolved-Gas-in-Oil Extraction. Ind. Eng. Chem. Res. 2020, 59, 5392–5401. [Google Scholar] [CrossRef]
- Fan, J.; Wang, F.; Sun, Q.; Bin, F.; Ding, J.; Ye, H. SOFC detector for portable gas chromatography: High-sensitivity detection of dissolved gases in transformer oil. IEEE Trans. Dielectr. Electr. Insul. 2017, 24, 2854–2863. [Google Scholar] [CrossRef]
- Fan, J.; Wang, F.; Sun, Q.; Ye, H.; Jiang, Q. Application of Polycrystalline SnO2 Sensor Chromatographic System to Detect Dissolved Gases in Transformer Oil. Sens. Actuators B Chem. 2018, 267, 636–646. [Google Scholar] [CrossRef]
- Mao, Z.; Wen, J. Detection of dissolved gas in oil–insulated electrical apparatus by photoacoustic spectroscopy. IEEE Electr. Insul. Mag. 2015, 31, 7–14. [Google Scholar] [CrossRef]
- Cui, H.; Yang, L.; Zhu, Y.; Li, S.; Abu-Siada, A.; Islam, S. Dissolved Gas Analysis for Power Transformers within Distributed Renewable Generation-Based Systems. IEEE Trans. Dielectr. Electr. Insul. 2021, 28, 1349–1356. [Google Scholar] [CrossRef]
- Palzer, S. Photoacoustic-based gas sensing: A review. Sensors 2020, 20, 2745. [Google Scholar] [CrossRef] [PubMed]
- Yun, Y.; Chen, W.; Wang, Y.; Pan, C. Photoacoustic detection of dissolved gases in transformer oil. Eur. Trans. Electr. Power 2008, 18, 562–576. [Google Scholar] [CrossRef]
- Bakar, N.A.; Abu-Siada, A. A new method to detect dissolved gases in transformer oil using NIR-IR spectroscopy. IEEE Trans. Dielectr. Electr. Insul. 2017, 24, 409–419. [Google Scholar] [CrossRef]
- Yang, T.; Chen, W. Detection of Dissolved Gas in Transformer Oil Based on All-Optical Photoacoustic Spectroscopy. In Proceedings of the 2020 IEEE International Conference on High Voltage Engineering and Application (ICHVE), Beijing, China, 6–10 September 2020; pp. 1–4. [Google Scholar] [CrossRef]
- Kondalkar, V.V.; Park, J.; Lee, K. MEMS hydrogen gas sensor for in-situ monitoring of hydrogen gas in transformer oil. Sens. Actuators B Chem. 2021, 326, 128989. [Google Scholar] [CrossRef]
- Lewis, F.A. The palladium/hydrogen system. Berichte Bunsenges. Phys. Chem. 1967, 71, 1160–1161. [Google Scholar] [CrossRef] [Green Version]
- Christofides, C.; Mandelis, A. Solid-state sensors for trace hydrogen gas detection. J. Appl. Phys. 1990, 68, R1–R30. [Google Scholar] [CrossRef]
- Kumar, A. Palladium-based trench gate MOSFET for highly sensitive hydrogen gas sensor. Mater. Sci. Semicond. Process. 2020, 120, 105274. [Google Scholar] [CrossRef]
- Zhang, L.; Zhao, H.; Li, Y.; Han, Y.; Wang, S.; Shang, Y. Study on Multi-parameter On-line Monitoring System for Transformer Bushing. In Proceedings of the 2020 Asia Energy and Electrical Engineering Symposium (AEEES), Chengdu, China, 29–31 May 2020; pp. 54–58. [Google Scholar] [CrossRef]
- Lee, E.; Lee, J.M.; Koo, J.H.; Lee, W.; Lee, T. Hysteresis behavior of electrical resistance in Pd thin films during the process of absorption and desorption of hydrogen gas. Int. J. Hydrogen Energy 2010, 35, 6984–6991. [Google Scholar] [CrossRef]
- IEEE Std C57.104-2019 (Revision of IEEE Std C57.104-2008); IEEE Guide for the Interpretation of Gases Generated in Mineral Oil-Immersed Transformers. IEEE: Piscataway, NJ, USA, 2019; pp. 1–98. [CrossRef]
- IEEE Std C57.155-2014; IEEE Guide for Interpretation of Gases Generated in Natural Ester and Synthetic Ester-Immersed Transformers. IEEE: Piscataway, NJ, USA, 2014; pp. 1–52. [CrossRef]
- Faiz, J.; Soleimani, M. Dissolved gas analysis evaluation in electric power transformers using conventional methods a review. IEEE Trans. Dielectr. Electr. Insul. 2017, 24, 1239–1248. [Google Scholar] [CrossRef]
- Cui, H.; Yang, L.; Li, S.; Qu, G.; Wang, H.; Abu-Siada, A.; Islam, S. Impact of Load Ramping on Power Transformer Dissolved Gas Analysis. IEEE Access 2019, 7, 170343–170351. [Google Scholar] [CrossRef]
- Wannapring, E.; Suwanasri, C.; Suwanasri, T. Dissolved Gas Analysis methods for distribution transformers. In Proceedings of the 2016 13th International Conference on Electrical Engineering/Electronics, Computer, Telecommunications and Information Technology (ECTI-CON), Chiang Mai, Thailand, 28 June–1 July 2016; pp. 1–6. [Google Scholar] [CrossRef]
- Sarkar, B.; Koley, C.; Roy, N.K.; Kumbhakar, P. Condition monitoring of high voltage transformers using Fiber Bragg Grating Sensor. Meas. J. Int. Meas. Confed. 2015, 74, 255–267. [Google Scholar] [CrossRef]
- Jiang, G.M.J. Partial Discharge Detection with Optical Methods. In Optical Sensing in Power Transformers; Wiley: London, UK, 2021; Chapter 5; pp. 137–188. [Google Scholar]
- Kim, D.; Abu-Siada, A. Partial Discharge Analysis on-site in Various High Voltage Apparatus. In Proceedings of the 2018 Condition Monitoring and Diagnosis (CMD), Perth, WA, Australia, 23–26 September 2018; pp. 1–6. [Google Scholar] [CrossRef]
- IEEE Std C57.127-2018 (Revision of IEEE Std C57.127-2007); IEEE Guide for the Detection, Location and Interpretation of Sources of Acoustic Emissions from Electrical Discharges in Power Transformers and Power Reactors. IEEE: Piscataway, NJ, USA, 2019; pp. 1–72. [CrossRef]
- Neuhold, S.M.; Brugger, T.; Behrmann, G.; Schlemper, H.D.; Riechert, U.; Muller, P.; Lehner, M.; Schneiter, E.; Sigrist, P. Return of Experience: The CIGRE UHF PD Sensitivity Verification and On-Site Detection of Critical Defects; CIGRE: Paris, France, 2018; pp. 1–13. [Google Scholar]
- Roslizan, N.D.; Rohani, M.N.K.H.; Wooi, C.L.; Isa, M.; Ismail, B.; Rosmi, A.S.; Mustafa, W.A. A Review: Partial Discharge Detection using UHF sensor on High Voltage Equipment. J. Phys. Conf. Ser. 2020, 1432, 12003. [Google Scholar] [CrossRef]
- Chai, H.; Phung, B.T.; Mitchell, S. Application of UHF Sensors in Power System Equipment for Partial Discharge Detection: A Review. Sensors 2019, 19, 1029. [Google Scholar] [CrossRef] [PubMed] [Green Version]
- Sinaga, H.H.; Phung, B.T.; Blackburn, T.R. Partial discharge localization in transformers using UHF detection method. IEEE Trans. Dielectr. Electr. Insul. 2012, 19, 1891–1900. [Google Scholar] [CrossRef]
- Chakravarthi, M.K.; Giridhar, A.V.; Sarma, D.V.S.S.S. Localization of Incipient Discharge in Power Transformer Using UHF Sensor. In Proceedings of the 2019 International Conference on High Voltage Engineering and Technology (ICHVET), Hyderabad, India, 7–8 February 2019; pp. 1–3. [Google Scholar] [CrossRef]
- Yuan, W.; Chuangli, G.; Zhipeng, W.; Pengcheng, D. UHF PD Online Monitoring of Huge-Size Transformers and Data Analysis. In Proceedings of the 2011 International Conference on Computer Distributed Control and Intelligent Environmental Monitoring, Changsha, China, 19–20 February 2011; pp. 2375–2378. [Google Scholar] [CrossRef]
- Hoek, S.M.; Krüger, M.; Körber, S.; Kraetge, A. Application of the UHF technology to detect and locate partial discharges in liquid immersed transformer. Elektrotech. Inf. 2014, 131, 386–392. [Google Scholar] [CrossRef]
- Chai, H.; Phung, B.T.; Zhang, D. Development of UHF Sensors for Partial Discharge Detection in Power Transformer. In Proceedings of the 2018 Condition Monitoring and Diagnosis (CMD), Perth, WA, Australia, 23–26 September 2018; pp. 1–5. [Google Scholar] [CrossRef]
- Zhou, H.Y.; Ma, G.M.; Zhang, M.; Zhang, H.C.; Li, C.R. A High Sensitivity Optical Fiber Interferometer Sensor for Acoustic Emission Detection of Partial Discharge in Power Transformer. IEEE Sens. J. 2021, 21, 24–32. [Google Scholar] [CrossRef]
- Gao, C.; Yu, L.; Xu, Y.; Wang, W.; Wang, S.; Wang, P. Partial Discharge Localization Inside Transformer Windings via Fiber-Optic Acoustic Sensor Array. IEEE Trans. Power Deliv. 2019, 34, 1251–1260. [Google Scholar] [CrossRef]
- Yaacob, M.M.; Alsaedi, M.A.; Rashed, J.R.; Dakhil, A.M.; Atyah, S.F. Review on partial discharge detection techniques related to high voltage power equipment using different sensors. Photonic Sens. 2014, 4, 325–337. [Google Scholar] [CrossRef] [Green Version]
- Gao, C.; Wang, W.; Song, S.; Wang, S.; Yu, L.; Wang, Y. Localization of partial discharge in transformer oil using Fabry-Pérot optical fiber sensor array. IEEE Trans. Dielectr. Electr. Insul. 2018, 25, 2279–2286. [Google Scholar] [CrossRef]
- Qian, S.; Chen, H.; Xu, Y.; Su, L. High sensitivity detection of partial discharge acoustic emission within power transformer by sagnac fiber optic sensor. IEEE Trans. Dielectr. Electr. Insul. 2018, 25, 2313–2320. [Google Scholar] [CrossRef]
- Zachariades, C.; Shuttleworth, R.; Giussani, R.; MacKinlay, R. Optimization of a High-Frequency Current Transformer Sensor for Partial Discharge Detection Using Finite-Element Analysis. IEEE Sens. J. 2016, 16, 7526–7533. [Google Scholar] [CrossRef] [Green Version]
- Ma, G.-M.; Zhou, H.-Y.; Shi, C.; Li, Y.-B.; Zhang, Q.; Li, C.-R.; Zheng, Q. Distributed Partial Discharge Detection in a Power Transformer Based on Phase-Shifted FBG. IEEE Sens. J. 2018, 18, 2788–2795. [Google Scholar] [CrossRef]
- Búa-Núñez, I.; Posada-Román, J.E.; Rubio-Serrano, J.; Garcia-Souto, J.A. Instrumentation System for Location of Partial Discharges Using Acoustic Detection With Piezoelectric Transducers and Optical Fiber Sensors. IEEE Trans. Instrum. Meas. 2014, 63, 1002–1013. [Google Scholar] [CrossRef] [Green Version]
- Búa-Núñez, I.; Posada-Román, J.E.; García-Souto, J.A. Multichannel detection of acoustic emissions and localization of the source with external and internal sensors for partial discharge monitoring of power transformers. Energies 2021, 14, 7873. [Google Scholar] [CrossRef]
- Yoshizumi, H.; Nakano, Y.; Kozako, M.; Hikita, M.; Fujii, Y.; Nakamura, Y.; Cho, H. Consideration of Generation Mechanism of Low Frequency Component of Partial Discharge Signal Detected by Transient Earth Voltage. In Proceedings of the 2018 Condition Monitoring and Diagnosis (CMD), Perth, WA, Australia, 23–26 September 2018; pp. 1–4. [Google Scholar] [CrossRef]
- Reid, A.J.; Judd, M.D.; Duncan, G. Simultaneous measurement of partial discharge using TEV, IEC60270 and UHF techniques. In Proceedings of the 2012 IEEE International Symposium on Electrical Insulation, San Juan, PR, USA, 10–13 June 2012; pp. 439–442. [Google Scholar] [CrossRef]
- Wang, L.; Wang, H.; Wang, L.; Lü, H.; Ning, W.; Jia, S.; Wu, J. Experimental investigation of transient earth voltage and acoustic emission measurements of partial discharge signals in medium-voltage switchgears. In Proceedings of the 2013 2nd International Conference on Electric Power Equipment—Switching Technology (ICEPE-ST), Matsue, Japan, 20–23 October 2013; pp. 1–4. [Google Scholar] [CrossRef]
- Itose, A.; Kozako, M.; Hikita, M. Partial discharge detection and induced surface current analysis using transient earth voltage method for high voltage equipment. In Proceedings of the 2016 International Conference on Condition Monitoring and Diagnosis (CMD), Xi’an, China, 25–28 September 2016; pp. 456–460. [Google Scholar] [CrossRef]
- Seo, J.; Ma, H.; Saha, T. A novel signal extraction technique for online partial discharge (PD) measurement of transformers. Int. Trans. Electr. Energy Syst. 2016, 26, 1032–1048. [Google Scholar] [CrossRef]
- Hu, X.; Siew, W.H.; Judd, M.D.; Peng, X. Transfer function characterization for HFCTs used in partial discharge detection. IEEE Trans. Dielectr. Electr. Insul. 2017, 24, 1088–1096. [Google Scholar] [CrossRef] [Green Version]
- Aslam, M.; Haq, I.U.; Rehan, M.S.; Basit, A.; Arif, M.; Khan, M.I.; Sadiq, M.; Arbab, M.N. Dynamic Thermal Model for Power Transformers. IEEE Access 2021, 9, 71461–71469. [Google Scholar] [CrossRef]
- Wang, M.; Vandermaar, A.J.; Srivastava, K.D. Review of condition assessment of power transformers in service. IEEE Electr. Insul. Mag. 2002, 18, 12–25. [Google Scholar] [CrossRef]
- Mikhak-Beyranvand, M.; Faiz, J.; Rezaeealam, B. Thermal Analysis of Power Transformer Using an Improved Dynamic Thermal Equivalent Circuit Model. Electr. Power Compon. Syst. 2019, 47, 1598–1609. [Google Scholar] [CrossRef]
- Kunicki, M.; Borucki, S.; Cichoń, A.; Frymus, J. Modeling of the Winding Hot-Spot Temperature in Power Transformers: Case Study of the Low-Loaded Fleet. Energies 2019, 12, 3561. [Google Scholar] [CrossRef] [Green Version]
- Mariprasath, T.; Kirubakaran, V. A real time study on condition monitoring of distribution transformer using thermal imager. Infrared Phys. Technol. 2018, 90, 78–86. [Google Scholar] [CrossRef]
- Hu, Y.; Zheng, J.; Huang, H. Experimental Research on Power Transformer Vibration Distribution under Different Winding Defect Conditions. Electronics 2019, 8, 842. [Google Scholar] [CrossRef] [Green Version]
- Secic, A.; Krpan, M.; Kuzle, I. Vibro-Acoustic Methods in the Condition Assessment of Power Transformers: A Survey. IEEE Access 2019, 7, 83915–83931. [Google Scholar] [CrossRef]
- Ji, S.; Shan, P.; Li, Y.; Xu, D.; Cao, J. The vibration measuring system for monitoring core and winding condition of power transformer. In Proceedings of the 2001 International Symposium on Electrical Insulating Materials (ISEIM 2001). 2001 Asian Conference on Electrical Insulating Diagnosis (ACEID 2001). 33rd Symposium on Electrical and Ele, Himeji, Japan, 19–22 November 2001; pp. 849–852. [Google Scholar] [CrossRef]
- Garcia, B.; Burgos, J.C.; Alonso, A.M. Transformer tank vibration modeling as a method of detecting winding deformations-part II: Experimental verification. IEEE Trans. Power Deliv. 2006, 21, 164–169. [Google Scholar] [CrossRef]
- Abu-Siada, A.; Islam, S. A Novel Online Technique to Detect Power Transformer Winding Faults. IEEE Trans. Power Deliv. 2012, 27, 849–857. [Google Scholar] [CrossRef]
- Aljohani, O.; Abu-Siada, A. Application of Digital Image Processing to Detect Short-Circuit Turns in Power Transformers Using Frequency Response Analysis. IEEE Trans. Ind. Inform. 2016, 12, 2062–2073. [Google Scholar] [CrossRef]
- Abu-Siada, A.; Radwan, I.; Abdou, A.F. 3D approach for fault identification within power transformers using frequency response analysis. IET Sci. Meas. Technol. 2019, 13, 903–911. [Google Scholar] [CrossRef]
- Mossad, M.I.; Azab, M.; Abu-Siada, A. Transformer Parameters Estimation From Nameplate Data Using Evolutionary Programming Techniques. IEEE Trans. Power Deliv. 2014, 29, 2118–2123. [Google Scholar] [CrossRef]
- Abu-Siada, A.; Hmood, S. Fuzzy logic approach for power transformer asset management based on dissolved gas-in-oil analysis. Chem. Eng. Trans. 2013, 33, 997–1002. [Google Scholar] [CrossRef]
- Cui, H.; Yang, L.; Zhu, Y.; Li, S.; Abu-Siada, A.; Islam, S. A comprehensive analyses of aging characteristics of oil-paper insulation system in HVDC converter transformers. IEEE Trans. Dielectr. Electr. Insul. 2020, 27, 1707–1714. [Google Scholar] [CrossRef]
- Kim, D.; Abu-Siada, A.; Sutinjo, A. State-of-the-Art Literature Review of WPT: Current Limitations and Solutions on IPT. Electr. Power Sys. Res. 2018, 154, 493–502. [Google Scholar] [CrossRef]
- Abu-Siada, A.; Budiri, J.; Abdou, A.F. Solid State Transformers Topologies, Controllers, and Applications: State-of-the-Art Literature Review. Electronics 2018, 7, 298. Available online: https://www.mdpi.com/2079-9292/7/11/298 (accessed on 5 November 2018). [CrossRef] [Green Version]
- Hasan, M.M.; Abu-Siada, A.; Islam, S.M.; Dahidah, M.S.A. A New Cascaded Multilevel Inverter Topology with Galvanic Isolation. IEEE Trans. Ind. Appl. 2018, 54, 3463–3472. [Google Scholar] [CrossRef]
Figure 1.
Distribution of failures for Australian power transformers during the period 2000 to 2015.
Figure 1.
Distribution of failures for Australian power transformers during the period 2000 to 2015.
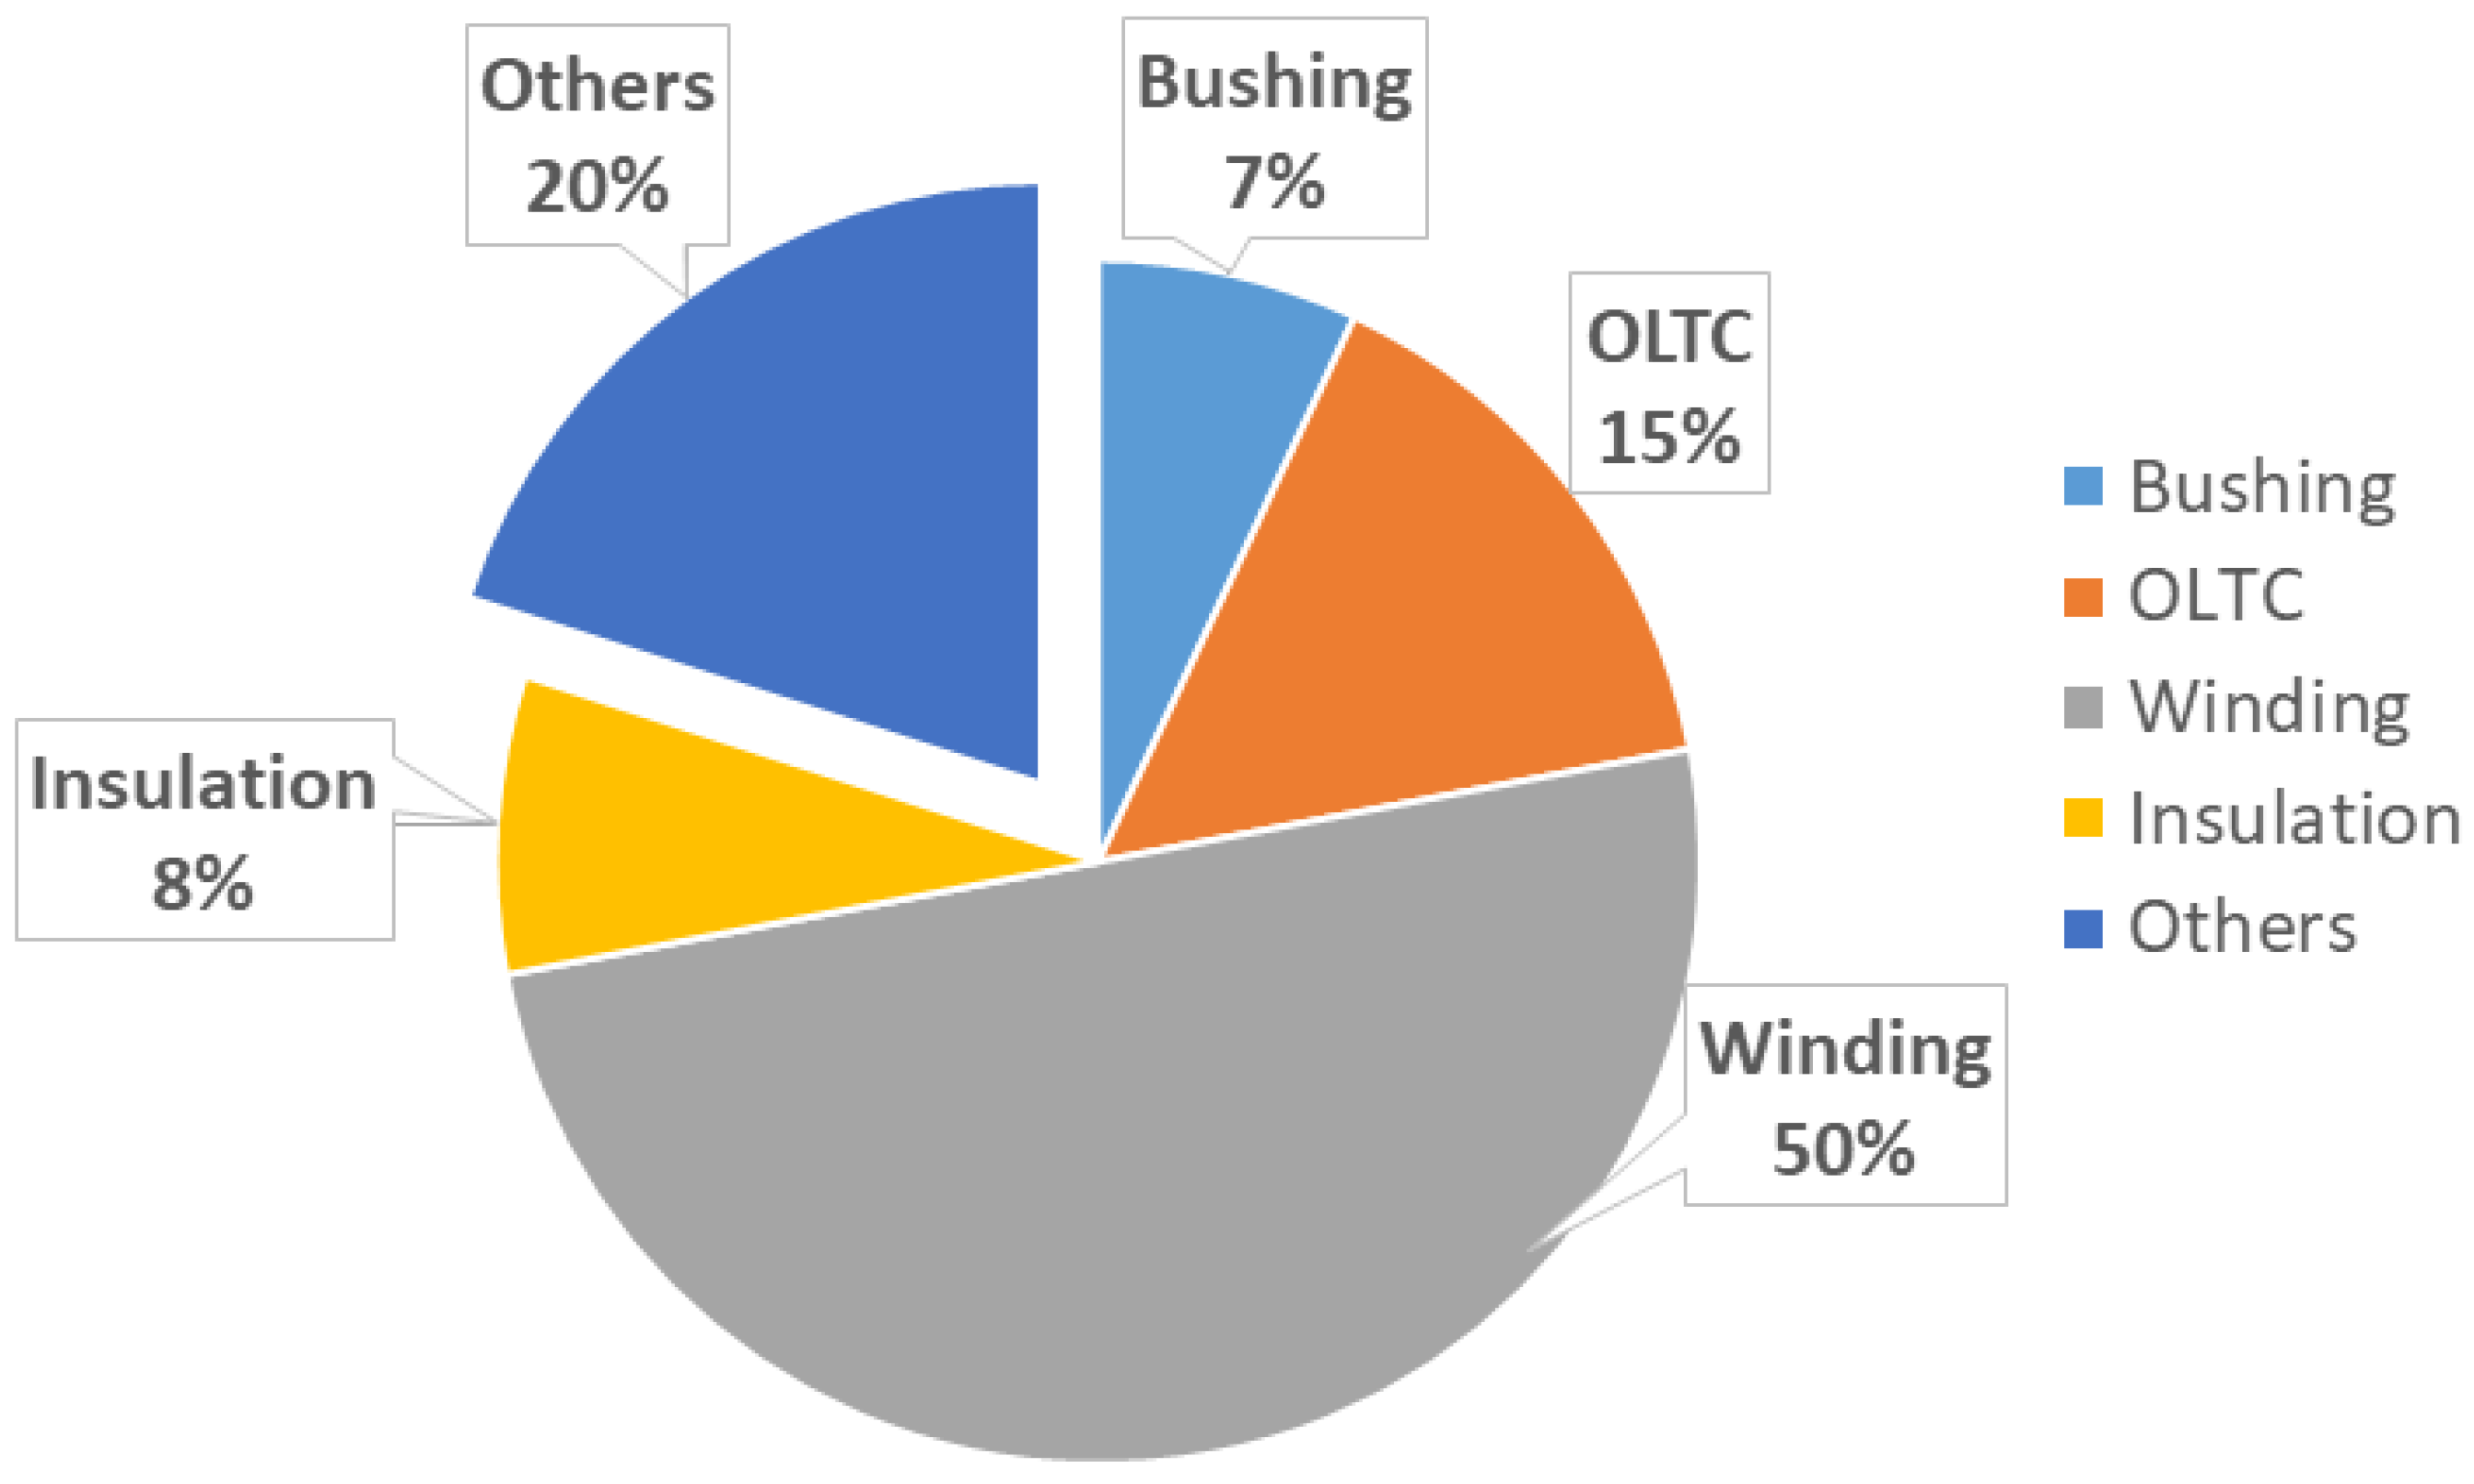
Figure 2.
The parameters to be monitored for oil-immersed power transformer components.
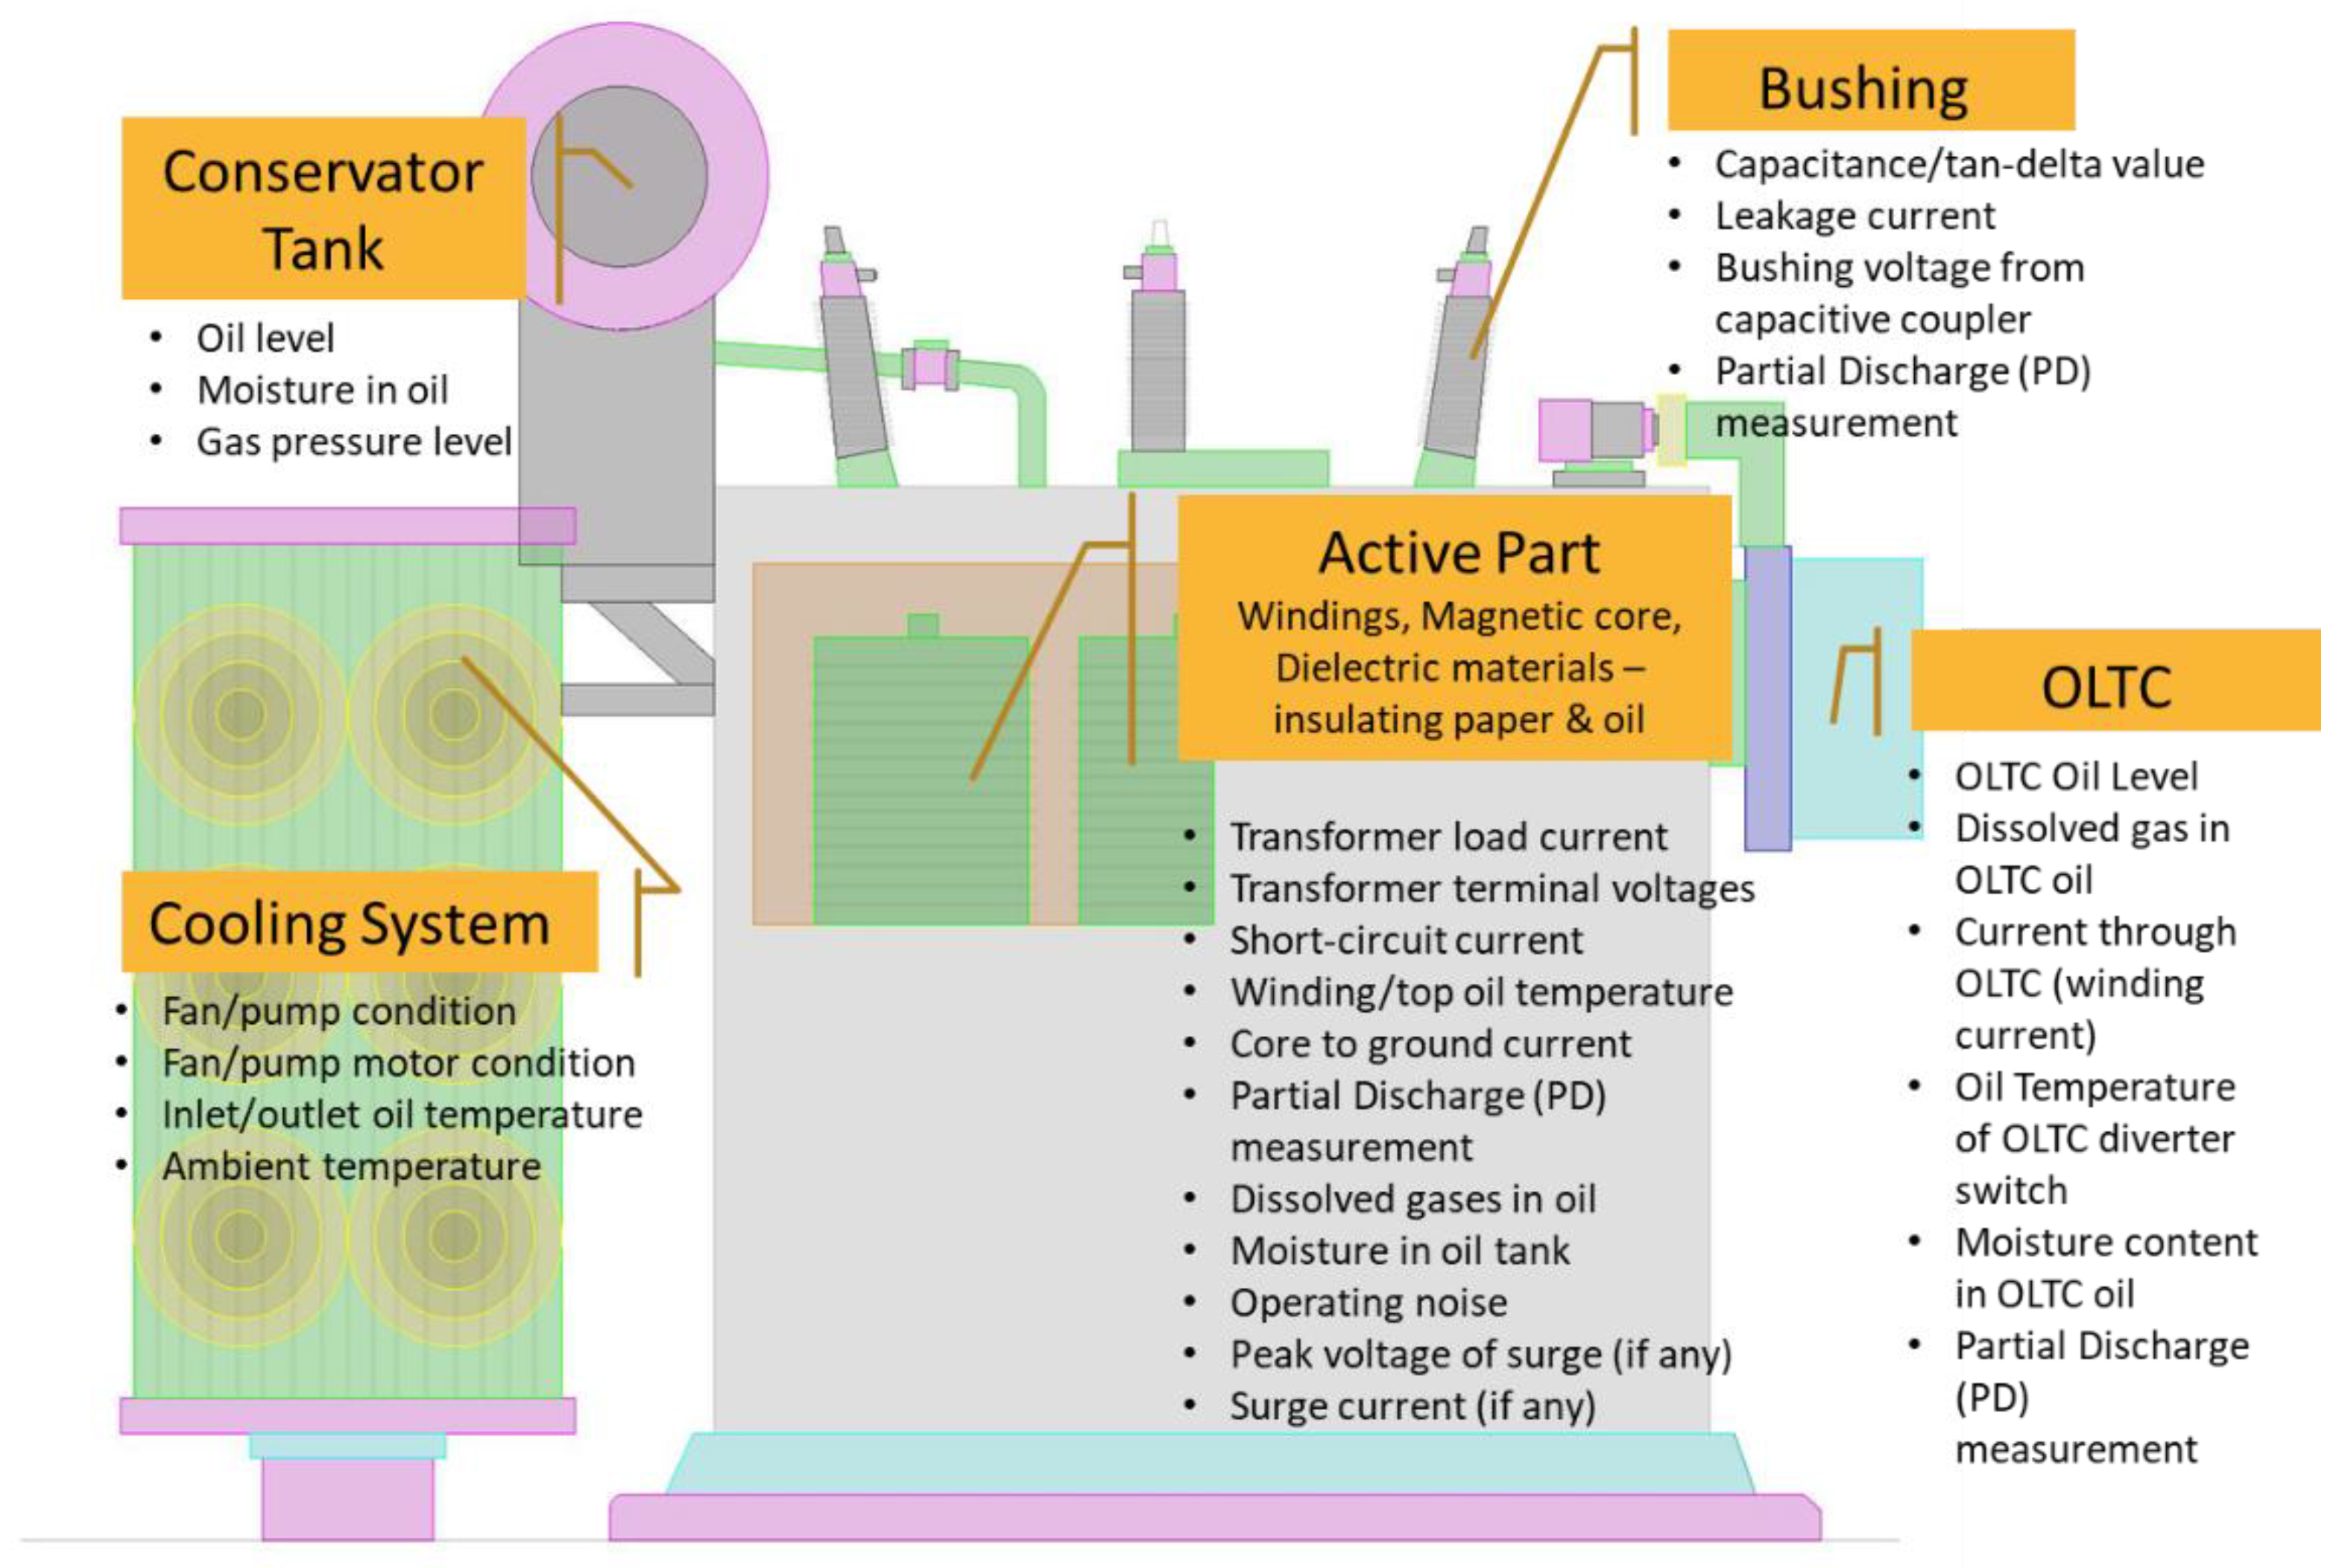
Figure 3.
Offline and online condition monitoring methods for an oil-immersed power transformer.
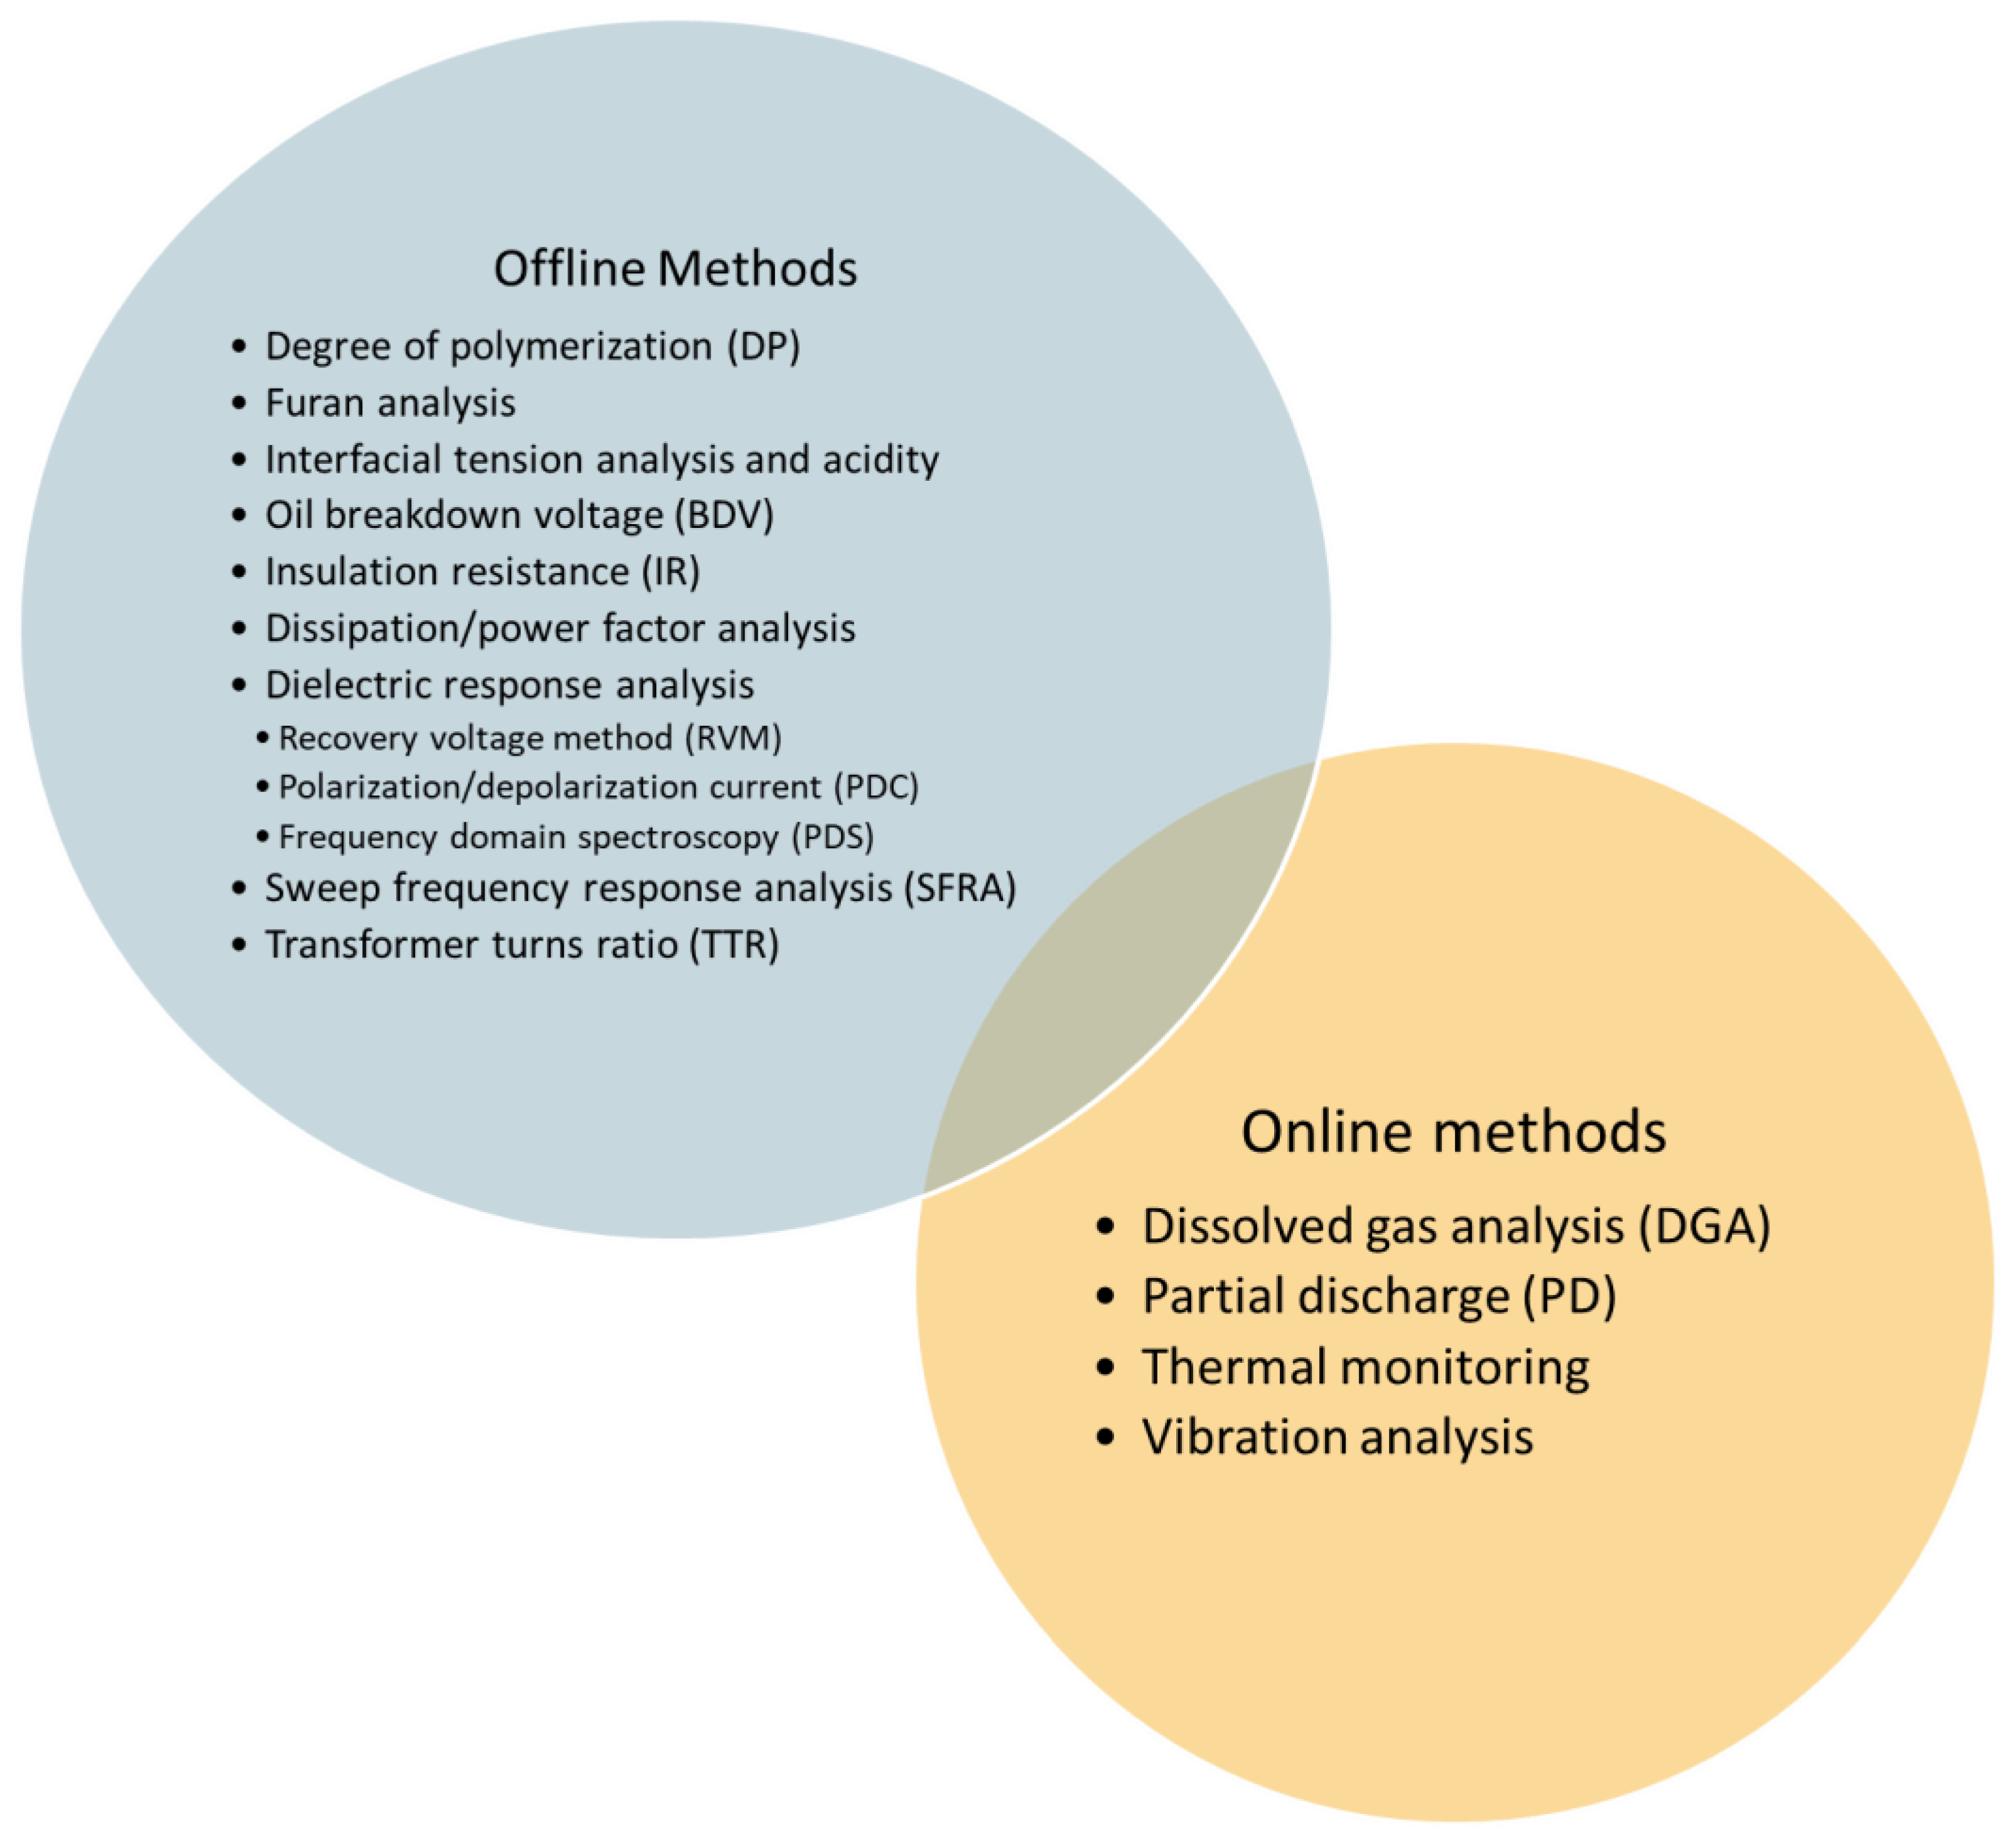
Figure 4.
Chemical structure of cellulose.

Figure 5.
Typical IR measurements versus time of the applied voltage.
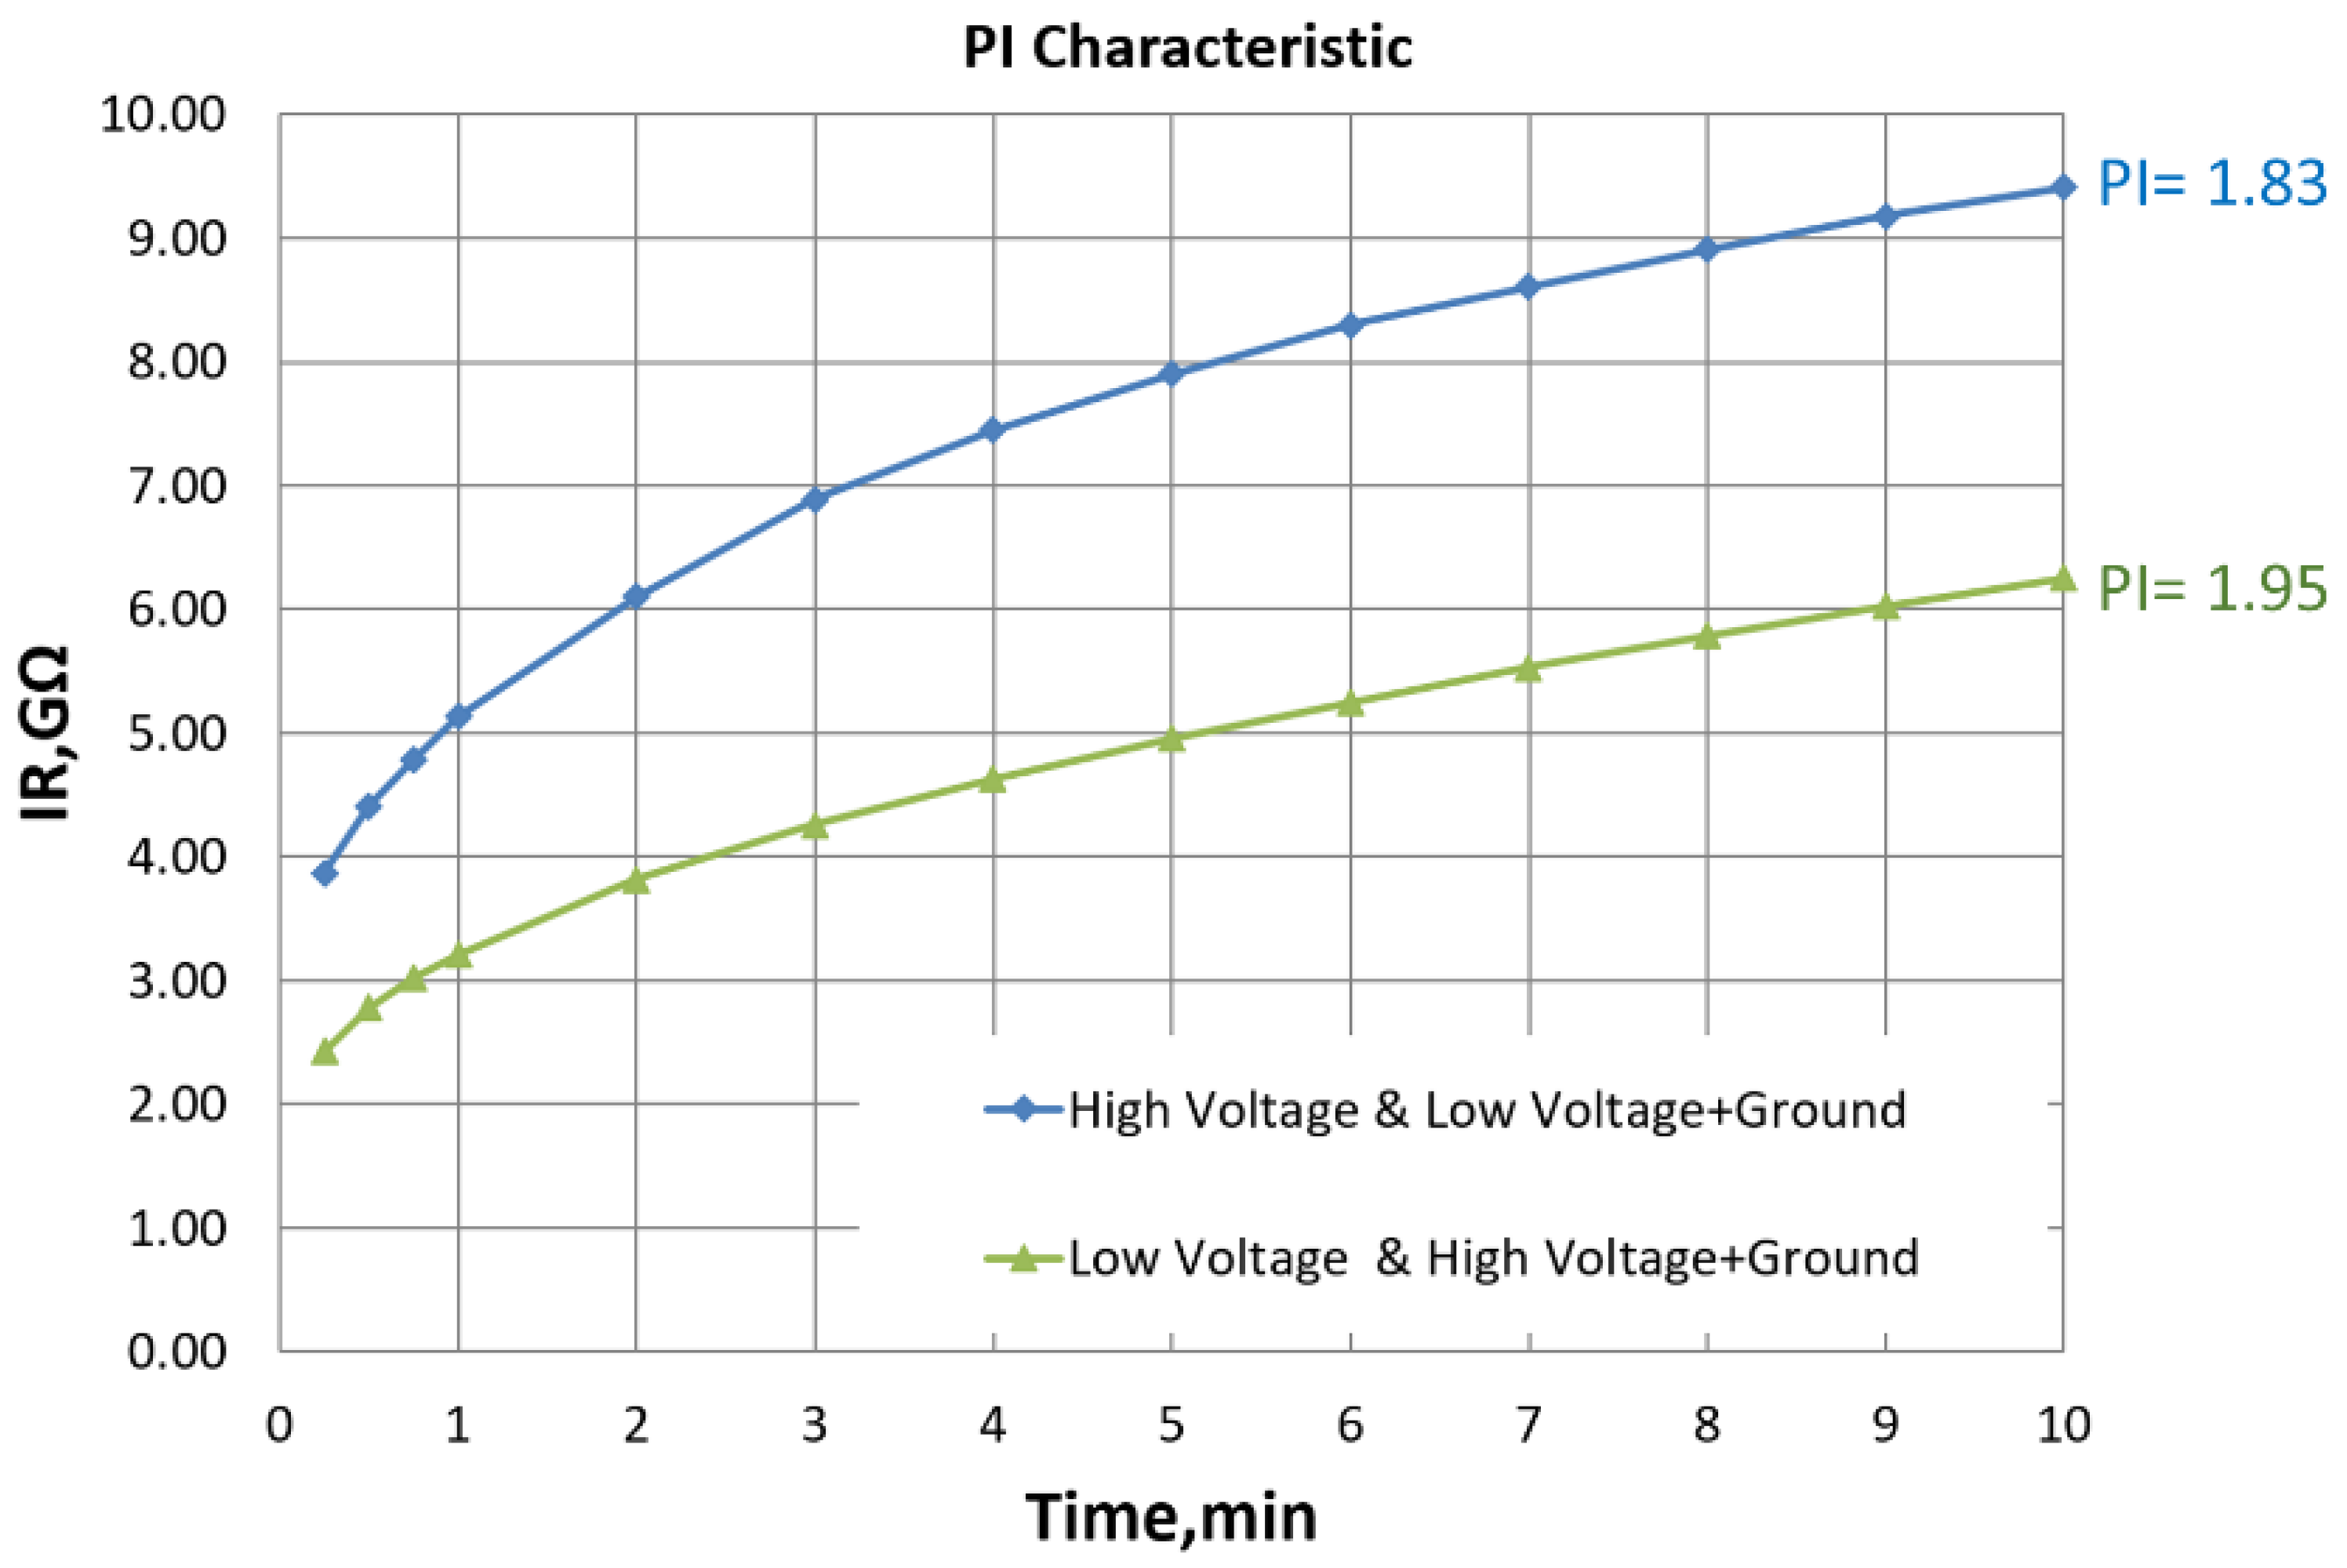
Figure 6.
(a) Equivalent circuit represents a dielectric and (b) phasor diagram.
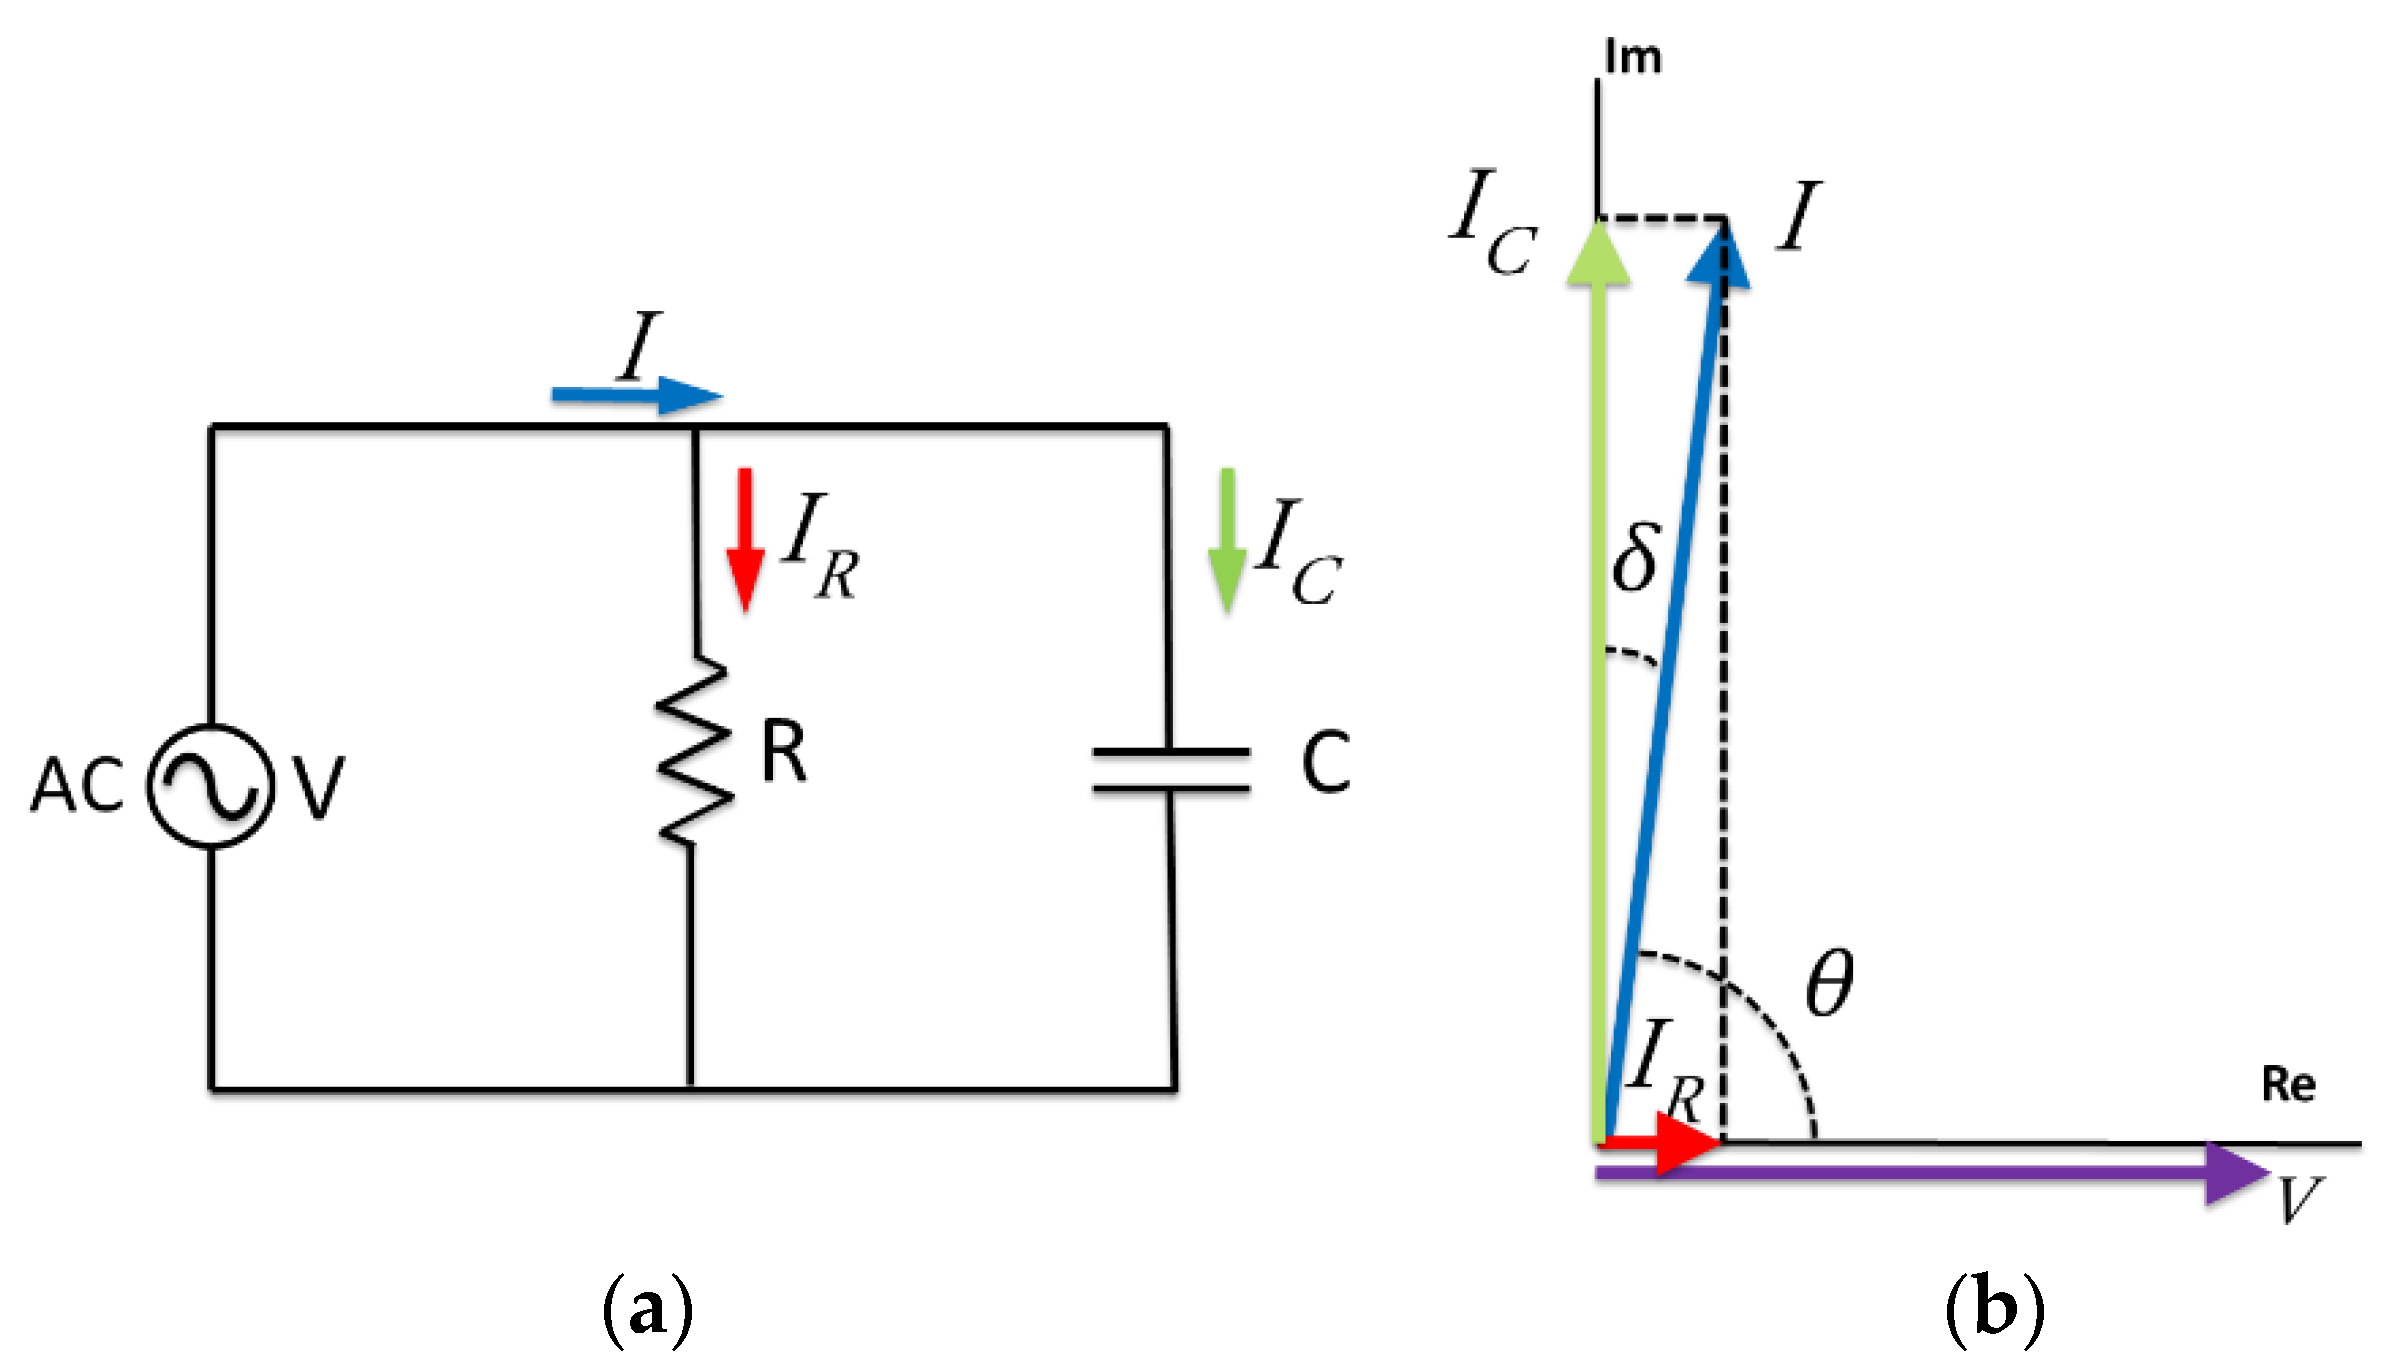
Figure 7.
Equivalent circuit for bushing PF monitoring.
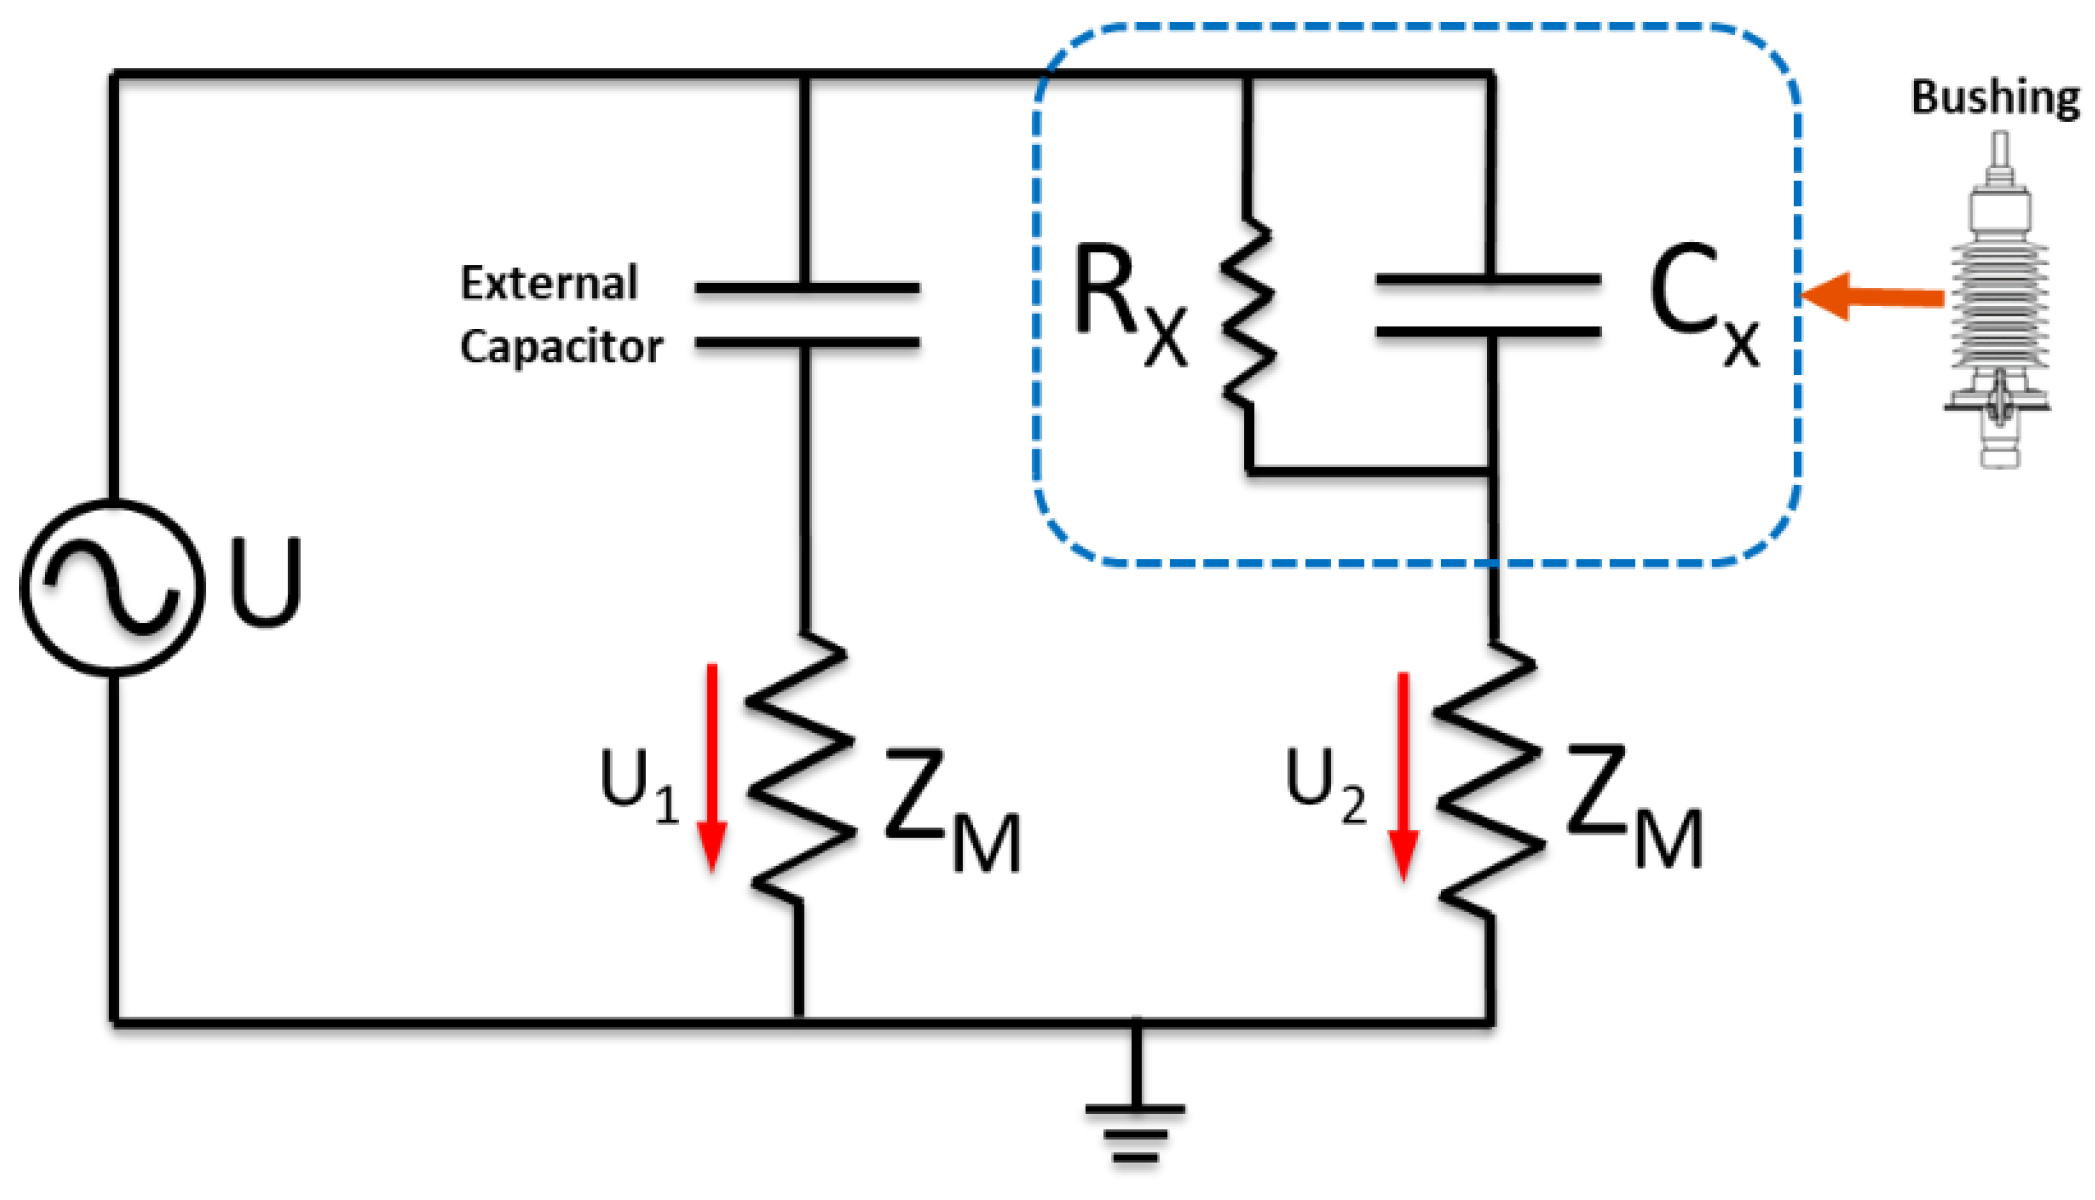
Figure 8.
(a) Basic RVM measuring circuit and (b) measurements.
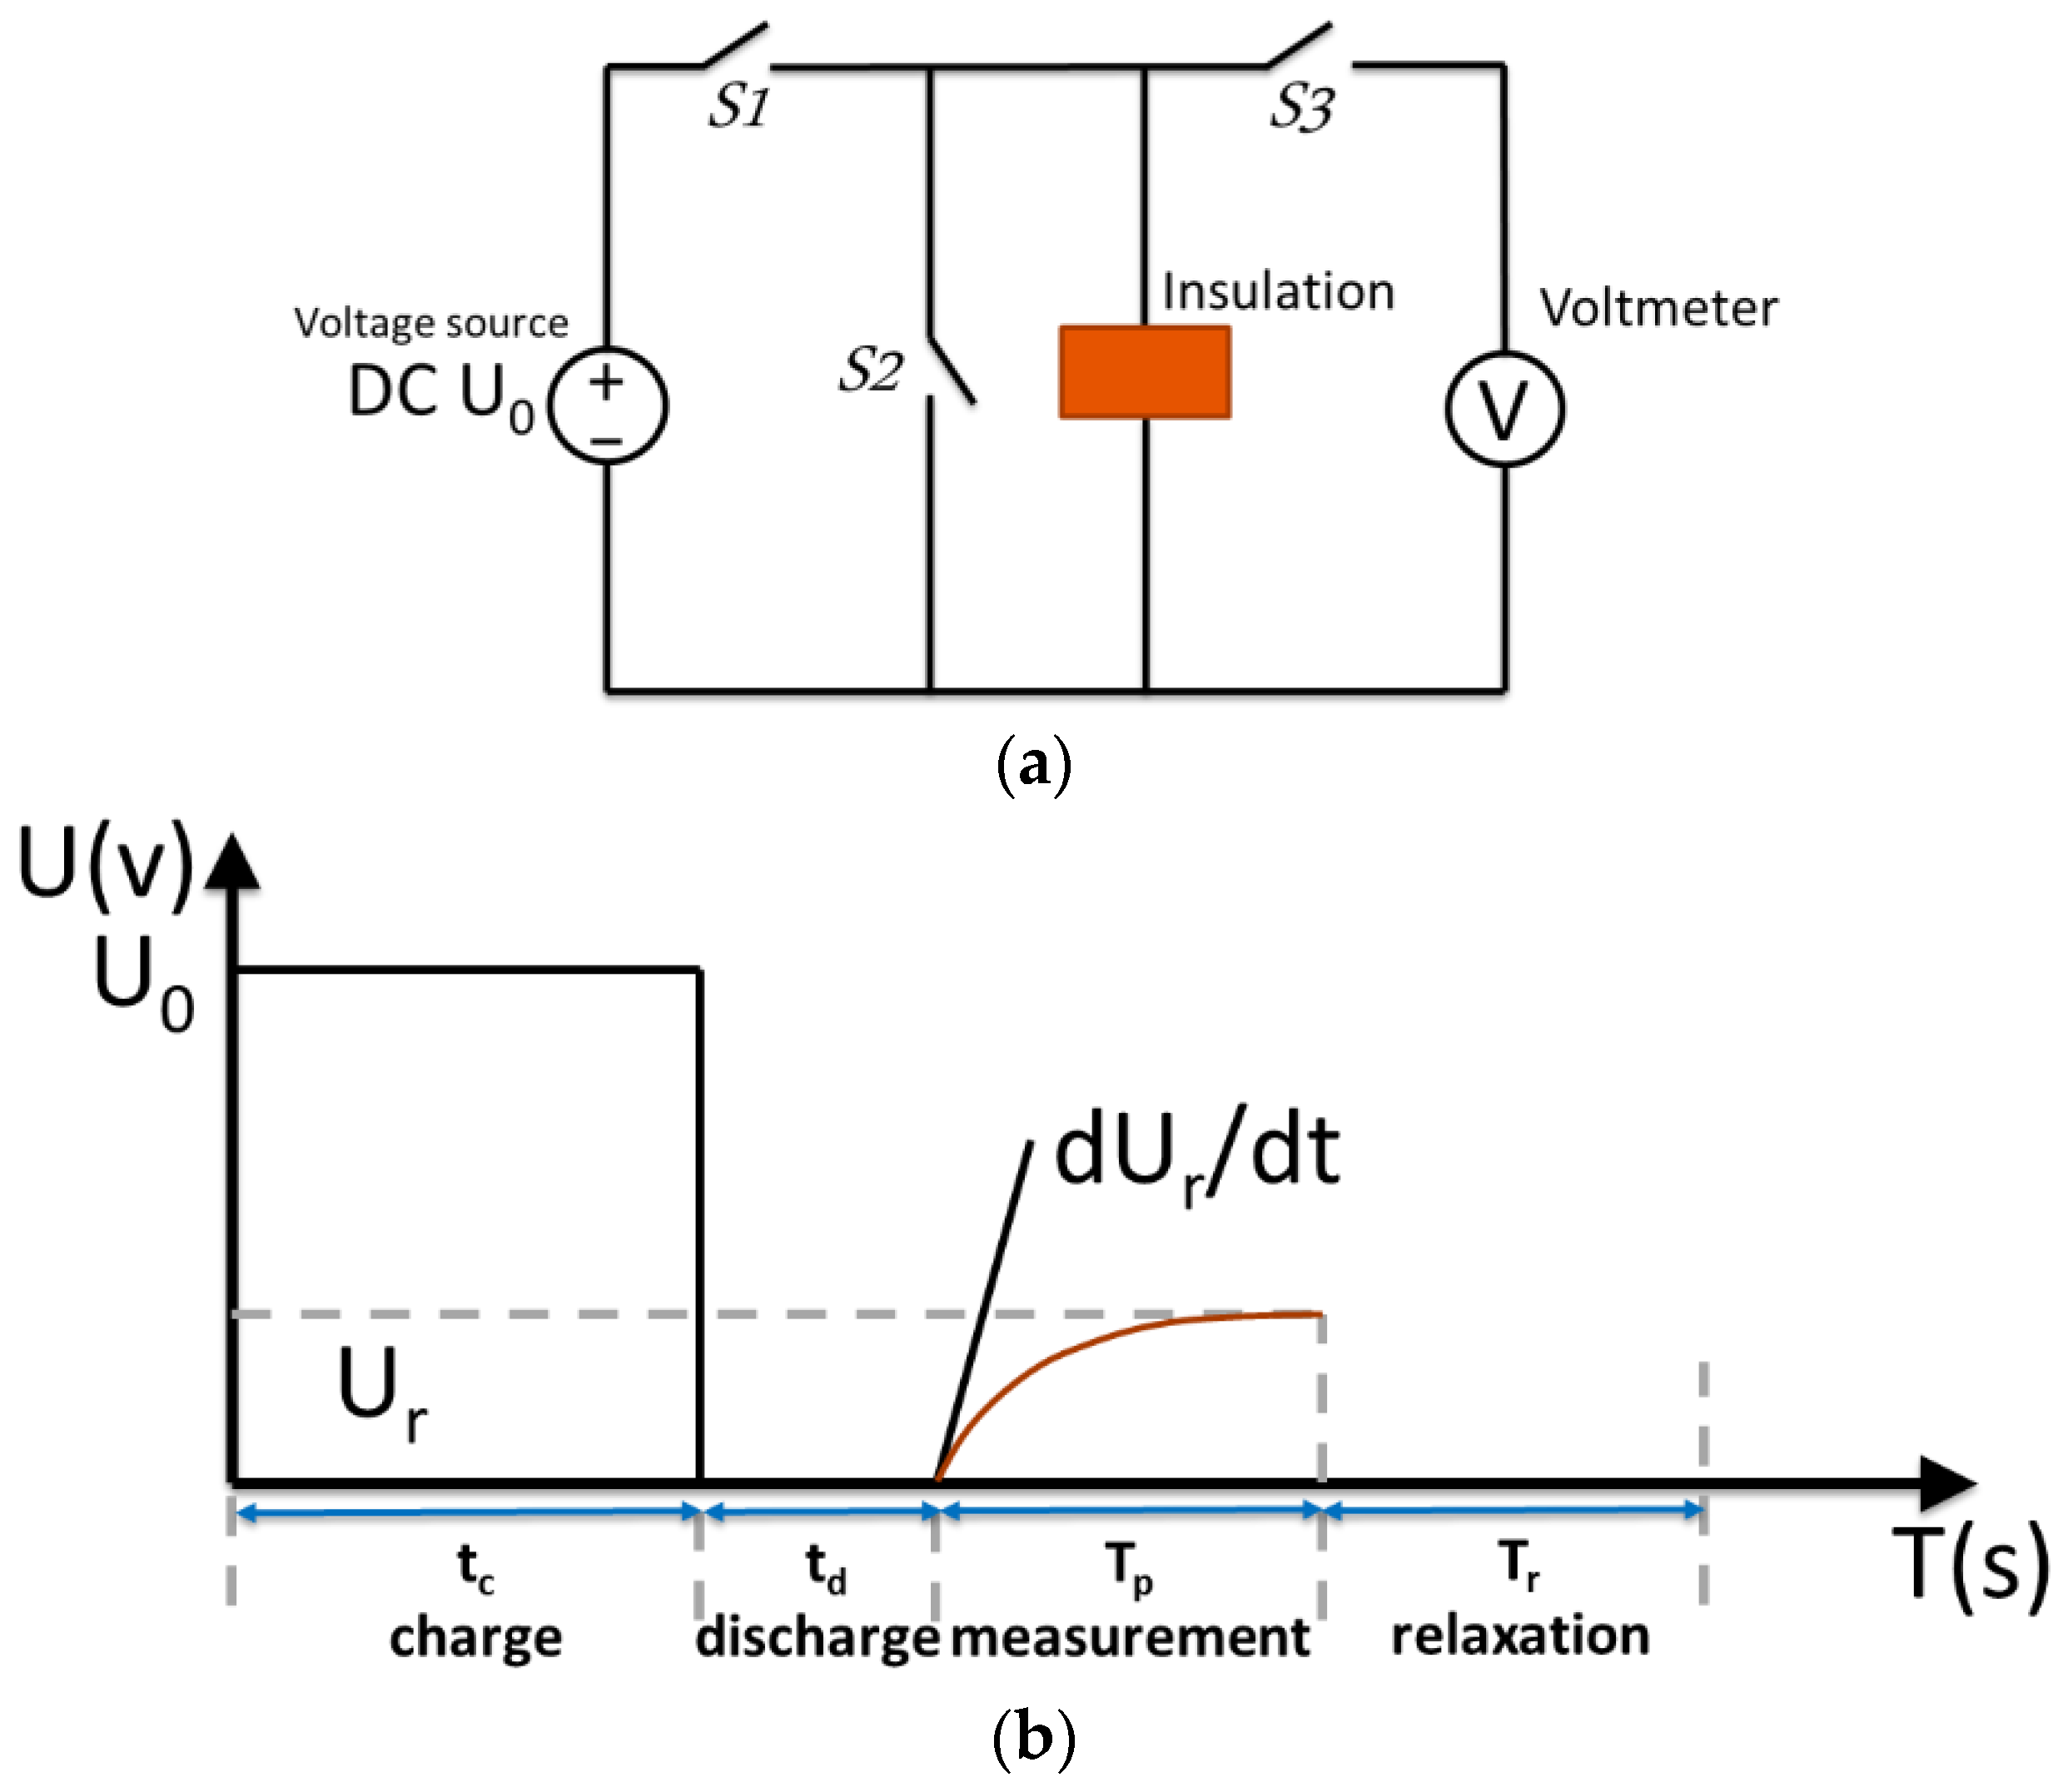
Figure 9.
Example of RVM polarization spectrum.
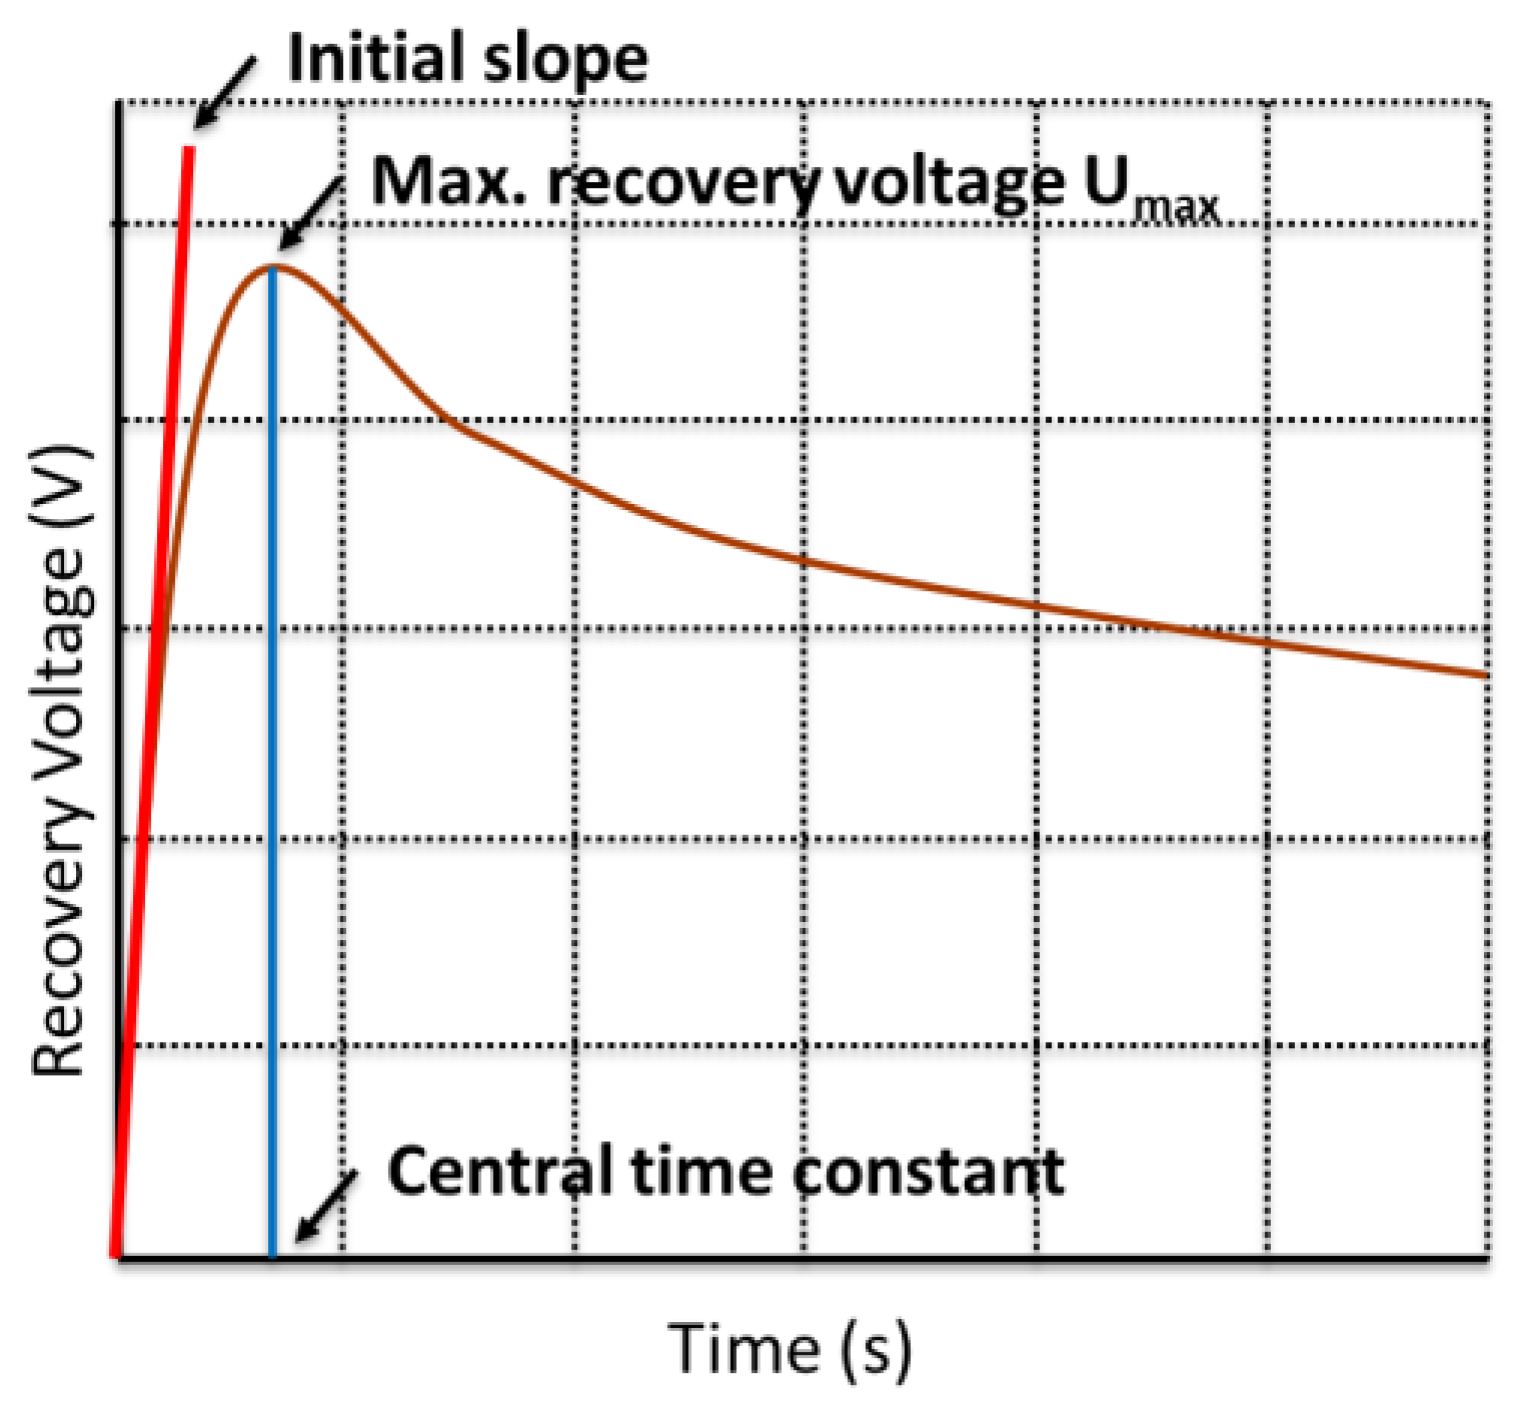
Figure 10.
(a) Basic PDC measuring circuit and (b) waveform of polarization and depolarization currents.
Figure 10.
(a) Basic PDC measuring circuit and (b) waveform of polarization and depolarization currents.

Figure 11.
Example of relationship between polarization/depolarization currents and insulation conductivity.
Figure 11.
Example of relationship between polarization/depolarization currents and insulation conductivity.
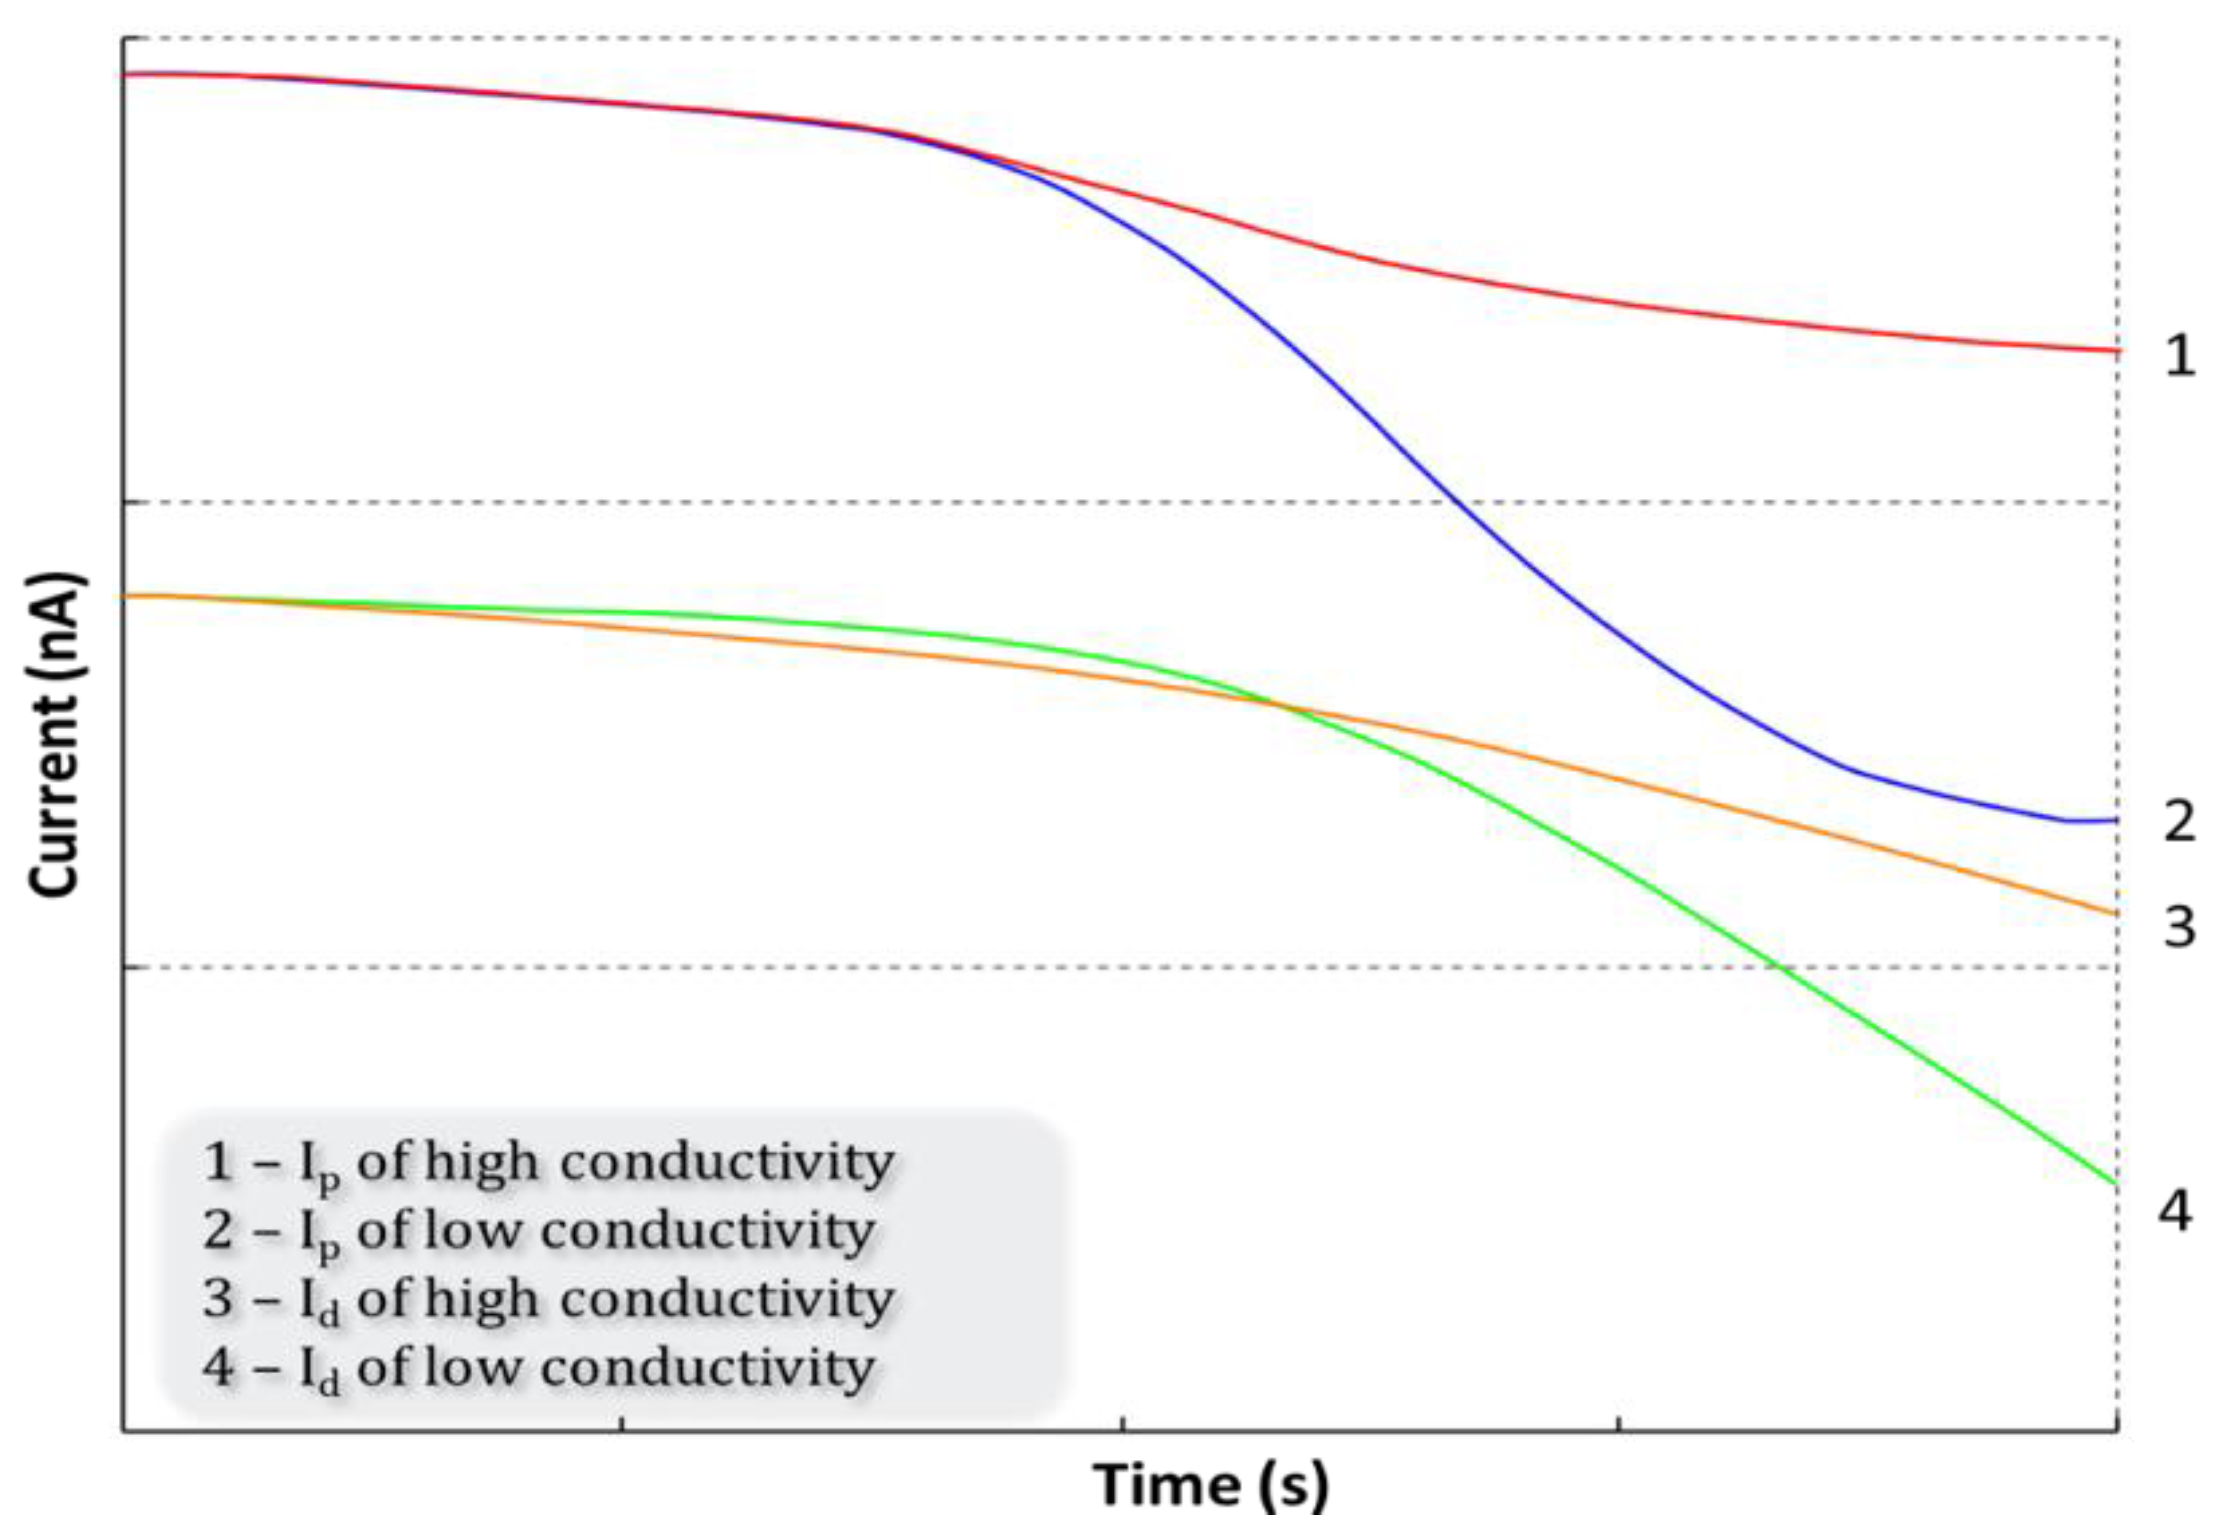
Figure 12.
(a) Basic FDS measuring circuit and (b) typical FDS response.
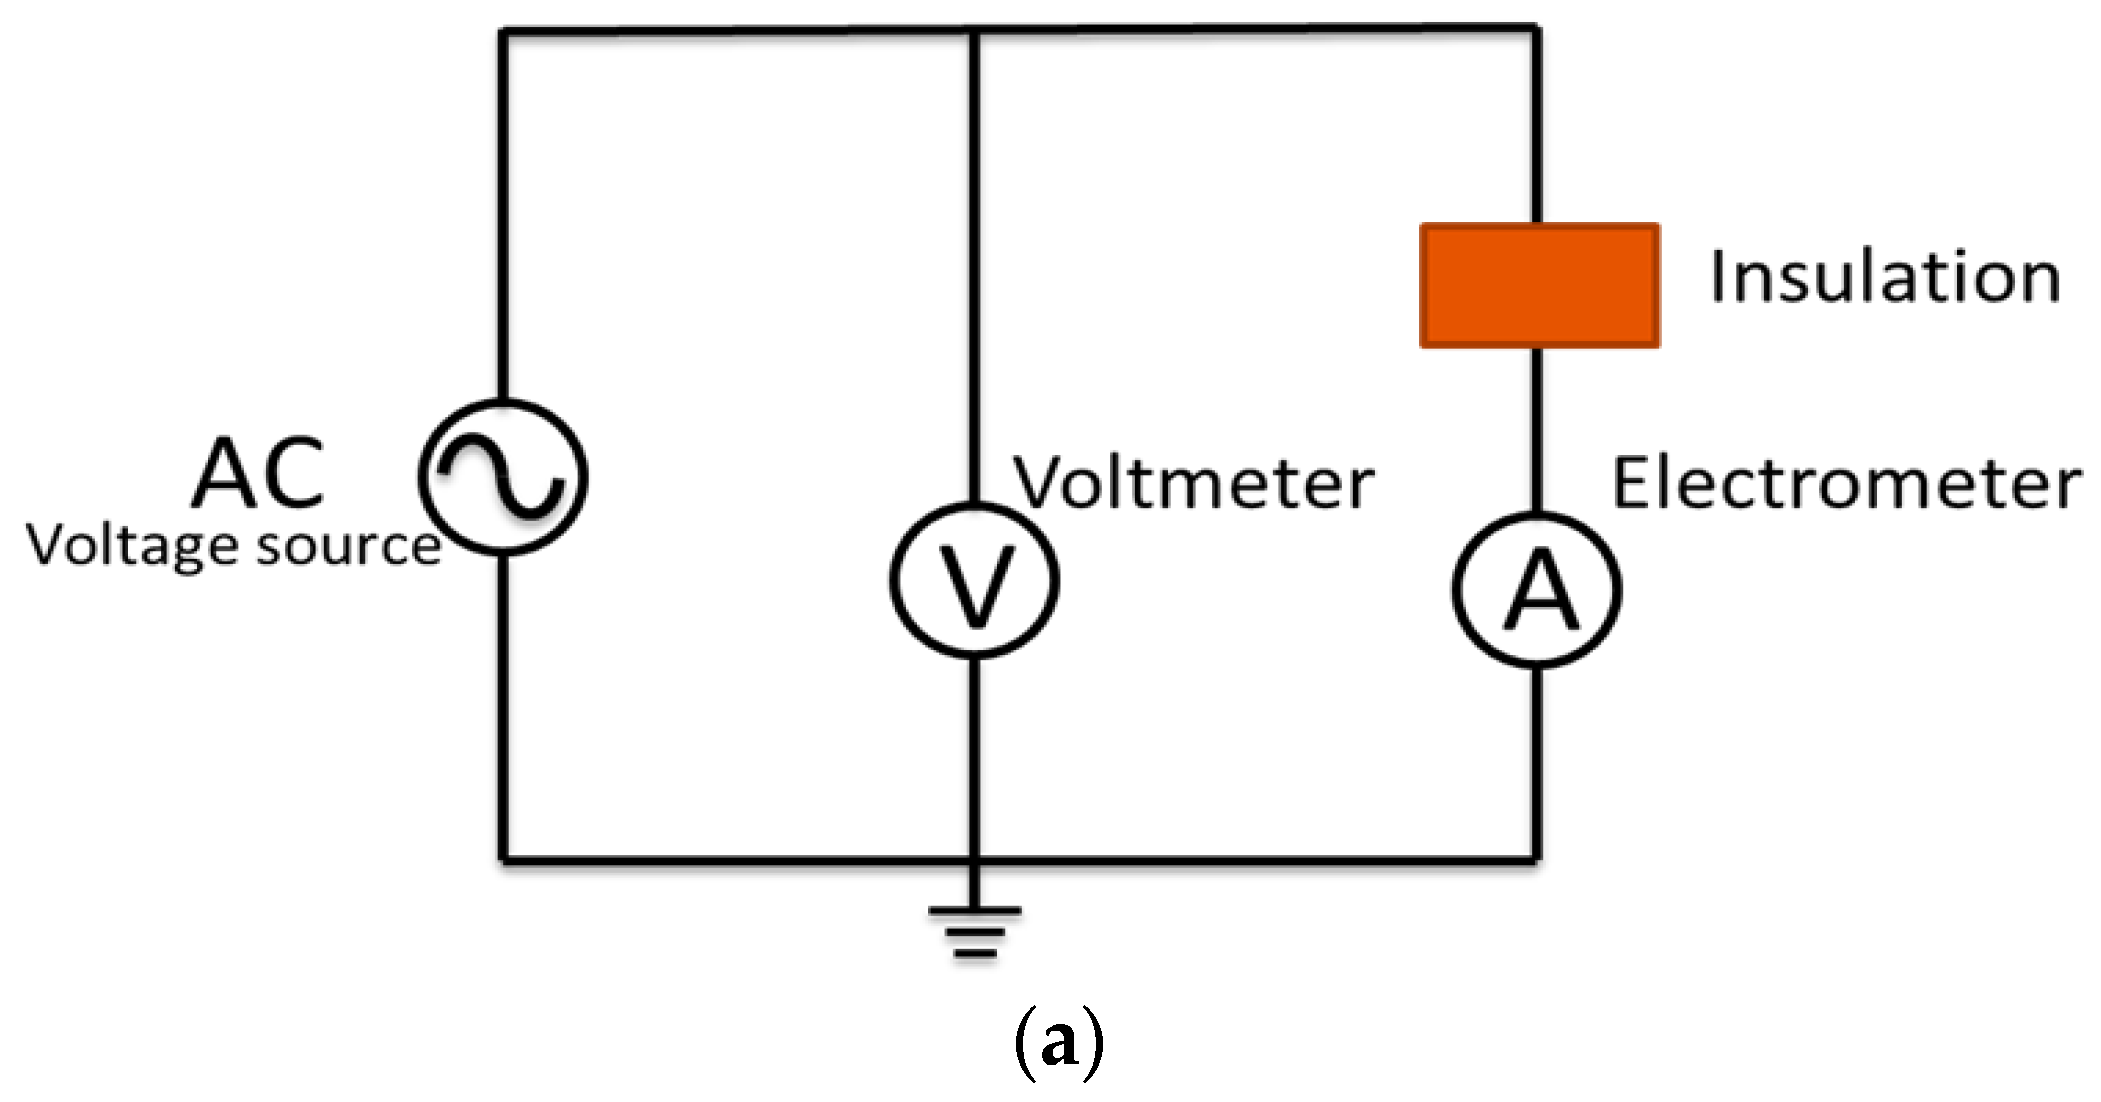
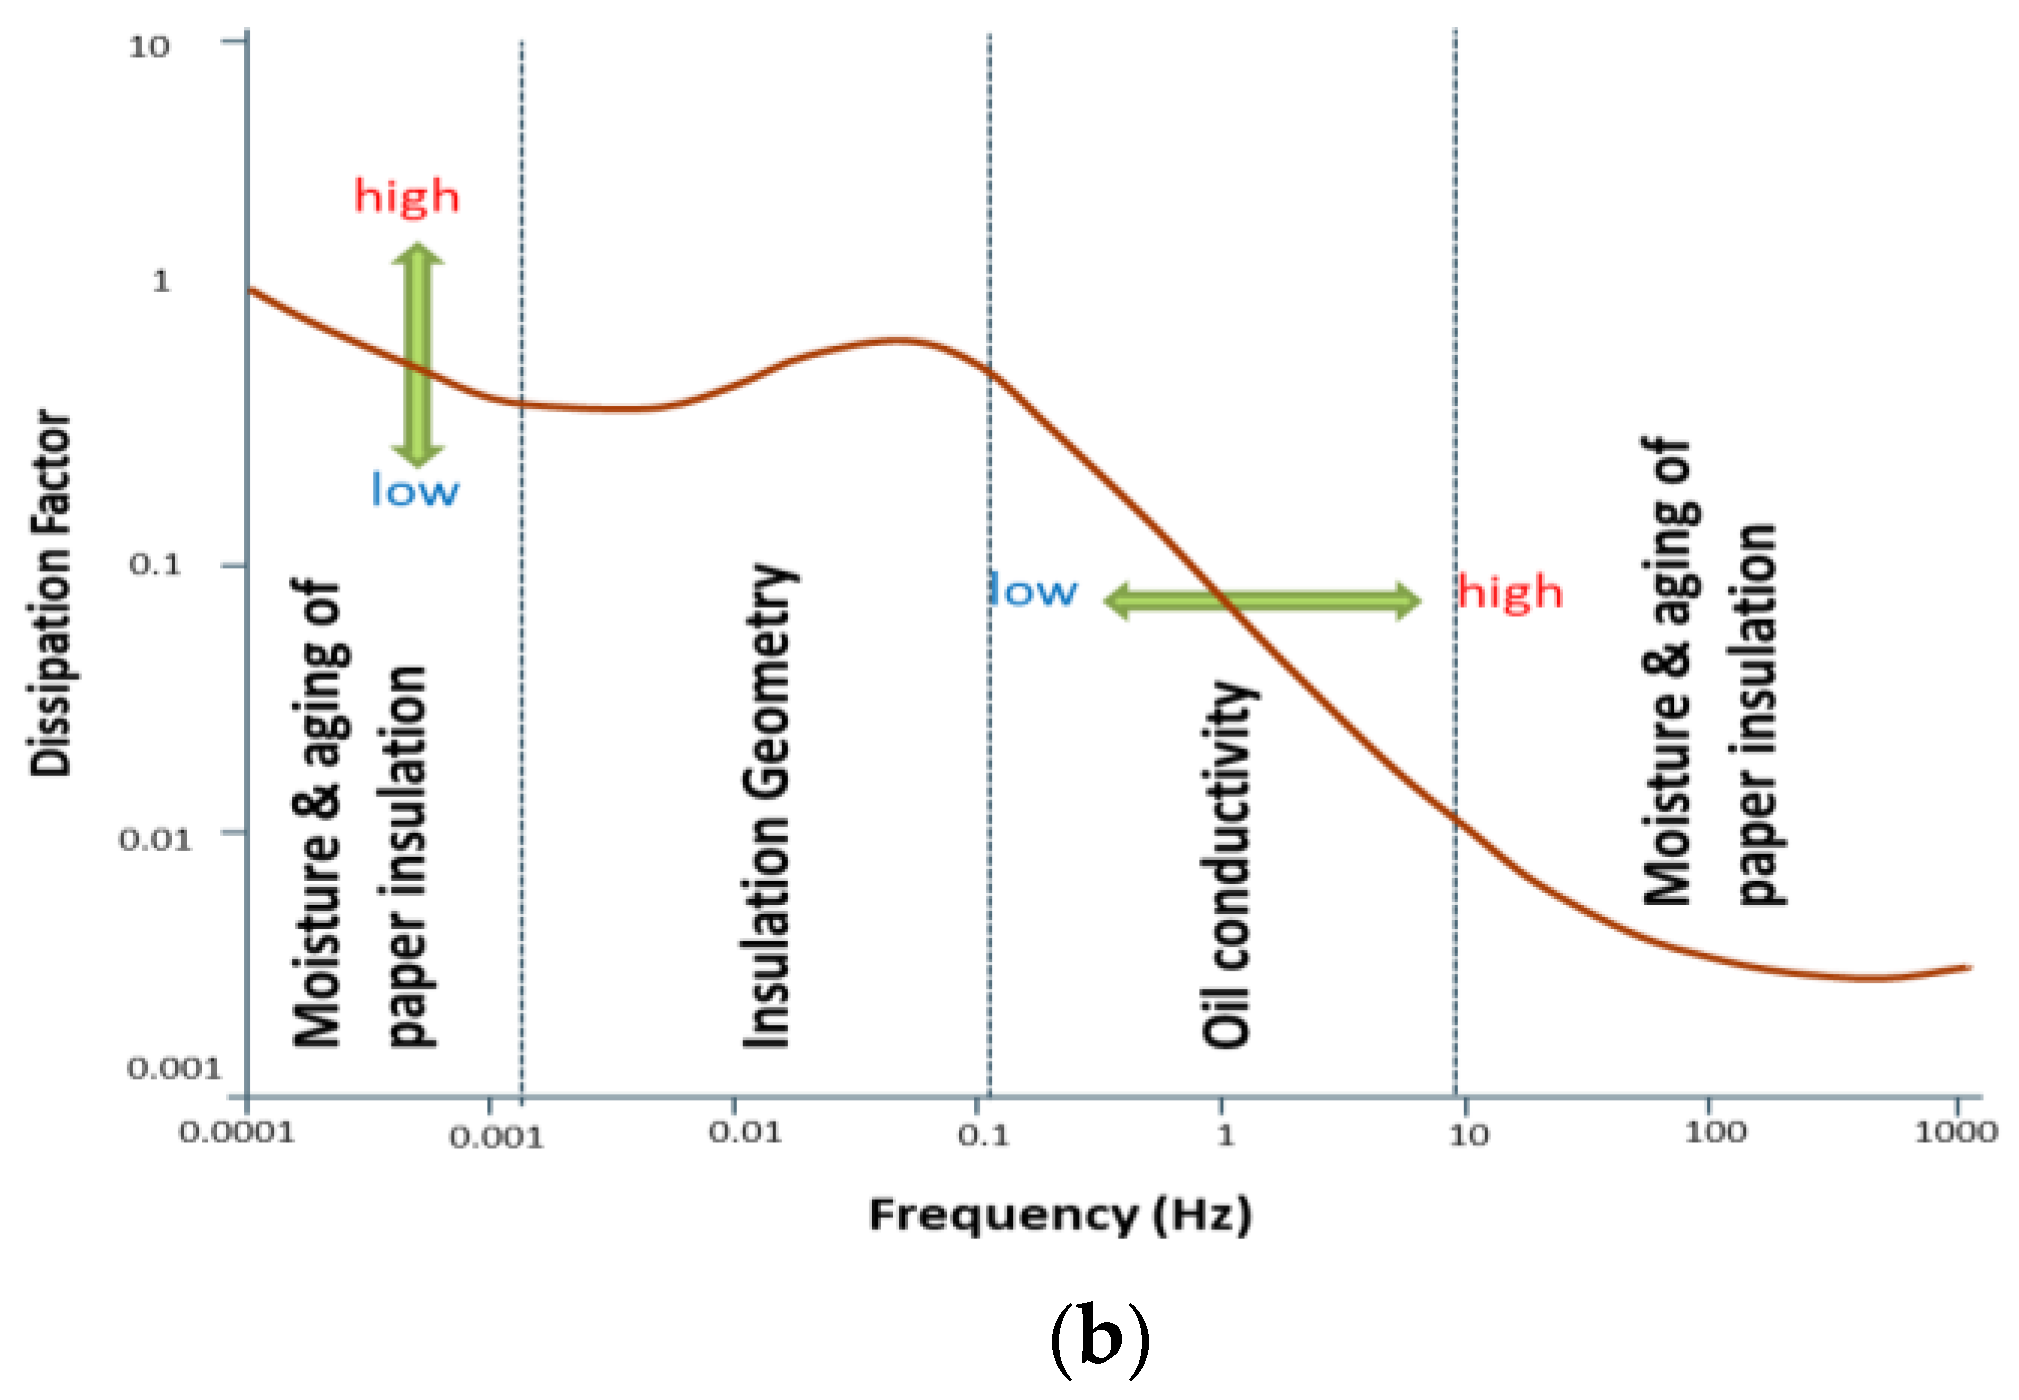
Figure 13.
FRA measurement example; (a) transfer function amplitude. (b) Transfer function phase angle.
Figure 13.
FRA measurement example; (a) transfer function amplitude. (b) Transfer function phase angle.
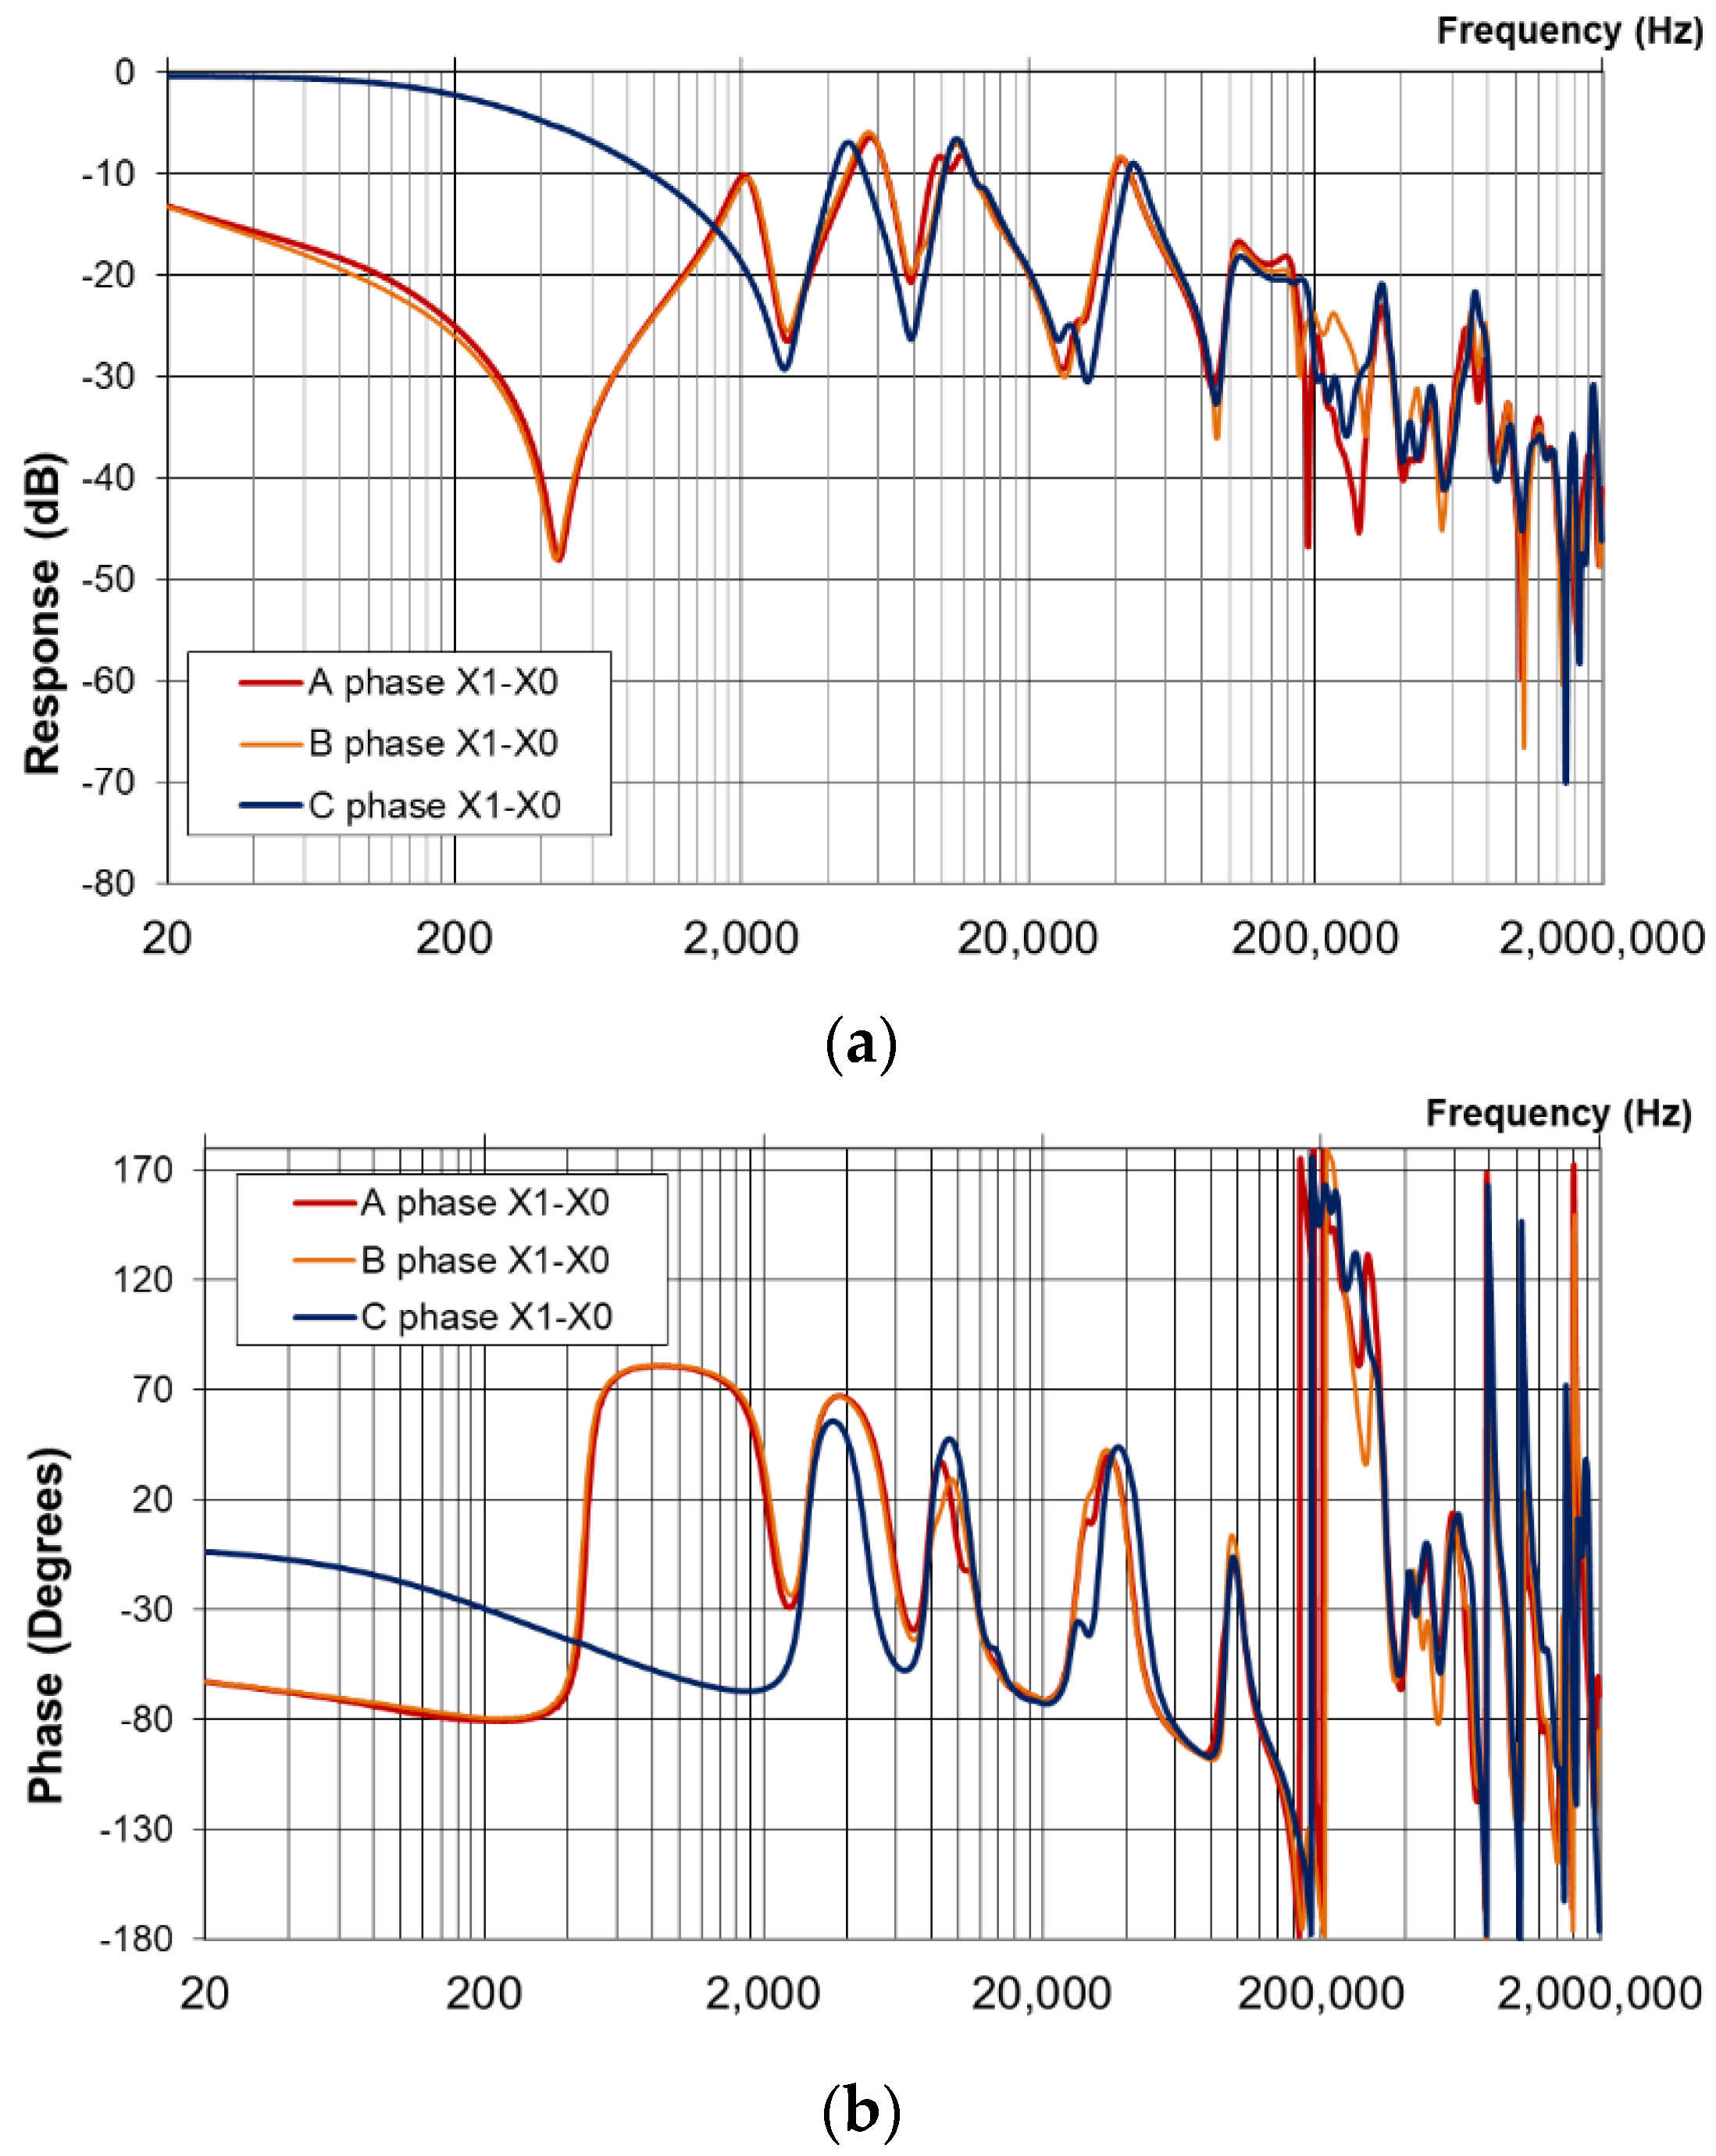
Figure 14.
Headspace extraction structure diagram and membrane structure.
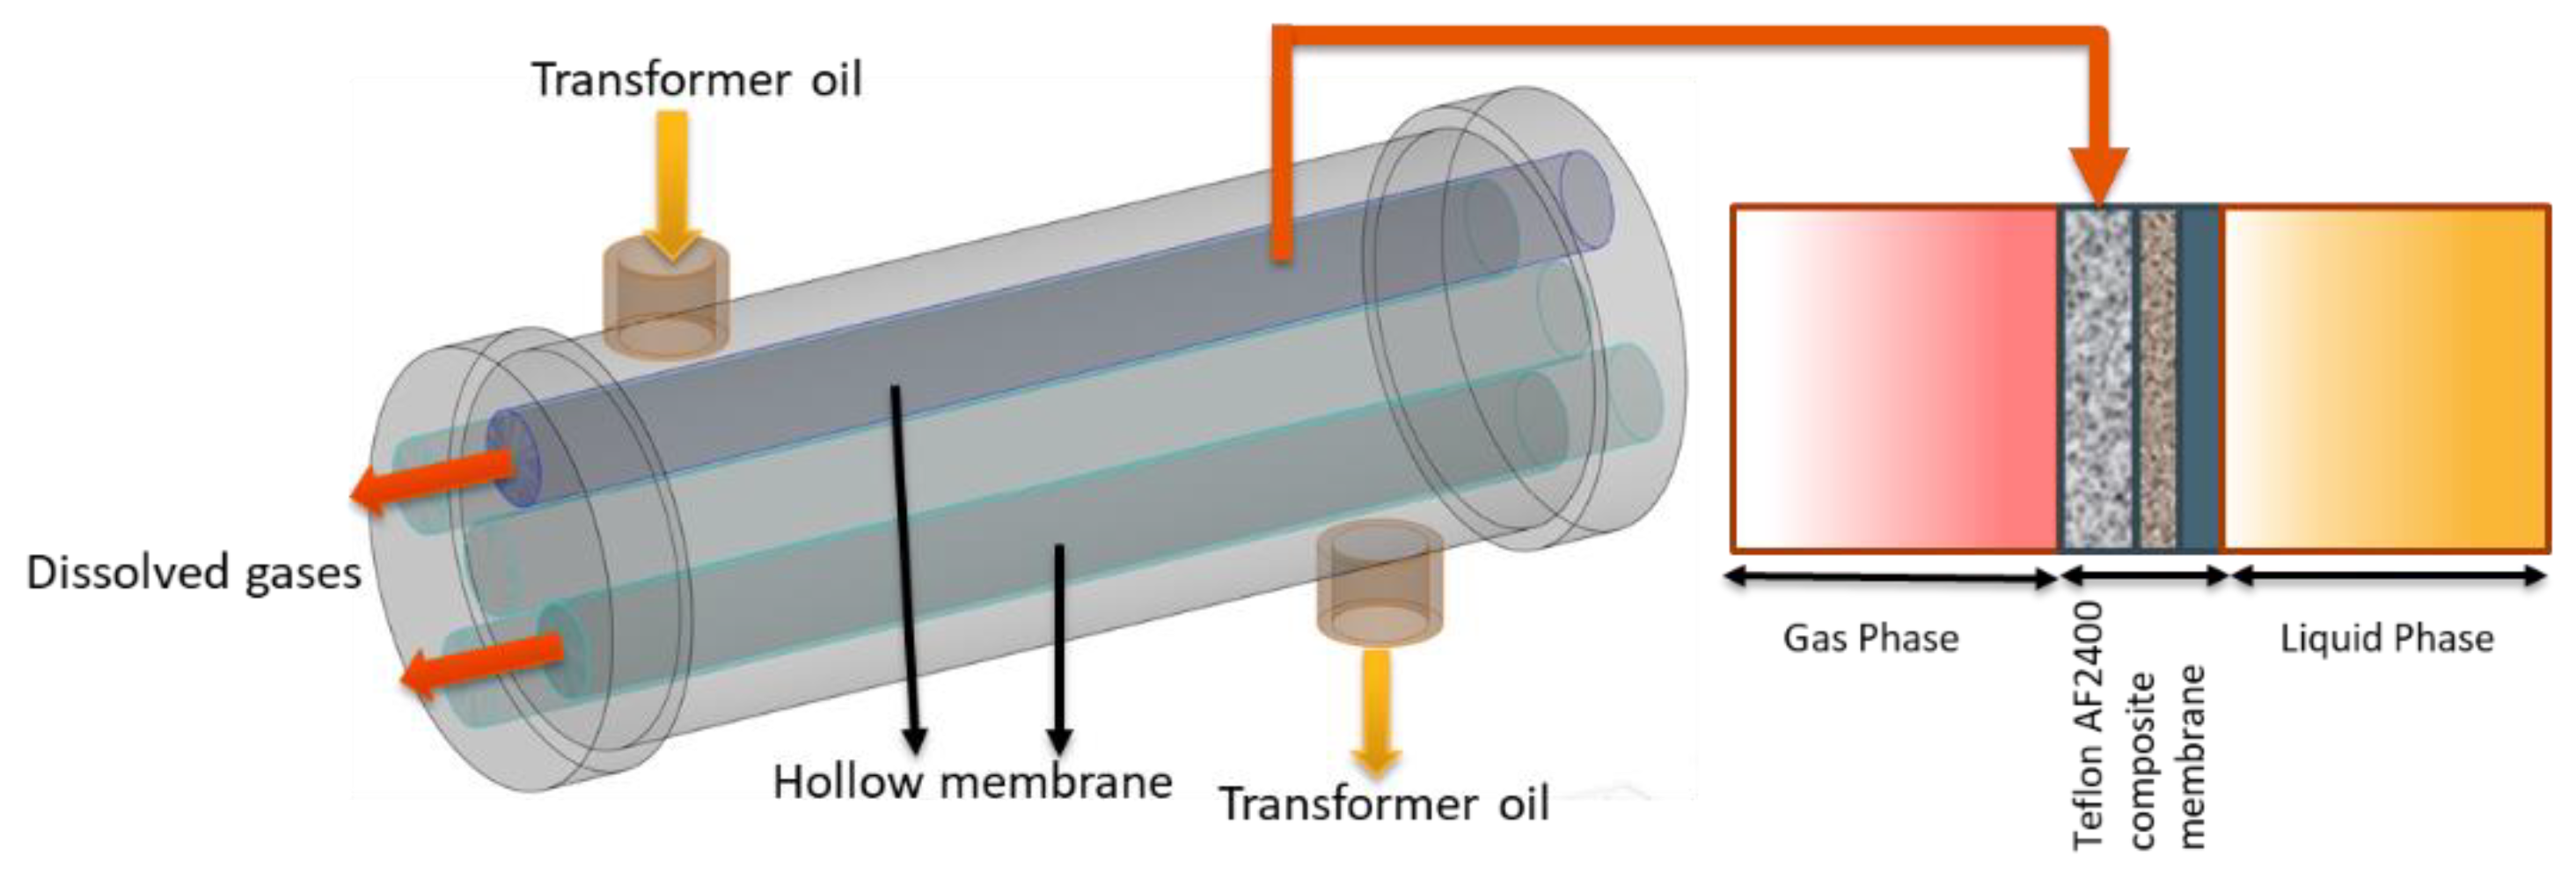
Figure 15.
Online GC system using SOFC detector.
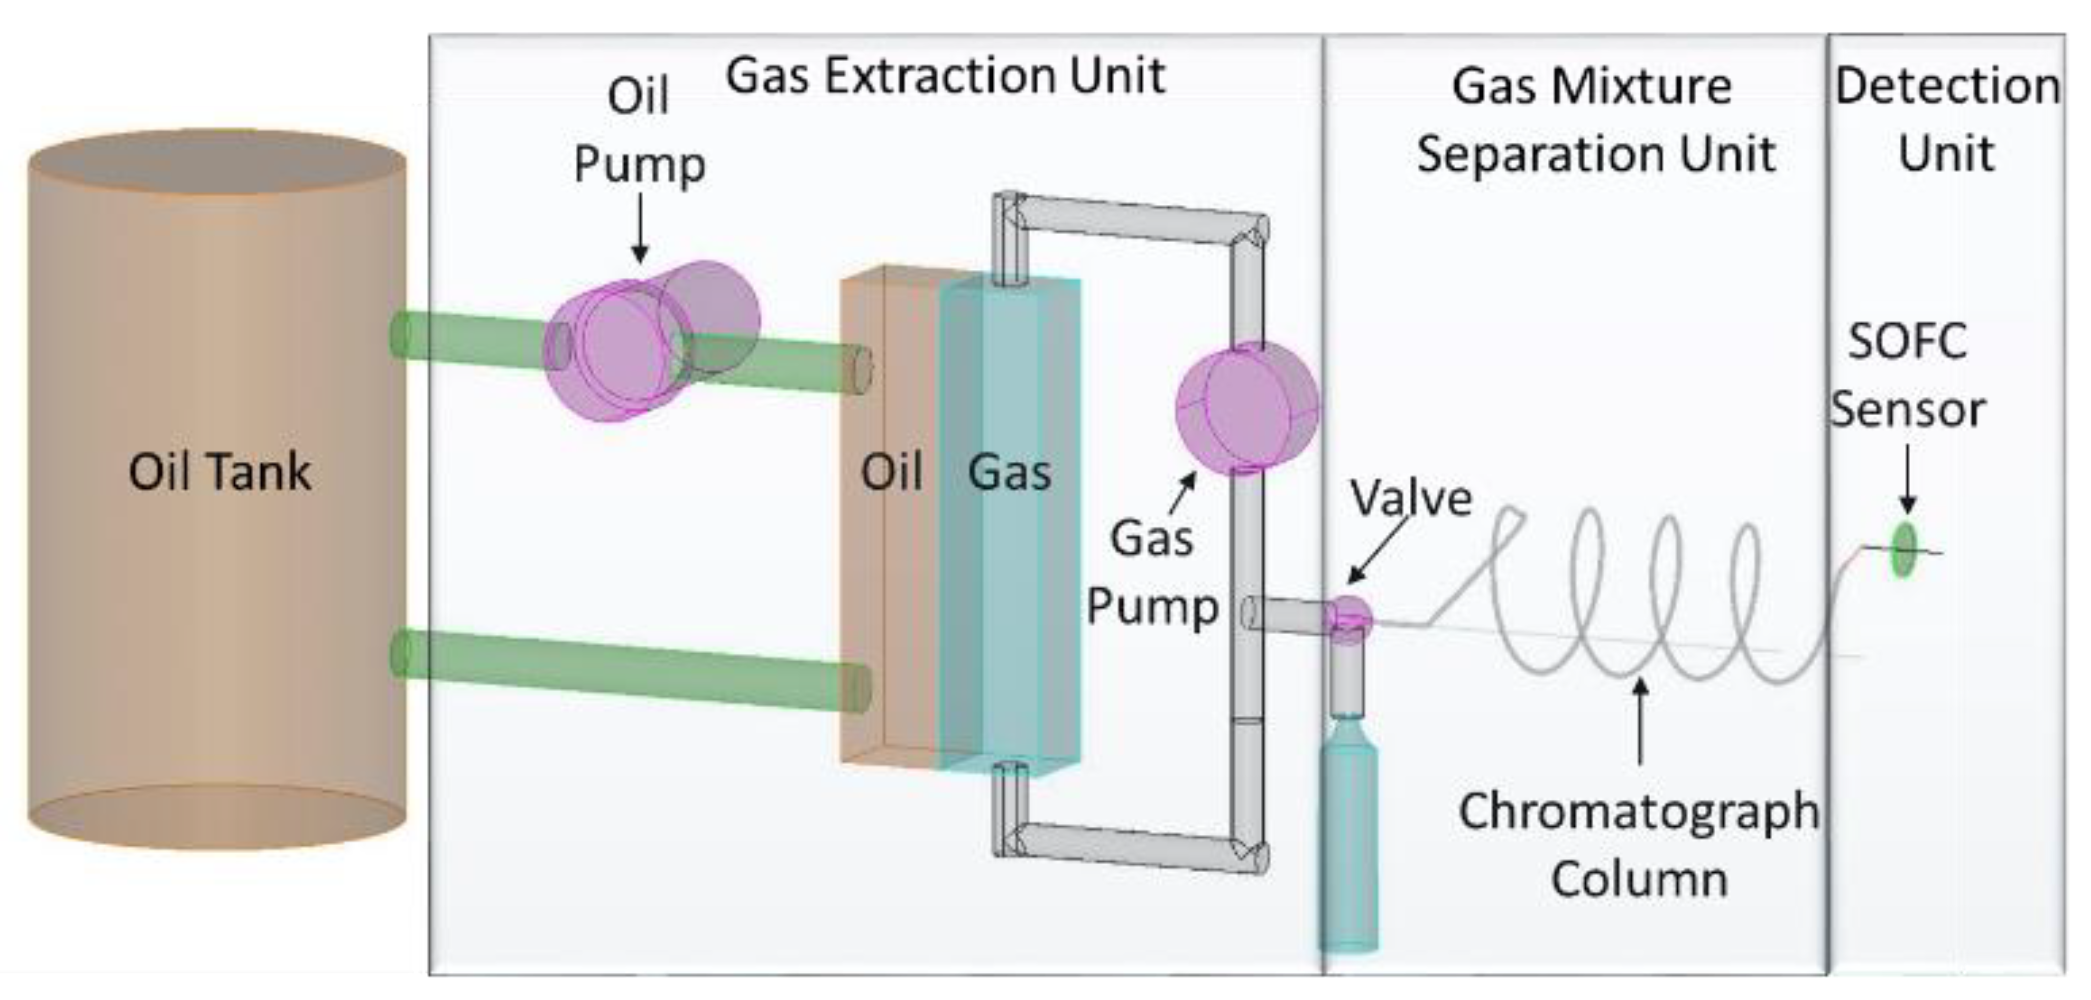
Figure 16.
Example of voltage signal output of SOFC detector equivalent to gas concentrations.

Figure 17.
The principle of photo-acoustic effect.

Figure 18.
Schematic diagram of PAS detection unit.

Figure 19.
The electromagnetic spectrum for various wavelength regions of light.
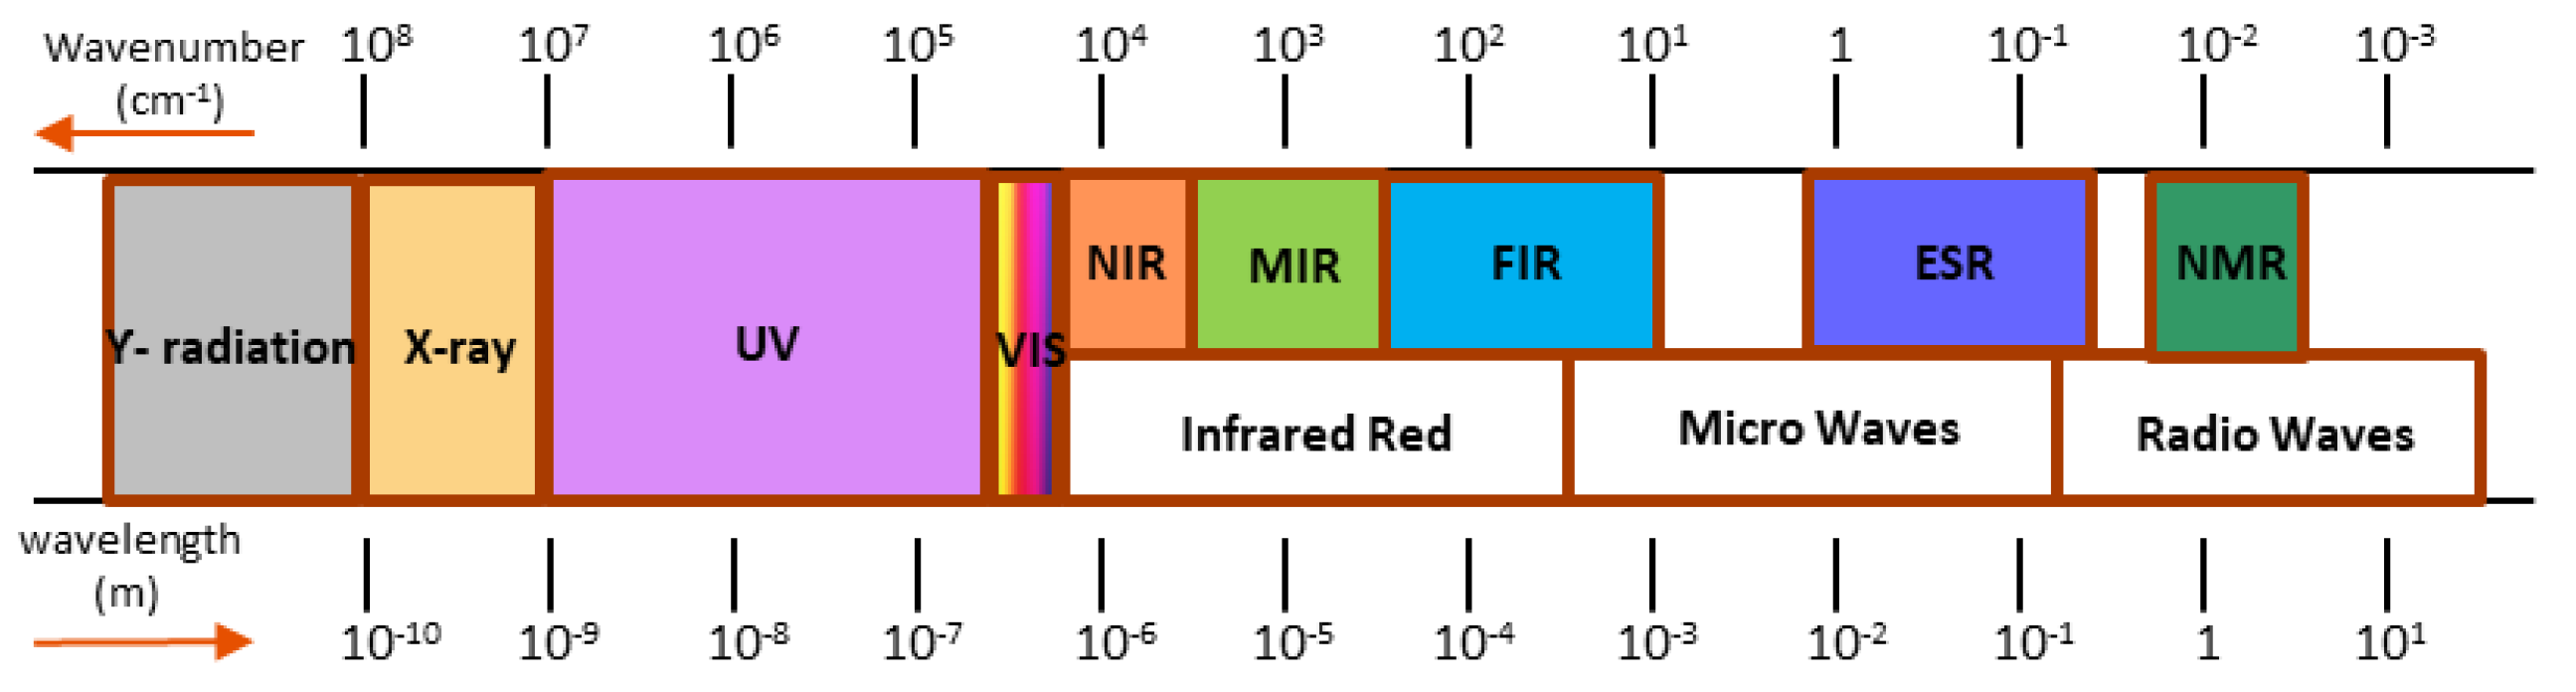
Figure 20.
Diagram of H2 atoms reacting with a Pd surface.
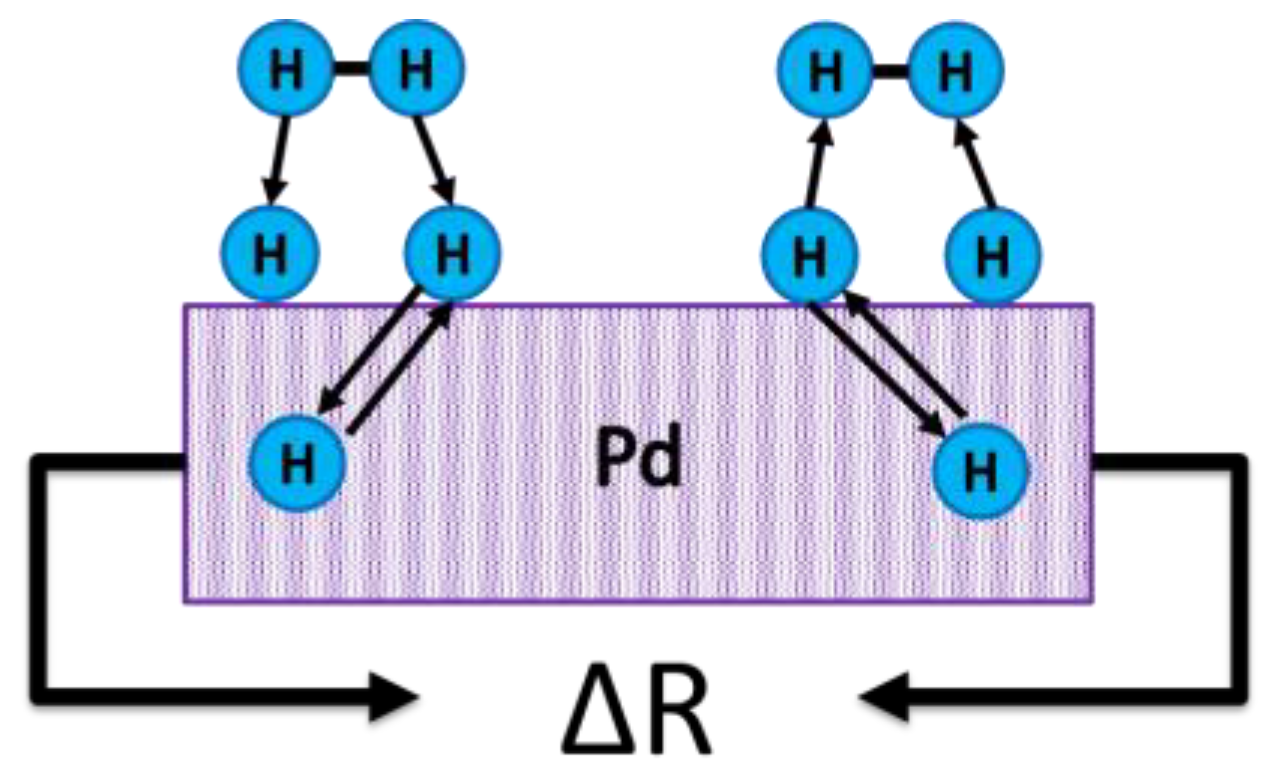
Figure 21.
Classic Duval Triangle from IEEE C57.104.

Figure 22.
Duval pentagon 1 from IEEE C57.104.

Figure 23.
The process of PD measurement.
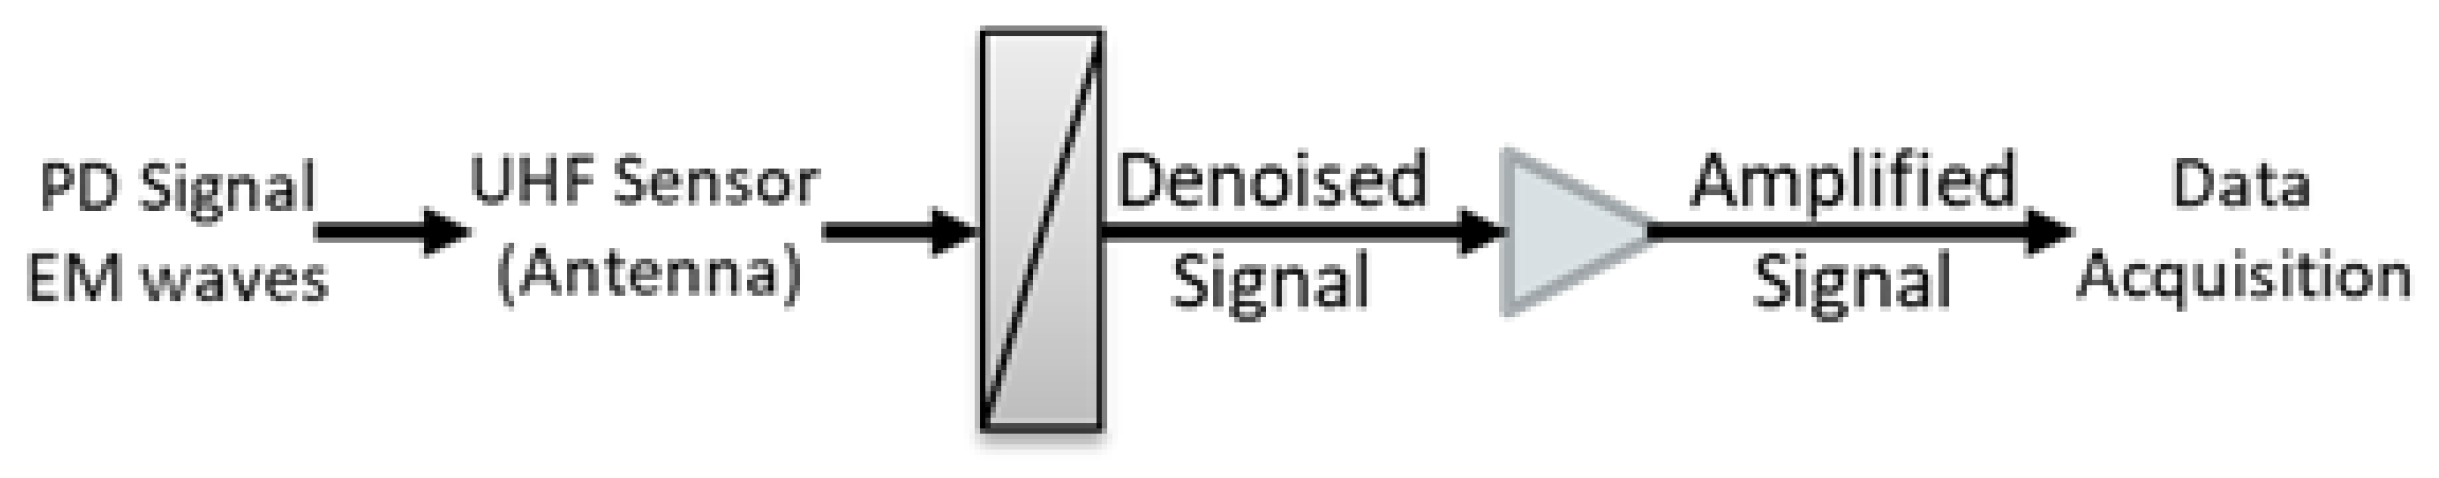
Figure 24.
(a) Signal of tuned UHF narrowband method and (b) bandwidth of UHF broadband method.
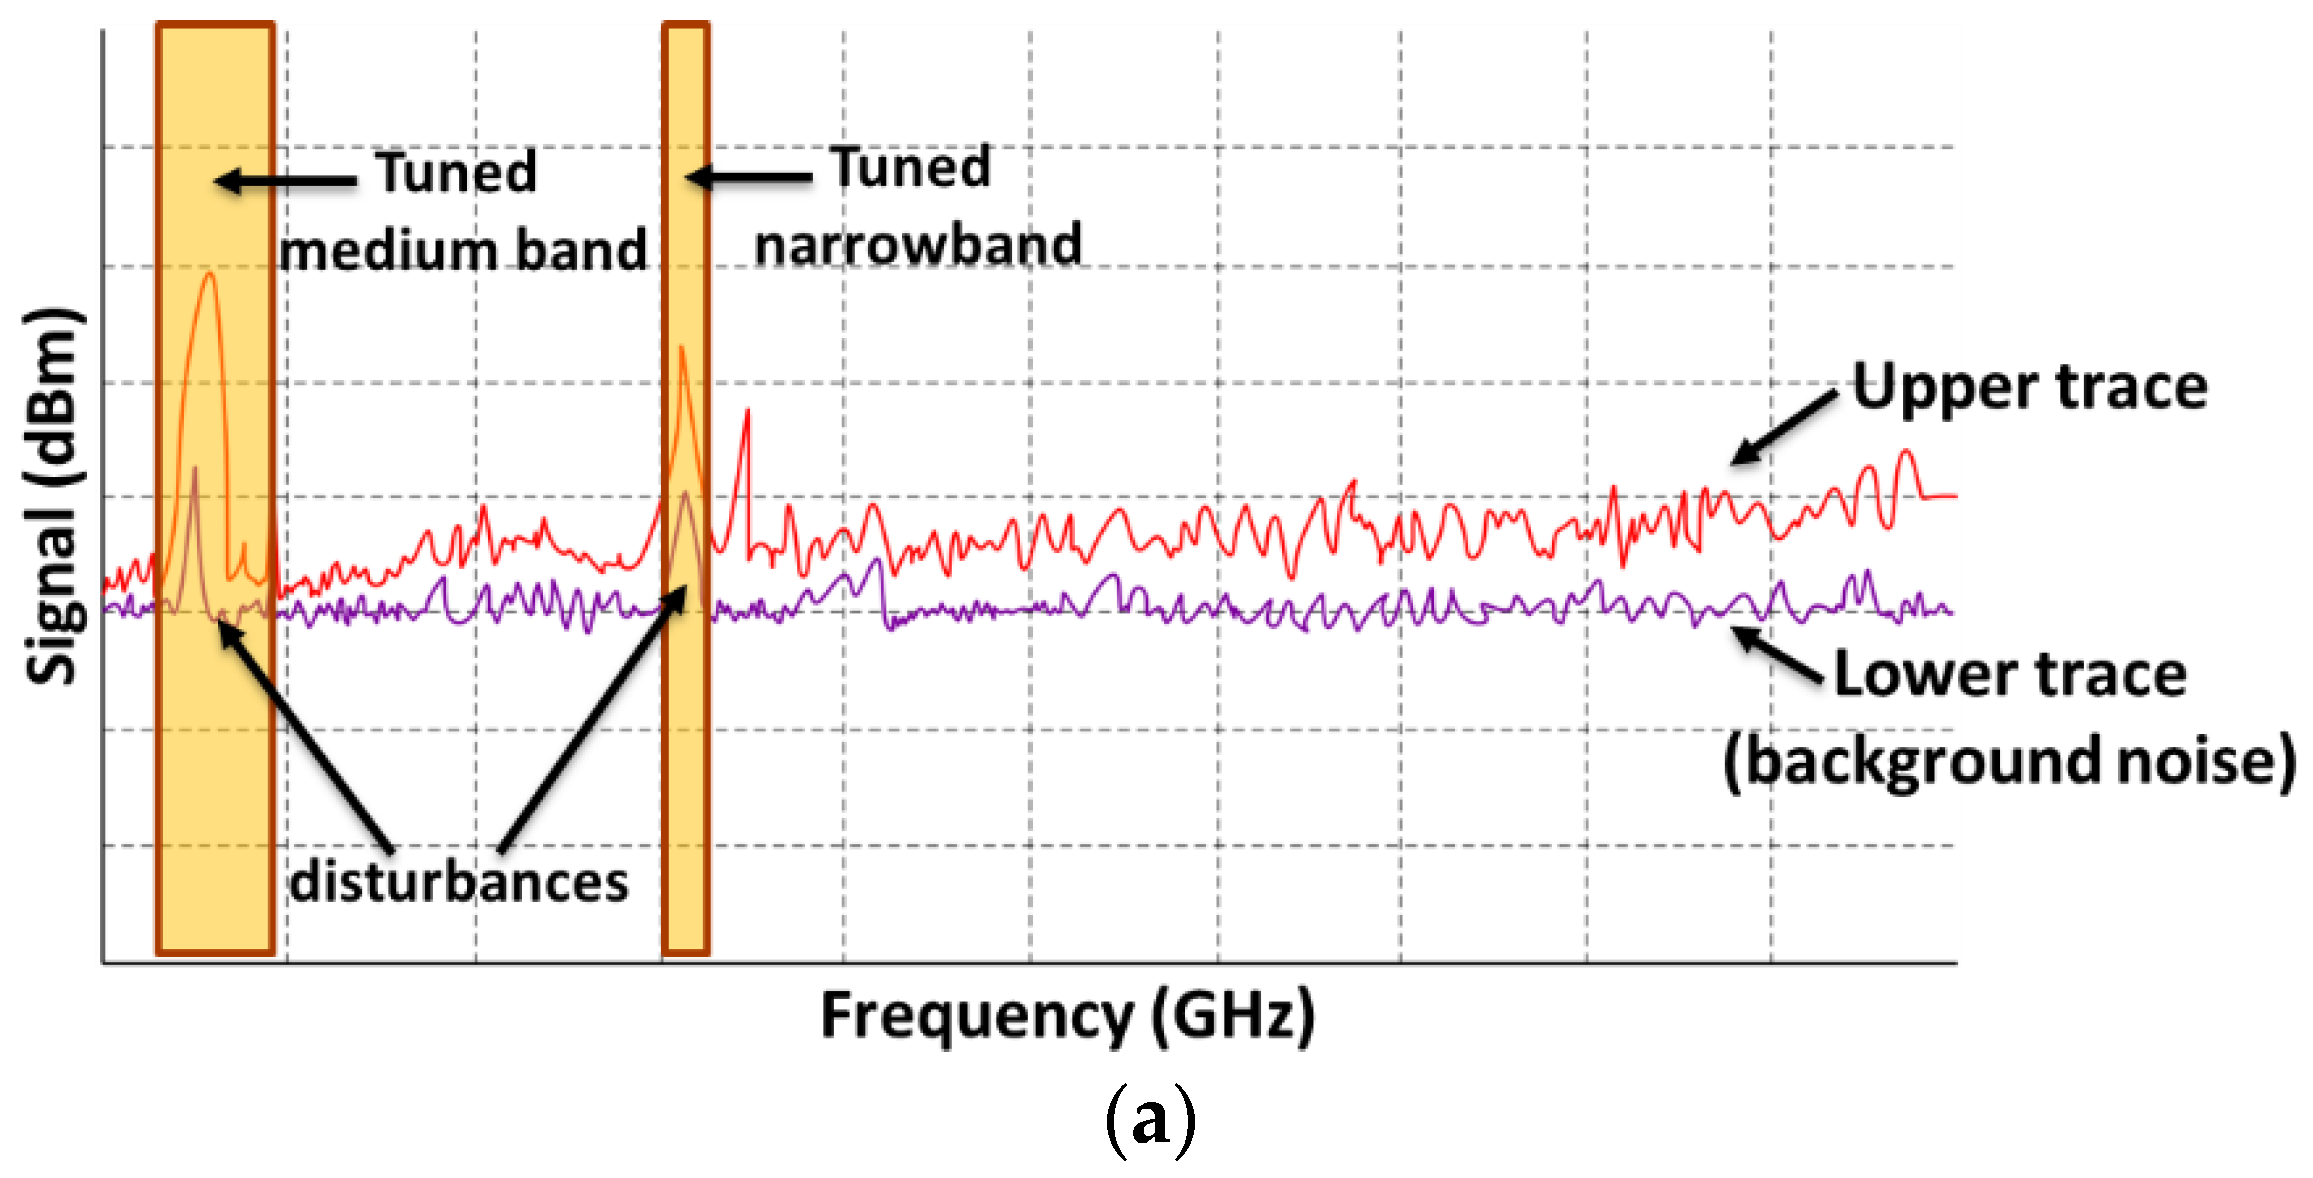
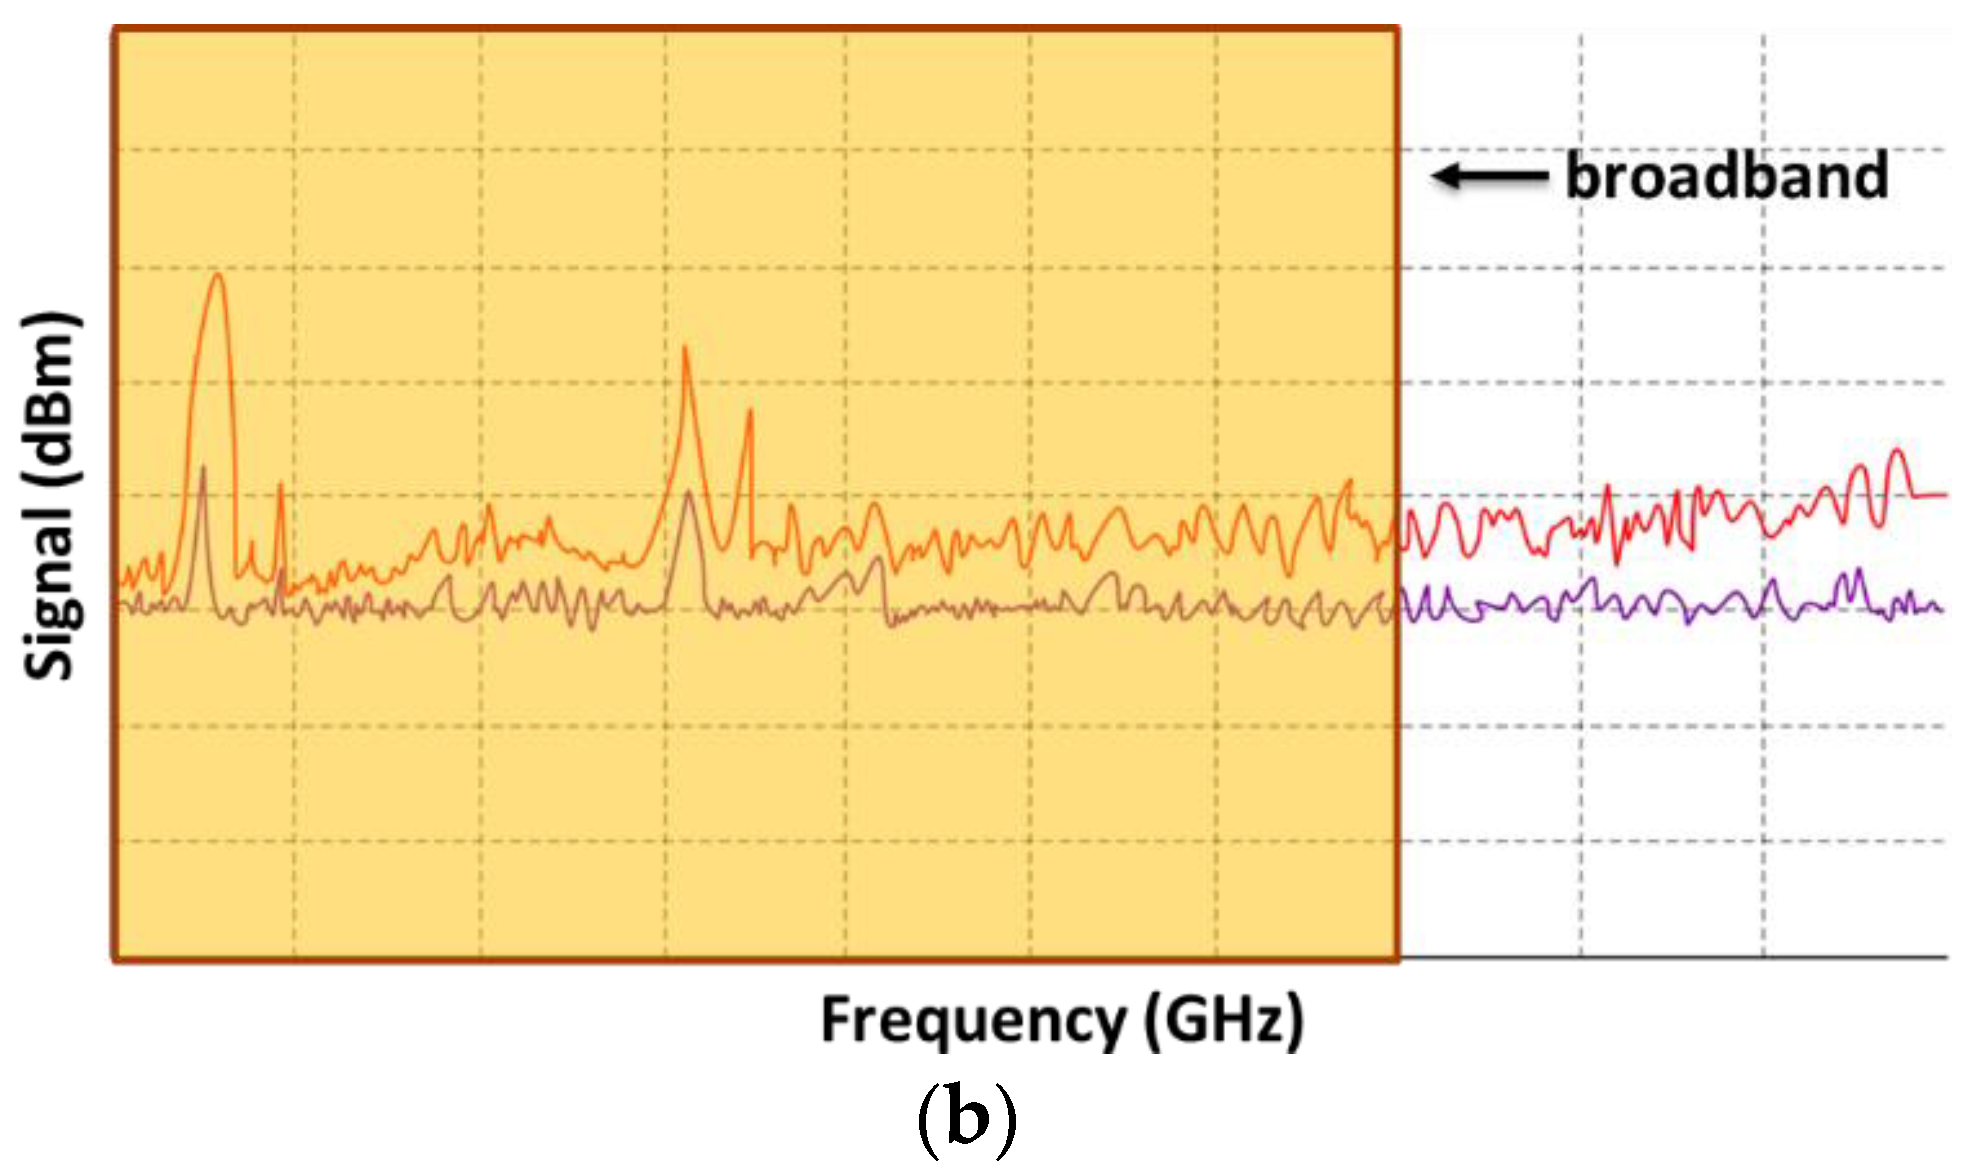
Figure 25.
Fabry–Perot interference sensor structure.
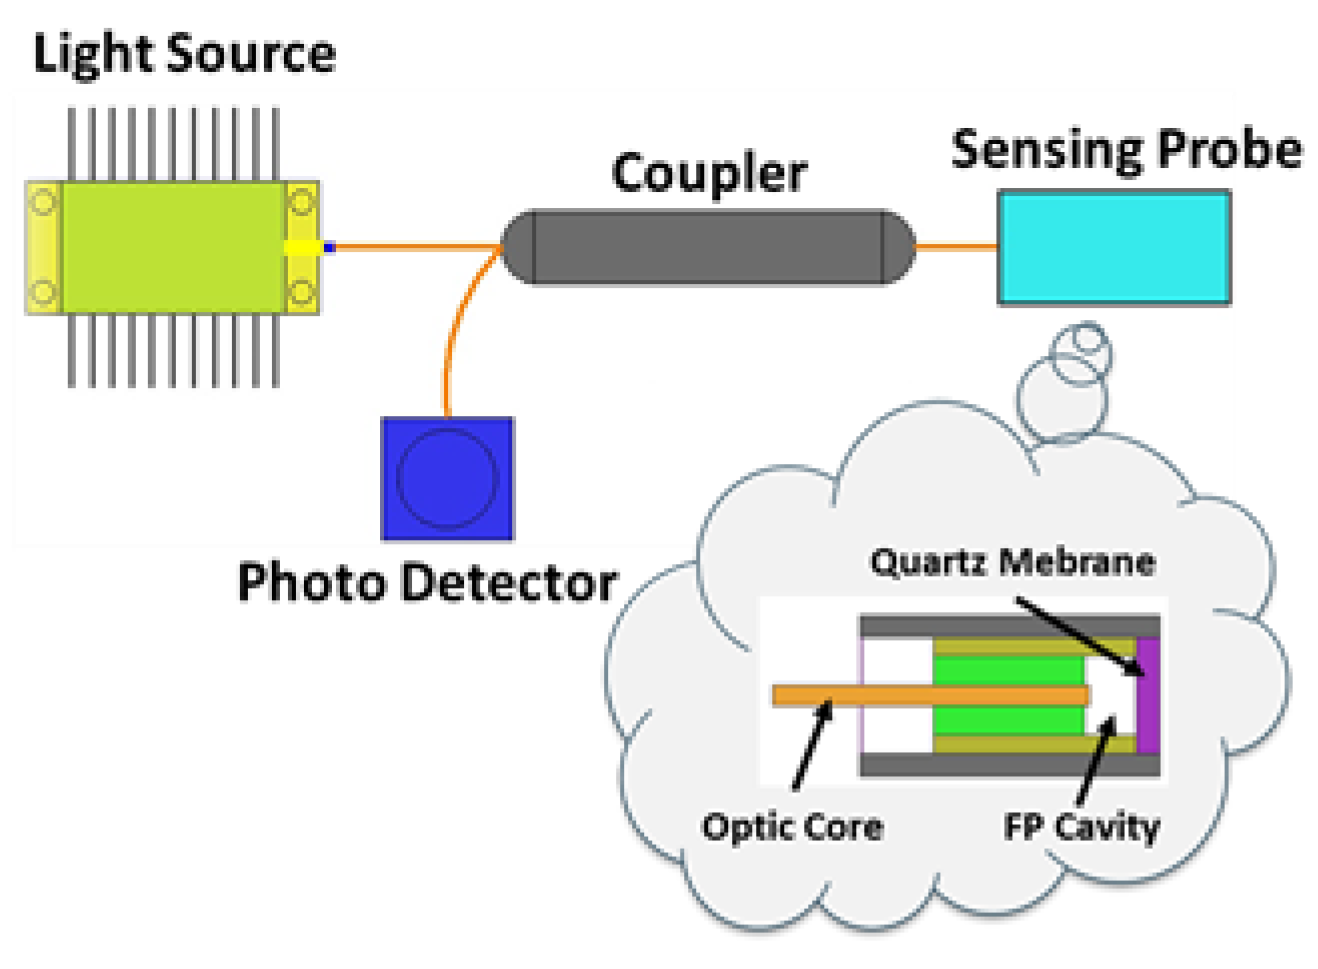
Figure 26.
Example of the electrical signal output from the Fabry–Perot optical sensor.

Figure 27.
Diagram of Mach–Zehnder interferometer structure.

Figure 28.
Diagram of Michelson interferometer structure.

Figure 29.
Diagram of Sagnac interferometer structure.

Figure 30.
Working principle of FBG.

Figure 31.
Diagram of Fibre Bragg Grating interferometer structure.

Figure 32.
Detection principle of TEV signals.
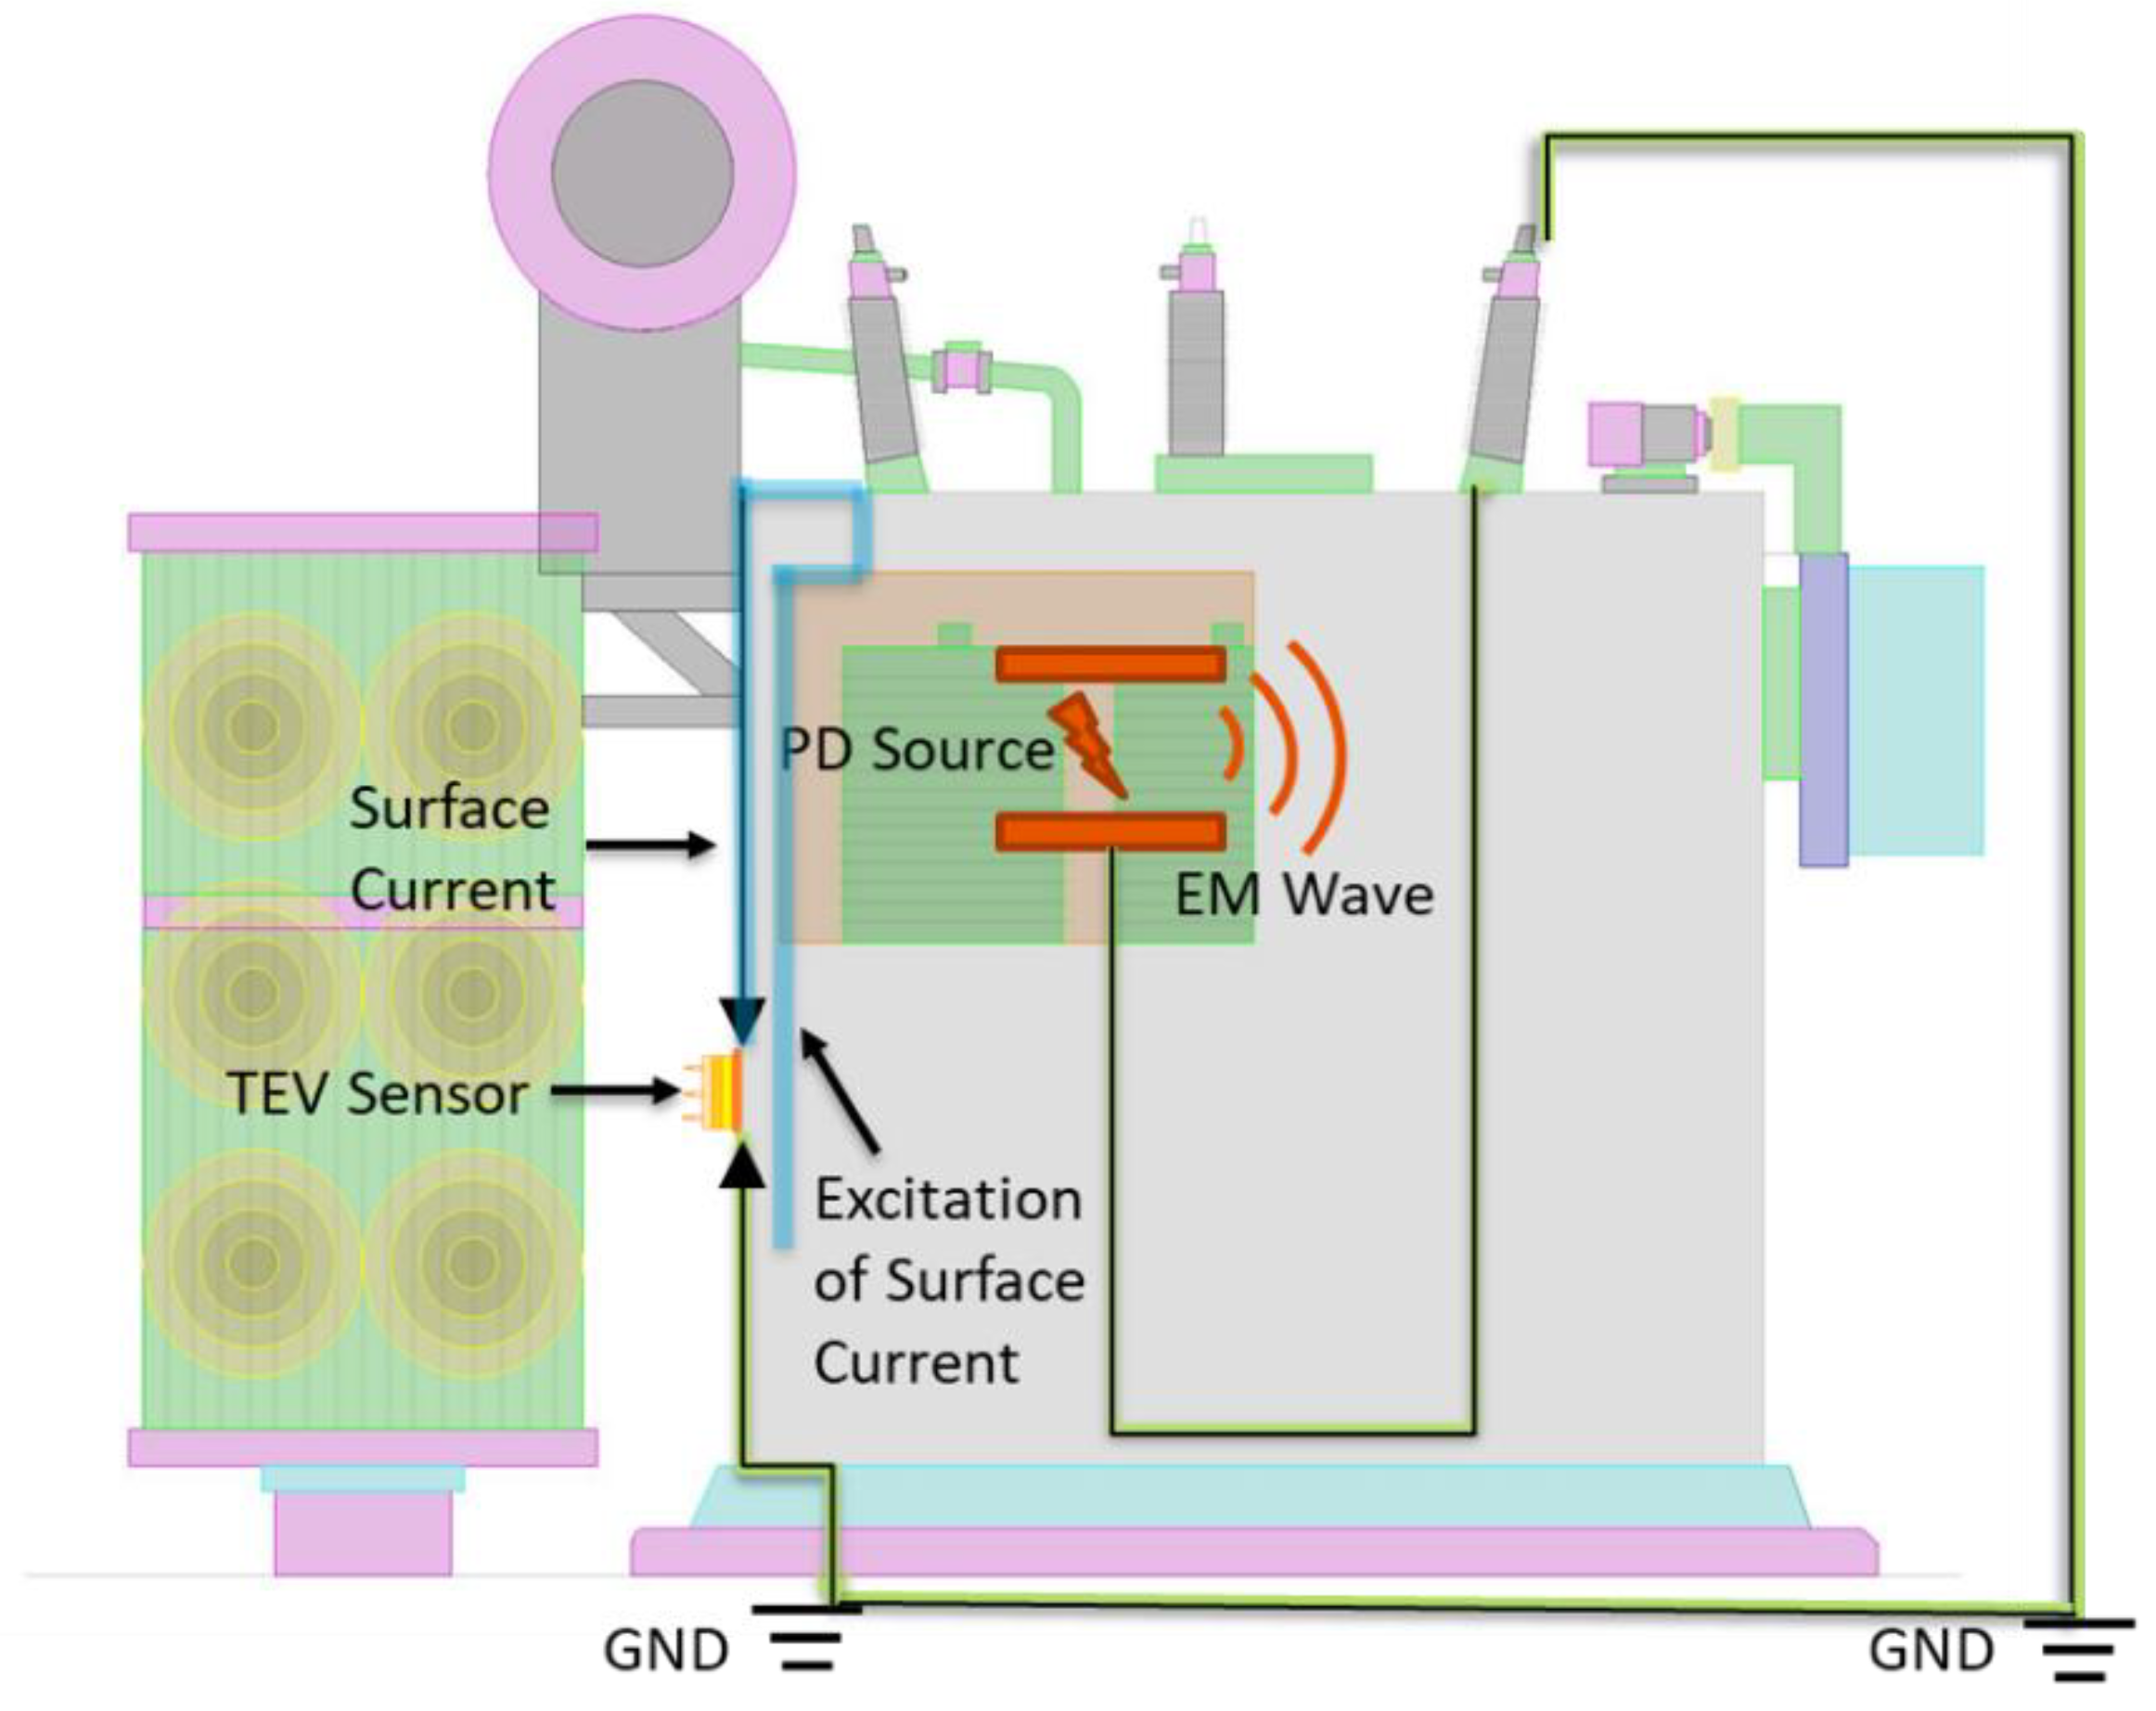
Figure 33.
Diagram of HFCT structure.

Figure 34.
An example of a thermal image taken by infrared camera.
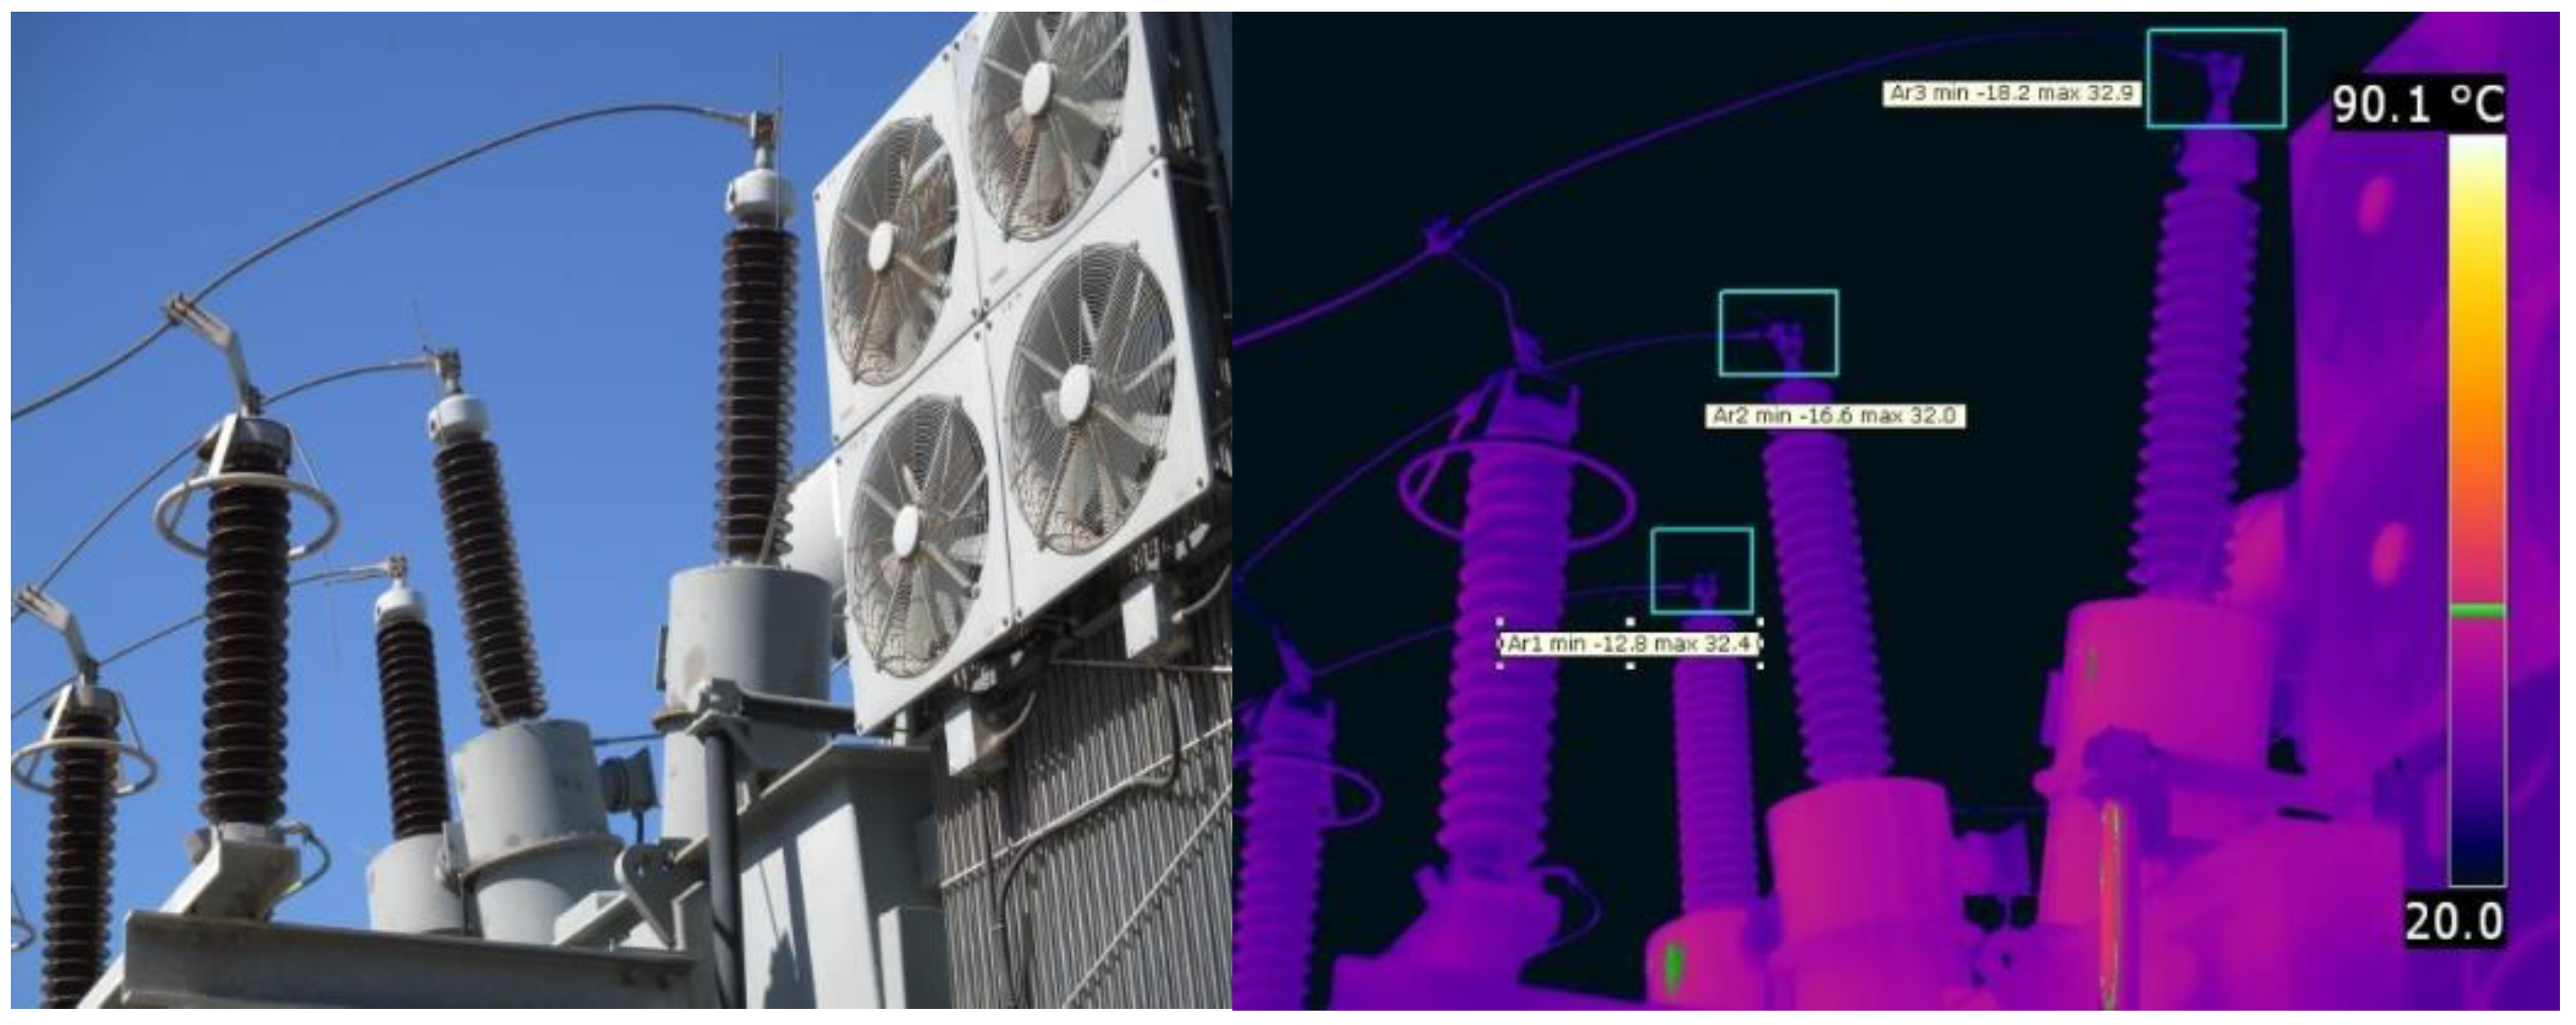

Table 1.
Furan compounds and associated types of stresses.
| Furan Compound | Symbol | Nature of Stress |
|---|---|---|
| 2-furaldehyde | 2-FAL | Overheating |
| 5-methyl-2-furaldehyde | 5-M2F | Local severe overheating |
| 5-hydroxymethyl-2-furaldehyde | 5-H2F | Oxidation |
| 2-acetyl furan | 2-ACF | Lightning |
| 2-furfurol | 2-FOL | High moisture |
Table 2.
The correlation between 2-FAL and DP for paper insulation with condition level.
| 2-FAL (ppm) | DP Value | Degree of Degradation |
|---|---|---|
| 0–0.1 | 1200–700 | Healthy |
| 0.1–1.0 | 700–450 | Moderate |
| 1–10 | 450–250 | Extensive |
| >10 | <250 | End of Life |
Table 3.
Fault types and key gases corresponding to each fault.
| Gas–Formula | Molecular | Temperature at Which Gas Forms | Source of Gases |
|---|---|---|---|
| Hydrogen–H2 |  | <150 °C—corona effect in oil | Partial discharge thermal faults |
| >250 °C—thermal and electrical faults | Power discharges | ||
| Methane–CH4 |  | <150–300 °C | Corona, partial discharge, low to/and medium temperature faults |
| Ethylene–C2H4 |  | 300–700 °C | High-temperature thermal faults |
| Ethane–C2H6 |  | 200–400 °C | Low to/and medium temperature faults |
| Acetylene–C2H2 |  | >700 °C | High hot spot. Low energy discharge |
| Carbon Monoxide–CO |  | 105–300 °C >300 °C complete decomposition | Thermal faults involving paper press board, wood and etc. |
| Carbon Dioxide–CO2 |  | 100–300 °C | Normal ageing, thermal fault involving cellulose |
| Nitrogen–N2 |  | Vacuum when temperature drops | Indicator of system leaks, over pressurization or changes in temperature |
| Oxygen–O2 |  | Vacuum when temperature drops | Exposure to air, leaky gasket, air breathing through conservator |
Table 4.
Primary faults associated with key gases.
| Key Gas | Characteristic Fault |
|---|---|
| H2, CH4, C2H4, C2H6 | Thermal fault from 150 to 300 °C |
| H2, CH4, C2H4, C2H6 | Thermal fault from 300 to 700 °C |
| H2, C2H4, C2H2 | Over 700 °C thermal fault |
| CO, CO2 | Decomposition of cellulose |
| H2, CH4 | Partial discharge |
| H2, C2H2 | Arcing |
Table 5.
The summary of KGM from IEEE C57.104.
| Key Gas | Fault Type | Typical Proportions of Generated Combustible Gases |
|---|---|---|
| Ethylene (C2H4) | Thermal mineral oil | Predominantly ethylene with smaller proportions of ethane, methane, and hydrogen. Traces of acetylene at very high fault temperatures. |
| Carbon monoxide (CO) | Thermal mineral oil and cellulose | Predominantly carbon monoxide with much smaller quantities of hydrocarbon gases. Predominantly ethylene with smaller proportions of ethane, methane, and hydrogen. |
| Hydrogen (H2) | Electrical low-energy partial discharge (PD) | Predominantly hydrogen with small quantities of methane and traces of ethylene and ethane. |
| Hydrogen and acetylene (H2, C2H2) | Electrical high-energy (arcing) | Predominantly hydrogen and acetylene with minor traces of methane, ethylene, and ethane. Additionally, carbon monoxide if cellulose is involved. |
Table 6.
Rogers’ Ratio Method (RRM) from IEEE C57.104.
| Case | C2H2/C2H4 | CH4/H2 | C2H4/C2H6 | Suggested Fault Diagnosis |
|---|---|---|---|---|
| 0 | <0.1 | 0.1 to 1.0 | <0.1 | Unit normal |
| 1 | <0.1 | <0.1 | <0.1 | Low energy density acring-PD |
| 2 | 0.1 to 3.0 | 0.1 to 1.0 | >0.3 | Arcing—High erergy discharge |
| 3 | <0.1 | 0.1 to 1.0 | 1.0 to 3.0 | Low temperature thermal |
| 4 | <0.1 | >0.1 | 1.0 to 3.0 | Thermal < 700 °C |
| 5 | <0.1 | >0.1 | >0.3 | Thermal > 700 °C |
Table 7.
Doernenburg Ratio Method (DRM) from IEEE C57.104.
| Suggested Fault Diagnosis | Ratio 1 (R1) CH4/H2 Extracted from Mineral Oil|Gas Space | Ratio 2 (R2) C2H2/C2H4 Extracted from Mineral Oil|Gas Space | Ratio 3 (R3) C2H2/CH4 Extracted from Mineral Oil|Gas Space | Ratio 4 (R4) C2H6/C2H2 Extracted from Mineral Oil|Gas Space | ||||
|---|---|---|---|---|---|---|---|---|
| 1—Thermal decomposition | >1.0 | >0.1 | <0.75 | <1.0 | <0.3 | <0.1 | >0.4 | >0.2 |
| 2—Corona (low intensity PD) | <0.1 | <0.01 | Not significant | <0.3 | <0.1 | >0.4 | >0.2 | |
| 3—Arcing (high intensity PD) | >0.1, <1.0 | >0.01, <0.1 | >0.75 | >1.0 | >0.3 | >0.1 | <0.4 | <0.2 |
Table 8.
Limit of concentrations of dissolved gases from IEEE C57.104.
| Key Gas | Concentrations L1 (μL/L (ppm v/v)) |
|---|---|
| Hydrogen (H2) | 100 |
| Methane (CH4) | 120 |
| Carbon Monoxide (CO) | 350 |
| Acetylene (C2H2) | 1 |
| Ethylene (C2H4) | 50 |
| Ethane (C2H6) | 65 |
Table 9.
Abbreviations of basic fabaults.
| Symbol | Fault |
|---|---|
| PD | Partial discharge |
| D1 | Discharge of low energy |
| D2 | Discharge of high energy |
| T1 | Thermal fualts of less than 300 °C |
| T2 | Thermal fault between 300 °C and 700 °C |
| T3 | Thermal faults greater than 700 °C |
| DT | Mixture of themal and electrical faults |
Table 10.
Comparison of different optical detection technologies.
| Sensor Type | Comparison |
|---|---|
| Extrinsic Fabry-Perot Interferometer |
|
| Intrinsic Interferometer (Mach-Zehnder, Michelson and Sagnac Interferometric) |
|
| Fiber Bragg Gratings |
|
Publisher’s Note: MDPI stays neutral with regard to jurisdictional claims in published maps and institutional affiliations. |
© 2022 by the authors. Licensee MDPI, Basel, Switzerland. This article is an open access article distributed under the terms and conditions of the Creative Commons Attribution (CC BY) license (https://creativecommons.org/licenses/by/4.0/).
Share and Cite
MDPI and ACS Style
Jin, L.; Kim, D.; Abu-Siada, A.; Kumar, S. Oil-Immersed Power Transformer Condition Monitoring Methodologies: A Review. Energies 2022, 15, 3379. https://doi.org/10.3390/en15093379
AMA Style
Jin L, Kim D, Abu-Siada A, Kumar S. Oil-Immersed Power Transformer Condition Monitoring Methodologies: A Review. Energies. 2022; 15(9):3379. https://doi.org/10.3390/en15093379
Chicago/Turabian StyleJin, Lan, Dowon Kim, Ahmed Abu-Siada, and Shantanu Kumar. 2022. "Oil-Immersed Power Transformer Condition Monitoring Methodologies: A Review" Energies 15, no. 9: 3379. https://doi.org/10.3390/en15093379
Note that from the first issue of 2016, this journal uses article numbers instead of page numbers. See further details here.