1. Introduction
The world economy has the urgent need to become independent of fossil fuel energy resources because of their limited availability and the possibility of their eventual depletion. These problems have arisen because of global political constraints and the lack of suitable infrastructure in many countries. Therefore, nations of the world should envisage and implement strategies to replace fossil fuel with renewable energy resources. Climate change, the Kyoto Protocol, and the need to reduce energy costs are obliging industries to rapidly acquire knowledge of energy options in key sectors [
1], such as the agri-food sector. For example, photovoltaic (
PV) energy is one of the renewable energy sources that is widely used in the agricultural sector for various activities [
2,
3], such as water pumping systems for irrigation, or electricity generation [
4,
5,
6]. Nevertheless, to date, it has not been widely used in wine production.
The winemaking sector is extremely important, not only for its economic value but also for the number of jobs created and its crucial role in the conservation of the environment. According to the International Organization of Vine and Wine (OIV in Spanish), in 2009, Europe was the continent with the largest percentage of total vineyard area: 44% compared to 36.4% in Asia; 20.7% in the Americas; 6.0% in Africa; and 2.8% in Oceania. In 2011, global wine production totaled 265.8 million hectoliters compared to a consumption of 241.9 million. In Spain, the wine industry comprises 4300 factories, which make up 14.0% of the Spanish food industry. In fact, its net value is approximately 5500 million euros, which is 1.0% of the Spanish GDP [
7].
Incident solar irradiance on buildings or areas where wineries are located is an important renewable energy source that can be used instead of fossil fuels. This significantly reduces costs as well as CO2 emissions. According to data published by agri-food cooperatives and the Spanish Ministry of the Environment, Marine and Rural Affairs, over 3100 Spanish wineries have an average annual electricity consumption of 164,203 kWh with an average price of 0.124 €/kWh. This comes to an annual energy cost of 20,345 € per winery. This cost could be greatly reduced if the wineries used the system presented in this paper.
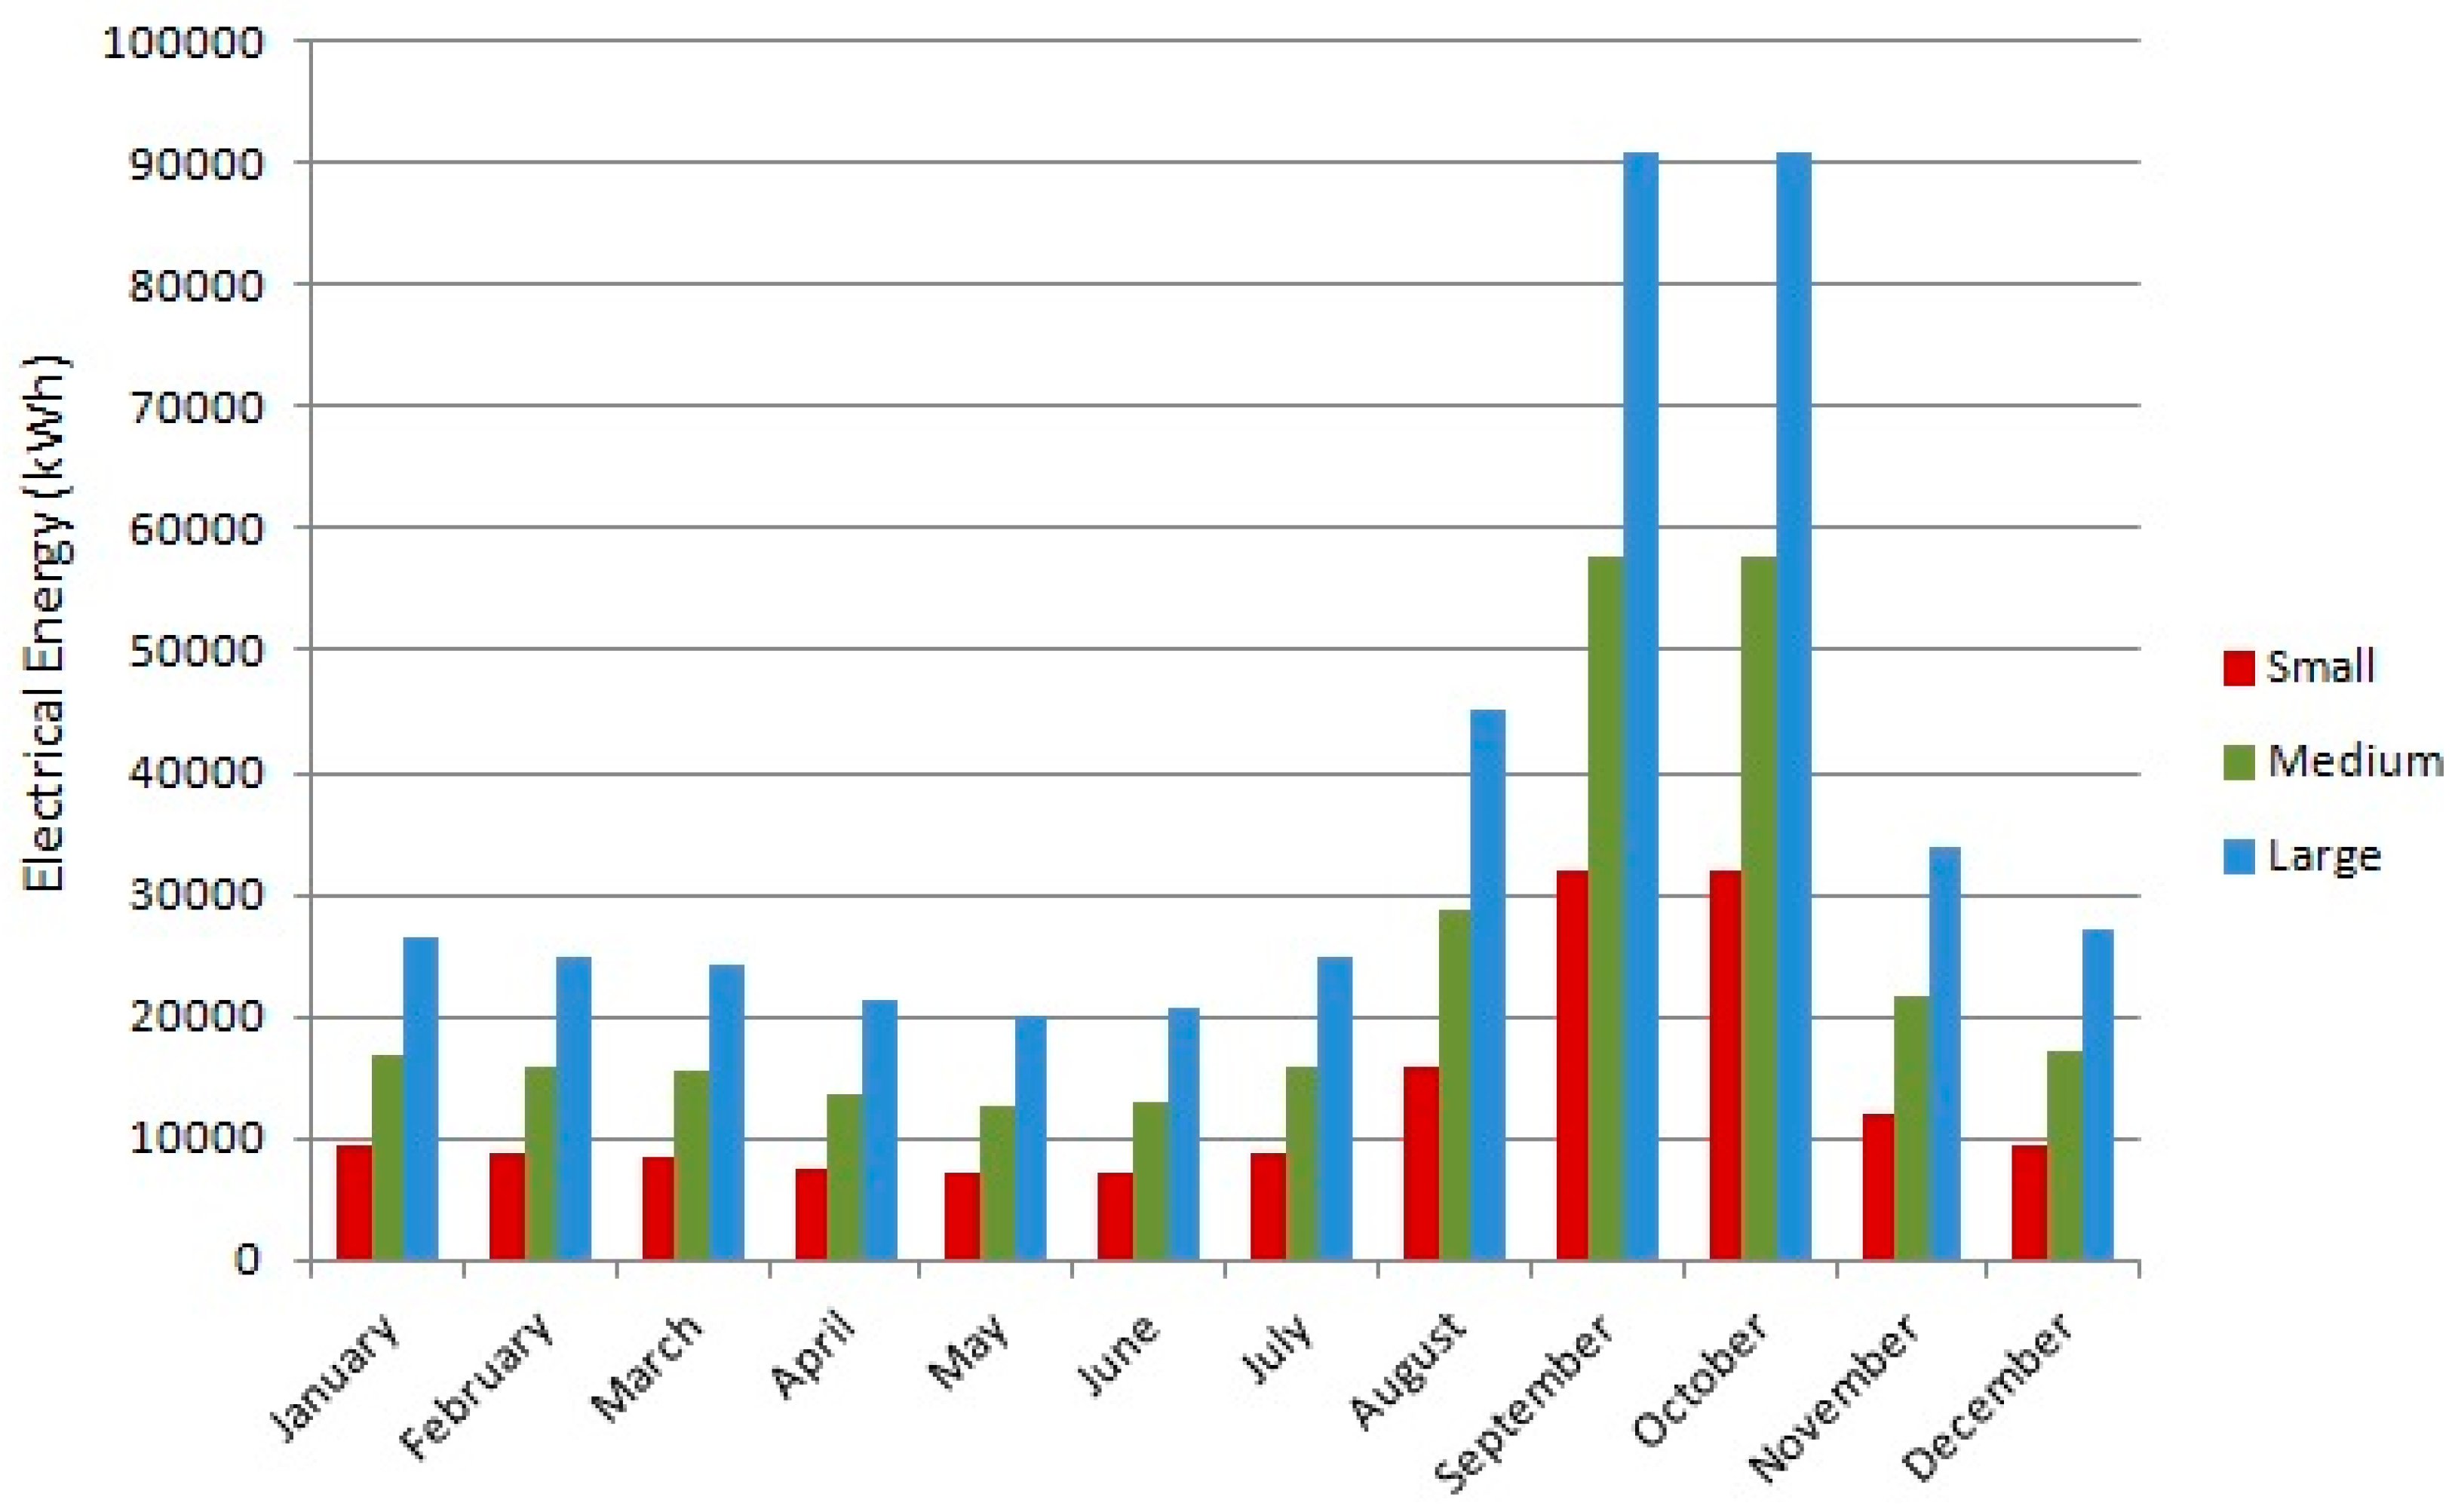
Competition in the wine sector is swiftly increasing. Precisely for this reason, any measure that improves energy efficiency and therefore reduces wine production costs will increase profits and will make production less dependent on energy price fluctuations. One of the main problems in the wine industry is that electricity consumption is non-homogeneous, since it occurs mainly during the harvest and wine production season (i.e., August to November). During the rest of the year, energy consumption is very low and mostly stems from storage, packaging, and auxiliary activities such as the lighting and air-conditioning in office installations. This uneven level of energy consumption during the year makes costs soar because wine factories are obliged to hire the power corresponding to the months with a high energy consumption.
Our research showed that the use of renewable energies was the best solution to reduce energy costs as well as CO2 emissions into the atmosphere. Nevertheless, not all renewable sources are suitable for this purpose. Given the climate conditions of southern Europe, our study specifically focused on solar energy.
This research was based on data from the energy audits of eight wineries, as performed by five federations and territorial unions of Spanish agri-food cooperatives (FUTs) [
8], where the actual energy consumption data and wine production figures were analyzed. Based on these data, the wineries were classified in three groups (see
Table 1).
The objective of this research was to verify the feasibility of grid-connected photovoltaic systems in wineries and to foment their installation in other countries where wine is produced. This is in consonance with EU policy that envisages a substantial increase in the use of renewable energy sources. The goal was to determine whether the energy required for the operation of small, medium, and large wineries in Spain could be obtained from grid-connected PV systems with a high level of cost-effectiveness. We also wished to contribute to a better understanding of renewable energy use in commercial activities such as the agri-food industry. For this purpose, incident solar irradiance was analyzed at all of the wineries in Spain. The conclusion was that solar radiance levels were similar throughout Spain and that differences between regions were negligible.
2. Wineries Energy Consumption
Wineries consume both electrical and thermal energy. Electrical energy is used to power the equipment of the winery, and thermal energy is used for heating, domestic hot water, washing bottles and barrels, and also for operating forklifts. In most of the wineries, water is heated in a boiler that uses fossil fuel, except for some that use a biomass boiler.
Table 1 shows the average electricity consumption of each winery in relation to its wine production.
Not surprisingly, energy consumption is proportional to wine production. Accordingly, the data pertaining to the average annual wine production and electricity consumption [
8] can be used to obtain the electricity consumption per volume unit of wine for each of the three types of winery.
As can be observed, larger wineries have lower energy consumption values than smaller ones, are thus more efficient. Since larger wineries are usually of more recent construction, their technology tends to be more modern. In contrast, the absolute operating costs of small and medium-size wineries are very similar. Small wineries have the highest cost-production ratio because they have the lowest production of wine.
The energy consumption and costs in
Table 1 were used to ascertain the size of the optimal renewable energy system that would decrease these costs as much as possible for each type of winery. The model developed in our research is extremely useful because it can improve the sustainability of this agri-food sector.
The Influence of Temporariness on Energy Consumption
The energy consumption of the winemaking sector depends on the time of the year. There are times when consumption is extremely high whereas at others, it is quite low.
Figure 1 shows the seasonal nature of the energy consumption in wineries, based on data for the one-year time period audited by the FUTs.
3. Renewable Energy Resource
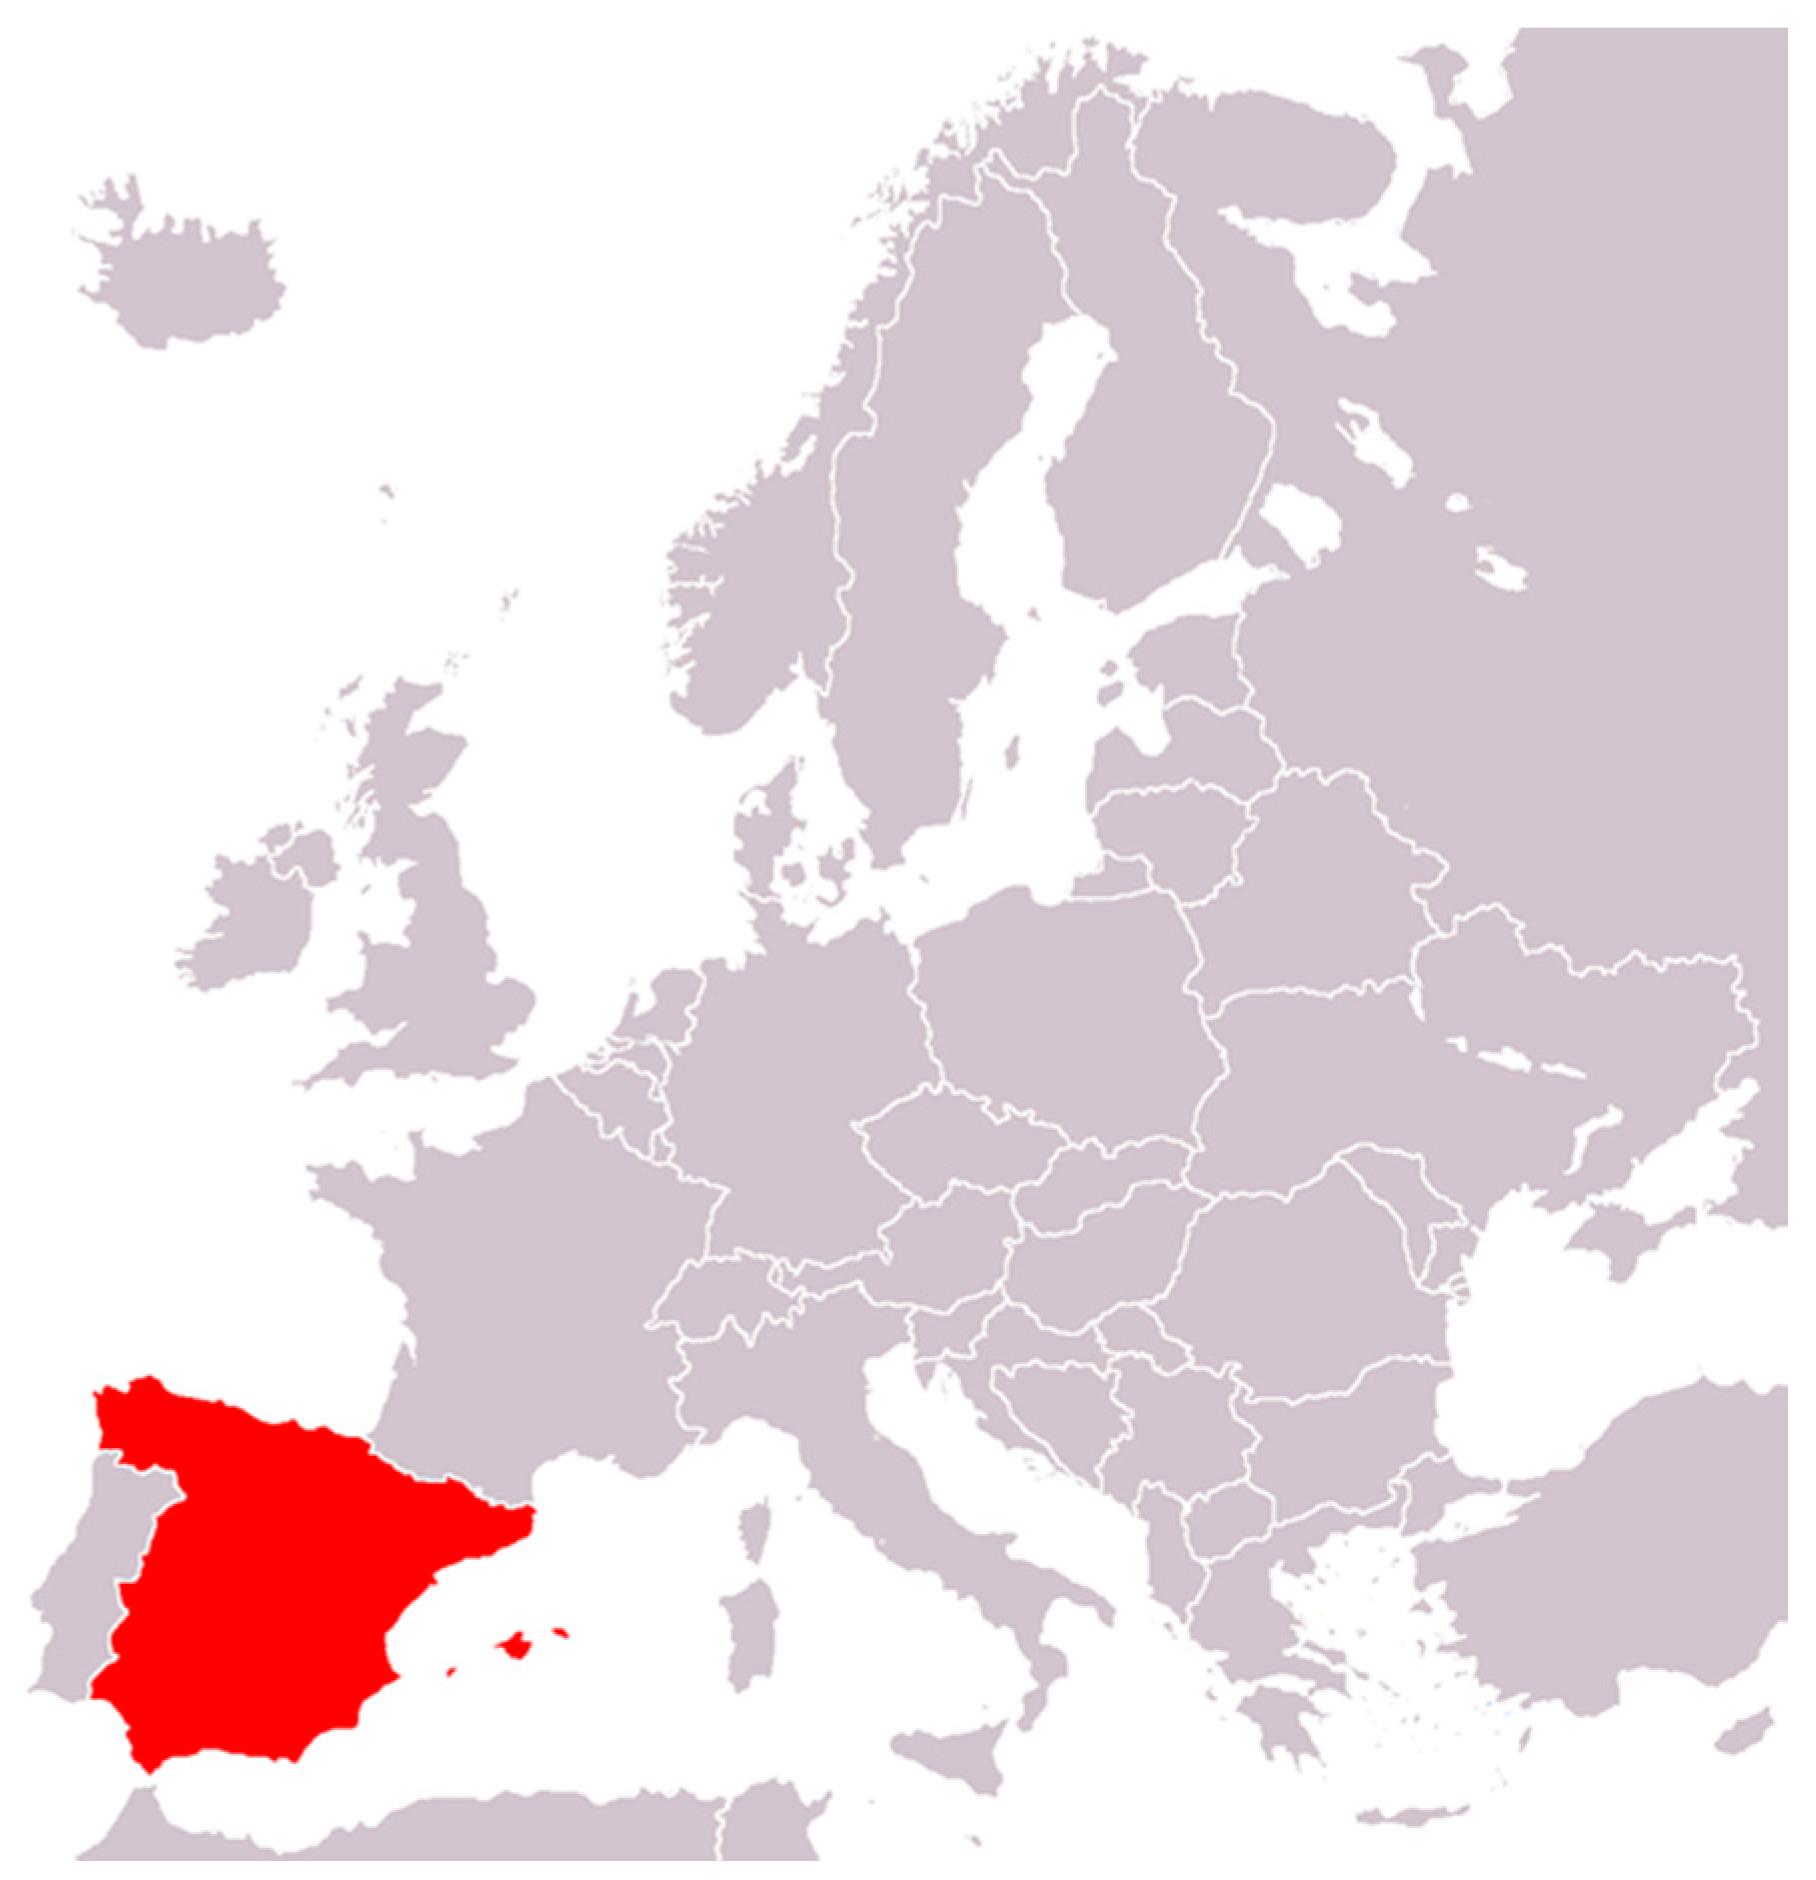
Spain has an area of approximately 504,645 km
2 and is located in the warm-temperate region of southwest Europe at a latitude of 40°25′ N and a longitude of 3°45′ W, as shown in
Figure 2. The country has three major climate zones. The Mediterranean climate, which dominates the Iberian Peninsula, is characterized by warm dry summers. The semi-arid climate zone in the southeastern region of the country differs from the Mediterranean climate zone because the dry season extends beyond the summer. Finally, northern Spain has an oceanic climate, where the ocean influences summer and winter temperatures, and there is no seasonal drought [
9]. The average temperature in Spain throughout the year is 14–17 °C, The coldest month is January with an average temperature of 4–6 °C, and the hottest months are July and August with an average temperature of 24–26 °C.
Solar Resources
The U.S. National Renewable Energy Laboratory (NREL, Boulder, CO, USA) provided the monthly solar radiation data used in this study.
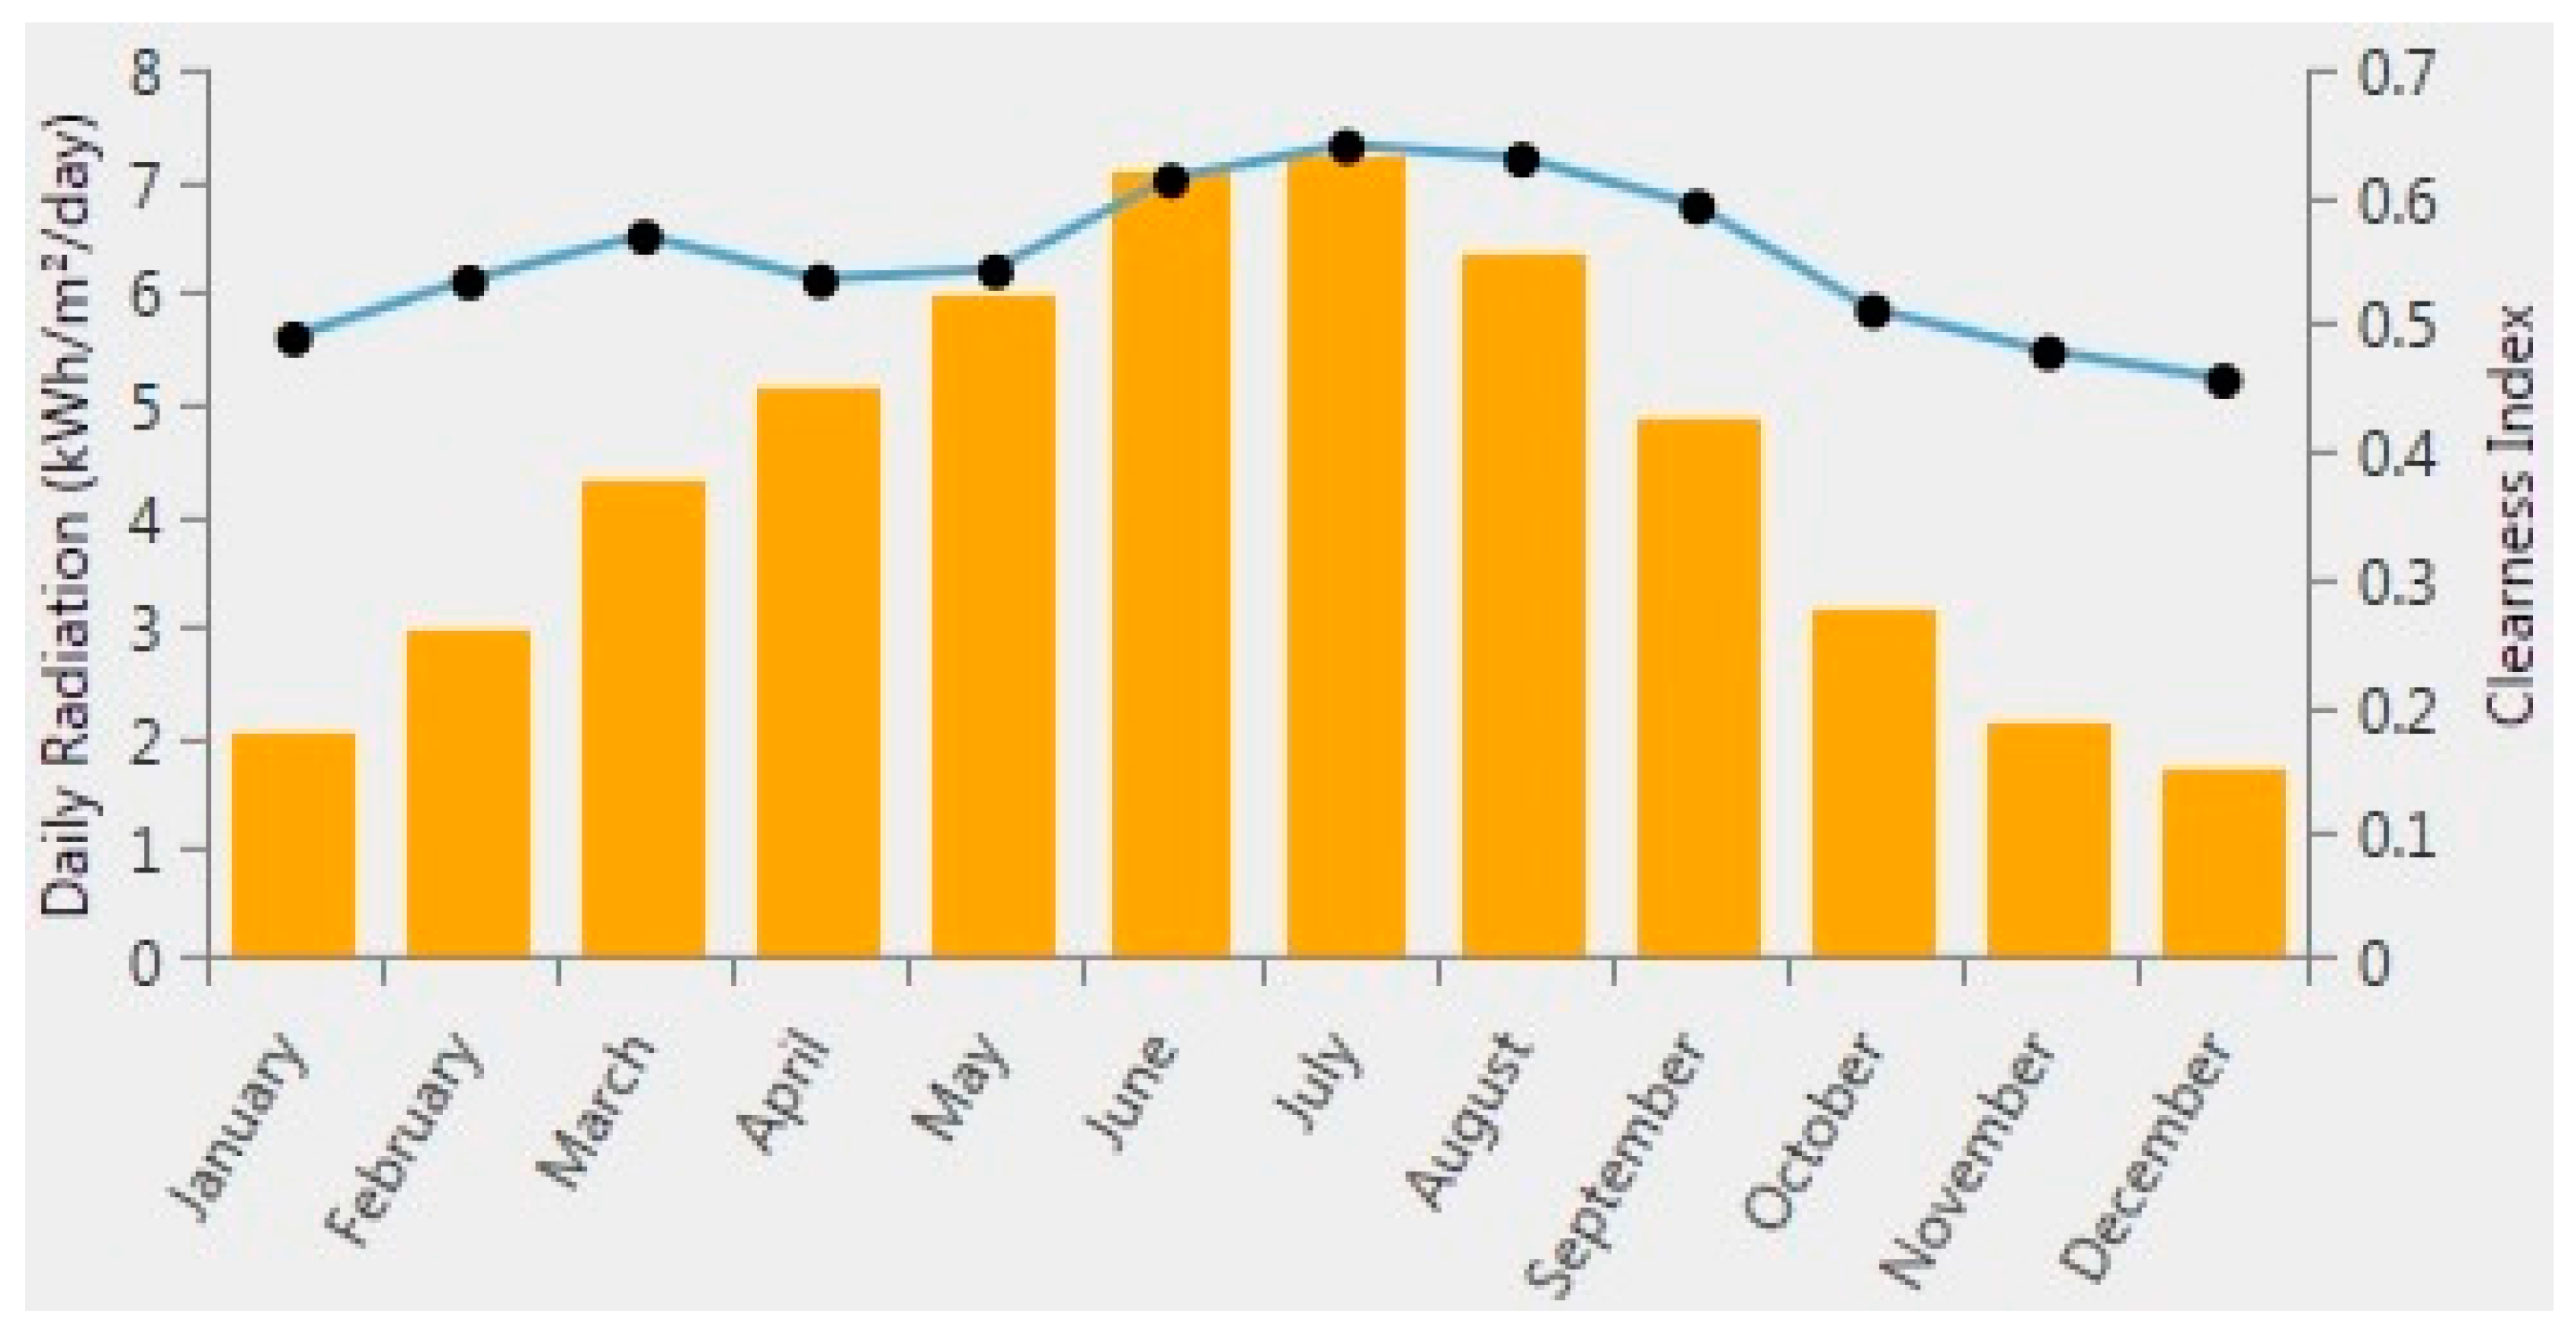
Figure 3 shows the daily global horizontal radiation and clearness index during the year. The lowest global horizontal solar radiation is 1.7 kWh/m
2/day whereas the highest one is 7.2 kWh/m
2/day, with an annual average value of 4.4 kWh/m
2/day. The months with the highest solar radiation are those between April and September. Hybrid Optimization of Multiple Energy Resources (HOMER), the software application used in this study automatically calculated the clearness index, based on daily radiation data [
11].
4. Materials and Methods
To design the system and study its feasibility, we used HOMER, a computer application, developed by NREL. This software can be used to design electricity generation systems and even to compare them with other types of system. HOMER can also simulate the performance of electrical energy systems with renewable energy sources. The application takes into account the useful life of the system to calculate its optimal design and dimensioning, based on environmental, technical, and economic parameters.
Economic and technical evaluation criteria were used to assess the feasibility of wineries with a grid-connected
PV system. After first assessing the technical viability of the system and whether it was able to meet the load demand, HOMER calculated the economic parameters. The major issues considered in the technical feasibility study were energy load consumption and the space required to position the renewable source. All costs during the system’s useful life were evaluated, including the initial set-up costs (IC), component replacements within the system’s useful life, maintenance and operating costs (M&O), and purchasing power costs (PPC) from the grid. The lifetime cycle cost of the system was represented by the net present cost (
NPC) and calculated with the following equation [
12]:
where
TAC is the total annualized cost (€/year) and
CRF is the capital recovery factor given by:
where
N is the number of years; and
I is the annual real interest rate (%). The cost of energy (
COE) produced by the system was also used as a techno-economic evaluation criterion. The
COE represents the unit cost of the energy produced by the system and was calculated by dividing the total annualized cost by the annually produced energy as follows:
4.1. System Model
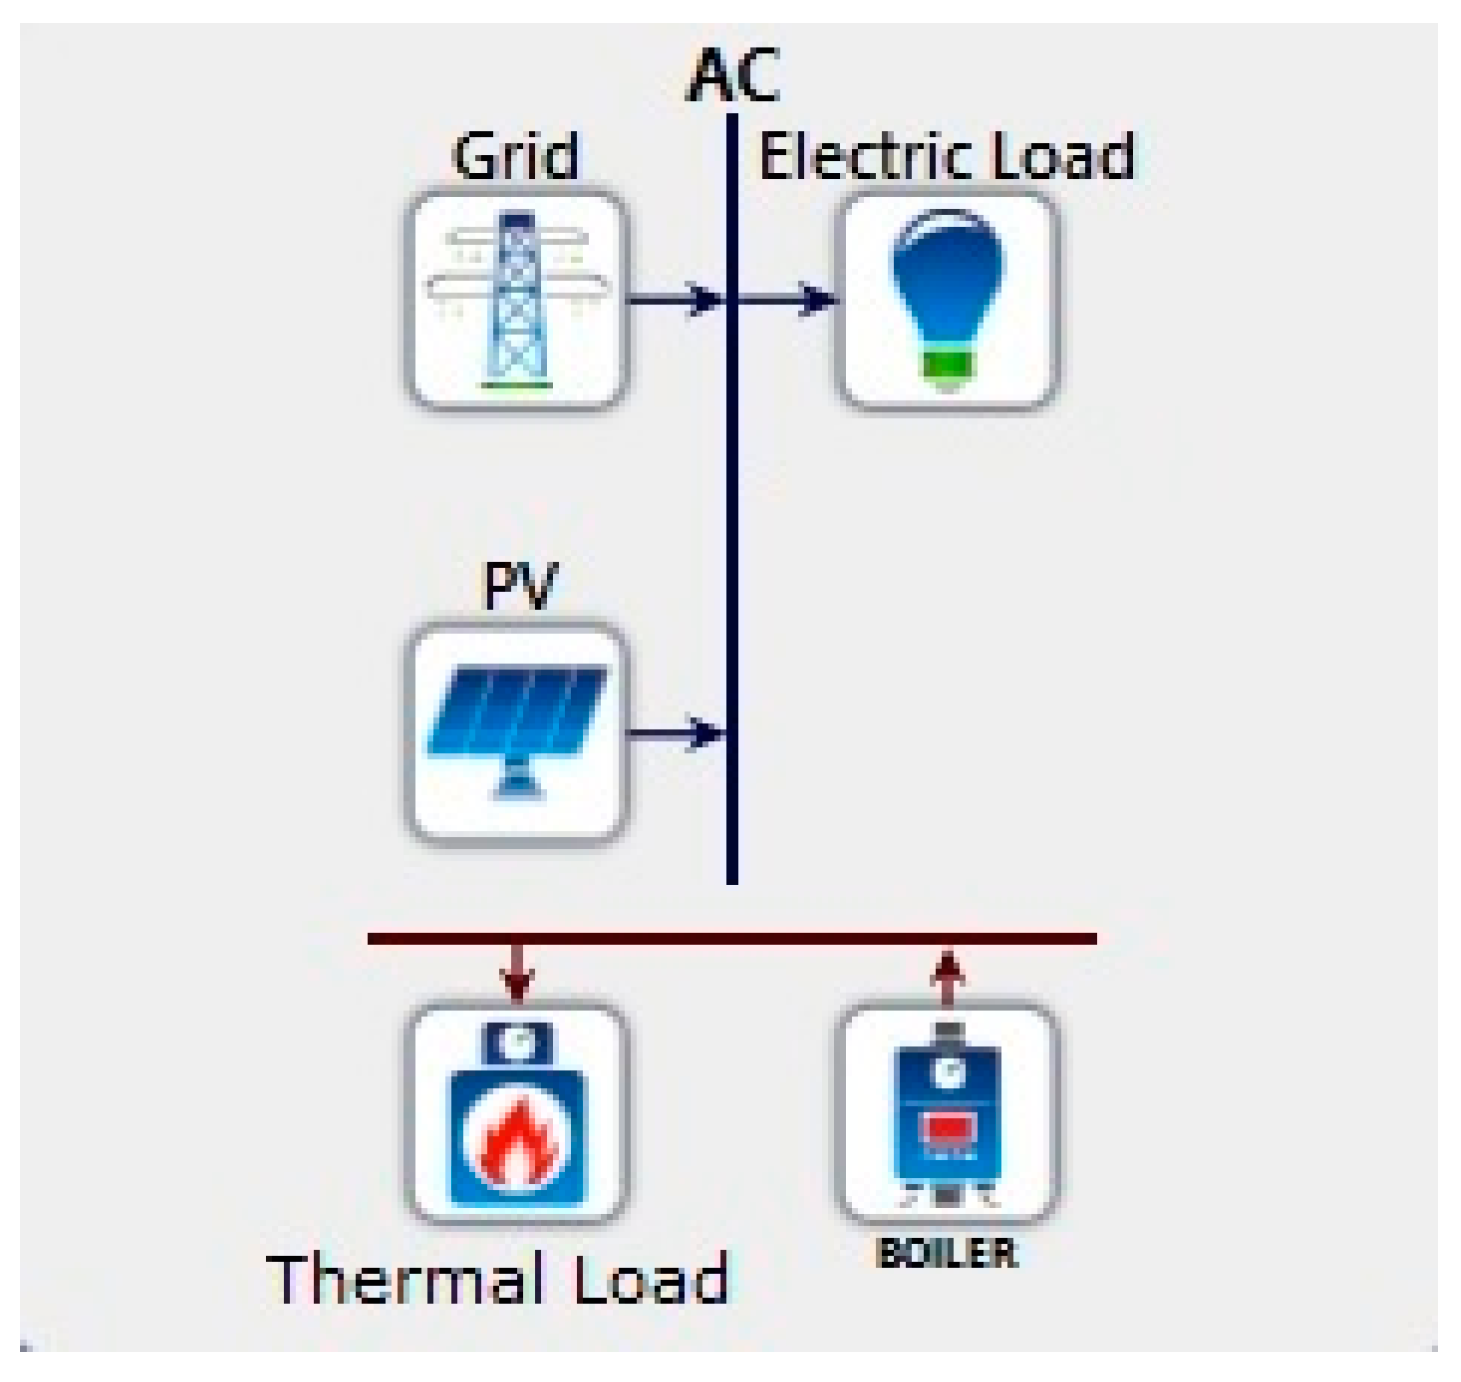
As can be observed in
Figure 4, the system is composed of a photovoltaic installation and a biomass boiler, which provides the winery with part of the power necessary for its smooth operation. The photovoltaic installation is directly connected to the grid. As such, it provides electrical energy, which is priced with a bi-directional meter. The boiler uses biomass as fuel to heat water. Despite the fact that wineries consume a great deal of water, most of it is cold water, which is mainly used to clean hoppers, destemmers, deposits, pumps, and pipes. Hot water is mostly consumed in the bathrooms and showers of the offices, laboratories, and changing rooms. The electricity to heat the water for these services is negligible in comparison to the total amount of electrical energy consumed in the winery. For this reason, even though the biomass boiler was included as part of the system, it was not considered in the calculations.
The optimal solution for large, medium, and small wineries were determined with HOMER, based on the electricity consumption data in
Table 1. As previously mentioned, most electricity in wineries is consumed from August to November. During the other months, electricity is only needed for office facilities (lighting, air-conditioning, etc.), and power consumption is thus quite low.
Figure 1 shows the monthly electricity load profile for the three types of winery.
4.2. Economics Interest Rate Less the Inflation Rate
The interest rate was 0.4%, which is equal to the nominal interest rate minus the inflation rate. The average useful life of the system was fixed at 25 years. However, the interest rate can vary, depending on the economic conditions of the area where the project was evaluated. According to the Central European Bank, the Eurozone has a nominal interest rate of 0.2% and an inflation rate of −0.2% (December 2014) [
13].
4.3. PV Module
The power provided by a photovoltaic system mainly depends on the available solar radiation. In our study, the
PV installation provided AC power by using electrical inverters connected to the photovoltaic modules. The photovoltaic power was obtained with the following formula:
where
WPV is the peak power output of the
PV module (kW);
fPV is the
PV de-rating factor (%);
GT is the solar radiation incident on the
PV module in the current hour (kW/m
2); and
GS is the incident radiation under standard test conditions (1 kW/m
2).
Since an increase in temperature causes a drop in the efficiency of the module, temperature variation was also considered. The following formula was used to calculate the effect of temperature on the power output of the
PV module:
where
kP is the temperature power coefficient (%/°C);
TC is the
PV module temperature in the current hour (°C); and
TSTC is the
PV module temperature under standard test conditions (25 °C).
This study focused on photovoltaic systems of up to 100 kW. The costs of installation, operation, and maintenance were obtained from the NREL (NREL 2015).
Table 2 shows the
PV installation data that were entered into HOMER in order to assess the economic and technical viability of the system.
An 80% reduction factor was selected, which represents the difference between the performance of the photovoltaic panels in ideal conditions and their real performance, which is somewhat lower because of temperature increases and occasional shading. Although this reduction factor is usually 90%, a value of 80% is generally chosen in hot countries because of the higher temperatures that lower the efficiency of the photovoltaic cells. In our study, the shading of the photovoltaic panels [
14] was negligible because wineries are generally located in isolated rural area far away from other buildings. Consequently, the only shading would be from clouds. In Homer, this type of shading is only represented in the data pertaining to the global radiation of the location, which is composed of the direct and diffuse radiation. The replacement cost of a
PV system was calculated, based on a useful life of 25 years and the estimated pricing trends for that time period [
15].
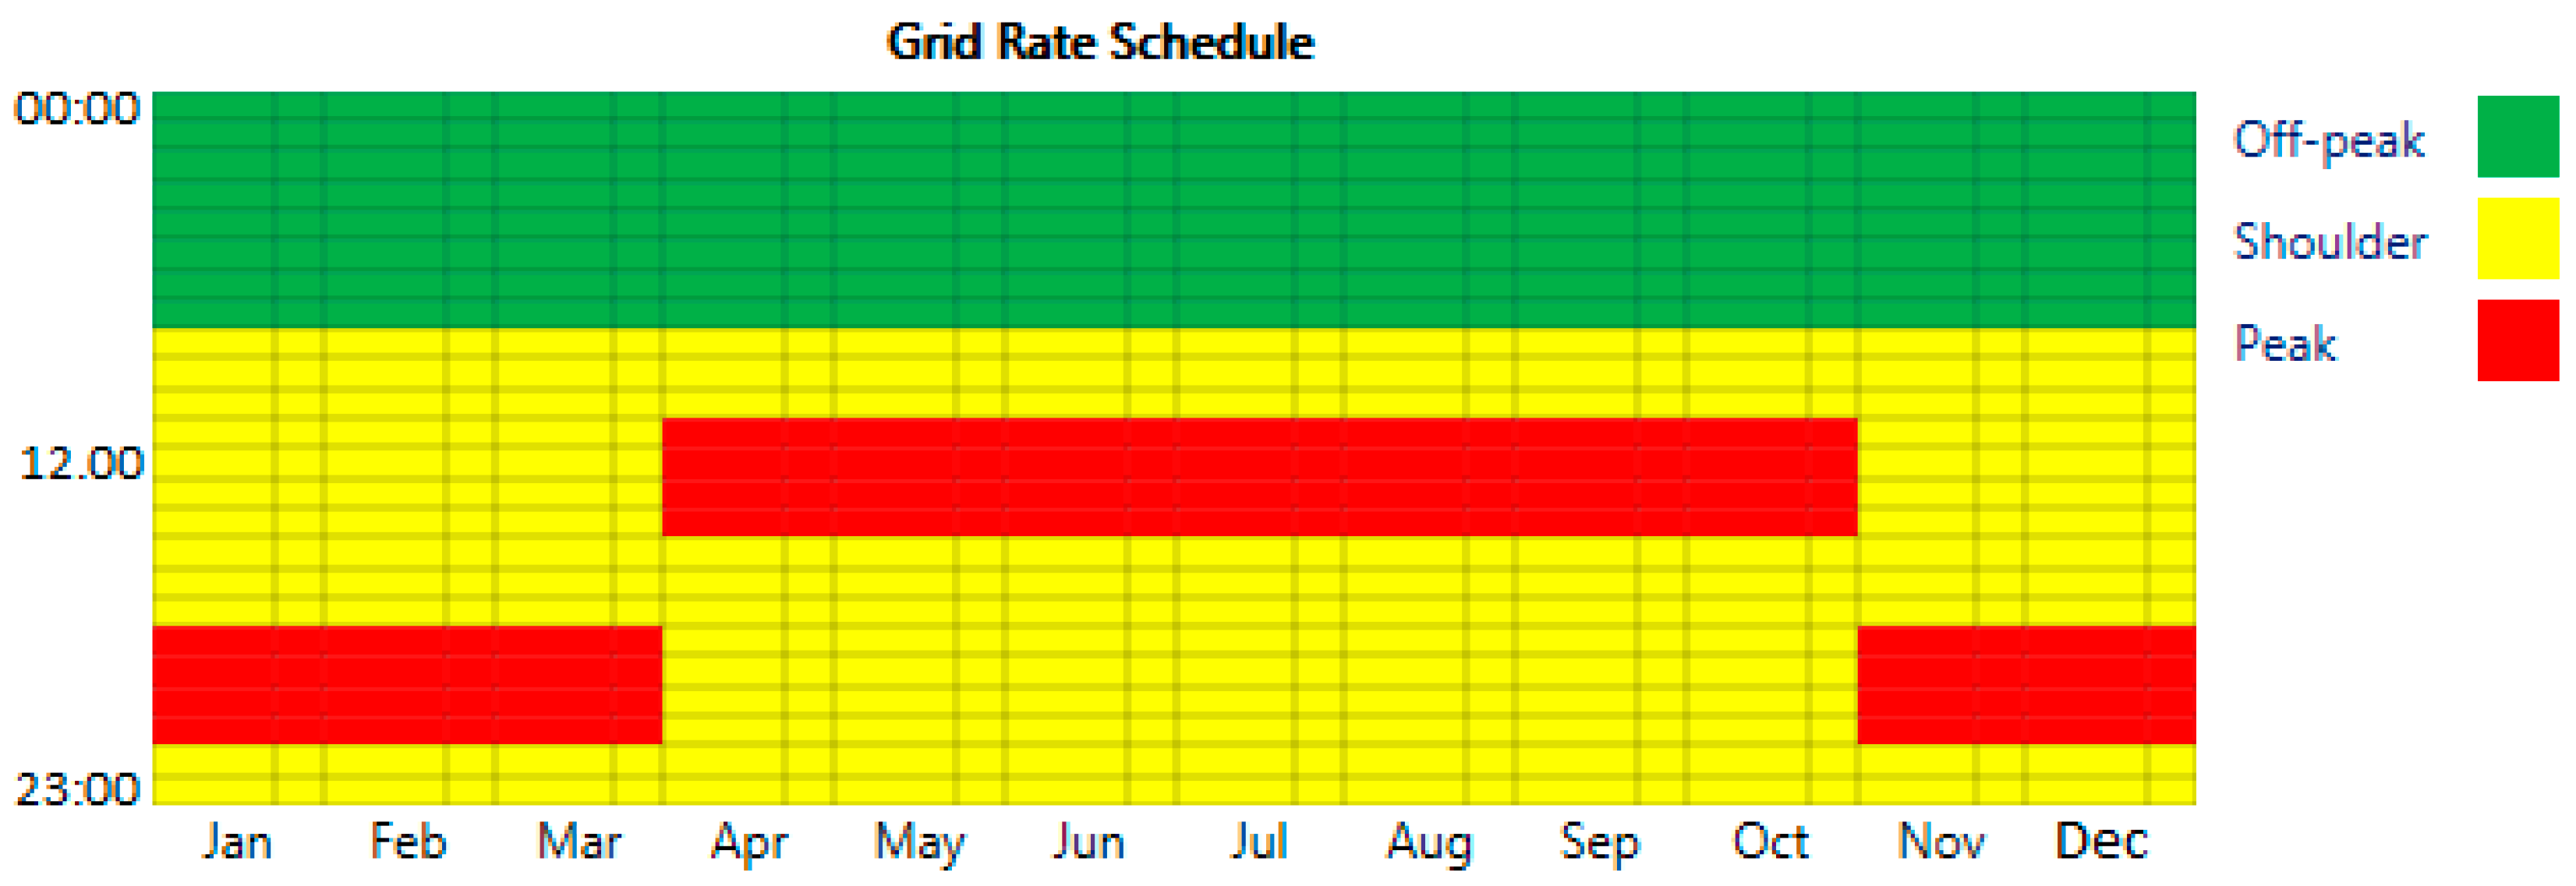
4.4. Grid Input
The energy rate depends on the time of year and the time of day when consumption occurs.
Figure 5 thus shows the three time periods for electricity consumption in Spain: peak, off-peak, and shoulder. Each period is priced differently. Furthermore, electricity companies do not have the same price agreement with the three types of winery because the final cost depends on the total power consumption of the winery. Accordingly, the electrical power price depended on the size of the winery and was averaged for each time period.
Table 3 and
Table 4 show the grid power price and demand price for each type of winery and for each time period in 2014.
The electricity obtained from solar radiation and fed to the grid, has a fixed price of 0.05 €/kWh which is paid by the electricity company.
4.5. Equivalent CO2 Assessment
Although it is true the
PV system does not produce CO
2 emissions, conventional energy sources are used to manufacture
PV modules as well as other components of the
PV system (inverters, aluminum frames, etc.).
Table 5 thus shows the CO
2 emissions resulting from electricity production in Spain, and the manufacture of
PV components, as obtained from references [
16,
17]. For each type of winery, we calculated the CO
2 emitted into the atmosphere, based on the energy provided by the grid and the renewable energy source, (see
Table 5).
5. Results and Discussion
HOMER studied all configurations that were technically viable and then ordered them in terms of their Net Present Cost (
NPC).
Table 6 shows the results of the most cost-effective configurations of wineries powered by a grid-connected photovoltaic system. This table specifies the electrical power that should be contracted from the electricity company, depending on the size of the winery. The other columns in the table show the optimal quantity of photovoltaic power required so that the sum of electricity, exploitation, and maintenance costs are the lowest possible.
The photovoltaic power that must be installed to reduce these costs depends on the billing policy of the electricity company for the energy thus generated (i.e., self-consumption and/or net metering) as well as the time period of the billing. According to Spanish regulations, 100 kW is the maximum power of a grid-connected renewable energy installation. Because of this limit, medium-size wineries have an optimal installed photovoltaic power of 100 kW for the annual net metering. If this limit did not exist, the installed photovoltaic power would be greater. From an economic viewpoint, this solution would be more profitable.
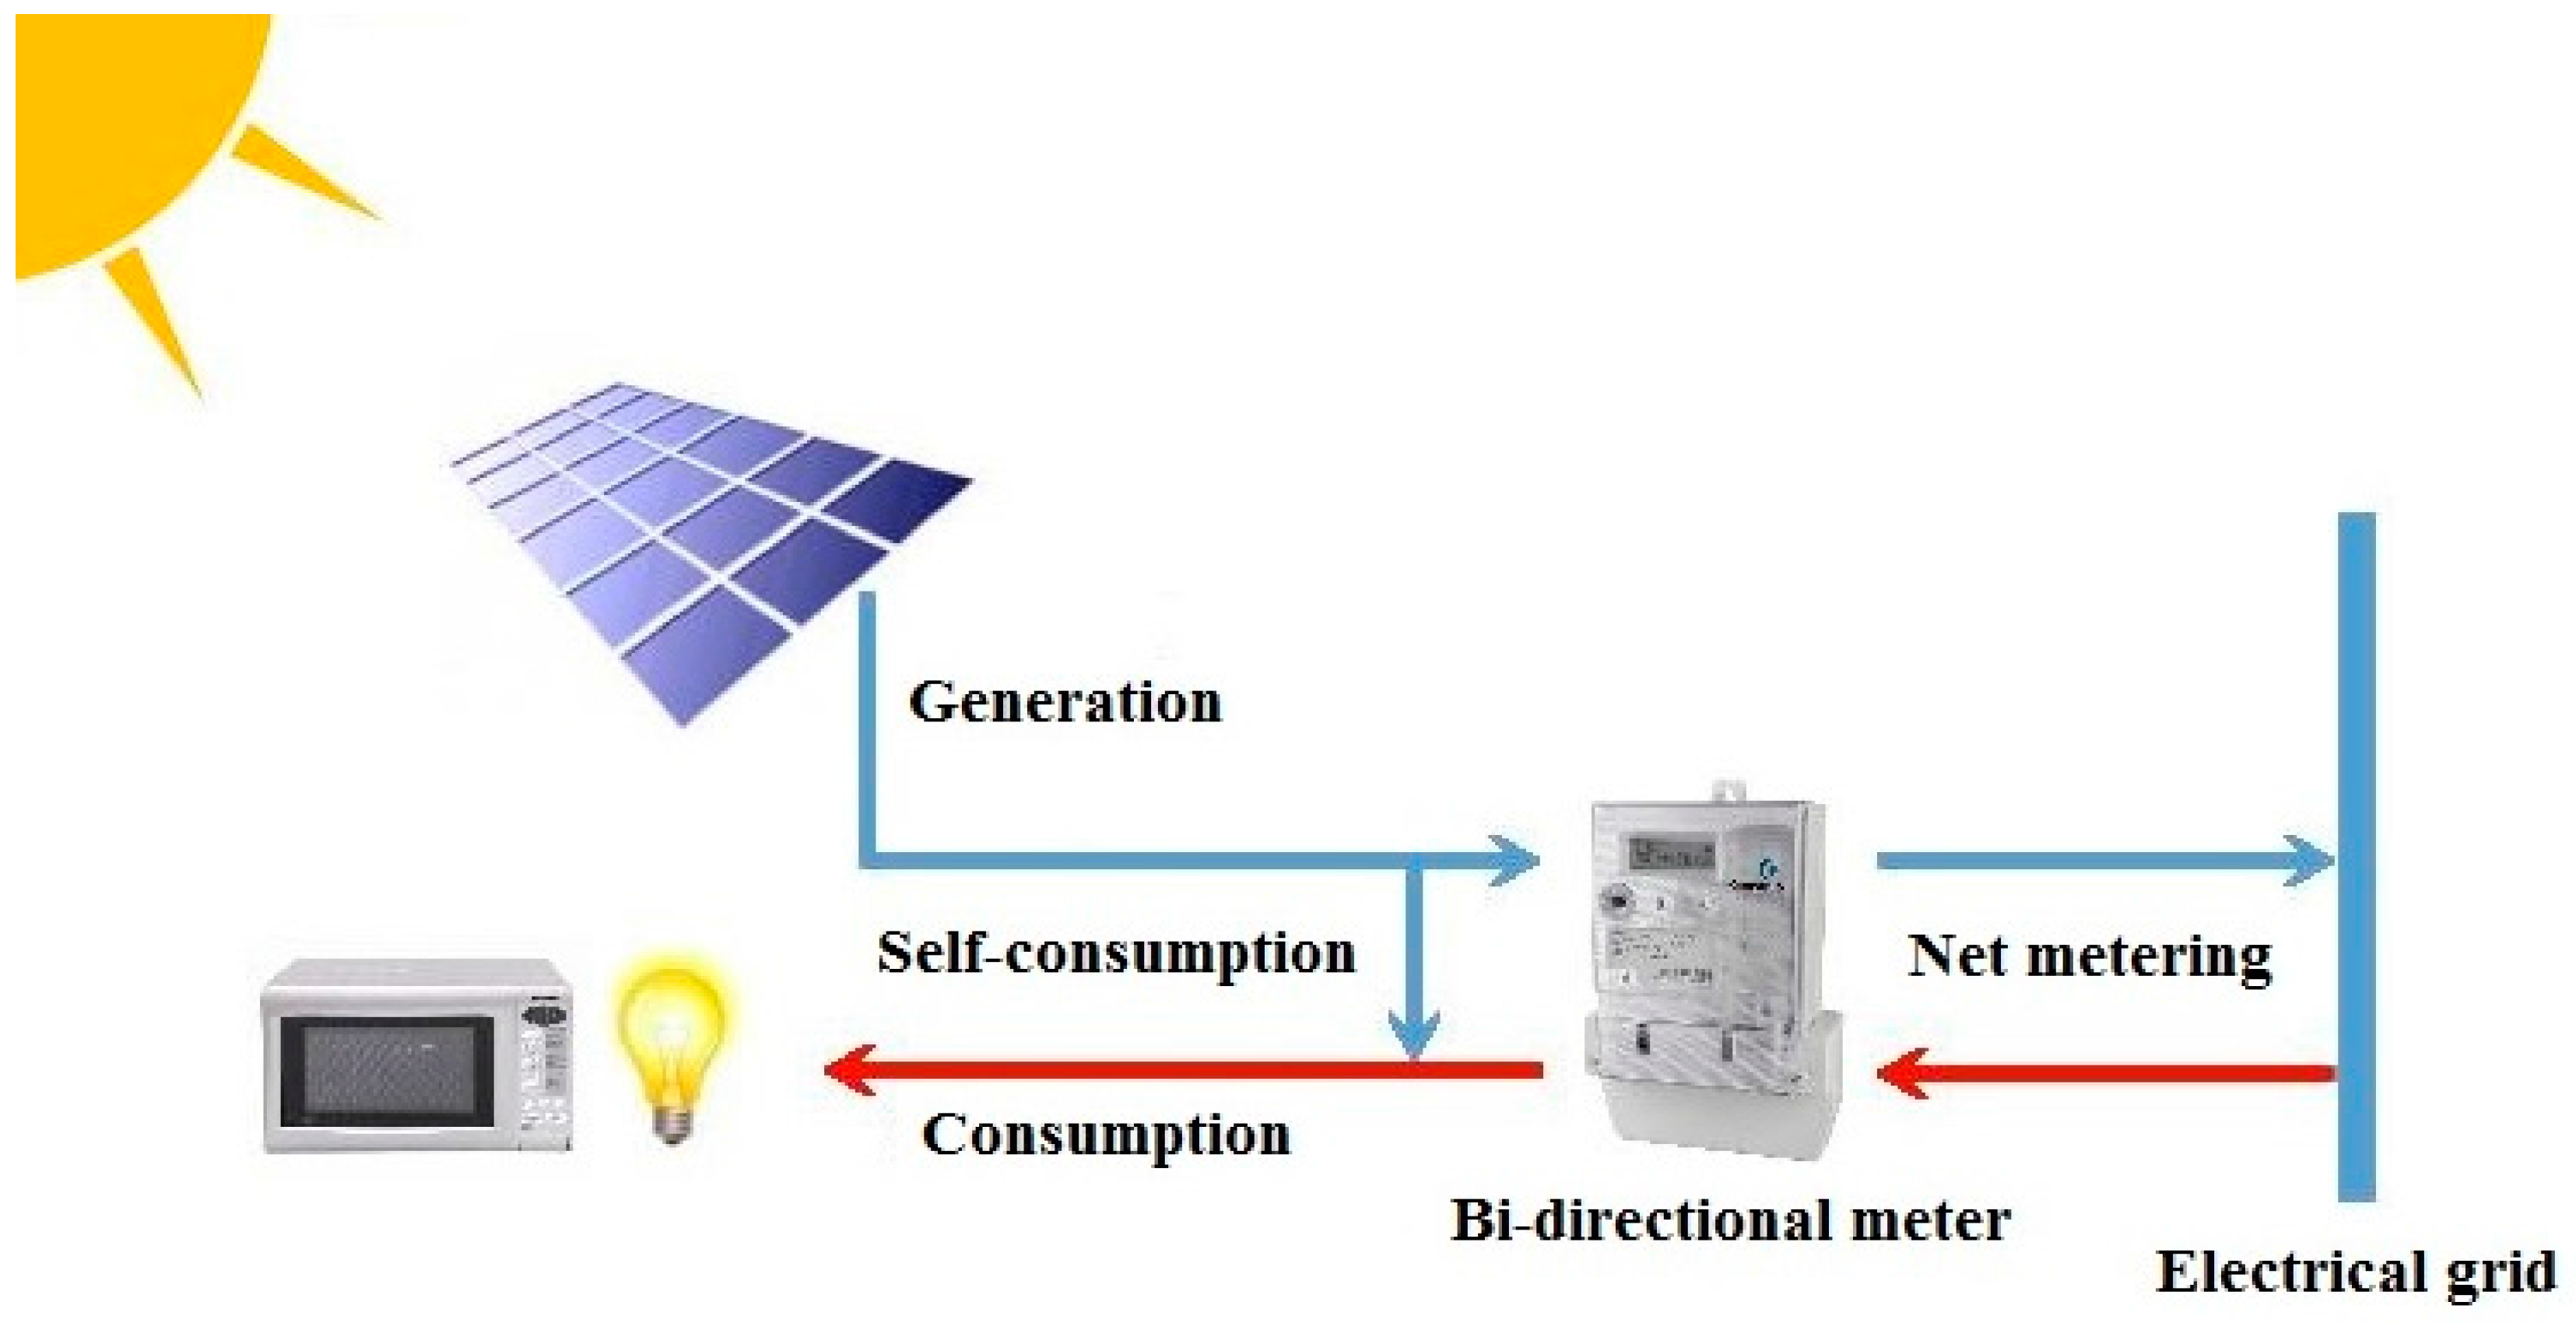
In regard to self-consumption, the winery prioritizes the consumption of electricity generated by the photovoltaic system. It only uses the electrical energy from the grid that the
PV installation is unable to supply. Moreover from December to July, when there is a low demand, the excess energy is fed into the grid. It is then sold to the electricity company at the price agreed on by the winery and the company (see
Figure 6). Equation (6) can be used to obtain the net energy cost for the entire billing period in the self-consumption mode.
where
IESC (kWh) is the electrical energy taken from the grid during the billing period:
CGrid (€/kWh) is the price paid by the winery for the energy consumed from the grid;
EEsc (kWh) is the excess electrical energy (produced by the
PV system) that is fed to the grid during the billing period; and
CPV (€/kWh) is the price paid by the electricity company for this energy from a renewable source.
Rather surprisingly, the results in
Table 6 indicate that for wineries (of any size) in the self-consumption mode, the best option is not to install the 100 kW of photovoltaic power permitted by Spanish law. This is because the installation and maintenance costs of such a system would be higher than the profits obtained during its useful life. As can be observed, the most profitable solution would be to install 26 kW, 14 kW, and 0 kW of photovoltaic power for small, medium, and large wineries, respectively.
In the net metering mode, the winery obtains electricity directly from the grid, whereas all of the electrical energy generated by the photovoltaic system is fed into the grid. In this case, there are two types of net metering, depending on whether the metering of the difference between the electricity fed into the grid and consumed from the grid is billed annually or monthly. This difference in billing has significant impact on the results (see
Table 6). At present, these different modes of net metering are not available in Spain. Nevertheless, since they do exist in other wine-producing countries, the results would be applicable to those cases.
The energy costs in net metering with monthly or annual billing periods can be calculated with Equation (7):
where
IENM (kWh) is the total electrical energy consumed by the winery, and thus obtained from the grid during the billing period; and
EENM (kWh) is the total electrical energy produced by the
PV system that is fed into the grid during the billing period. The following sections present the economic and environmental data that quantitatively demonstrate the results in
Table 6.
5.1. Economical Impact
To determine the viability of each optimization solution, based on its total cost, HOMER provided the Net Present Cost (
NPC) value for the photovoltaic system with a useful life of 25 years.
Table 7 shows the
NPC values for small, medium, and large wineries as well as for the three billing modes. As can be observed, an electricity supply exclusively from the grid is clearly more expensive than an electricity supply from the grid supplemented with electricity from photovoltaic installations, despite the costs generated. Moreover, of the solutions that include a photovoltaic system, the least expensive billing mode is the annual net metering as opposed to self-consumption.
Table 8 shows the cost of electrical energy when electricity is solely obtained from the grid as well as for those cases where there is grid-connected photovoltaic power. Once again, the solutions that contemplate a photovoltaic installation as a supplement for the electricity consumed by the winery are more cost-effective (i.e., lower kWh price) than the conventional model. As in the
NPC, the lowest kWh price was achieved with annual net metering whereas the highest kWh was obtained for self-consumption.
The results in
Table 8 were calculated based on the rates given in
Section 4.4, which are the averages of all the rates available for each winery type.
5.2. Environmental Impact and Sustainability
The environmental impact and the energy sustainability of the most cost-effective solutions for all of the wineries is addressed in this section. The data that indicate the sustainability of the solution provided are the following: (i) percentage of renewable energy consumed by the winery; (ii) direct or indirect CO2 emissions.
Table 9 shows the electrical energy produced by the
PV installations as compared to the total electricity consumed by the wineries. The ratio of the energy supplied by renewable sources as a function of the total energy demand would have been higher if we had considered the thermal energy supplied by biomass boilers. As can be observed in
Table 9, the percentage of renewable energy goes from 0% to 57% for the technically viable and most cost-effective solutions.
Table 10 shows the annual electricity consumption of each type of winery, as based on its corresponding rate and billing policy. Also specified is how much of this consumption comes from the grid, and how much comes from renewable energy.
Moreover, as reflected in
Table 11, the average CO
2 emissions were calculated for the three types of winery (those only connected to the grid and those using grid-connected
PV systems), based on the data in
Table 5.
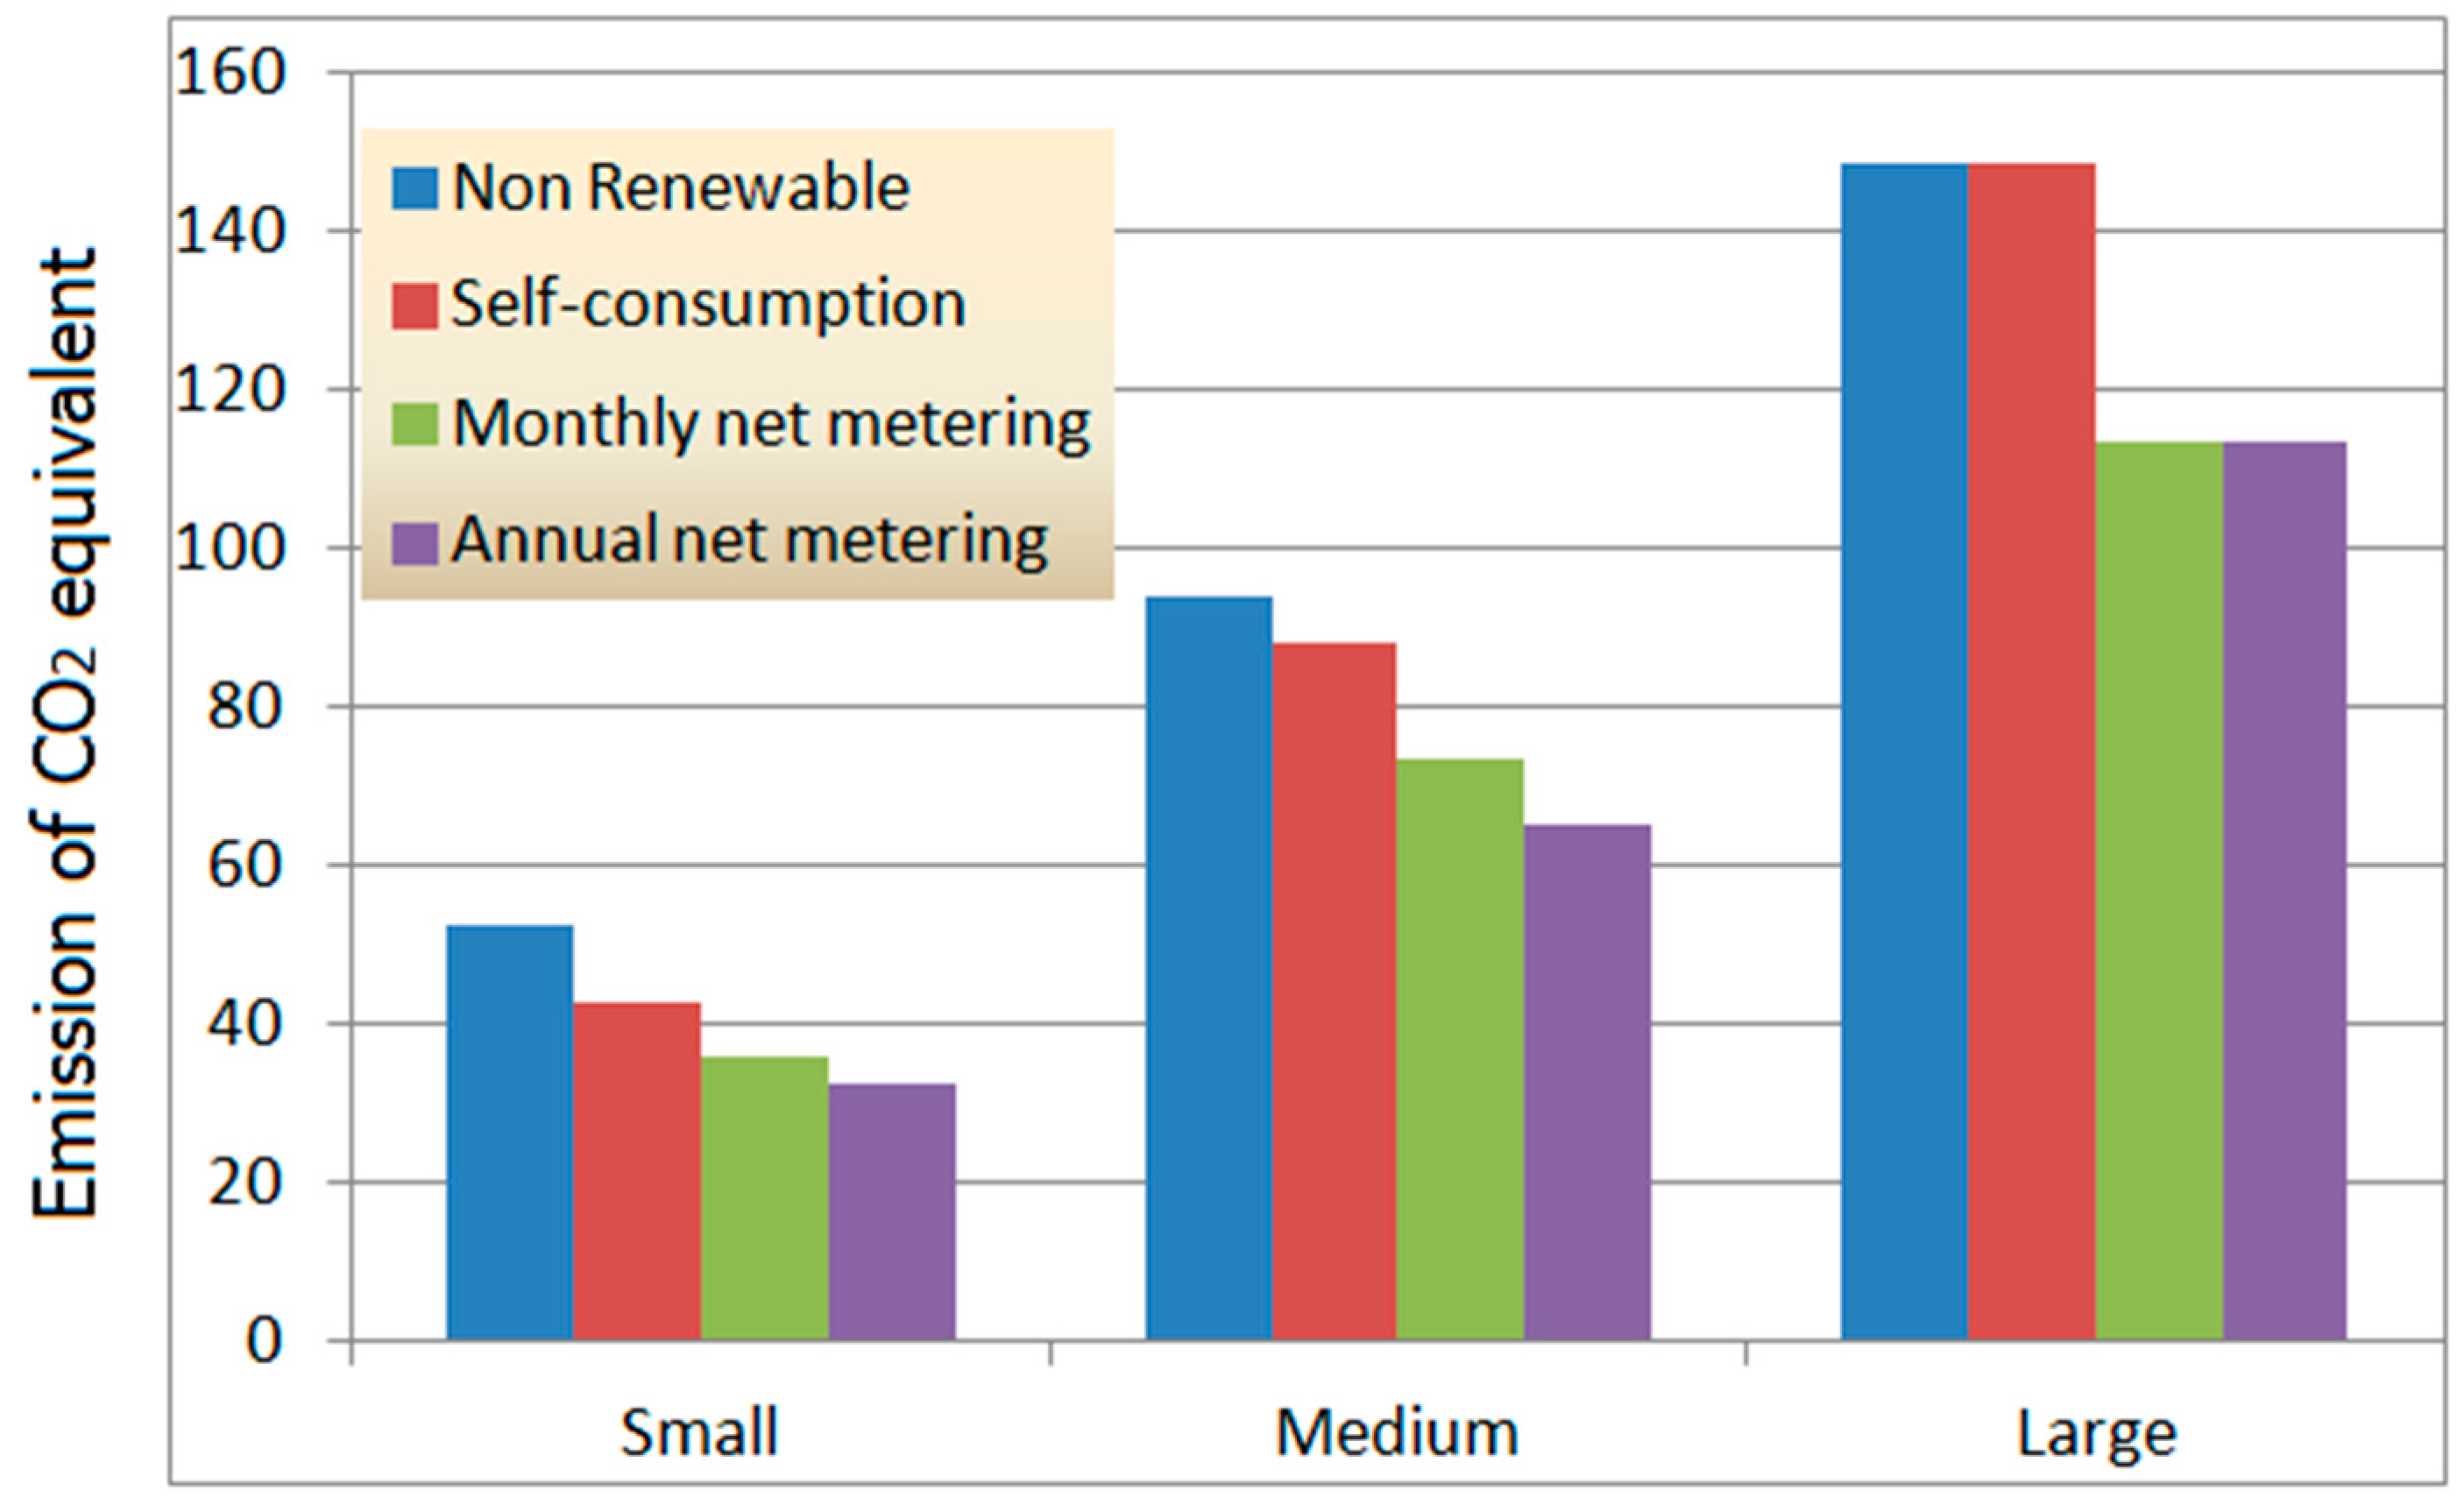
The CO
2 emissions reached a total of 38.1% in small wineries, 30.8% in medium wineries, and 23.4% in large wineries (see
Table 12). The bar chart in
Figure 7 shows the emission levels of the three types of winery.
5.3. Impact on the Market
As explained in
Section 1, one of the goals of this study was to lower the price of wine.
Table 13 shows the average price of the energy required to produce a hectoliter of wine in 2007–2009 (FUTS 2015).
Table 14 shows the real price of wine, as obtained for the three types of winery and the four types of electricity consumption studied. As can be observed, in small wineries, the price per hectoliter of wine increased 29% between 2007 and 2014. In medium-size wineries the rise in price was 28% during the same period, and finally, in large wineries it increased 23% (based on Spanish energy prices).
When the optimal configuration is applied, the price of the energy consumed per hectoliter of wine experiences a reduction of 36% in small wineries, 19% in medium-size wineries and 4% in large wineries, depending on whether the billing is monthly or annually.
Precisely because of the outdated technology in most wineries, there are huge savings in the energy price per hectoliter that come with the installation of renewable energy systems. It is worth highlighting that large wineries have a smaller optimization margin because of the competitive rates achieved. Large wineries thus have lower benefits (20.67% less than small wineries and 9.34% less than medium-size wineries).
6. Conclusions
This research assessed the environmental, economic, and technical viability of using grid-connected photovoltaic installations to power the operation of wineries in Spain. As part of this study, the wineries were classified as small, medium, or large, depending on their volume of wine production. Of the thermally viable solutions, the most cost-effective one was calculated. For the purposes of this study, the HOMER computer application was used. The installation, maintenance, and eventual replacement of the photovoltaic system after a useful life of 25 years was also taken into account.
Three billing and metering policies were included. We compared our calculations with conventional electricity rates, whose price has soared in recent years. Our results confirmed that the configurations proposed in our study could substantially reduce power costs in the winemaking industry, one of the most important in Spain. The following conclusions can be derived from this research study.
Firstly, from an economic perspective, the NPC of the installation was the optimization criterion. The costs of the system were those related to installation, maintenance, and electricity consumption during its useful life. Small wineries saved 11.7% whereas large wineries saved 0.4%. In all likelihood, these percentages will increase in the future because the price of electricity will progressively rise, and technology will become more efficient. In regard to the price per KWh paid by the winery, we obtained savings of 37.2% (from 0.183 €/kWh without renewables to 0.116 €/kWh with renewables) in small wineries and up to 9% in large wineries (from 0.141 €/kWh without renewable to 0.136 €/kWh with renewables), depending on the billing and metering policy.
Secondly, from an environmental perspective, the quantity of renewable energy depends on the size of the winery as well as the billing and the metering policy. The amount of renewable energy ranged from 0% to 57%. These percentages would be higher if biomass were used to feed the thermal demand, or if the conventional energy sources used in the construction of the
PV system were not considered. On the other hand, CO
2 emissions experienced a reduction that ranged from 23.4% to 38.1%. This is in consonance with the EU objective of reducing CO
2 emissions by 20% in different economic sectors [
19].
Finally, the use of renewable energy had a positive impact on the price of wine production, which decreased more than 36% in the case of small wineries, and more than 4% in the case of large wineries. It is our expectation that these research results will help wineries design an optimal PV support system that will make wine production more cost-effective.


