1. Introduction
Urban areas face potentially significant threats from both natural and human-made catastrophes. Cities growing rapidly at the current speed become very vulnerable to environmental problems, particularly the rainstorm waterlogging problem. As soon as rainwater starts to accumulate on roadways in urban areas, it will become a hazard for the residents because walking across 20 cm deep water is very difficult. Bikers and motorcycles would have problem passing through 30 cm deep water on roads. The most problematic spots are those under bridges as waterlogging can block traffic flow [
1].
In the majority of cities, rainstorm waterlogging normally occurs within a very short period of time after heavy rainfalls, but rainstorms are not the only cause of waterlogging problems. As a result of the urbanization process, the topology, terrains, and water convergence conditions in urban areas are altered, leading to the decimation of vegetation coverage and river and pond areas. Large proportions of land have been changed into impervious areas, resulting in reduced ground water holding capacity, shortened water stagnation periods and low permeability, and fast surface runoff. On the other hand, the underground water discharge pipe network facilities are typically not upgraded concurrently with city development, so there is a lack of sufficient capacity for discharging such a large volume of water. These two factors together are responsible for causing urban rainstorm waterlogging disasters.
The potential damage from waterlogging in urban area increases as the resident population continues to grow, and buildings are more and more compacted with highly centered economic activities. When a waterlogging disaster happens, the normal routines of daily life and the network of society activities are disrupted. When the commuting and transportation systems are interrupted as roads become impassable to residents and motor vehicles, and life support facilities residents will be inaccessible to residents, resulting in big threats to human life and property. Therefore, to accurately assessing the level of residents’ trip difficulty under rainstorm waterlogging conditions is very important for developing evacuation and emergency management plans during a disaster.
When assessing the trip difficulty of urban residents, the best way is to use data recorded in previous urban rainstorm waterlogging events to construct mathematical models which are used to simulate the road conditions under various waterlogging scenarios. In developed countries where urbanization started very early, comprehensive strategies to manage urban waterlogging disasters have been developed and some of their experiences are very valuable [
2,
3].
From the late 19th to the mid-20th centuries, several very important and hydraulics-mathematical models (also including some hydraulic models) have been proposed consecutively, which are the theoretical basis for urban hydrology studies. The mathematical models include the de Saint-Venant system of equations (1871), Manning Formula (1889), the Thiessen polygon method to interpolate area average precipitation (1911), isochrones unit hydrograph method (1922), Pearson-III type curve method to fit the frequency distribution curve (1924), unit hydrograph method (1932), Muskingum method (1935), Synthesis Unit Hydrograph Method (1938), the Los Angeles hydrograph method (1944), the torrential rain intensity formula described using the exponential function (1950), the instant unit hydrograph of Clark method (1957), water ingress flood hydrograph method (1958), the Chicago method (1960), TRLL calculation program (1963), Muskingum-Cunge method (1969) and others. Those urban hydrological and hydraulic mathematical models are the foundation for simulations of trip difficulty for urban residents under rainstorm waterlogging conditions.
Forecasts for urban rainstorm waterlogging early-warning systems play a key role in quick response to a disaster. Estimation of the trip difficulty for residents in the waterlogged area is a critical component for any disaster management plan. Japan is a country experiencing very frequent natural disasters. The country had to build a strong capacity to cope with urban waterlogging disasters. Presently in Japan, most of the urban rainstorm waterlogging studies use hydraulic tests to determine the safety thresholds for residents to walk across waterlogged areas, which is used to select the evacuation routes [
4].
In a study by Daichi’s group, the authors developed a method to analyze the waterlogging data and to estimate the possibility for the residents to evacuate on foot during a disaster [
5]. A comprehensive strategy was developed by also taking consideration human factors during the evacuation process. They also studied an evacuation process when basements were flooded by applying the hydraulic principles [
6]; the pressure force exerted from water logging on doors per unit area was estimated, which, in combination with the flow rate and depth of the rainwater, was used to assess the trip difficulty for the residents to evacuate on foot. Then using a large scale in-door hydraulic test [
7], the threshold values were determined for residents to walk across the waterlogged area, the length of time required to escape a car, and the relationship between water depth and the difficulty level for humans to escape a waterlogging disaster. In a study by Suga
et al. [
8,
9] five factors, including the flood velocity, water depth, distance from disaster shelter, walking speed, and the awareness of risk in residents were compared, and the threshold values for residents to walk across waterlogged areas were estimated.
In summary, several studies have been performed to assess residents’ trip difficulty level to evacuate on foot during an urban rainstorm waterlogging disaster. In most of the reported case studies, the disaster-affected objects and the surrounding environments were selected as the influential factors during the assessment procedure, whereas the dynamics of waterlogging process and simulation under different scenarios was not been fully investigated.
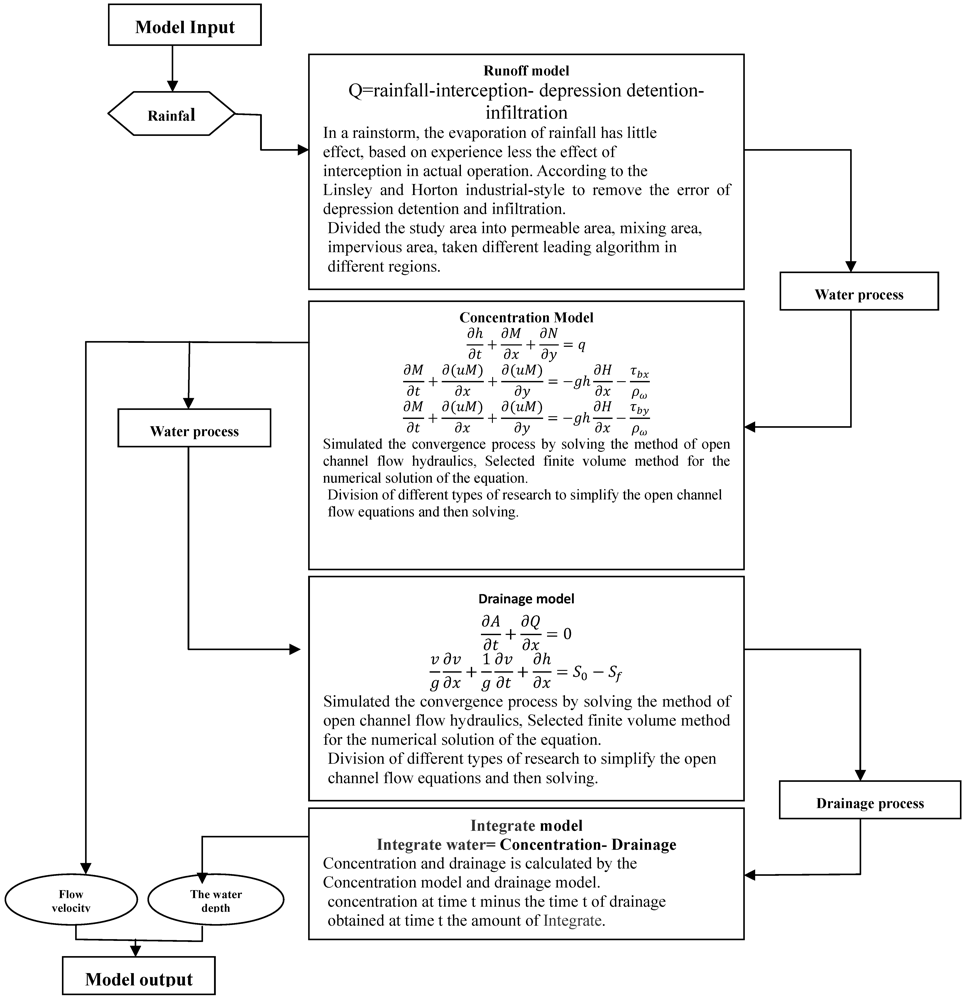
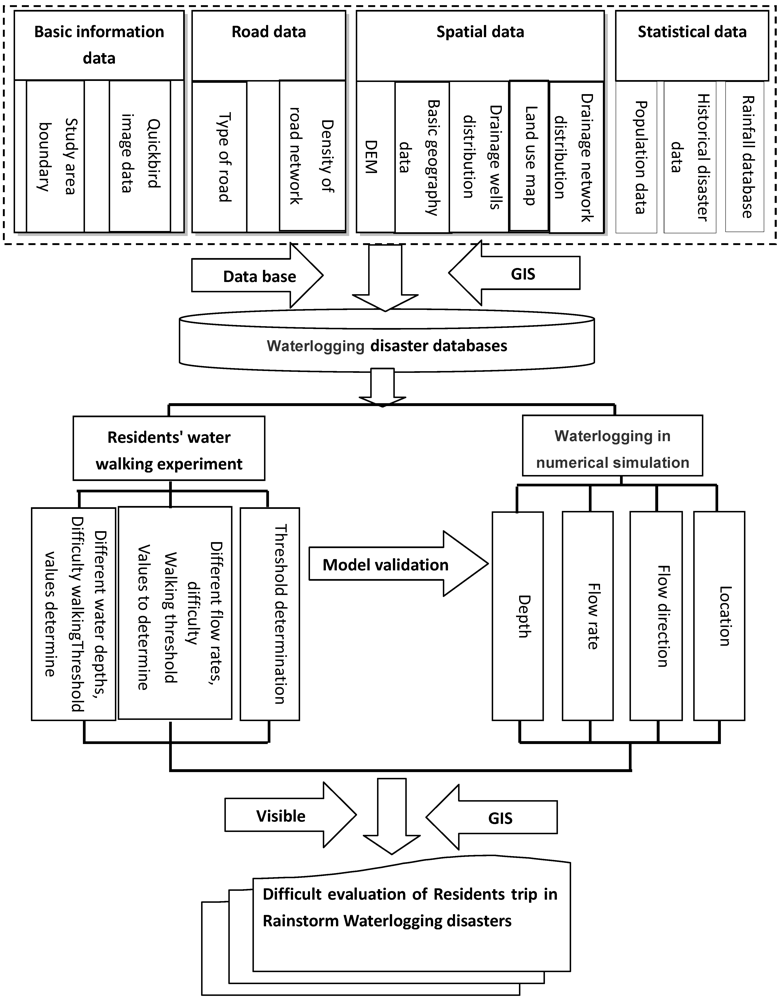
In the present study, the process of development of an urban rainstorm waterlogging case was used initially to construct mathematical models which were then used to simulate the dynamics of urban rainstorm waterlogging formation. Factors such as water depth, flow directions, and water flow velocity were all embedded in the models, furthermore, irregular grids were used as skeletons for modeling which made the simulation more accurate. Additionally, scenario simulation methods were used to plot road waterlogging situations under different schemes of rainstorms, then locations of roads under waterlogging condition, the expanse of waterlogged areas, water depth, water flow velocity and directions were simulated dynamically. All of those factors were considered when assessing the trip difficulty for residents in waterlogged areas. The simulation results are very instructive for protecting the safety of residents and their propery, for directing the traffic, and for enhancing forecasting and early warning systems, thus taking appropriate actions to mitigate the risk of urban rainstorm waterlogging disasters.
2. General Description of the Study Area
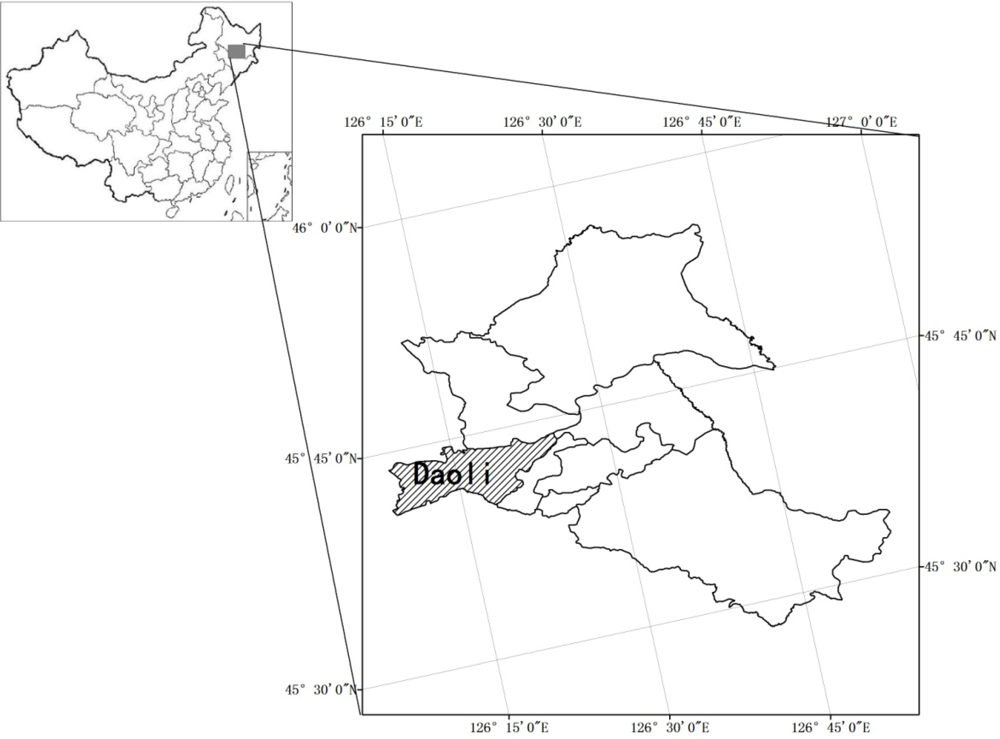
Ha-Erbin is the capital city of HeiLongjiang province in China, it is located at 125°42′–130°10′ east longitude and 44°04′–46°40′ north latitude (
Figure 1). The city is the center of politics, economy, culture and transportation in Northeastern China, it has the largest metropolitan area in the region and is also the second largest provincial capital city in terms of expanse and population and one of the top 10 largest cities in China. The city has an area over 53.1 thousand square km, consisting of eight districts and 10 counties (suburbs). The total population is 10.635 million people, and downtown residents are over 5.879 million people. The average annual rainfall precipitation is 569.1 mm, summer is hot and humid with frequent rains. Major precipitation occurs in June–August, which receive over 60–70% of total annual rainfall. Because of the rainfall seasonality, rainstorms occur periodically during the summer.
Figure 1.
Diagram of the study area.
Figure 1.
Diagram of the study area.
In recent years, the city of Ha-Erbin has been growing rapidly. Neither the new nor the old towns have efficient drainage pipelines, and the cross sectional area of the drainage system is too small. According to the records, in 2011 the water discharge pipeline in the city was 993 km long. Drainage pipes only covered 66% of the area, leaving the remaining 34% of the urban area with no drainage outlets. What made it worse was that over 30% of the pipelines were outdated, and there were 27 km of pipelines that have been in use for over 70 years and the pipes were seriously aged. According to current national regulations, urban water discharge pipelines should have a discharge capacity of 185 m3/s to handle a medium-rainfall (25 mm/h precipitation), and the standard for urban rain water sewer line density is 11 km per square km, for rain water and sewer convergence discharge pipeline density it is 8 km per square km. In Ha-Erbin, the water discharge capacity was only 117 m3/s, which is 68 m3 lower than the medium-rain standard. As a consequence, when there was a medium-rainfall, rain water would accumulate on road surface at a rate of 68 m3/s, and within about half an hour, some roads started to have paddling-depth water.
In the city, rain water and sewage are discharged through the same pipelines. The discharge pipeline density was 5.36 km/square km, which is 30% below the national standard. In the old town, as population continued to increase, areas of water convergence also expanded. However, improvement of the water discharge pipelines fell far behind, and as a consequence some road sections would have water logging due to a lack of drainage system. As more household garbage was produced and continuously disposed of into the drainage pipe lines, some of the pipes became clogged, and the roadways were heavily flooded when it rained, affecting residents’ safety.
4. Results and Discussion
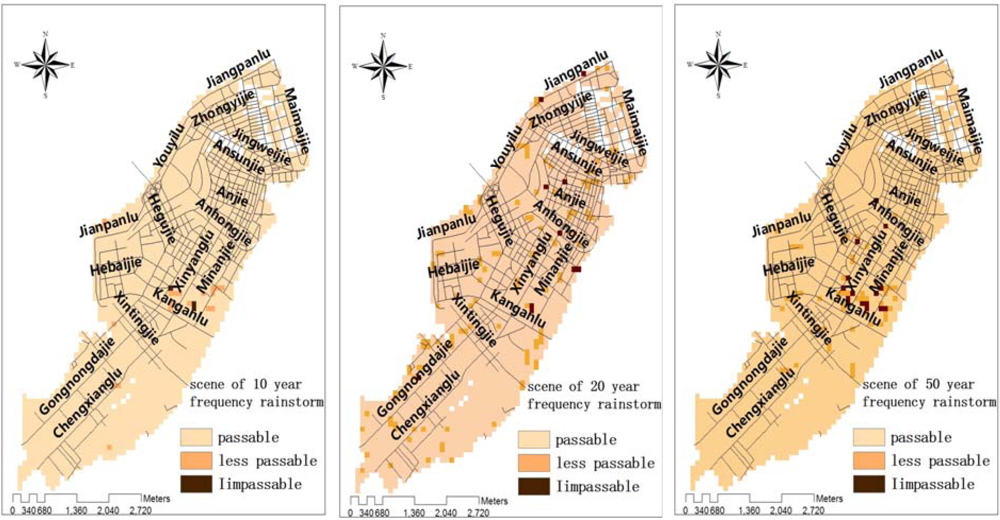
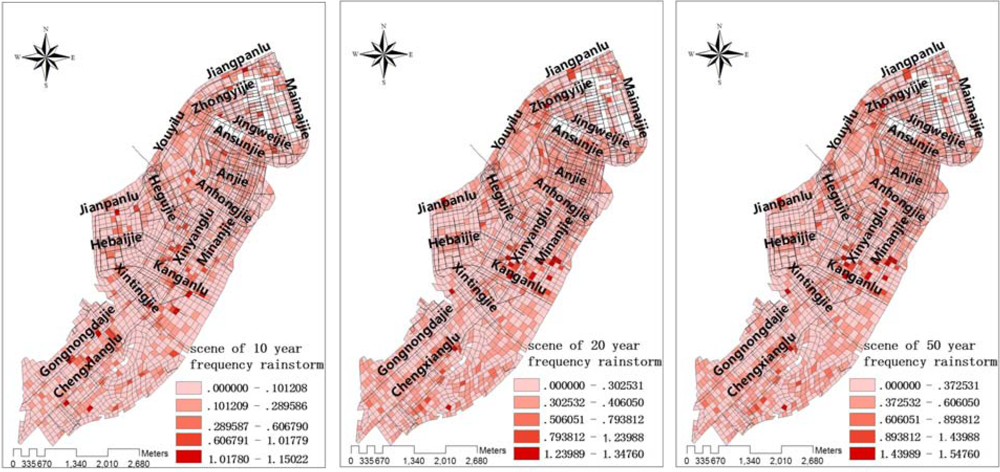
4.1. Simulation and Visualization of Urban Waterlogging Scenarios
Urban waterlogging scenarios were simulated for road conditions under various rainstorm conditions. After fitting the historical data of urban rainstorm waterlogging, models were constructed for three scenarios which would occur once every 10, 20 or 50 years. Then data for the waterlogged locations, and the depth and flowing velocity and directions of water, were generated to construct the GIS topic maps for the city (
Figure 6,
Figure 7,
Figure 8).
Figure 7.
The velocity of waterlogging under three scenarios of reoccurrence of rainstorm: from right to left: every 10 years, 20 years, 50 years.
Figure 7.
The velocity of waterlogging under three scenarios of reoccurrence of rainstorm: from right to left: every 10 years, 20 years, 50 years.
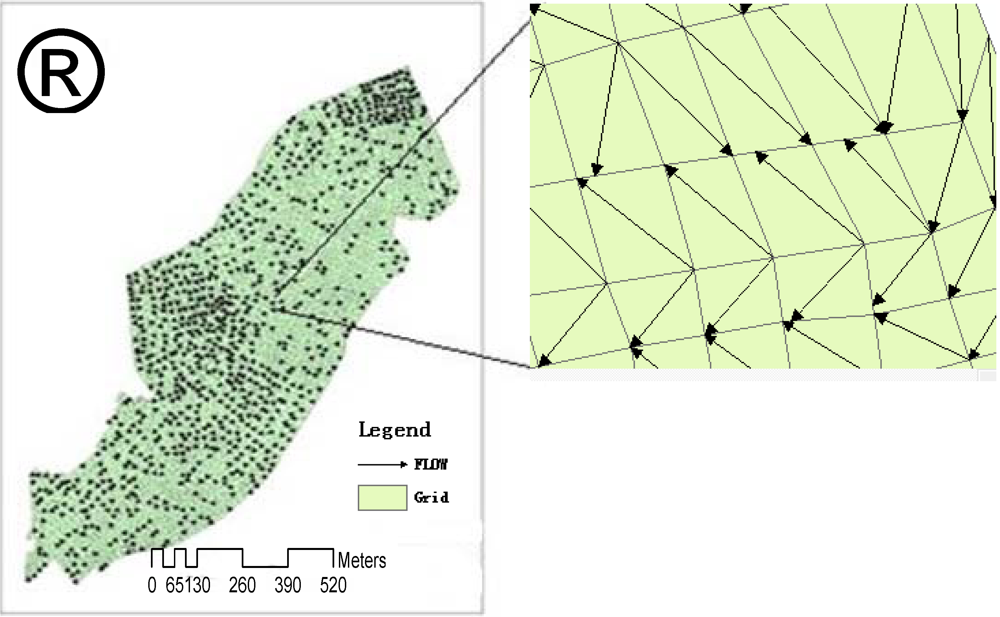
Figure 8.
The flowing direction of waterlogging after rainstorm in urban area.
Figure 8.
The flowing direction of waterlogging after rainstorm in urban area.
4.2. The Relationship between Trip Difficulty and the Depth and Flow Velocity of Waterlogging
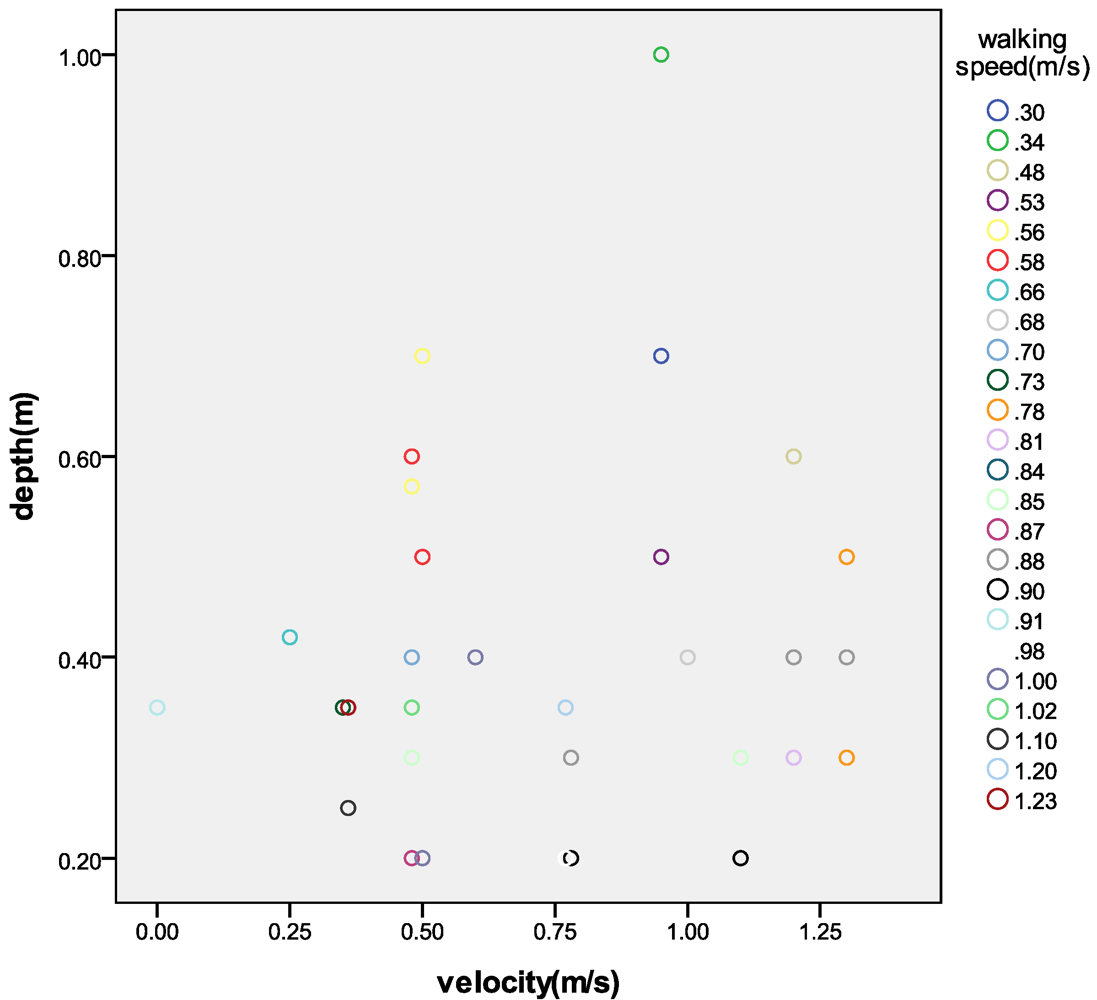
Options of accessible-roads were used as major criteria for assessing the trip difficulty in urban rainstorm waterlogging, because waterlogged roads would be impassable to residents, thus threatening the mobility and safety of residents. The major factors affecting road accessibility are the location of the waterlogged streets, the size of the area under water, and the depth, flow velocity and direction of water. After combining information from historical record data and results from the experimental tests conducted in this study as well as referring to published papers [
23,
24,
25], it was concluded that when water on the road is 0.5 m deep and flowing at 1.0 m/s, walking across water becomes very difficult. When water reaches above 1 m deep and moving at 1.5 m/s, the roads would be inaccessible to residents [
26,
27]. The difficulty levels of walking across areas with different depths and flowing rate of waterlogging were assessed (
Table 3).
Table 3.
Relationship between trip difficulty for residents and the depth of waterlogging.
Table 3.
Relationship between trip difficulty for residents and the depth of waterlogging.
![Ijerph 09 02057 i007]() | h < 0.5 m | 0.5 m < h < 1 m | h > 1 m |
|---|
| v < 0.5 m/s | Passable | Passable | Difficult |
| 0.5 m/s < v < 1.5 m/s | Passable | Difficult | Impassable |
| v > 1.5 m/s | Difficult | Impassable | Impassable |
4.3. Assessment of the Resident Trip Difficulty and the Visualization Results
Using the simulated results under the three unban rainstorm waterlogging scenarios described above, subject maps were generated for the waterlogging depth and flow velocity using ARCGIS. Then the interpolation and buffer wizards in the conversion tools were activated to import the simulated data for water depth and flow rate to obtain the trip difficulty threshold value for each of the grids.
Based on the experimental results, the historical records and the situation in downtown Ha-Erbin, the trip difficulty in urban rainstorm waterlogging conditions was divided into three levels: passable roads (water depth 0 m-0.5 m, and flow velocity at 0 m/s-0.5 m/s), difficult but passable roads (water depth at 0.5 m-1 m and flow velocity at 0.5 m/s-1.5 m/s), and impassable roads (water deeper than 1m and flowing velocity above 1.5 m/s).
From
Figure 9, it can be seen that in the urban rainstorm waterlogging scenario which reoccurs once every 10 years, only three grids were impassable for residents, while other areas remained open. Under this scenario, the safety of residents travelling on foot and traffic flow should be normal. In the once-every-20-years-scenario, 13 grids were impassable, while other areas were open to the traffic. This situation would have some impact on the mobility of residents, traffic jams could occur on some waterlogged roads. In the once-every-50-years scenario, there were 86 grids that would become impassable to residents, while the rest of the city were still open. This situation would have caused traffic jams in expanded areas, roads could be closed for residents and vehicles. Emergency response measures should be taken by the respective agencies in charge to resolve the traffic problems.
Figure 9.
Evaluation of resident trip difficulty under the three scenarios.
Figure 9.
Evaluation of resident trip difficulty under the three scenarios.
4.4. Discussion
This study was performed in the downtown (Daoli) district in Ha-Erbin. The two-dimensional unsteady flow was used as the basic controlling equation, and irregular grids as the basic skeletons. A “three-layer model” was constructed to simulate various urban rainstorm waterlogging scenarios. The model was put into a test on 10 August 2011 in a strong thunderstorm rainfall caused by the north-bound hurricane “Muifa” in Ha-Erbin, and it was proven effective. Meanwhile, according to the rainstorm characteristics in Ha-Erbin, the model was used to simulate the resident trip difficulty in urban rainstorm waterlogging scenarios that reoccur once every 10 years, 20 years, or 50 years.
Urban rainstorm waterlogging can be very treacherous in certain areas. Together with the fast moving speed and rapid-spreading properties of precipitation from rainstorm, it is hard to develop an efficient strategy to control the waterlogging situation. Deploying an inappropriate approach can actually exacerbate the resultant damage. After waterlogging spreads into large areas, it will become very difficult to evacuate residents or divert traffic, it also makes it harder for the rescue workers to reach the disaster-stricken areas.
In this study, several small-scale urban rainstorm waterlogging scenarios were assessed for the consequential effects on trip difficulty for residents. The research can be expanded to the assessment of urban basic construction, transportation roads and systems, and hazardous disasters in the ecological systems. The simulation methods are applicable in the prediction, forecast and validation of different types of natural disasters on regional scales, the construction of the vulnerable curves in response to natural disasters in urban area, and the enhancement of rapid response to emergency waterlogging situation in urban areas. Application of the technology will benefit rapid assessment of potential disaster damages, improving the level of management and mitigation of risks against natural disasters.


