Maximum Cumulative Ratio (MCR) as a Tool for Assessing the Value of Performing a Cumulative Risk Assessment

Abstract
:1. Introduction
1.1. The Concern for Cumulative Toxicity from Concurrent Exposure to Multiple Chemicals
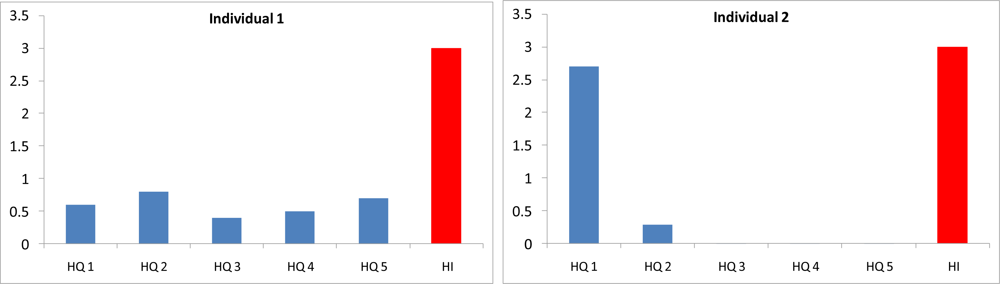
1.2. The Maximum Cumulative Ratio
1.3. Application of the Maximum Cumulative Ratio to Mixtures of Pest Protection Products in Surface Waters of the U.S.
- Do MCR values vary across the samples, and if so, what is the range of MCR values?
- Are the values of MCR closer to n or 1?
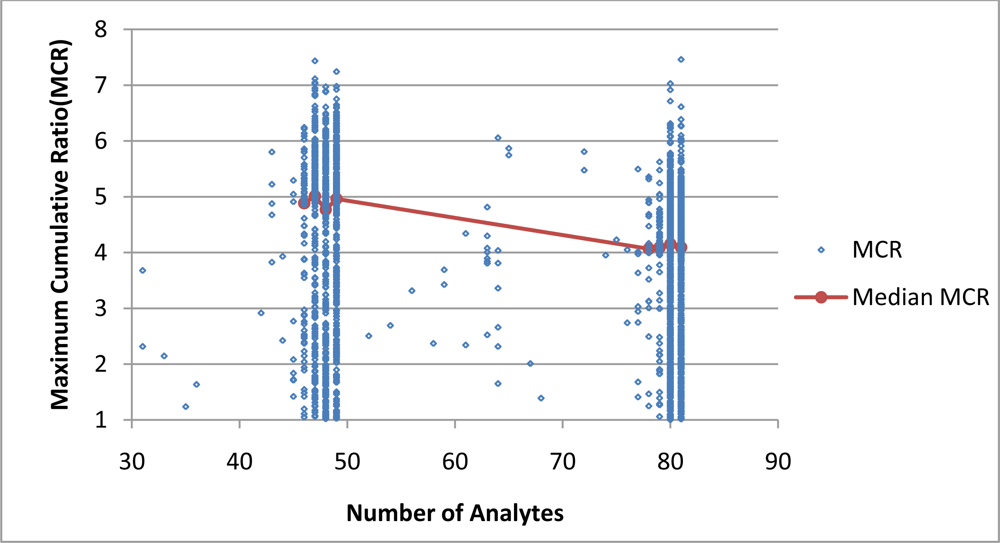
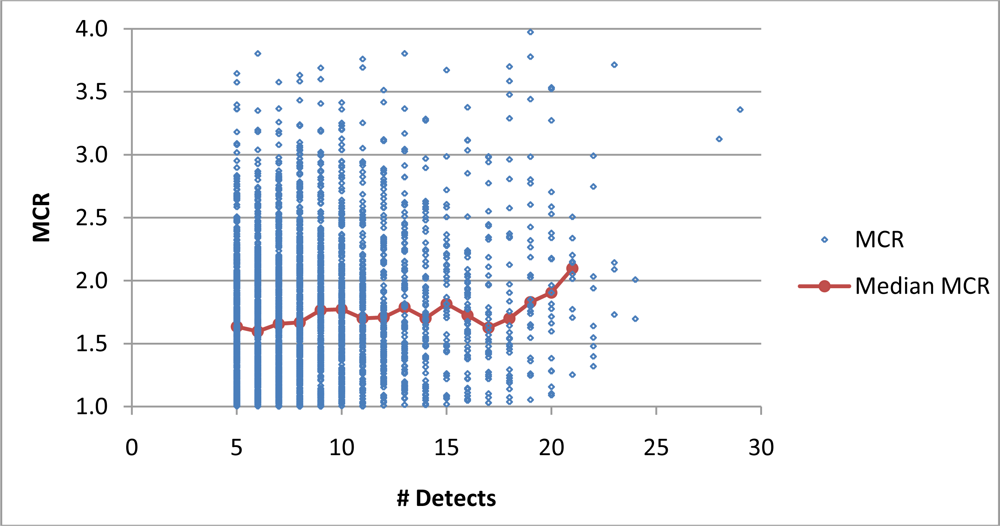
- Are MCR values correlated with n?
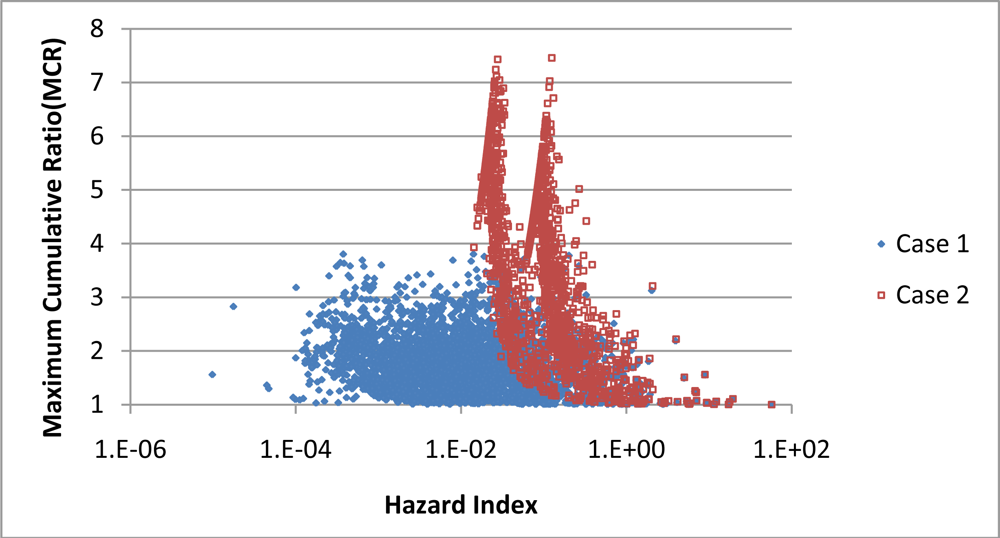
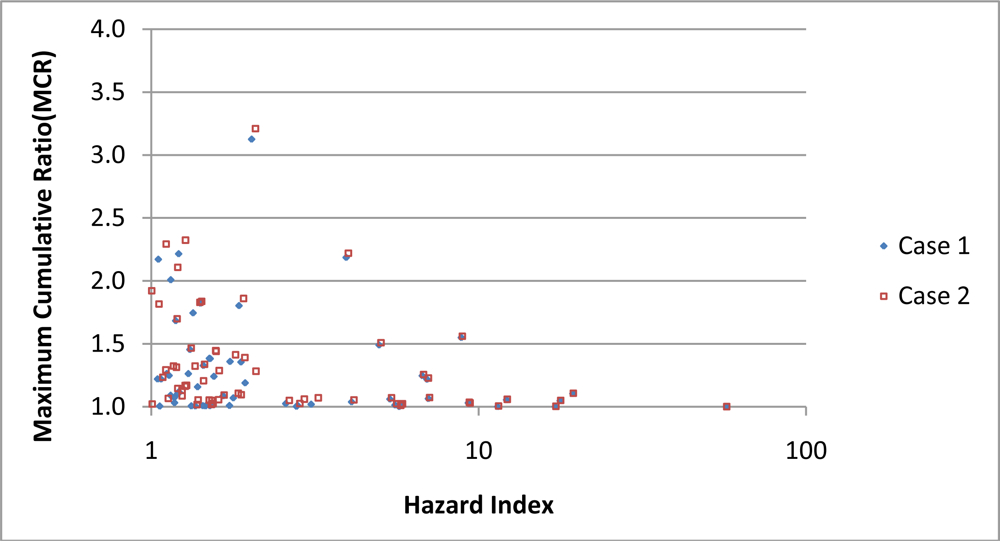
- Are MCR values correlated with the values of HIi for the individuals exposed to the chemicals in the samples?
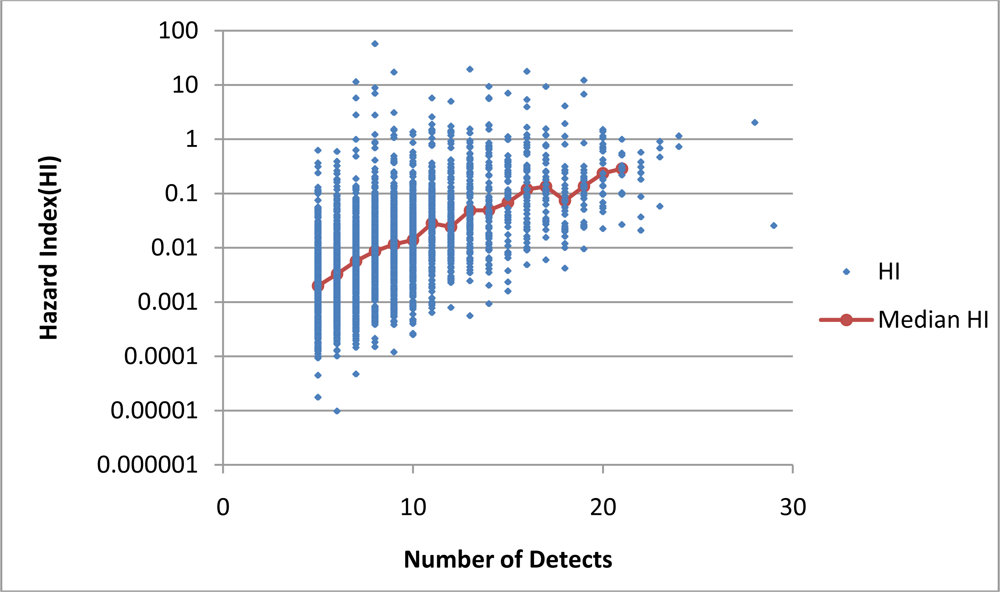
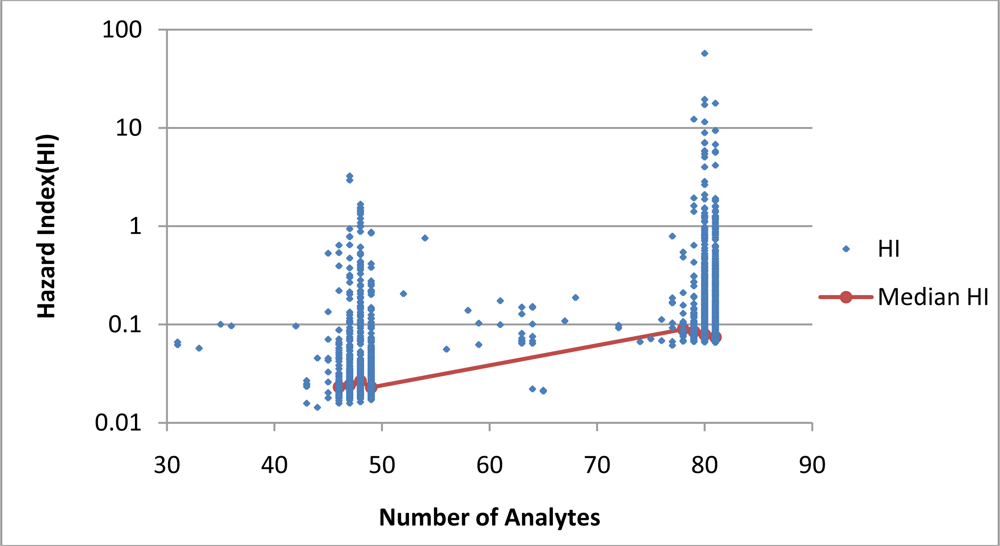
- How does the presence of chemicals that occur at levels below the detection limits affect the determination of the values of HI and MCR associated with exposure to a mixture?
2. Experimental Section
2.1. Materials
2.2. Preliminary Analyses of Survey Data and Development of a Subset of Mixture Samples
2.3. Statistical Analyses
3. Results and Discussion
3.1. Results
3.2. Discussion
4. Conclusions
Acknowledgments
- Potential Conflicts of InterestThe Dow Chemical Company manufactures many chemicals substances including some of the PPPs listed in Table 1. However, since this manuscript only addresses methodological issues the authors declare no conflict of interest.
References
- National Research Council. Science and Decisions: Advancing Risk Assessment; Committee on Improving Risk Analysis Approaches Used by the U.S. EPA, National Academies Press: Washington, DC, USA, 2009. [Google Scholar]
- National Research Council. Phthalates and Cumulative Risk Assessment; National Academy Press: Washington, DC, USA, 2009. [Google Scholar]
- U S EPA. Concepts, Methods and Data Sources for Cumulative Health Risk Assessment of Multiple Chemicals, Exposures and Effects: A Resource Document; U.S. Environmental Protection Agency, Office of Research and Development, National Center for Environmental Assessment: Cincinnati, OH, USA, 2007. [Google Scholar]
- The School of Pharmacy, University of London; Göteborg University; Faust & Backhaus; Environmental Consulting GbR. State of the Art Report on Mixture Toxicity; Directorate-General for the Environment (DG Environment), European Commission: Brussels, Belgium, 2009. [Google Scholar]
- Chemical Mixtures: A Framework for Assessing Risks to Human Health; Interdepartmental Group on Health Risks from Chemicals (IGHRC), Institute of Environment and Health: Cranfield, UK, 2008.
- World Health Organization. Harmonization Project Document 7; Assessment of Combined Exposures to Multiple Chemicals: Report of a WHO/IPCS International Workshop on Aggregate/Cumulative Risk Assessment; WHO: Geneva, Switzerland, 2009. [Google Scholar]
- Meek, ME; Boobis, AR; Crofton, KM; Heinemeyer, G; Van Raaij, M; Vickers, C. Risk assessment of combined exposure to multiple chemicals: A WHO/IPCS framework. Regul. Toxicol. Pharmacol 2011, 60, S1–S14. [Google Scholar]
- Koneman, H. Fish Toxicity Tests with Mixtures of More than Two Chemicals: A Proposal for a Quantitative Approach and Experimental Results. Toxicology 1981, 19, 229–238. [Google Scholar]
- Junghans, M; Backhaus, T; Faust, M; Scholze, T; Grimme, LH. Application and validation of approaches for the predictive hazard assessment of realistic pesticide mixtures. Aquat. Toxicol 2006, 76, 93–110. [Google Scholar]
- Gilliom, RJ; Barbash, JE; Crawford, CG; Hamilton, PA; Martin, JD; Nakagaki, N. The Quality of Our Nation’s Waters—Pesticides in the Nation’s Streams and Ground Water, 1992–2001; U.S. Geological Survey: Reston, VA, USA, 15 March 2006. [Google Scholar]
- Helsel, D. Much ado about next to nothing: incorporating non-detects in science. Ann. Occup. Hyp 2010, 54, 257–262. [Google Scholar]
- Pesticides in the Nation’s Streams and Ground Water, 1992–2001. Available online: http://water.usgs.gov/nawqa/pnsp/pubs/circ1291/appendix6/ (accessed on 22 November 2010).


| Chemical | Permitted Dose mg/kg/day | Source codea | Chemical | Permitted Dose mg/kg/day | Source code | Chemical | Permitted Dose mg/kg/day | Source code |
|---|---|---|---|---|---|---|---|---|
| 2,4,5-T | 0.01 | 1 | Cyanazine | 0.00026 | 5 | Molinate | 0.001 | 3 |
| 2,4,5-TP | 0.008 | 1 | Dacthal | 0.01 | 2 | Napropamide | 0.12 | 2 |
| 2,4-D | 0.005 | 2 | Dacthal monoacid | 0.01 | 2 | Norflurazon | 0.015 | 2 |
| 2,4-DB | 0.03 | 2 | Diethyl atrazine | 0.0018 | 2b | Oryzalin | 0.12 | 2 |
| 2,6 Diethylaniline | 0.006 | 3b | Diazinon | 0.0002 | 2 | Oxamyl | 0.001 | 2 |
| 3-Hydroxycarbofuran | 0.00006 | 2b | Dicamba | 0.45 | 2 | p,p’-DDE | 0.0005 | 3 |
| Acetochlor | 0.02 | 3 | Dichlobenil | 0.015 | 2 | Parathion | 0.006 | 7 |
| Acifluorfen | 0.004 | 2 | Dichlorprop | 0.036 | 2 | Parathion-methyl | 0.00002 | 2 |
| Alachlor | 0.01 | 2 | Dieldrin | 0.00005 | 6 | Pebulate | 0.0007 | 2 |
| Aldicarb | 0.00027 | 3 | Dinoseb | 0.001 | 1 | Pendimethalin | 0.1 | 2 |
| Aldicarb sulfone | 0.00027 | 3 | Dinitro-o-cresol | 0.004 | 6 | Phorate | 0.00017 | 2 |
| Aldicarb sulfoxide | 0.00027 | 3 | Disulfoton | 0.00013 | 2 | Picloram | 0.2 | 2 |
| alpha-HCH | 0.008 | 3 | Diuron | 0.003 | 2 | Prometon | 0.05 | 2 |
| Atrazine | 0.0019 | 2 | EPTC | 0.0025 | 2 | Pronamide | 0.027 | 2 |
| Azinphos-methyl | 0.00149 | 2 | Ethalfluralin | 0.04 | 2 | Propachlor | 0.054 | 2 |
| Benfluralin | 0.005 | 2 | Ethoprop | 0.0001 | 2 | Propanil | 0.009 | 2 |
| Bentazon | 0.03 | 2 | Fluometuron | 0.005 | 2 | Propargite | 0.04 | 2 |
| Bromacil | 0.1 | 2 | Fonofos | 0.002 | 2 | Propham | 0.02 | 1 |
| Bromoxynil | 0.015 | 2 | γ-HCH | 0.0003 | 1 | Propoxur | 0.005 | 2 |
| Butylate | 0.05 | 2 | Linuron | 0.0077 | 2 | Simazine | 0.0018 | 2 |
| Carbaryl | 0.01 | 2 | Malathion | 0.07 | 2 | Tebuthiuron | 0.07 | 2 |
| Carbofuran | 0.00006 | 2 | MCPA | 0.0044 | 2 | Terbacil | 0.013 | 2 |
| Chloramben methyl ester | 0.014 | 4 | MCPB | 0.015 | 2 | Terbufos | 0.00005 | 2 |
| Chlorothalonil | 0.02 | 2 | Methiocarb | 0.005 | 2 | Thiobencarb | 0.01 | 2 |
| Chlorpyrifos | 0.00003 | 2 | Methomyl | 0.008 | 2 | Triallate | 0.025 | 2 |
| cis-Permethrin | 0.25 | 2 | Metolachlor | 0.1 | 2 | Triclopyr | 0.05 | 2 |
| Clopyralid | 0.15 | 3 | Metribuzin | 0.013 | 2 | Trifluralin | 0.024 | 2 |
| Source Code from Table 1 | Source of toxicity data (PDj) |
|---|---|
| 1 | USEPA Integrated Risk Information System. http://cfpub.epa.gov/ncea/iris/index.cfm?fuseaction=iris.showSubstanceList. |
| 2 | USEPA Office of Pesticide Programs Pesticide Reregistration Status. http://www.epa.gov/opp00001/reregistration/status.htm |
| 3 | Regulations.gov. http://www.regulations.gov/#!home |
| 4 | http://www.consumersunion.org/pdf/fqpa/ReportCard_appendix1.pdf |
| 5 | Minnesota Department of Health. Health Risk Limits for Groundwater 2008 Rule Revision Health Risk Assessment Unit, Environmental Health Division. http://www.health.state.mn.us/divs/eh/risk/guidance/gw/cyanazine.pdf |
| 6 | Agency for Toxic Substances and Disease Registry. Toxicological Profiles http://www.atsdr.cdc.gov/ToxProfiles/tp1.pdf |
| 7 | USEPA Drinking Water Standards and Health Advisories Table. http://www.epa.gov/region9/water/drinking/files/DWSHATv09.pdf |
| Minimum Number | Maximum Number | Average Number | |
|---|---|---|---|
| Detected Chemicals | 5 | 29 | 9 |
| Non-Detects | 20 | 76 | 61 |
| Number of Chemicals Analyzed for in a Sample | 31 | 81 | 70 |
| HI Values for Samples | MCR Values for Samples | |||||
|---|---|---|---|---|---|---|
| Minimum | Maximum | Average | Minimum | Maximum | Average | |
| Case 1 | ||||||
| Non-Detects = 0 | 0.00001 | 57 | 0.14 | 1.0002 | 4.0 | 1.8 |
| Case 2 | ||||||
| Non-Detects = DL/20.5 | 0.014 | 57 | 0.19 | 1.001 | 7.5 | 4.0 |
| HI cutoff | HI < 1 | HI > 1 | ||||
|---|---|---|---|---|---|---|
| Statistics | Minimum | Maximum | Average | Minimum | Maximum | Average |
| Case 1 | 1.002 | 4.0 | 1.8 | 1.0002 | 3.1 | 1.3 |
| Case 2 | 1.024 | 7.5 | 4.1 | 1.0014 | 3.2 | 1.3 |
© 2011 by the authors; licensee MDPI, Basel, Switzerland. This article is an open-access article distributed under the terms and conditions of the Creative Commons Attribution license (http://creativecommons.org/licenses/by/3.0/).
Share and Cite
Price, P.S.; Han, X. Maximum Cumulative Ratio (MCR) as a Tool for Assessing the Value of Performing a Cumulative Risk Assessment. Int. J. Environ. Res. Public Health 2011, 8, 2212-2225. https://doi.org/10.3390/ijerph8062212
Price PS, Han X. Maximum Cumulative Ratio (MCR) as a Tool for Assessing the Value of Performing a Cumulative Risk Assessment. International Journal of Environmental Research and Public Health. 2011; 8(6):2212-2225. https://doi.org/10.3390/ijerph8062212
Chicago/Turabian StylePrice, Paul S., and Xianglu Han. 2011. "Maximum Cumulative Ratio (MCR) as a Tool for Assessing the Value of Performing a Cumulative Risk Assessment" International Journal of Environmental Research and Public Health 8, no. 6: 2212-2225. https://doi.org/10.3390/ijerph8062212