A Four-Step Method for Optimising the Normal Water Level of Reservoirs Based on a Mathematical Programming Model—A Case Study for the Songyuan Backwater Dam in Jilin Province, China

Abstract
:
1. Introduction
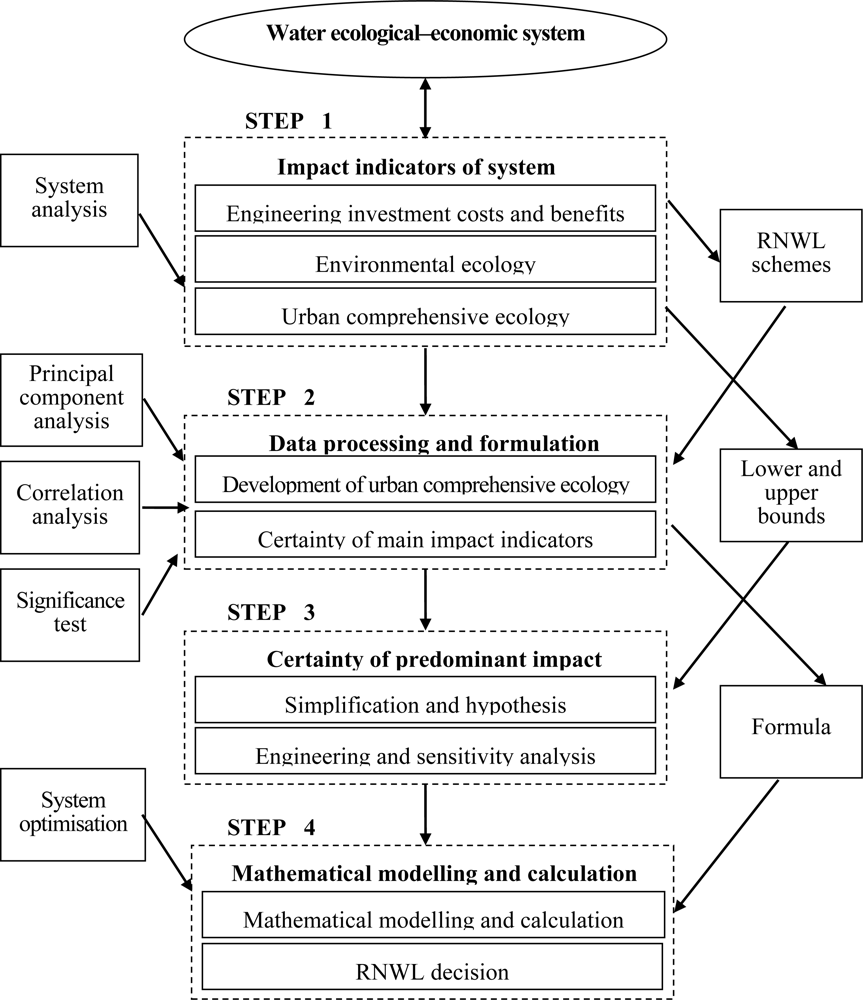
2. Methodology
- Project and environment impact analysis
- Raw classification. In this step, brainstorming, the consultation of experts, analytical hierarchy process, and other system analytical methods may be used based on the actual situation.
- Evaluation of raw classification. Reasonable classification is more convenient for mathematical modelling, although it is the first step of the methodology. In this section, the model framework of RNWL optimisation must be formed to evaluate the classification.
- Classification adjustment.
3. Application
3.1. Analysis of the Study System
3.2. Data Processing and Formulation
3.3. Certainty of Predominant Impact Indictors
- The operational period of Songyuan backwater dam is 40 years;
- 129.5 m is the minimum draw-down reservoir water level;
- The dam cross section is trapezoidal;
- Only the height of the dam changes under different RNWL in the interval [131.4, 132.1] m;
- Sewage treatment plants will not operate until the reservoir meets RNWL levels.
3.4. Mathematical Modelling and Calculations
- Urban landscape planning constraint:where Rmin and Rmax represent the lower and upper bounds of water surface occupancy (%).
- Maximal sediment volume constraint [16]:where S denotes sediment storage (t/a); Vwl is the mean corresponding capacity of RNWL (m3); Vrs is dead storage (m3); ρ is dry density (t/m3); We is the average water storage per year (m3/a).
- Reservoir water quality constraint [16]:where W0 is the rate of storage pollutants (g/s); Kh is the intermediate variable (s−1); ch is the chemical oxygen demand (COD)of the water (mg/L); t is uniformly mixed time (s); c0 is the average COD of the water for the years before the operation of the backwater dam (mg/L).
4. Results and Discussion
5. Conclusions
Acknowledgments
References
- World Commission on Dams. Dams and Development: A New Framework for Decision-Making; Earthscan Publications Ltd: London, UK, 2000. [Google Scholar]
- Western, D. Human-modified ecosystems and future evolution. Proceedings of the National Academy of Sciences Colloquium: The Future of Evolution, Irvine, CA, USA, 16– 20 March 2000; pp. 5458–5465.
- Han, SY; Kwak, SJ; Yoo, SH. Valuing environmental impacts of large dam construction in Korea: An application of choice experiments. Environ. Impact Assess. Rev 2007, 28, 256–266. [Google Scholar]
- Lu, JX. Grey layers analysis method of normal water level of the reservoir selection and its application. Hydroelectr. Energ 1999, 17, 48–52. [Google Scholar]
- Zhang, SB; Qu, WC. Optimization of reservoir normal water storage with ambiguous relation analysis method. J. Liaoning Normal Univ. (Natural Science) 1999, 22, 252–255. [Google Scholar]
- Zeng, YH; Jiang, TB; Quan, XZ. Application of grey system theory to selection of reservoir’s normal water level. Hydropower Autom. Dam Monit 2003, 27, 57–59. [Google Scholar]
- Jin, JL; Zhang, LB; Wei, YM. Objective weight based comprehensive evaluation method for water resource engineering schemes. J. Irrig. Drain 2004, 23, 5–9. [Google Scholar]
- Xie, QJ; Qian, ZL. Application of grey fuzzy comprehensive assessment in optimization of reservoir’s normal water level. Hydrosci. Eng 2006, 1, 59–62. [Google Scholar]
- Hou, BY. Application of multi-principle appraisal method in selection of NPL of hydropower plant. GX Water Resour. Hydropower Eng 2008, 4, 8–13. [Google Scholar]
- Calizaya, A; Meixner, O; Bengtsson, L. Multi-criteria decision analysis (MCDA) for integrated water resources management (IWRM) in the lake Poopo basin, Bolivia. Water Resour. Manag 2010, 24, 2267–2289. [Google Scholar]
- Chen, JW. The Ecocity-Oriented Evaluation Method for the Urban Ecosystem—the Case of Shanghai, Master Thesis, Tongji University, Shanghai, China. 2007.
- Jia, YZ; Hu, Y; Sun, SJ. A study on urban ecological benefit based on comprehensive ecological assessment index system. Sci. Tech. Eng 2010, 10, 8191–9195. [Google Scholar]
- Liu, DH; Li, N; Chao, Y. SPSS 150: Statistical Analysis from Beginner to the Master, 1st ed; Tsinghua University Press: Beijing, China, 2008; pp. 151–214. [Google Scholar]
- Li, SS; Gao, Q; Wang, XL; Li, Y. Using multiple regression adsorption model to estimate Zn and Cu adsorptions onto Fe oxides, Mn oxides, organic materials and their blends in surficial sediments. Fresenius Environ. Bull 2010, 19, 1466–1473. [Google Scholar]
- Zhao, XM. Experimental Design Method, 1st ed.; Science Press: Beijing, China, 2006; pp. 244–245. [Google Scholar]
- Zhu, DS; Zhou, YM; Zou, JX. Environmental Impact Assessment of Water Conservancy and Hydropower Projects, 1st ed.; Environmental Science Press: Beijing, China, 2006; pp. 57–122. [Google Scholar]

| Category | Potential impact indicators | |
|---|---|---|
| Engineering investment cost and benefits | Area of land submergence Engineering construction cost Power generation income Project immigrants Backwater length Special facilities Flood control project of reservoir downstream | |
| Environmental ecology | Water surface occupancy Sediment condition Water quality Water temperature Groundwater quality Downstream flow | |
| Urban comprehensive ecology | Social development indicators | Natural growth rate of population Population density The number of students at university or college per ten thousand people Life expectancy Urbanisation GDP proportion of investment in science and education Road area per capita Housing area per capita Hospital beds per ten thousand people Domestic water per capita Power consumption per capita Engel coefficient Insurance premiums per capita Unemployment rate Amount of book collection per ten thousand people Probability of occurrence of criminal cases |
| Ecological and environmental development indicators | Green area per capita Air humidity Standard emission rates of industrial wastewater Annual emissions of industrial COD Annual average of inhalable particulate matter Industrial SO2 emissions Industrial soot emissions Industrial dust emissions Average noise of main roads of the city Noise environment quality Comprehensive utilisation of industrial solid waste GDP proportion of investment in environmental protection City river runoff depth | |
| Economic development indicators | GDP per capita GDP annual growth rate GDP proportion of tertiary industry Urban-rural income ratio Investment results City tourism revenue | |
| Category | Step1 | Step 2 | Step3 |
|---|---|---|---|
| Impact indicators | Main indicators | Predominant indictors | |
| Engineering investment costs and benefits | Area of land submergence | • | ✓ |
| Engineering construction cost | • | ✓ | |
| Backwater length | • | ||
| Special facilities | |||
| Flood control project of reservoir downstream | |||
| Environmental ecology | Water surface occupancy | • | ✓ |
| Sand sediment volume | • | ✓ | |
| Water quality | • | ✓ | |
| Water temperature | • | ||
| Average runoff (×108 m3) | RNWL (m) | Total storage capacity (×108 m3) | α | Type | Remarks |
|---|---|---|---|---|---|
| 103.57 | 131.4 | 0.3365112 | 307.77 | mixed | If α < 10, hierarchical type; |
| 132.1 | 0.5060861 | 204.65 | mixed | If α > 20, transitional type; | |
| If 10 < α < 20, mixed type. |
| RNWL (m) | Investment ($106) | UCEI | Water surface occupancy (%) | Sediment volume (104 m3) | Water quality (mg/L) | |
|---|---|---|---|---|---|---|
| Engineering quantity cost | Compensation fee | |||||
| 131.40 | 1.75 | 9.00 | 0.895 | 40 | 653.363 | 6.378 |
| RNWL (m) | Investment ($106) | UCEI | Water surface occupancy (%) | Sediment volume (104 m3) | Water quality (mg/L) | |
|---|---|---|---|---|---|---|
| Engineering quantity cost | Compensation fee | |||||
| 131.5 m | 1.85 | 10.34 | 0.896 | 42 | 709.421 | 6.003 |
© 2011 by the authors; licensee MDPI, Basel, Switzerland. This article is an open-access article distributed under the terms and conditions of the Creative Commons Attribution license (http://creativecommons.org/licenses/by/3.0/).
Share and Cite
Sun, S.; Yan, X.; Cui, P.; Feng, J. A Four-Step Method for Optimising the Normal Water Level of Reservoirs Based on a Mathematical Programming Model—A Case Study for the Songyuan Backwater Dam in Jilin Province, China. Int. J. Environ. Res. Public Health 2011, 8, 1049-1060. https://doi.org/10.3390/ijerph8041049
Sun S, Yan X, Cui P, Feng J. A Four-Step Method for Optimising the Normal Water Level of Reservoirs Based on a Mathematical Programming Model—A Case Study for the Songyuan Backwater Dam in Jilin Province, China. International Journal of Environmental Research and Public Health. 2011; 8(4):1049-1060. https://doi.org/10.3390/ijerph8041049
Chicago/Turabian StyleSun, Shijun, Xiaofei Yan, Peng Cui, and Jiang Feng. 2011. "A Four-Step Method for Optimising the Normal Water Level of Reservoirs Based on a Mathematical Programming Model—A Case Study for the Songyuan Backwater Dam in Jilin Province, China" International Journal of Environmental Research and Public Health 8, no. 4: 1049-1060. https://doi.org/10.3390/ijerph8041049