Prospective Power Calculations for the Four Lab Study of A Multigenerational Reproductive/Developmental Toxicity Rodent Bioassay Using A Complex Mixture of Disinfection By-Products in the Low-Response Region

Abstract
:1. Introduction
2. Methods
2.1. Statistical Methods
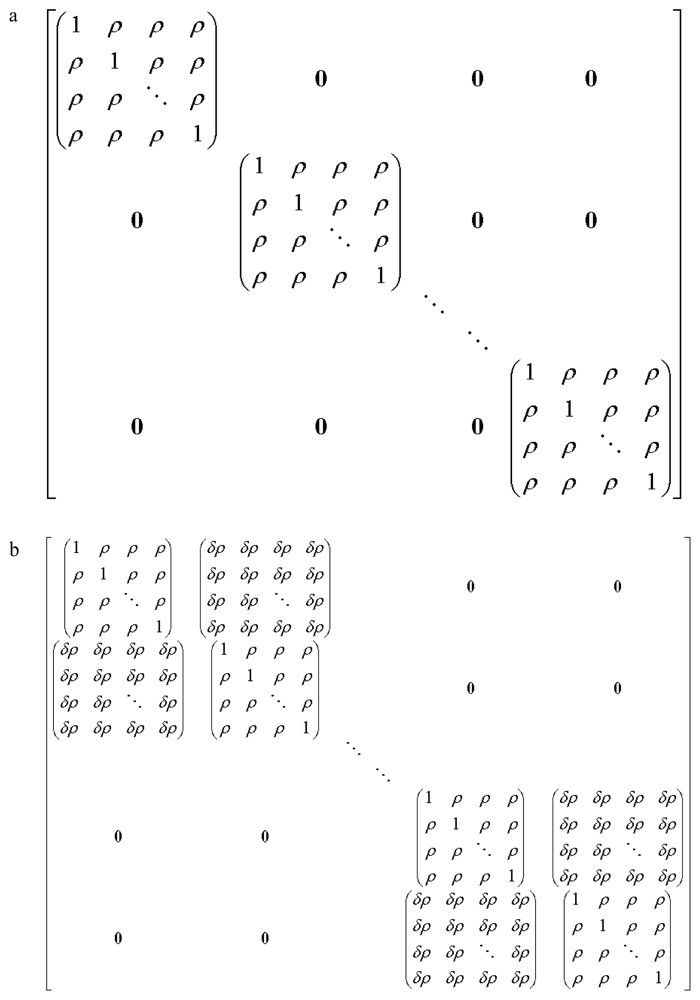
3. Model
3.1. Calculations and Assumptions
3.2. Initial Designs
Single-Block Design, One F1 Female per Litter
Single-Block Design, Two F1 Females per Litter
3.3. Final Design
Two-Block Design, with One F1 Female per Litter
4. Results
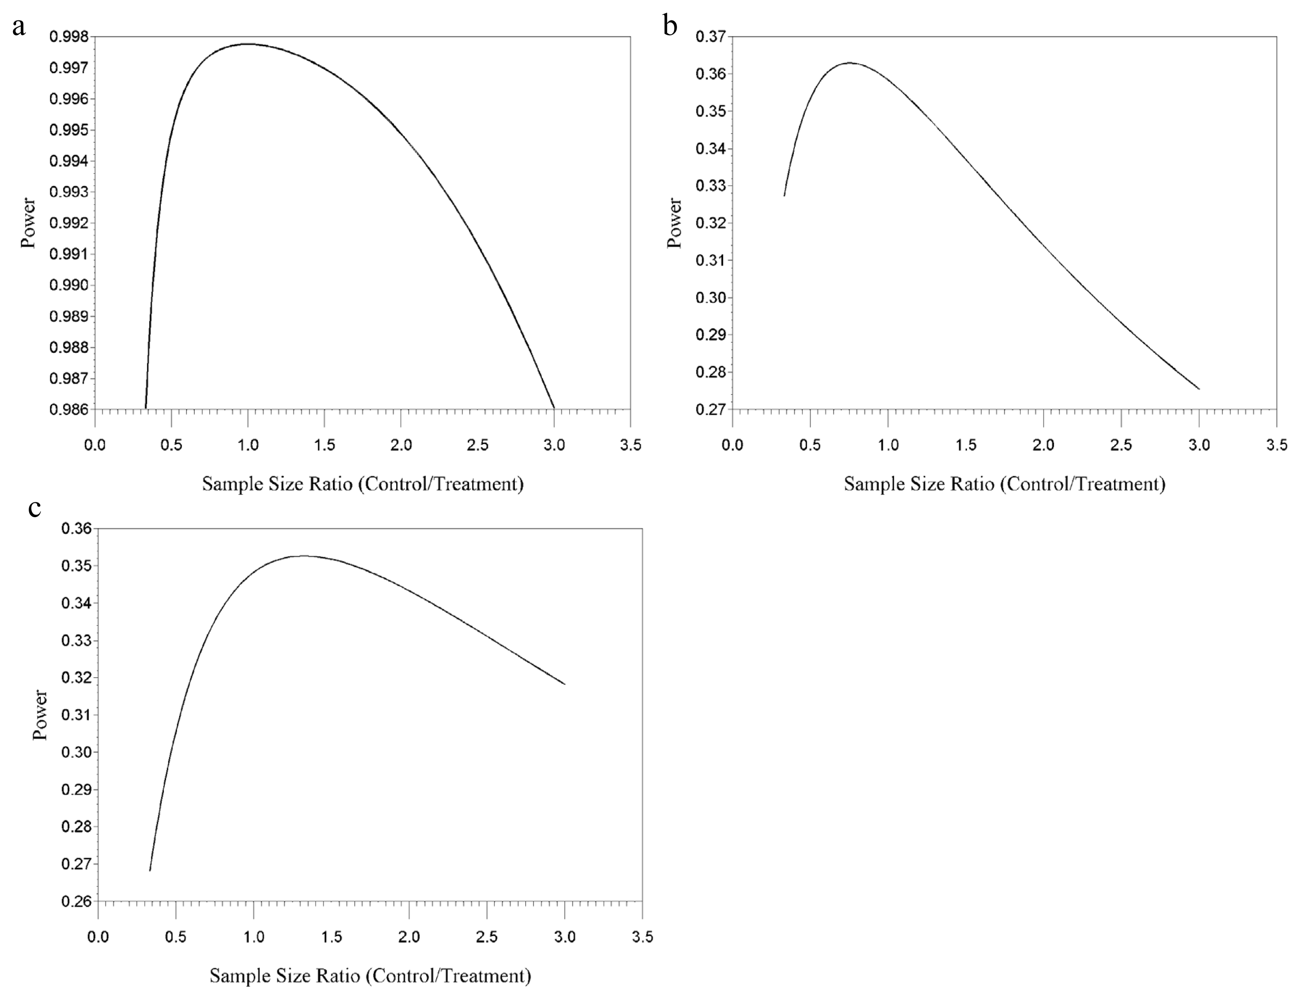
4.1. Single-Block Design, One F1 Female per Litter
4.2. Two-Block Design, One F1 Female per Litter
5. Discussion
Acknowledgments
- DisclaimerThis manuscript has been reviewed in accordance with the U.S. Environmental Protection Agency’s peer and administrative review policies and approved for publication. Approval does not signify that the contents necessarily reflect the views and policies of the Agency nor does mention of trade names constitute endorsement or recommendation for use.
References
- Teuschler, LK; Klaunig, J; Carney, E; Chambers, J; Conolly, R; Gennings, C; Giesy, J; Hertzberg, R; Klaassen, C; Kodell, R; et al. Support of science-based decisions concerning the evaluation of the toxicology of mixtures: A new beginning. Regul. Toxicol. Pharmacol 2002, 36, 34–39. [Google Scholar]
- Mason, AM; Borgert, CJ; Bus, JS; Moiz, MM; Simmons, JE; Sipes, IG. Improving the scientific foundation for mixtures joint toxicity and risk assessment: Contributions from the SOT mixtures project—Introduction. Toxicol. Appl. Pharmacol 2007, 223, 99–103. [Google Scholar]
- Teuschler, LK; Simmons, JE. Approaching the toxicity of disinfection by-products in drinking water as a mixtures problem. J. Am. Water Works Assoc 2003, 95, 131–138. [Google Scholar]
- Simmons, JE; Richardson, SD; Speth, TF; Miltner, RJ; Rice, G; Schenck, KM; Hunter, ES, III; Teuschler, LK. Development of a research strategy for integrated technologybased toxicological and chemical evaluation of complex mixtures of drinking water disinfection byproducts. Environ. Health Perspect 2002, 110, 1013–1024. [Google Scholar]
- Simmons, JE; Teuschler, LK; Gennings, C; Speth, TF; Richardson, SD; Miltner, RJ; Narotsky, MG; Schenck, KD; Hunter, ES, III; Hertzberg, RC; et al. Component-based and whole-mixture techniques for addressing the toxicity of drinking-water disinfection by-product mixtures. J Toxicol Environ Health A 2004, 67, 741–754. [Google Scholar]
- Richardson, SD. Drinking water disinfection byproducts. In The Encyclopedia of Environmental Analysis and Remediation; Meyers, RA, Ed.; John Wiley and Sons: New York, NY, USA, 1998; pp. 1398–1421. [Google Scholar]
- Krasner, SW; Weinberg, HS; Richardson, SD; Pastor, SJ; Chinn, R; Sclimenti, MJ; Onstad, GD; Thruston, AD, Jr. Occurrence of a new generation of disinfection byproducts. Environ. Sci. Technol 2006, 40, 7175–7185. [Google Scholar]
- Richardson, SD; Thruston, AD, Jr; Krasner, SW; Weinberg, HS; Miltner, RJ; Schenck, KM; Narotsky, MG; McKague, AB; Simmons, JE. Integrated disinfection byproducts mixtures research: Comprehensive characterization of water concentrates prepared from chlorinated and ozonated/postchlorinated drinking water. J. Toxicol. Environ Health A 2008, 71, 1165–1186. [Google Scholar]
- Gallagher, MD; Nuchols, JR; Stallones, L; Savitz, DA. Exposure to trihalomethanes and adverse pregnancy outcomes. Epidemiology 1998, 9, 484–489. [Google Scholar]
- Wright, JM; Schwartz, J; Dockery, DW. The effect of disinfection by-products and mutagenic activity on birth weight and gestational duration. Environ. Health Perspect 2004, 112, 920–925. [Google Scholar]
- Dodds, L; King, W; Allen, AC; Armson, BA; Fell, DB; Nimrod, C. Trihalomethanes in public water supplies and risk of stillbirth. Epidemiology 2004, 15, 179–186. [Google Scholar]
- Toledano, MB; Nieuwenhuijsen, MJ; Best, N; Whitaker, H; Hambly, P; de Hoogh, C; Fawell, J; Jarup, L; Elliott, P. Relation of trihalomethane concentrations in public water supplies to stillbirth and birth weight in three water regions in England. Environ. Health Perspect 2005, 113, 225–232. [Google Scholar]
- Waller, K; Swan, SH; DeLorenze, G; Hopkins, B. Trihalomethanes in drinking water and spontaneous abortion. Epidemiology 1998, 9, 134–140. [Google Scholar]
- Savitz, DA; Singer, PC; Hartmann, KE; Herring, AH; Weinberg, HS; Makarushka, C; Hoffman, C; Chan, R; Maclehose, R. Drinking Water Disinfection By-Products and Pregnancy Outcomes. Sponsored by the Microbial/Disinfection By-Products Research Council; AWWA Research Foundation: Denver, CO, USA, 2005. [Google Scholar]
- Kavlock, R; Chernoff, N; Carver, B; Kopfler, F. Teratology studies in mice exposed to municipal drinking-water concentrates during organogenesis. Food Cosmet. Toxicol 1979, 17, 343–347. [Google Scholar]
- Klinefelter, GR; Hunter, ES; Narotsky, M. Reproductive and developmental toxicity associated with disinfection by-products of drinking water. In Microbial Pathogens and Disinfection By-Products of Drinking Water; ILSI Press: Washington, DC, USA, 2001; pp. 309–333. [Google Scholar]
- Klinefelter, GR; Strader, LF; Suarez, JD; Roberts, NL; Goldman, JM; Murr, AS. Continuous exposure to dibromoacetic acid delays pubertal development and compromises sperm quality in the rat. Toxicol. Sci 2004, 81, 419–429. [Google Scholar]
- Environmental Protection Agency (U.S. EPA), The Feasibility of Performing Cumulative Risk Assessments for Mixtures of Disinfection By-Products in Drinking Water, EPA/600/R-03/051; National Center for Environmental Assessment: Cincinnati, OH, USA, 2003.
- Colman, J; Rice, G; Wright, JM; Hunter, ES, III; Teuschler, LK; Lipscomb, JC; Hertzberg, RC; Simmons, JE; Fransen, M; Osier, M; et al. Mode of action identification for developmental toxicity of drinking water disinfection byproducts. Toxicol Appl Pharmacol 2011, in press. [Google Scholar]
- Simmons, JE; Richardson, SD; Teuschler, LK; Miltner, RJ; Speth, TF; Schenck, KM; Hunter, ES, III; Rice, G. Research issues underlying the four-lab study: Integrated disinfection by-products mixtures research. J. Toxicol. Environ Health A 2008, 71, 1125–1132. [Google Scholar]
- Claxton, LD; Pegram, RA; Schenck, KM; Simmons, JE; Warren, SH. Integrated disinfection byproducts mixtures research: Salmonella mutagenicity of water concentrates disinfected by chlorination and ozonation/postchlorination. J. Toxicol. Environ. Health A 2008, 71, 1187–1194. [Google Scholar]
- Crosby, LM; Simmons, JE; Ward, WO; Moore, TM; Morgan, KT; Deangelo, AB. Integrated disinfection by-products (DBP) mixtures research: Gene expression alterations in primary rat hepatocyte cultures exposed to DBP mixtures formed by chlorination and ozonation/postchlorination. J. Toxicol. Environ. Health A 2008, 71, 1195–1215. [Google Scholar]
- Miltner, RJ; Speth, TF; Richardson, SD; Krasner, SW; Weinberg, HS; Simmons, JE. Integrated disinfection byproducts mixtures research: Disinfection of drinking waters by chlorination and ozonation/postchlorination treatment scenarios. J. Toxicol. Environ. Health A 2008, 71, 1133–1148. [Google Scholar]
- Narotsky, MG; Best, DS; Rogers, EH; McDonald, A; Sey, YM; Simmons, JE. Integrated disinfection byproducts mixtures research: Assessment of developmental toxicity in Sprague-Dawley rats exposed to concentrates of water disinfected by chlorination and ozonation/postchlorination. J. Toxicol. Environ. Health A 2008, 71, 1216–1221. [Google Scholar]
- Speth, TF; Miltner, RJ; Richardson, SD; Simmons, JE. Integrated disinfection byproducts (DBPs) mixtures research: Concentration by reverse osmosis membrane techniques of DBPs from water disinfected by chlorination and ozonation/postchlorination. J. Toxicol. Environ. Health A 2008, 71, 1149–1164. [Google Scholar]
- Rice, G; Teuschler, LK; Speth, TF; Richardson, SD; Miltner, RJ; Schenck, K; Gennings, C; Hunter, ES, III; Narotsky, MG; Simmons, JE. Integrated disinfection by-products research: Assessing reproductive and developmental risks posed by complex disinfection by-product mixtures. J. Toxicol. Environ Health A 2008, 71, 1222–1234. [Google Scholar]
- Narotsky, MG; Pressman, JG; Miltner, RJ; Speth, TF; Teuschler, LK; Rice, GE; Richardson, SD; Best, DS; McDonald, A; Hunter, ES; et al. Gestational and lactational effects in rats of sodium, sulfate, and concentrated disinfection by-products in drinking water. 47th Annual Meeting of the Teratology Society, Pittsburgh, PA, USA, 23–28 June 2007.
- Rice, GE; Teuschler, LK; Bull, RJ; Simmons, JE; Feder, PI. Evaluating the similarity of complex drinking water disinfection by-product mixtures: Overview of the issues. J. Toxicol. Environ. Health A 2009, 72, 429–436. [Google Scholar]
- Pressman, JG; Richardson, SD; Speth, TF; Miltner, RJ; Narotsky, MG; Hunter, ES, III; Rice, GE; Teuschler, LK; McDonald, A; Parvez, S; et al. Concentration, chlorination, and chemical analysis of drinking water for disinfection byproduct mixtures health effects research: US EPA’s Four Lab Study. Environ Sci Technol 2010, 44, 7184–7192. [Google Scholar]
- Environmental Protection Agency (U.S. EPA), Health Effects Test Guidelines OPPTS 870.3800 Reproduction and Fertility Effects, EPA/712–C–96/208; Office of Prevention, Pesticides and Toxic Substances: Washington, DC, USA, 1996.
- Rochon, J. Application of GEE procedures for sample size calculations in repeated measures experiments. Stat. Med 1998, 17, 1643–1658. [Google Scholar]
- Cooper, RL. Current developments in reproductive toxicity testing of pesticides. Reprod. Toxicol 2009, 28, 180–187. [Google Scholar]
- Hotchkiss, AK; Rider, CV; Blystone, CR; Wilson, VS; Hartig, PC; Ankley, GT; Foster, PM; Gray, CL; Gray, LE. Fifteen years after “Wingspread”—Environmental endocrine disrupters and human and wildlife health: Where we are today and where we need to go. Toxicol. Sci 2008, 105, 235–259. [Google Scholar]
- Chernoff, N; Rogers, E; Carver, B; Kavlock, R; Gray, E. The fetotoxic potential of municipal drinking water in the mouse. Teratology 1979, 19, 165–169. [Google Scholar]
- Uriu-Hare, JY; Swan, SH; Bui, LM; Neutra, RR; Keen, CL. Drinking water source and reproductive outcomes in Sprague-Dawley rats. Reprod. Toxicol 1995, 9, 549–561. [Google Scholar]
- Environmental Protection Agency (U.S. EPA), Guidelines for Developmental Toxicity Risk Assessment, EPA/600/FR-91/001; Risk Assessment Forum: Washington, DC, USA, 1991.
- Hack, M; Klein, NK; Taylor, HG. Long-term developmental outcomes of low birth weight infants. Future Child 1995, 5, 176–196. [Google Scholar]
- Kramer, MA. The epidemiology of adverse pregnancy outcomes: An overview. J. Nutr 2003, 133, S1592–S1596. [Google Scholar]
- Simmons, JE. Chemical mixtures: Challenge for toxicology and risk assessment. Toxicology 1995, 105, 111–119. [Google Scholar]


| Control | Treated | |
|---|---|---|
| No. dams | 36 | 35 |
| No. live litters | 36 | 35 |
| Mean ± S.E. per litter | ||
| No. implantation sites | 13.1 ± 0.3 | 13.4 ± 0.4 |
| No. live pups | 12.1 ± 0.4 | 11.3 ± 0.6 |
| Prenatal loss (%) | 7.8 ± 1.5 | 14.9 ± 3.8 |
| Pup weight (g) | 6.5 ± 0.1 | 5.9 ± 0.1a |
| Mean Power | Median Power | ||||
|---|---|---|---|---|---|
| Block effect variance, σ2τ | Interaction effect variance, σ2βτ | 12 live pups/litter | 15 live pups/litter | 12 live pups/litter | 15 live pups/litter |
| 0.00 | 0.00 | 1.00 | 1.00 | 1.00 | 1.00 |
| 0.05 | 0.00 | 1.00 | 1.00 | 1.00 | 1.00 |
| 0.5 | 0.00 | 1.00 | 1.00 | 1.00 | 1.00 |
| 1.0 | 0.00 | 1.00 | 1.00 | 1.00 | 1.00 |
| 0.05 | 0.05 | 1.00 | 1.00 | 1.00 | 1.00 |
| 0.05 | 0.5 | 0.84 | 0.84 | 1.00 | 1.00 |
| 0.05 | 1.0 | 0.86 | 0.86 | 1.00 | 1.00 |
| 0.5 | 0.05 | 1.00 | 1.00 | 1.00 | 1.00 |
| 0.5 | 0.5 | 0.86 | 0.86 | 1.00 | 1.00 |
| 0.5 | 1.0 | 0.91 | 0.91 | 1.00 | 1.00 |
| 1.0 | 0.05 | 1.00 | 1.00 | 1.00 | 1.00 |
| 1.0 | 0.5 | 0.85 | 0.86 | 1.00 | 1.00 |
| 1.0 | 1.0 | 0.89 | 0.89 | 1.00 | 1.00 |
| Mean Power | Median Power | ||||
|---|---|---|---|---|---|
| Block effect variance, σ2τ | Interaction effect variance, σ2βτ | 13 implants/dam | 16 implants/dam | 13 implants/dam | 16 implants/dam |
| 0.00 | 0.00 | 0.57 | 0.53 | 0.57 | 0.53 |
| 0.001 | 0.00 | 0.57 | 0.53 | 0.57 | 0.53 |
| 0.01 | 0.00 | 0.57 | 0.53 | 0.57 | 0.53 |
| 0.025 | 0.00 | 0.58 | 0.54 | 0.57 | 0.53 |
| 0.001 | 0.001 | 0.57 | 0.53 | 0.57 | 0.53 |
| 0.001 | 0.01 | 0.57 | 0.53 | 0.57 | 0.53 |
| 0.001 | 0.025 | 0.57 | 0.54 | 0.58 | 0.54 |
| 0.01 | 0.001 | 0.57 | 0.53 | 0.57 | 0.53 |
| 0.01 | 0.01 | 0.57 | 0.54 | 0.57 | 0.53 |
| 0.01 | 0.025 | 0.57 | 0.54 | 0.57 | 0.53 |
| 0.025 | 0.001 | 0.58 | 0.54 | 0.57 | 0.53 |
| 0.025 | 0.01 | 0.58 | 0.54 | 0.57 | 0.53 |
| 0.025 | 0.025 | 0.57 | 0.54 | 0.57 | 0.53 |
| Mean Power | Median Power | ||||
|---|---|---|---|---|---|
| Block effect variance, σ2τ | Interaction effect variance, σ2βτ | 13 implants/dam | 16 implants/dam | 13 implants/dam | 16 implants/dam |
| 0.00 | 0.00 | 0.52 | 0.48 | 0.52 | 0.48 |
| 0.001 | 0.00 | 0.52 | 0.48 | 0.52 | 0.48 |
| 0.01 | 0.00 | 0.52 | 0.48 | 0.52 | 0.48 |
| 0.025 | 0.00 | 0.52 | 0.48 | 0.52 | 0.48 |
| 0.001 | 0.001 | 0.52 | 0.48 | 0.52 | 0.48 |
| 0.001 | 0.01 | 0.53 | 0.49 | 0.53 | 0.49 |
| 0.001 | 0.025 | 0.54 | 0.50 | 0.54 | 0.51 |
| 0.01 | 0.001 | 0.52 | 0.48 | 0.52 | 0.48 |
| 0.01 | 0.01 | 0.51 | 0.48 | 0.51 | 0.48 |
| 0.01 | 0.025 | 0.51 | 0.47 | 0.51 | 0.49 |
| 0.025 | 0.001 | 0.52 | 0.48 | 0.52 | 0.48 |
| 0.025 | 0.01 | 0.52 | 0.49 | 0.52 | 0.48 |
| 0.025 | 0.025 | 0.51 | 0.48 | 0.51 | 0.48 |
© 2011 by the authors; licensee MDPI, Basel, Switzerland This article is an open-access article distributed under the terms and conditions of the Creative Commons Attribution license (http://creativecommons.org/licenses/by/3.0/).
Share and Cite
Dingus, C.A.; Teuschler, L.K.; Rice, G.E.; Simmons, J.E.; Narotsky, M.G. Prospective Power Calculations for the Four Lab Study of A Multigenerational Reproductive/Developmental Toxicity Rodent Bioassay Using A Complex Mixture of Disinfection By-Products in the Low-Response Region. Int. J. Environ. Res. Public Health 2011, 8, 4082-4101. https://doi.org/10.3390/ijerph8104082
Dingus CA, Teuschler LK, Rice GE, Simmons JE, Narotsky MG. Prospective Power Calculations for the Four Lab Study of A Multigenerational Reproductive/Developmental Toxicity Rodent Bioassay Using A Complex Mixture of Disinfection By-Products in the Low-Response Region. International Journal of Environmental Research and Public Health. 2011; 8(10):4082-4101. https://doi.org/10.3390/ijerph8104082
Chicago/Turabian StyleDingus, Cheryl A., Linda K. Teuschler, Glenn E. Rice, Jane Ellen Simmons, and Michael G. Narotsky. 2011. "Prospective Power Calculations for the Four Lab Study of A Multigenerational Reproductive/Developmental Toxicity Rodent Bioassay Using A Complex Mixture of Disinfection By-Products in the Low-Response Region" International Journal of Environmental Research and Public Health 8, no. 10: 4082-4101. https://doi.org/10.3390/ijerph8104082