Environmental Modeling, Technology, and Communication for Land Falling Tropical Cyclone/Hurricane Prediction


Abstract
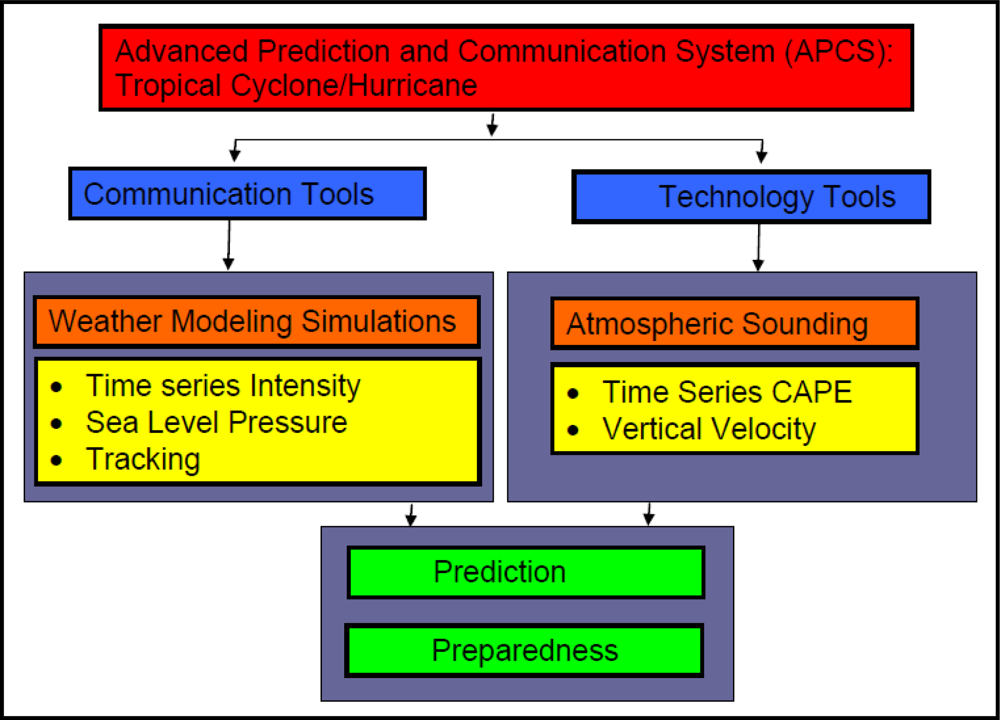
:1. Introduction
2. Experimental Section
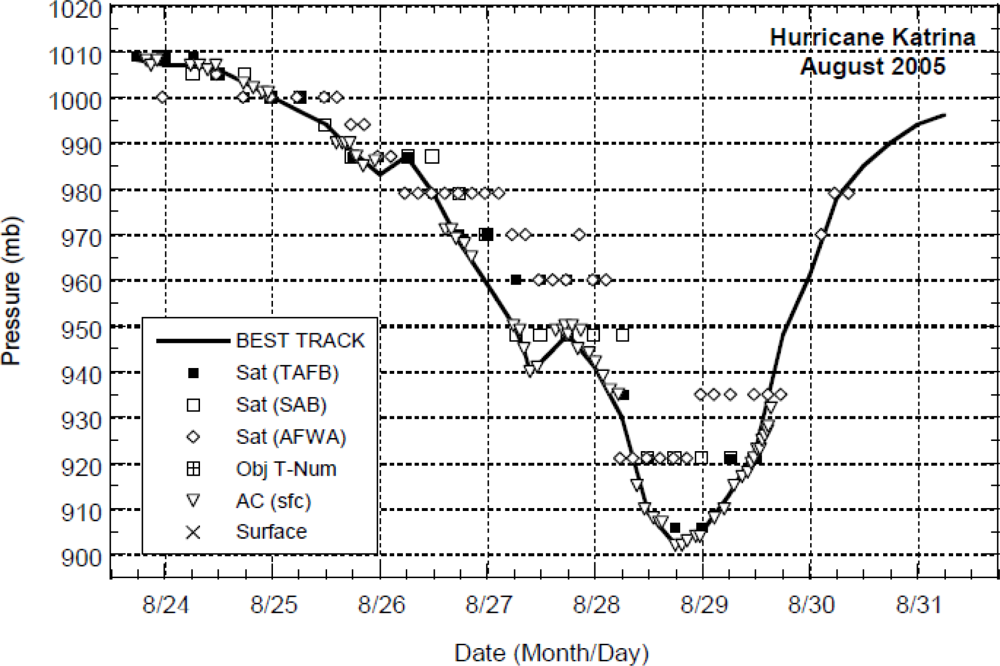
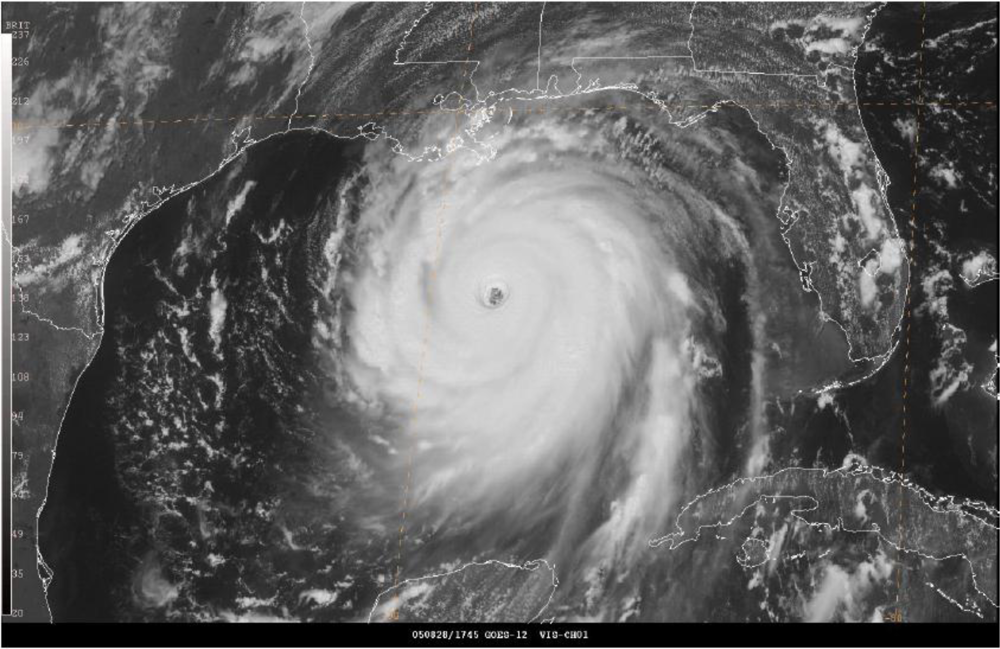
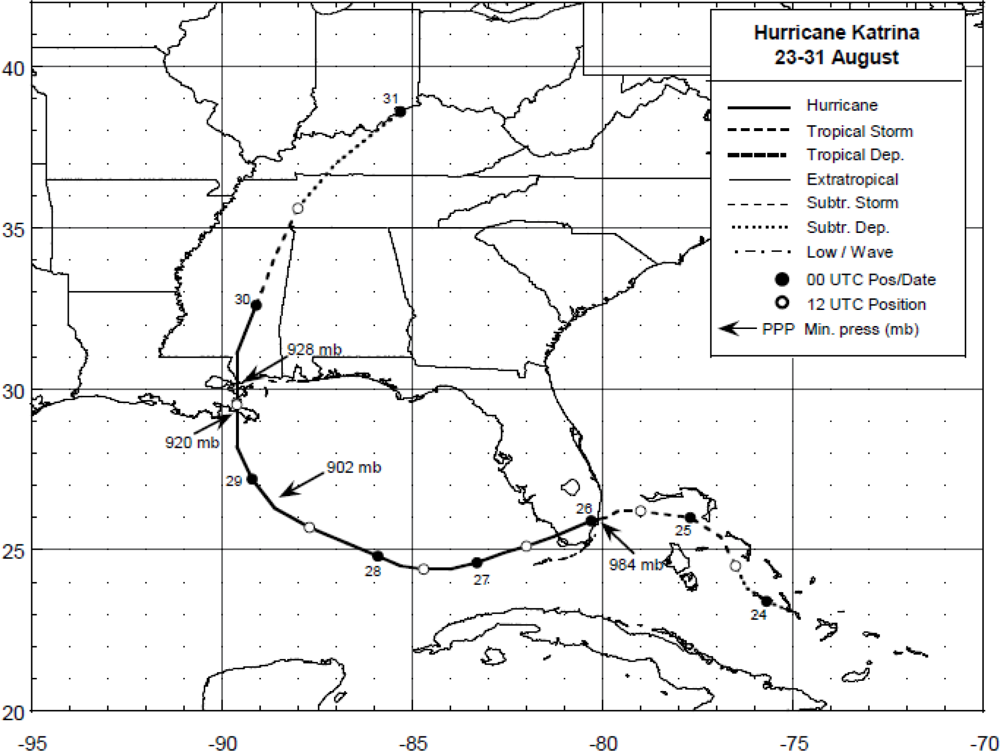
2.1. History of Hurricane Katrina
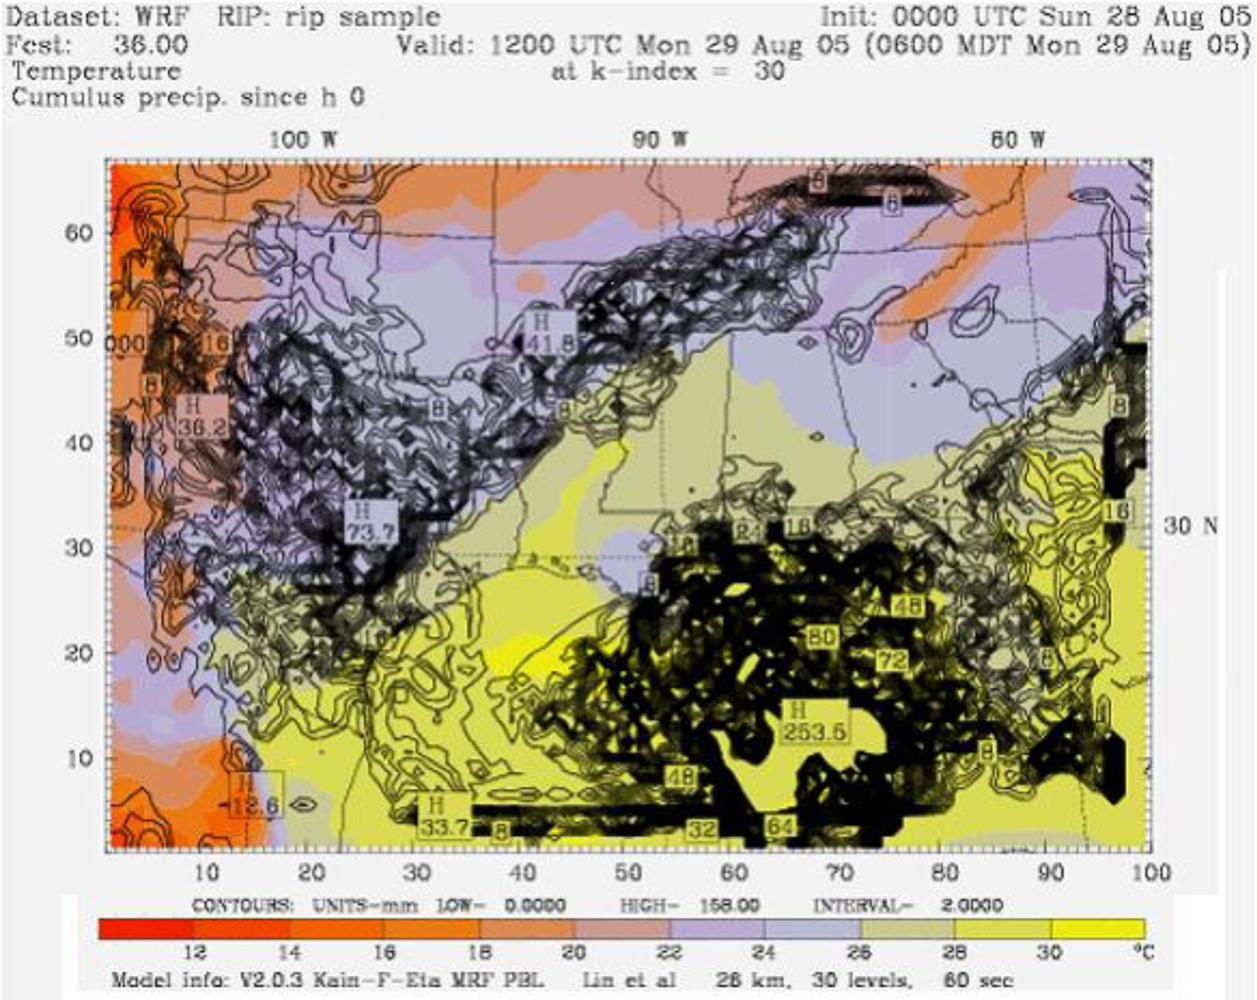
2.2. Mesoscale Modeling
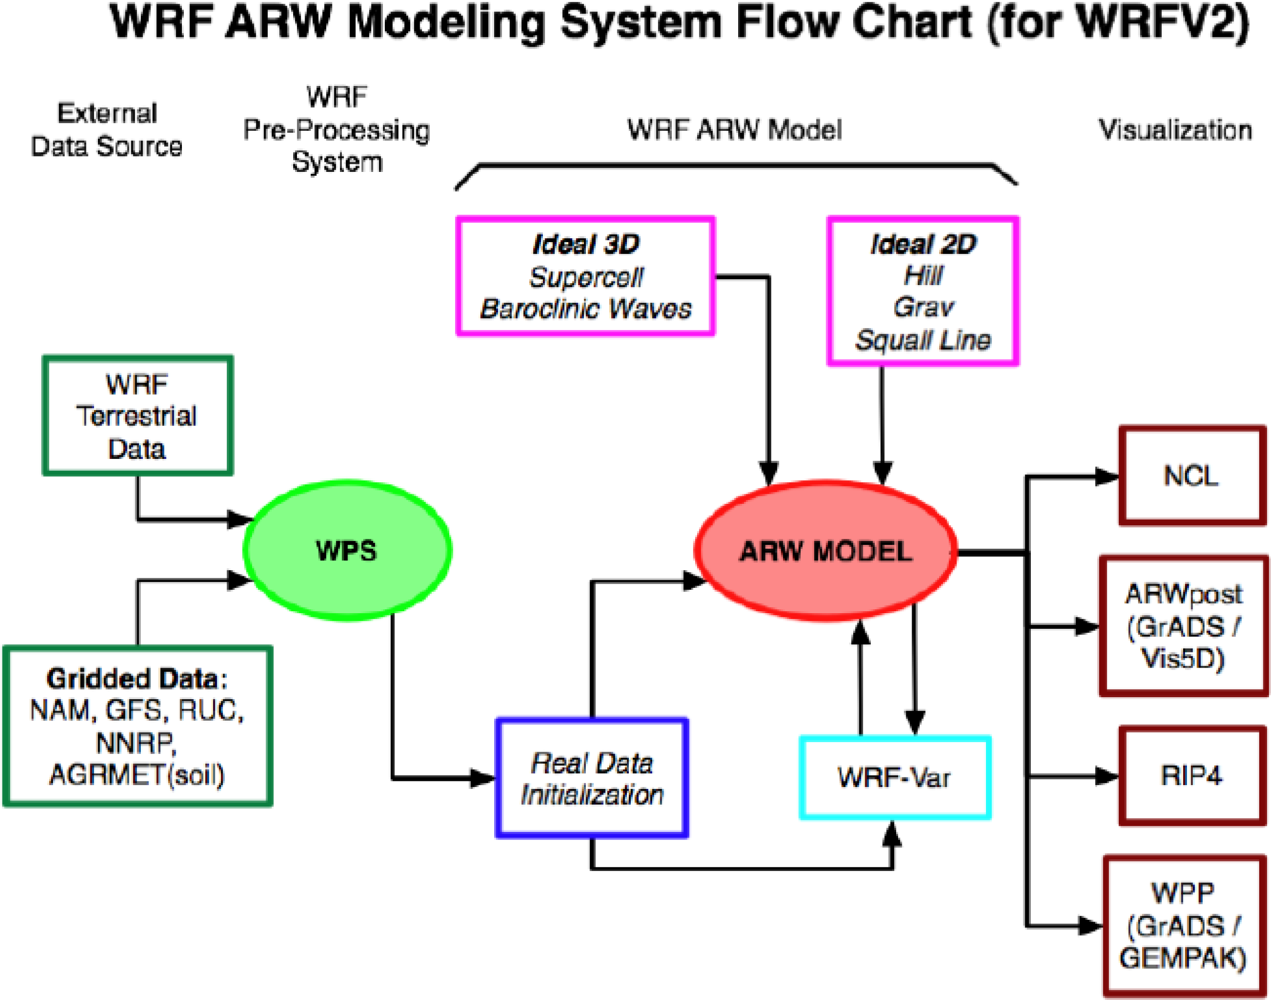
2.2.1. Description of the flow chart
- WPS: The WPS program is used primarily for real-data simulations. Its major functions include: (1) defining simulation domains; (2) interpolating terrestrial data (such as terrain, landuse, and soil types) to the simulation domain; and (3) degribbing and interpolating meteorological data from another model to this simulation domain. WPS takes the WRF terrestrial data/Gridded data as the input, and its output goes to the real data initialization.
- WRF-Var: The WRF-Var program is used to ingest observations into the interpolated analyses created by WPS. It can also be used to update WRF model's initial condition when WRF model is run in cycling mode. This program is optional, and is not used in the present work.
- ARW Solver: The unit is the key component in the modeling system, and is composed of several initialization programs for idealized, and real-data simulations, and the numerical integration program. ARW Model Solver takes the input from the initialization unit, and the model output is given to the visualization program. The model is fully compressible nonhydrostatic equations with hydrostatic option on a staggered Arakawa C grid. The wind components u, v, and w are recorded at the respective cell interfaces. The vertical velocity coordinate is a terrain following hydrostatic pressure coordinate. The solver uses the Runge-Kutta 3rd order time integration scheme and 5th order advection options along horizontal direction and the 3rd order in vertical direction. The other key features of the WRF model include:
- complete coriolis and curvature terms
- two-way nesting with multiple nests and nest levels
- map-scale factors for conformal projections:
- ○ polar stereographic
- ○ Lambert-conformal
- ○ Mercator
- time-split small step for acoustic and gravity-wave modes:
- ○ small step horizontally explicit, vertically implicit
- ○ divergence damping option and vertical time off-centering
- ○ external-mode filtering option
- lateral boundary conditions
- ○ idealized cases: periodic, symmetric, and open radiative
- ○ real cases: specified with relaxation zone
- full physics options for land-surface, PBL, radiation, microphysics and cumulus parameterization
- grid analysis nudging and observation nudging
- Graphics Tools: Several programs are supported, including RIP4 (based on NCAR Graphics), NCAR Graphics Command Language (NCL), and conversion programs for other readily available graphics packages: GrADS and Vis5D. Graphic Tools facilitate visualization of the model output and we have used GrADS in the present work. The details of these programs are described in the chapters of the user’s guide [12].
2.2.2. ARW model configuration
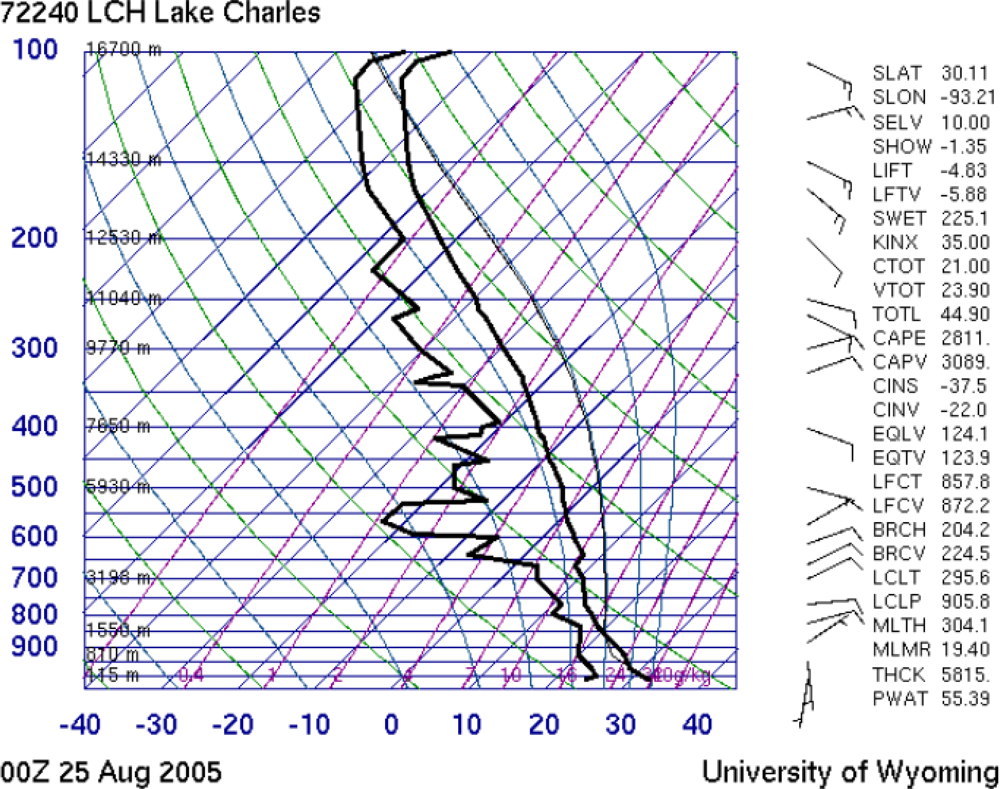
2.3. Atmospheric Sounding and CAPE
| Tenvi | temperature of the environment |
| g | acceleration due to gravity, |
| dz | differential vertical height |
| el | equilibrium level |
| lcl | level of condensation |
3. Results and Discussion
4. Conclusions
Acknowledgments
References
- Powell, MD; Aberson, SD. Accuracy of the United States Tropical Cyclone Landfall Forecasts in the Atlantic Basin (1976–2000). B. Am. Meteorol. Soc 2001, 82, 2749–2769. [Google Scholar]
- Reddy, RS; Guyton, R; Miller, RL. A Study of Air-Sea Interactions, Hurricane Predictive Index (HPI) and 1995 Hurricane Activity over the Gulf of Mexico. Proceedings of the 23rd Conference on Hurricanes and Tropical Meteorology, Dallas, TX, USA, January 1999.
- Giordani, H; Caniaux, G. Sensitivity of Cyclogenesis to Sea Surface Temperature in the Northwestern Atlantic. Mon. Weather Rev 2001, 129, 1273–1295. [Google Scholar]
- Holton, RJ. An Introduction to Dynamic Meteorology, 3rd ed; Academic Press: New York, NY, USA, 1992; pp. 291–297. [Google Scholar]
- Stull, R. Meteorology for Scientists and Engineers, 2nd ed; Brooks/Cole: Pacific Grove, CA, USA, 2000; pp. 290–295. [Google Scholar]
- Persing, J; Montgomery, MT. Is Environmental CAPE Important in the Determination of Maximum Possible Hurricane Intensity. J. Atmos. Sci 2004, 62, 542–550. [Google Scholar]
- Litta, AJ; Mohankumar, K. Simulation of Vertical Structure and Dynamics of Thunderstorm over Cochin using MM5 Mesocale Model—A Case Study. Vaymmandal 2007, 51–57. [Google Scholar]
- Greene, K; Hossain, L; Reddy, R. A study of Vertical Motion and Assocated Thunderstorms Activity over the West Coast of Gulf of Mexico. In Proceedings of NCUR; University of Rochester: New York, NY, USA, April 8–10 1999; pp. 1294–1298. [Google Scholar]
- National Hurricane Center, NOAA. “Tropical Cyclone Report – Hurricane Katrina,” National Weather Service.
- National Hurricane Center, NOAA. Hurricane KATRINA Advisory Archive.
- Skamarock, WC; Klemp, JB; Dudhia, J; Gill, DO; Barker, DM; Duda, MG; Huang, X; Wang, W; Powers, JG. A Description of the Advanced Research WRF Version 3; , NCAR Technical Note, NCAR/TN–475+STR, Boulder, CO, USA, June 2008. [Google Scholar]
- User’s Guide for the Advanced Research WRF (ARW) Modeling System Version 3.1.
- UCAR Website.
- Schultz, P. An Explicit Cloud Physics Parameterziaton for Operational Numerical Weathere Prediction. Mon. Weather Rev. USA 1995, 123, 3331–3343. [Google Scholar]
- Grell, GA. Prognostic Evaluation of Assumptions Used by Cumulus Parametrizaions. Mon. Weather Rev. USA 1993, 121, 764–787. [Google Scholar]
- Kain, JS; Fritsch, JM. The Representation of Cumulus Convection in Numerical Models, Meteor. Monger. Amer. Meteorol. Soc 1993, 46, 165–177. [Google Scholar]
- Mlawer, EJ; Taubman, SJ; Brown, PD; Iacono, MJ; Clough, SA. Radiative Transfer for Inhomogeneous Atmosphere: RRTM, a Validated Correlated-k Model for the Longwave. J. Geophys. Res 1997, 102, 16663–16682. [Google Scholar]
- Dudhia, J. Numerical Study of Convection Observed during the Winter Montsoon Experiment Using a Mesoscale Two Dimensional Model. J. Atm. Sci 1989, 46, 3077–3107. [Google Scholar]
- Krishnamurti, TN; Han, W; Jha, B; Bedi, HS. Numerical Prediction of Hurricane Opal. Mon. Weather Rev 1998, 126, 1347–1363. [Google Scholar]
- Hong, SY; Dudhia, J; Chen, SH. A Revised Approach to Ice Microphysical processes for the Bulk Parameterization of Clouds and Precipitation. Mon. Weather Rev 2004, 132, 103–120. [Google Scholar]
- Dudhia, J. A Multi-Layer Soil Temperature Model for MM5. Preprints, Sixth PSU/NCAR Mesonet Model Users’ Workshop, Boulder, CO, USA, July 22–24, 1996; pp. 49–50.
- Zhang, D; Anthes, RA. A Highresolution Model of the Planetary Boundary Layer—Sensitivity Tests and Comparisons with SESAME-79 data. J. Appl. Meteor 1982, 21, 1594–1607. [Google Scholar]
- University of Wyoming, Department of Atmospheric Sciences. Atmospheric Soundings.
- Greene, KL; Reddy, RS. A study of vertical motions and associated thunderstorm activity during the landfall of tropical depression over the Gulf of Mexico. In Proceedings of National Council for Undergraduate Research (NCUR); University of Rochester: New York, NY, USA, April 8–10 1999; pp. 1299–1303. [Google Scholar]
- Reddy, RS; Schwartz, A; Vatti, M. Simulation of landfalling hurricane Isidore over the Gulf of Mexico region using Weather Research and Forecasting model. Proceedings of 84th Annual American Meteorological Conference—20th Conference on Weather Analysis and Forecasting/16th Conference on Numerical Weather Prediction, Seattle, WA, USA, January 10–16, 2004.
- Lou, Y; Zhang, DL; Yau, MK. A Multiscale Numerical Study of Hurricane Andrew (1992). Part I: Explicit simulation and verification. Mon. Weather Rev 1997, 125, 3073–3093. [Google Scholar]
- Lu, D; White, L; Reddy, RS; Croft, P; Medlin, J. Numerical Simulation of Sea and Bay Breeze in a Weak Shear Environment. Meteor. Atmos. Physics 2006, 94, 153–165. [Google Scholar]
- Johnny, CL; Chan, YD; Shay, LK. Tropical Cyclone Intensity Change from a Simple Ocean-Atmosphere Coupled Model. J. Atmos. Sci 2001, 58, 154–172. [Google Scholar]
- Wu, C; Kuo, Y. Typhoons Affecting Taiwan: Current Understanding and Future Challenges. Amer. Meteorol. Soc 1999, 80, 67–80. [Google Scholar]
- Reddy, RS. Mesoscale Modeling Investigation of Air-sea Interactions over Gulf of Mexico for a Case Study of Hurricane Gordon. Twelfth PSU/NCAR Mesoscale Model Users’ Workshop, Boulder, CO, USA, June 24–25, 2002.
- Tuluri, F; Reddy, RS; Anjaneyulu, Y; Tchounwou, P. Environmental Modeling and Technology for Land Falling Tropical Cyclone/Hurricane Prediction and Communication. Fifth International Symposium on Recent Advances in Environmental Health Research, Jackson, MS, USA, September 14–17, 2008.


| Dynamics of Vertical Resolution | Primitive equation, no-hydrostatic 35 levels | |
|---|---|---|
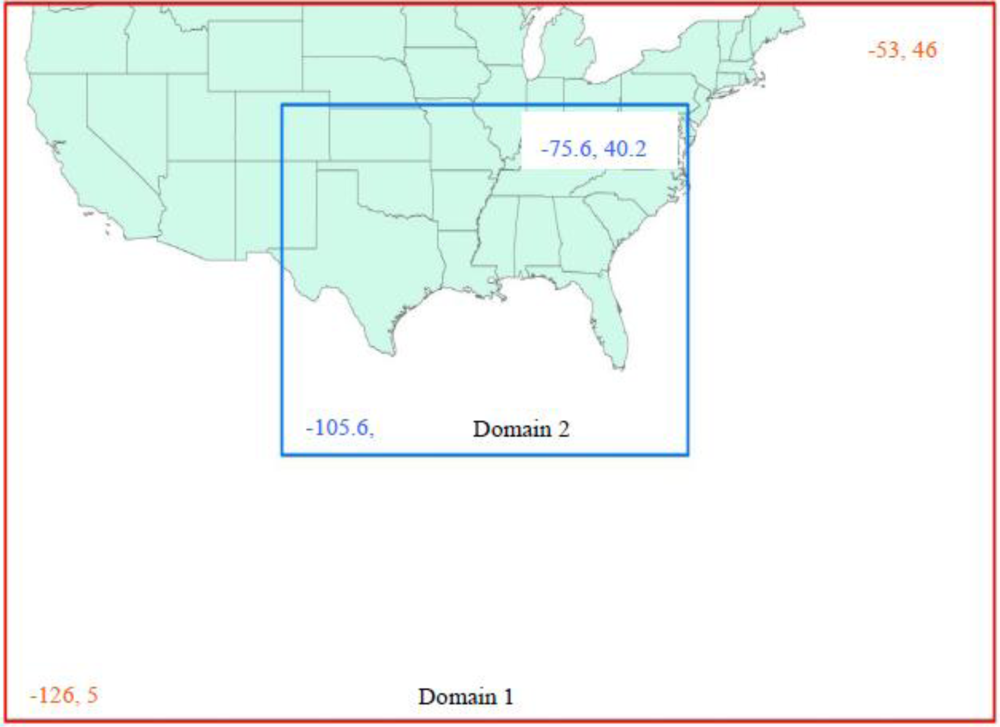
| Domains | Domain 1 | Domain 2 |
| Horizontal Resolution | 90 km | 30 km |
| Grid Points | 81 × 47 | 100 × 67 |
| Domains of integration | 126–W 53 W | 105.6 W–75.6 W |
| 5 N–46 N | 20.2 N–40.2 N | |
| Initialization | NCEP Global analysis data; 2 way | |
| Radiation | Dudhia [18] scheme for short wave radiation, Rapid radiative transfer model (RRTM) for long wave radiation [17] | |
| Surface Processes | 5 layer soil diffusion scheme [21] | |
| Boundary Layer | Blackadar Planetory Boundary Layer Parameterization [22] | |
| Radiation Scheme | Cloud-resolving radiation, | |
| Cumulus Scheme | Grell cumulus parameterization [15,16] | |
| Explicit Scheme | Simple ice mixing (Microphysics) scheme [14,20] | |
| Time Series Data of Katrina | Observed Satellite Data | Observed CAPE, and Computed Wmax | |||||||
|---|---|---|---|---|---|---|---|---|---|
| Date | Intensity Level | Time | Latitude ° North | Longitude ° West | Wind Speed (knots) | Sea Level Pressure (mBars) | Precipitation inches | CAPE (J/kg) | Maximum Vertical Velocity (m/s) |
| 8/23/2005 | Tropical Depression | 21Z | 23.2 | −75.5 | 30 | 1,007 | - | 1,889.01 | 61.5 |
| 8/24/2005 | Tropical Depression | 00Z | 23.4 | −75.7 | 30 | 1,007 | - | 1,913.42 | 61.9 |
| Tropical Storm | 12Z | 24.4 | −76.6 | 35 | 1,006 | 5.90 | 1,515.57 | 55.1 | |
| 8/25/2005 | Tropical Storm | 00Z | 26 | −77.7 | 45 | 1,000 | 3.07 | 2,811.67 | 75.0 |
| Tropical Storm | 12Z | 26.2 | −79 | 55 | 994 | 1.63 | 1,014.24 | 45.0 | |
| 8/26/2005 | Hurricane-1 | 00Z | 25.9 | −80.3 | 70 | 983 | 7.40 | 1,749.6 | 59.2 |
| Hurricane-1 | 12Z | 25.1 | −82 | 75 | 979 | 7.71 | 1,656.01 | 57.6 | |
| 8/27/2005 | Hurricane-3 | 00Z | 24.4 | −84.7 | 100 | 942 | 0.33 | 816.18 | 40.4 |
| Hurricane-3 | 12Z | 24.8 | −85.9 | 100 | 941 | 6.94 | 1,209.98 | 49.2 | |
| 8/28/2005 | Hurricane-5 | 00Z | 25.7 | −87.7 | 145 | 909 | 2.16 | 1,900.4 | 61.7 |
| Hurricane-5 | 12Z | 26.3 | −88.6 | 150 | 902 | 0.44 | 57.74 | 10.7 | |
| 8/29/2005 | Hurricane-4 | 00Z | 28.2 | −89.6 | 125 | 913 | 14.02 | 1,070.05 | 46.3 |
| Hurricane-3 | 12Z | 29.5 | −89.6 | 110 | 923 | 10.05 | 161.98 | 18.0 | |
| 8/30/2005 | Tropical Storm | 00Z | 32.6 | −89.1 | 50 | 961 | 3.52 | 197.49 | 19.9 |
| Tropical Depression | 12Z | 35.6 | −88 | 30 | 985 | 0.71 | 33.61 | 8.2 | |
| 8/31/2008 | Extratropical | 00Z | 38.6 | −85.3 | 30 | 994 | - | 121.32 | 15.6 |
© 2010 by the authors; licensee Molecular Diversity Preservation International, Basel, Switzerland. This article is an open-access article distributed under the terms and conditions of the Creative Commons Attribution license (http://creativecommons.org/licenses/by/3.0/).
Share and Cite
Tuluri, F.; Reddy, R.S.; Anjaneyulu, Y.; Colonias, J.; Tchounwou, P. Environmental Modeling, Technology, and Communication for Land Falling Tropical Cyclone/Hurricane Prediction. Int. J. Environ. Res. Public Health 2010, 7, 1937-1952. https://doi.org/10.3390/ijerph7051937
Tuluri F, Reddy RS, Anjaneyulu Y, Colonias J, Tchounwou P. Environmental Modeling, Technology, and Communication for Land Falling Tropical Cyclone/Hurricane Prediction. International Journal of Environmental Research and Public Health. 2010; 7(5):1937-1952. https://doi.org/10.3390/ijerph7051937
Chicago/Turabian StyleTuluri, Francis, R. Suseela Reddy, Y. Anjaneyulu, John Colonias, and Paul Tchounwou. 2010. "Environmental Modeling, Technology, and Communication for Land Falling Tropical Cyclone/Hurricane Prediction" International Journal of Environmental Research and Public Health 7, no. 5: 1937-1952. https://doi.org/10.3390/ijerph7051937