
A Toxicological Framework for the Prioritization of Children’s Safe Product Act Data


Abstract
:1. Introduction
2. Methods
2.1. Chemicals Considered
2.2. Framework Development
2.3. Framework Equations
2.4. Equation Variables
2.4.1. Lifestage
2.4.2. Chemical Concentration
2.4.3. Exposure Routes
2.4.4. Exposure Duration
2.4.5. Applied Directly to Skin
2.4.6. Chemical Properties
2.4.7. Observed Absorption
2.4.8. Toxicity Endpoints
2.4.9. Toxicity Potency
2.5. Framework Assumptions
- August 2012–September 2015 data is representative of the CSPA data as a whole, once phase in is complete in 2018
- Products intended for children under age three have the potential for oral exposure
- All products will disintegrate over time and the chemicals found in these products will accumulate in house dust leading to oral and inhalation exposure
- Exposures occur only through oral, dermal and inhalation exposure
2.6. Missing Data
2.7. ExpoCast
2.8. ToxPi
2.9. Statistical Software
3. Results
4. Discussion
5. Conclusions
Supplementary Materials
Acknowledgments
Author Contributions
Conflicts of Interest
Abbreviations
| Agency for Toxic Substances and Disease Research | ATSDR |
| Butyl benzyl phthalate | BBP |
| Carcinogenicity | Carc |
| Children’s Safe Product Act | CSPA |
| Di-2-ehtylhexyl phthalate | DEHP |
| Dibutyl phthalate | DBP |
| Diethyl phthalate | DEP |
| Diisodecyl phthalate | DIDP |
| Diisononyl phthalate | DINP |
| Di-n-Hexyl phthalate | DNHP |
| Di-n-octyl phthalate | DnOP |
| Endocrine Disruption | ED |
| European Chemical Agency | ECHA |
| Globally Harmonized System | GHS |
| Integrated Risk Information System | IRIS |
| International Agency for Research on Cancer | IARC |
| Lowest Observable Adverse Effects Level | LOAEL |
| Neurotoxicity | NT |
| No Observable Adverse Effects Level | NOAEL |
| Reference Dose | RfD |
| Reproductive and Developmental Toxicity | RD |
| Toxicological Prioritization Index | ToxPi |
| Tumor Dose50 | TD50 |
| United States Environmental Protection Agency | EPA |
| Washington State Department of Ecology | Ecology |
References
- Houlihan, J.; Kropp, T.; Wiles, R.; Gray, S.; Campbell, C. Body Burden—The Pollution in Newborns a Benchmark Investigation of Industrial Chemicals, Pollutants, and Pesticides in Umbilical Cord Blood. Available online: https://repository.library.georgetown.edu/handle/10822/980233 (accessed on 1 February 2016).
- Becker, M.; Edwards, S.; Massey, R.I. Toxic chemicals in toys and children’s products: Limitations of current responses and recommendations for government and industry. Environ. Sci. Tech. 2010, 44, 7986–7991. [Google Scholar] [CrossRef] [PubMed]
- Schettler, T. Human exposure to phthalates via consumer products. Int. J. Androl. 2006, 29, 134–139. [Google Scholar] [CrossRef] [PubMed]
- Babich, M.A.; Chen, S.B.; Greene, M.S.; Kiss, C.T.; Porter, W.K.; Smith, T.P.; Zamula, W.W. Risk assessment of oral exposure to diisononyl phthalate from children’s products. Reg. Toxicol. Pharm. 2004, 40, 151–167. [Google Scholar] [CrossRef] [PubMed]
- Maas, R.P.; Patch, S.C.; Pandolfo, T.J.; Duhan, J.L.; Gandy, N.F. Lead content and exposure from children’s and adult’s jewelry products. Bull. Environ. Contamin Toxicol. 2005, 74, 437–444. [Google Scholar] [CrossRef]
- Sathyanarayana, S.; Karr, C.J.; Lozano, E.B.; Brown, E.; Calafat, A.M.; Swan, S.H. Baby care products: Possible sources of infant phthalate exposure. Pediatrics 2008, 121, e260–e268. [Google Scholar] [CrossRef] [PubMed]
- Chen, S.J.; Ma, Y.J.; Wang, J.; Chen, D.; Luo, X.J.; Mai, B.X. Brominated flame retardants in children’s toys: Concentration, composition, and children’s exposure and risk assessment. Environ. Sci. Technol. 2009, 43, 4200–4206. [Google Scholar] [CrossRef] [PubMed]
- Faustman, E.M.; Silbernagal, S.M.; Fenske, R.A.; Burbacher, T.M.; Ponce, R.A. Mechanisms underlying children’s susceptibility to environmental toxicants. Environ. Health Perspect. 2000, 108 (Suppl 1), 13–21. [Google Scholar] [CrossRef] [PubMed]
- Allen, J.G.; McClean, M.D.; Stapleton, H.M.; Webster, T.F. Linking PBDEs in house dust to consumer products using X-ray fluorescence. Environ. Sci. Technol. 2008, 42, 4222–4228. [Google Scholar] [CrossRef] [PubMed]
- Wu, N.; Herrmann, T.; Paepke, O.; Tickner, J.; Hale, R.; Harvey, E.; La Guardia, M.; McCLean, M.R.; Webster, T.F. Human exposure to PBDEs: Associations of PBDE body burdens with food consumption and house dust concentrations. Environ. Sci. Tech. 2007, 41, 1584–1589. [Google Scholar] [CrossRef]
- Bellinger, D.C. Very low lead exposures and children’s neurodevelopment. Curr. Opin. Pediatr. 2008, 20, 172–177. [Google Scholar] [CrossRef] [PubMed]
- Counter, S.A.; Buchanan, L.H. Mercury exposure in children: A review. Toxicol. Appl. Pharm. 2004, 198, 209–230. [Google Scholar] [CrossRef] [PubMed]
- Landrigan, P.J.; Schechter, C.B.; Lipton, J.M.; Fahs, M.C.; Schartz, J. Environmental pollutants and disease in American children: estimates of morbidity, mortality, and costs for lead poisoning, asthma, cancer, and developmental disabilities. Environ. Health Perspect. 2002, 110, 721–728. [Google Scholar] [CrossRef] [PubMed]
- Stone, A.; Delistraty, D. Sources of toxicity and exposure information for identifying chemicals of high concern to children. Environ. Impt. Assess. Rev. 2010, 30, 380–387. [Google Scholar] [CrossRef]
- Children’s Safe Product Act, 2016. Available online: http://www.ecy.wa.gov/programs/hwtr/RTT/cspa/ (accessed on 30 January 2016).
- Savjani, K.T.; Gajjar, A.K.; Savjani, J.K. Drug solubility: Importance and enhancement Techniques. ISRN Pharm. 2012. [Google Scholar] [CrossRef] [PubMed]
- Toxic Substances Portal Toxicological Profiles, 2015. Available online: http://www.atsdr.cdc.gov/toxprofiles/index.asp (accessed on 30 January 2016).
- Center for Disease Control and Prevention. Skin Permeation Calculator 2009. Available online: http://www.cdc.gov/niosh/topics/skin/skinpermcalc.html (accessed on 30 January 2016).
- Potts, R.O.; Guy, R.H. Predicting skin permeability. Pharm. Res. 1992, 9, 663–669. [Google Scholar] [CrossRef] [PubMed]
- European Chemical Agency. Endocrine Disruptions: Substances of Concern, 2015. Available online: http://ec.europa.eu/environment/chemicals/endocrine/strategy/substances_en.htm#priority_list (accessed on 30 January 2016).
- California Environmental Protection Agency, United States. Chemicals Known to the State to Cause Cancer or Reproductive Toxicity. Available online: http://oehha.ca.gov/prop65/prop65_list/files/P65single012315.pdf (accessed on 28 January 2016).
- National Institute of Technology Evaluation, Japan. Global Harmonization System, 2013. Available online: http://www.safe.nite.go.jp/english/ghs/h25_mhlw_list_e.html (accessed on 21 January 2016).
- International Agency for Research on Cancer, Word Health Organization. Agents Classified by the IARC Monographs, 2015. Available online: http://monographs.iarc.fr/ENG/Classification/ClassificationsAlphaOrder.pdf (accessed on 29 January 2016).
- Environmental Protection Agency, United States. Integrated Risk Information Systems, 2016. Available online: http://cfpub.epa.gov/ncea/iris/index.cfm?fuseaction=iris.showSubstanceList&list_type=alpha&view=D (accessed on 29 January 2016).
- Fiori, J.M.; Meyerhoff, R.D. Extending the threshold of regulation concept: De minimis limits for carcinogens and mutagens. Reg. Toxicoland Pharm. 2002, 35, 209–216. [Google Scholar] [CrossRef] [PubMed]
- ToxNet, National Library of Medicine, United States. Carcinogenic Potency Database, 2011. Available online: http://toxnet.nlm.nih.gov/newtoxnet/cpdb.htm (accessed on 10 January 2016).
- Eurpoean Chemical Agency. Information from the Existing Substances Regulation, 2007. Available online: http://echa.europa.eu/information-on-chemicals/information-from-existing-substances-regulation?p_p_id=viewsubstances_WAR_echarevsubstanceportlet&p_p_lifecycle=0&p_p_state=normal&p_p_mode=view&p_p_col_id=column-1&p_p_col_pos=1&p_p_col_count=2&_viewsubstances_WAR_echarevsubstanceportlet_keywords=&_viewsubstances_WAR_echarevsubstanceportlet_advancedSearch=false&_viewsubstances_WAR_echarevsubstanceportlet_andOperator=true&_viewsubstances_WAR_echarevsubstanceportlet_orderByCol=synonymDynamicField_546&_viewsubstances_WAR_echarevsubstanceportlet_orderByType=asc&_viewsubstances_WAR_echarevsubstanceportlet_delta=200 (accessed on 15 January 2016).
- Grandjean, P.; Landrigan, P.J. Neurobehavioural effects of developmental toxicity. Lancet Neurol. 2014, 13, 330–338. [Google Scholar] [CrossRef]
- National Toxicology Program, United States. NTP-CERHR Monograph on the Potential Human Reproductive and Developmental Effects of Di-n-Octyl Phthalate (DnOP). 2003. Available online: https://ntp.niehs.nih.gov/ntp/ohat/phthalates/dnop/dnop_monograph_final.pdf (accessed on 30 January 2016). [Google Scholar]
- Wambaugh, J.F.; Setzer, W.R.; Reif, D.M.; Sumit, G.; Mitchell-Blackwood, J.; Arnot, J.A.; Joliet, O.; Frame, A.; Rabinowitz, J.; Knudson, T.; et al. High-throughput models for exposure-based chemical prioritization in the ExpoCast project. Environ. Sci. Technol. 2013, 47, 8479–8488. [Google Scholar] [CrossRef] [PubMed]
- Wambaugh, J.F.; Wang, A.; Dionisio, K.L.; Frame, A.; Egeghy, P.; Judson, R.; Woodrow Setzer, R. High throughput heuristics for prioritizing human exposure to environmental chemicals. Environ. Sci. Technol. 2014, 48, 12760–12767. [Google Scholar] [CrossRef] [PubMed]
- Reif, D.M.; Sypa, M.; Lock, E.F.; Wright, F.A.; Wilson, A.; Cathey, T.; Judson, R.R.; Rusyn, I. ToxPi GUI: An interactive visualization tool for transparent integration of data from diverse sources of evidence. Bioinformatics 2013, 29, 402–403. [Google Scholar] [CrossRef] [PubMed]
- Filer, D.; Patisaul, H.; Schug, T.; Reif, D.; Thayer, K. Test driving ToxCast: endocrine profiling for 1858 chemicals included in phase II. Curr. Opin. Pharm. 2014, 19, 145–152. [Google Scholar] [CrossRef] [PubMed]
- REPROTEXT® Database. Available online: http://www.micromedexsolutions.com/micromedex2/4.34.0/WebHelp/Document_help/Reprotext_document.htm (accessed on 1 February 2016).
- Drew, C.H.; Grace, D.A.; Silbernagel, S.M.; Hemmings, E.S.; Smith, A.; Griffith, W.C.; Takaro, T.K.; Faustman, E.M. Nuclear waste transportation: Case studies of identifying stakeholder risk information needs. Environ. Health Perspect. 2003, 111, 263–272. [Google Scholar] [CrossRef] [PubMed]
- Mitchell, J.; Pabon, N.; Collier, Z.A.; Egeghy, P.P.; Cohen-Hubal, E.; Linkov, I.; Vallero, D.A. A decision analytic approach to exposure-based chemical prioritization. PLoS ONE 2013, 8, e70911. [Google Scholar] [CrossRef] [PubMed]
- Hamilton, J.D.; Dagget, D.A.; Pittinger, C.A. The role of professional judgment in chemical hazard assessment and communication. Regul. Toxicol. Pharmacol. 2006, 46, 84–92. [Google Scholar] [CrossRef] [PubMed]


| Variable | Equation Abbrev. | Score | Basis | Mathematical Role | ||
|---|---|---|---|---|---|---|
| 1 | 2 | 3 | ||||
| Lifestage | LS | Ages 3–12 | NA | Under 3 | As reported in target age [15] | Additive to calculate product exposure potential |
| Concentration (ppm) * | Con | 100–500 * | 1000–5000 * | 10,000+ * | As reported concentration [15] | |
| Exposure duration | EX | Short-term | Long-term | As reported in product segment [15] | ||
| Applied directly to skin | A | No | Yes | As Reported in product segment [15] | ||
| Oral exposure | OMF | Tertiary | Secondary | Primary | Product segment (primary), Target age (secondary) [15] | Modifying factor for toxicokinetics for oral exposure |
| Water solubility (moles/L) | S | <0.001 | 0.001–0.01 | >0.1 | Soluble (3), moderately soluble (2), insoluble (1) [16] | Averages with Absoral for oral exposure toxicokinetics |
| Oral absorption | Absoral | 1%–5% | Absorbed at unknown rate | Above 5% | Absorption rate through oral exposure (ATSDR) [17] | Averages with solubility for oral exposure toxicokinetics |
| Dermal exposure | DMF | Tertiary | Secondary | Primary | As reported product segment (primary) [15] | Modifying factor for toxicokinetics for dermal exposure |
| Dermal permeability constant | Kp | <3.39 × 10⁻³ | 3.4 × 10⁻³–6.67 × 10⁻³ | >6.7 × 10⁻³ | Based on the tertiles of the Kp [18,19] | Averages with Absdermal for dermal exposure toxicokinetics |
| Dermal exposure absorption | Absdermal | 1%–5% | Absorbed at unknown rate | Above 5% | Absorption rate through dermal exposure (ATSDR) [17] | Averages with Kp for dermal exposure toxicokinetics |
| Inhalation exposure | IMF | Tertiary | Secondary | Primary | As reported product segment [15] | Modifying factor for toxicokinetic for inhalation exposure |
| Vapor Pressure mmHg at 25 °C | VP | <0.075 mmHg | 0.075–32 mmHg | > 32 mmHg | VP ranges for volatile compounds (3), semi-volatile compounds (2) and nonvolatile compounds (1) | Averages with Absinhalation for inhalation exposure toxicokinetics |
| Inhalation exposure absorption | Absinhalation | 1%–5% | Absorbed at unknown rate | Above 5% | Absorption rate through inhalation exposure (ATSDR) [17] | Averages with VP for inhalation exposure toxicokinetics |
| Reproductive and developmental toxicity certainty # | RDcertainty | Potential RD ^ | Suspected RD ^ | Known RD | ECHA Existing Substances [20], Prop 65 [21], Global Harmonization Standard [22] | Multiplies with RDpotency |
| Reproductive and developmental potency | RDpotency | NOAEL > 397 mg/kg | NOAEL 200–297 mg/kg | NOAEL < 200 mg/kg | NOAEL from ECHA Existing Substances [20] | Modifying factor RDcertainty |
| Carcinogenicity certainty # | Ccertianty | Potential Carcinogen ^ | Suspected Carcinogen ^ | Known Carcinogen ^ | IARC [23], Prop 65 [21], Global Harmonization Standard [22], EPA IRIS [24] | Multiplies with Cpotency |
| Carcinogenicity potency | Cpotency | TD50 > 465 mg/kg | TD50 from 233 to 465 mg/kg | TD50 < 233 mg/kg | Dose that causes a tumor in 50% of the study population (TD50) from the Carcinogenic Potency Database [25,26] | Modifying factor for Ccertainty |
| Endocrine disruption certainty # | EDcertianty | Potential ED ^ | Suspected ED ^ | Known ED | ECHA Endocrine Disruptor Substances of Concern [27], Global Harmonization Standard [22] | Multiplies with EDpotency |
| Endocrine disruptor potency | EDpotency | NOAEL > 336 mg/kg | NOAEL 336–667 mg/kg | NOAEL < 667 mg/kg | LOAEL from ECHA Endocrine Disruptor Substances of Concern [27] | Modifying factor for EDcertainty |
| Neurotoxicity certainty # | NTcertainty | Known NT | Grandjean and Landrigan et al. (2014) [28], Global Harmonization Standard [22] | Multiplies with NTpotency | ||
| Neurotoxicity potency | NTpotency | All NTs | All known neurotoxicants are assigned a score of 2 | Modifying factor for NTcertainty | ||
| Chemical | Observed Oral Absorption Score | Observed Dermal Absorption Score | Observed Inhalation Absorption Score | Water Solubility Score | Skin Permeability Constant Score | Vapor Pressure Score | RD Certainty Score | RD Potency Score | Carcinogenic Certainty Score | Carcinogen Potency Score | Neurotoxicity Certainty Score | Neurotoxicity potency Score | ED Certainty Score | ED Potency Score |
|---|---|---|---|---|---|---|---|---|---|---|---|---|---|---|
| Dibutyl phthalate | 3 | 2 | 2 | 1 | 3 | 1 | 3 | 3 | 0 | NA | 3 | 2 | 3 | 3 |
| Di-2-ethylhexyl phthalate | 3 | 2 | 2 | 1 | 2 | 1 | 3 | 3 | 3 | 1 | 0 | NA | 3 | 3 |
| Formaldehyde | 2 | 3 | 3 | 3 | 1 | 3 | 1 | 1 | 3 | 3 | 3 | 2 | 0 | NA |
| Butyl benzyl phthalate | 3 | 2 | 3 | 1 | 3 | 1 | 3 | 3 | 0 | NA | 0 | NA | 3 | 3 |
| Styrene | 2 | 2 | 3 | 1 | 3 | 2 | 2 | 1 | 3 | 3 | 3 | 2 | 0 | NA |
| Diisodecyl phthalate | 3 | NI | 3 | 1 | 2 | 1 | 3 | 3 | 0 | NA | 0 | NA | 2 | 1 |
| Methyl Ethyl Ketone | 2 | NI | 3 | 3 | 2 | 3 | 3 | 1 | 0 | NA | 3 | 2 | 0 | NA |
| Di-n-Hexyl phthalate | NI | 3 | NI | 1 | 2 | 1 | 3 | 3 | 0 | NA | 0 | NA | 2 | 1 |
| Butyl Paraben | NI | NI | NI | 1 | 3 | 1 | 0 | NA | 0 | NA | 0 | NA | 3 | 3 |
| Ethylene Glycol | 2 | 1 | 3 | 3 | 1 | 2 | 2 | 1 | 0 | NA | 3 | 2 | 0 | NA |
| Ethyl Paraben | NI | NI | NI | 1 | 3 | 1 | 0 | NA | 0 | NA | 0 | NA | 3 | 1 |
| Cobalt and Cobalt Compounds | 3 | 1 | 3 | 1 | 1 | 1 | 1 | 1 | 3 | 3 | 0 | NA | 0 | NA |
| Diethyl phthalate | 2 | 1 | NI | 1 | 2 | 1 | 0 | NA | 1 | 1 | 0 | NA | 3 | 3 |
| Antimony and Antimony Compounds | 2 | 2 | 2 | 1 | 1 | 0 | NA | 3 | 1 | 0 | NA | 0 | NA | |
| Diisononyl phthalate | 3 | 1 | 3 | 1 | 2 | 1 | 1 | 1 | 0 | NA | 0 | NA | 2 | 1 |
| Di-n-octyl phthalate | 2 | NI | NI | 1 | 2 | 1 | 1 | 1 | 0 | NA | 0 | NA | 1 | 1 |
| Octamethylcyclotetrasiloxane | NI | NI | NI | 1 | 3 | 3 | 1 | 1 | 0 | NA | 0 | NA | 0 | NA |
| Methyl Paraben | NI | NI | NI | 2 | 2 | 1 | 0 | NA | 0 | NA | 0 | NA | 0 | NA |
| Molybdenum and Molybdenum Compounds | NI | NI | NI | 1 | 1 | 1 | 0 | NA | 0 | NA | 0 | NA | 0 | NA |
| Phthalic anhydride | NI | NI | NI | 2 | 1 | 1 | 0 | NA | 0 | NA | 0 | NA | 0 | NA |
| Propyl paraben | NI | NI | NI | 1 | 3 | 1 | 0 | NA | 0 | NA | 0 | NA | 0 | NA |
| Chemicals | Number of Reports | Exposure Score ± SD | Total Priority Index ± SD |
|---|---|---|---|
| Formaldehyde | 533 | 14.2 ± 3.3 | 297.8 ± 69.1 |
| Dibutyl phthalate | 778 | 12.3 ± 1.7 | 294.7 ± 40.1 |
| Styrene | 2251 | 13.6 ± 2.7 | 231.2 ± 45.1 |
| Butyl benzyl phthalate (BBP) | 610 | 12.5 ± 1.7 | 225.2 ± 30.2 |
| Di-2-ethylhexyl phthalate | 909 | 10.6 ± 1.7 | 223.2 ± 34.6 |
| Diisodecyl phthalate (DIDP) | 235 | 11.6 ± 2.1 | 127.9 ± 22.8 |
| Di-n-Hexyl phthalate | 178 | 10.2 ± 1.1 | 112.0 ± 11.7 |
| Butyl paraben | 83 | 12.0 ± 0.94 | 108.0 ± 8.4 |
| Methyl ethyl ketone | 2378 | 10.2 ± 1.9 | 91.5 ± 17.1 |
| Cobalt and cobalt compounds | 6927 | 8.5 ± 1.5 | 84.5 ± 14.7 |
| Ethylene glycol monoethyl ester | 31 | 10.3 ± 2.4 | 82.1 ± 18.9 |
| Diethyl phthalate | 380 | 8.0 ± 0.84 | 80.0 ± 8.4 |
| Ethylene glycol | 6042 | 9.8 ± 1.9 | 78.5 ± 14.8 |
| Ethyl paraben | 97 | 12.0 ± 1.1 | 35.9 ± 3.2 |
| Antimony and Antimony compounds | 3378 | 10.3 ± 1.4 | 31.0 ± 4.3 |
| Diisononyl phthalate (DINP) | 357 | 10.3 ± 2.1 | 30.8 ± 6.2 |
| Di-n-octyl phthalate (DnOP) | 279 | 9.6 ± 0.9 | 19.3 ± 1.8 |
| Octamethylcyclotetrasiloxane | 2123 | 13.9 ± 1.6 | 13.9 ± 1.6 |
| Methyl paraben | 251 | 10.2 ± 1.2 | 0 |
| Molybdenum and molybdenum compounds | 1617 | 5.8 ± 0.80 | 0 |
| Phthalic anhydride | 137 | 7.6 ± 1.3 | 0 |
| Propyl paraben | 207 | 11.8 ± 0.95 | 0 |
| Chemical Groups | |||
| Phthalates | 3863 | 10.8 ± 2.2 | 172.5 ± 102.9 |
| Parabens | 638 | 11.2 ± 1.4 | 19.5 ± 36.7 |
| Ethylene Glycols | 6073 | 9.8 ± 1.9 | 78.5 ± 14.9 |
| Product Segments | Total Priority Index | Exposure Score | Total Number of Reports |
|---|---|---|---|
| Kitchen Merchandise | 205.8 | 12.2 | 72 |
| Stationery/Office Machinery/Occasion Supplies | 158.6 | 10.1 | 365 |
| Toys/Games | 131.9 | 13.0 | 4910 |
| Arts/Crafts/Needlework | 105.3 | 9.3 | 631 |
| Household/Office Furniture/Furnishings | 105.1 | 10.7 | 1446 |
| Baby Care | 103.8 | 10.7 | 991 |
| Footwear | 90.5 | 10.0 | 4940 |
| Personal Accessories | 82.3 | 9.0 | 1229 |
| Clothing | 79.2 | 9.3 | 14,551 |
| Camping | 71.1 | 8.9 | 87 |
| Beauty/Personal Care/Hygiene | 42.4 | 10.2 | 559 |
| Prioritization Tool | Basis | Top Three Chemicals |
|---|---|---|
| Total number of reports in CSPA | Frequency of chemical reports | Cobalt and cobalt compounds, ethylene glycol and antimony and antimony compounds |
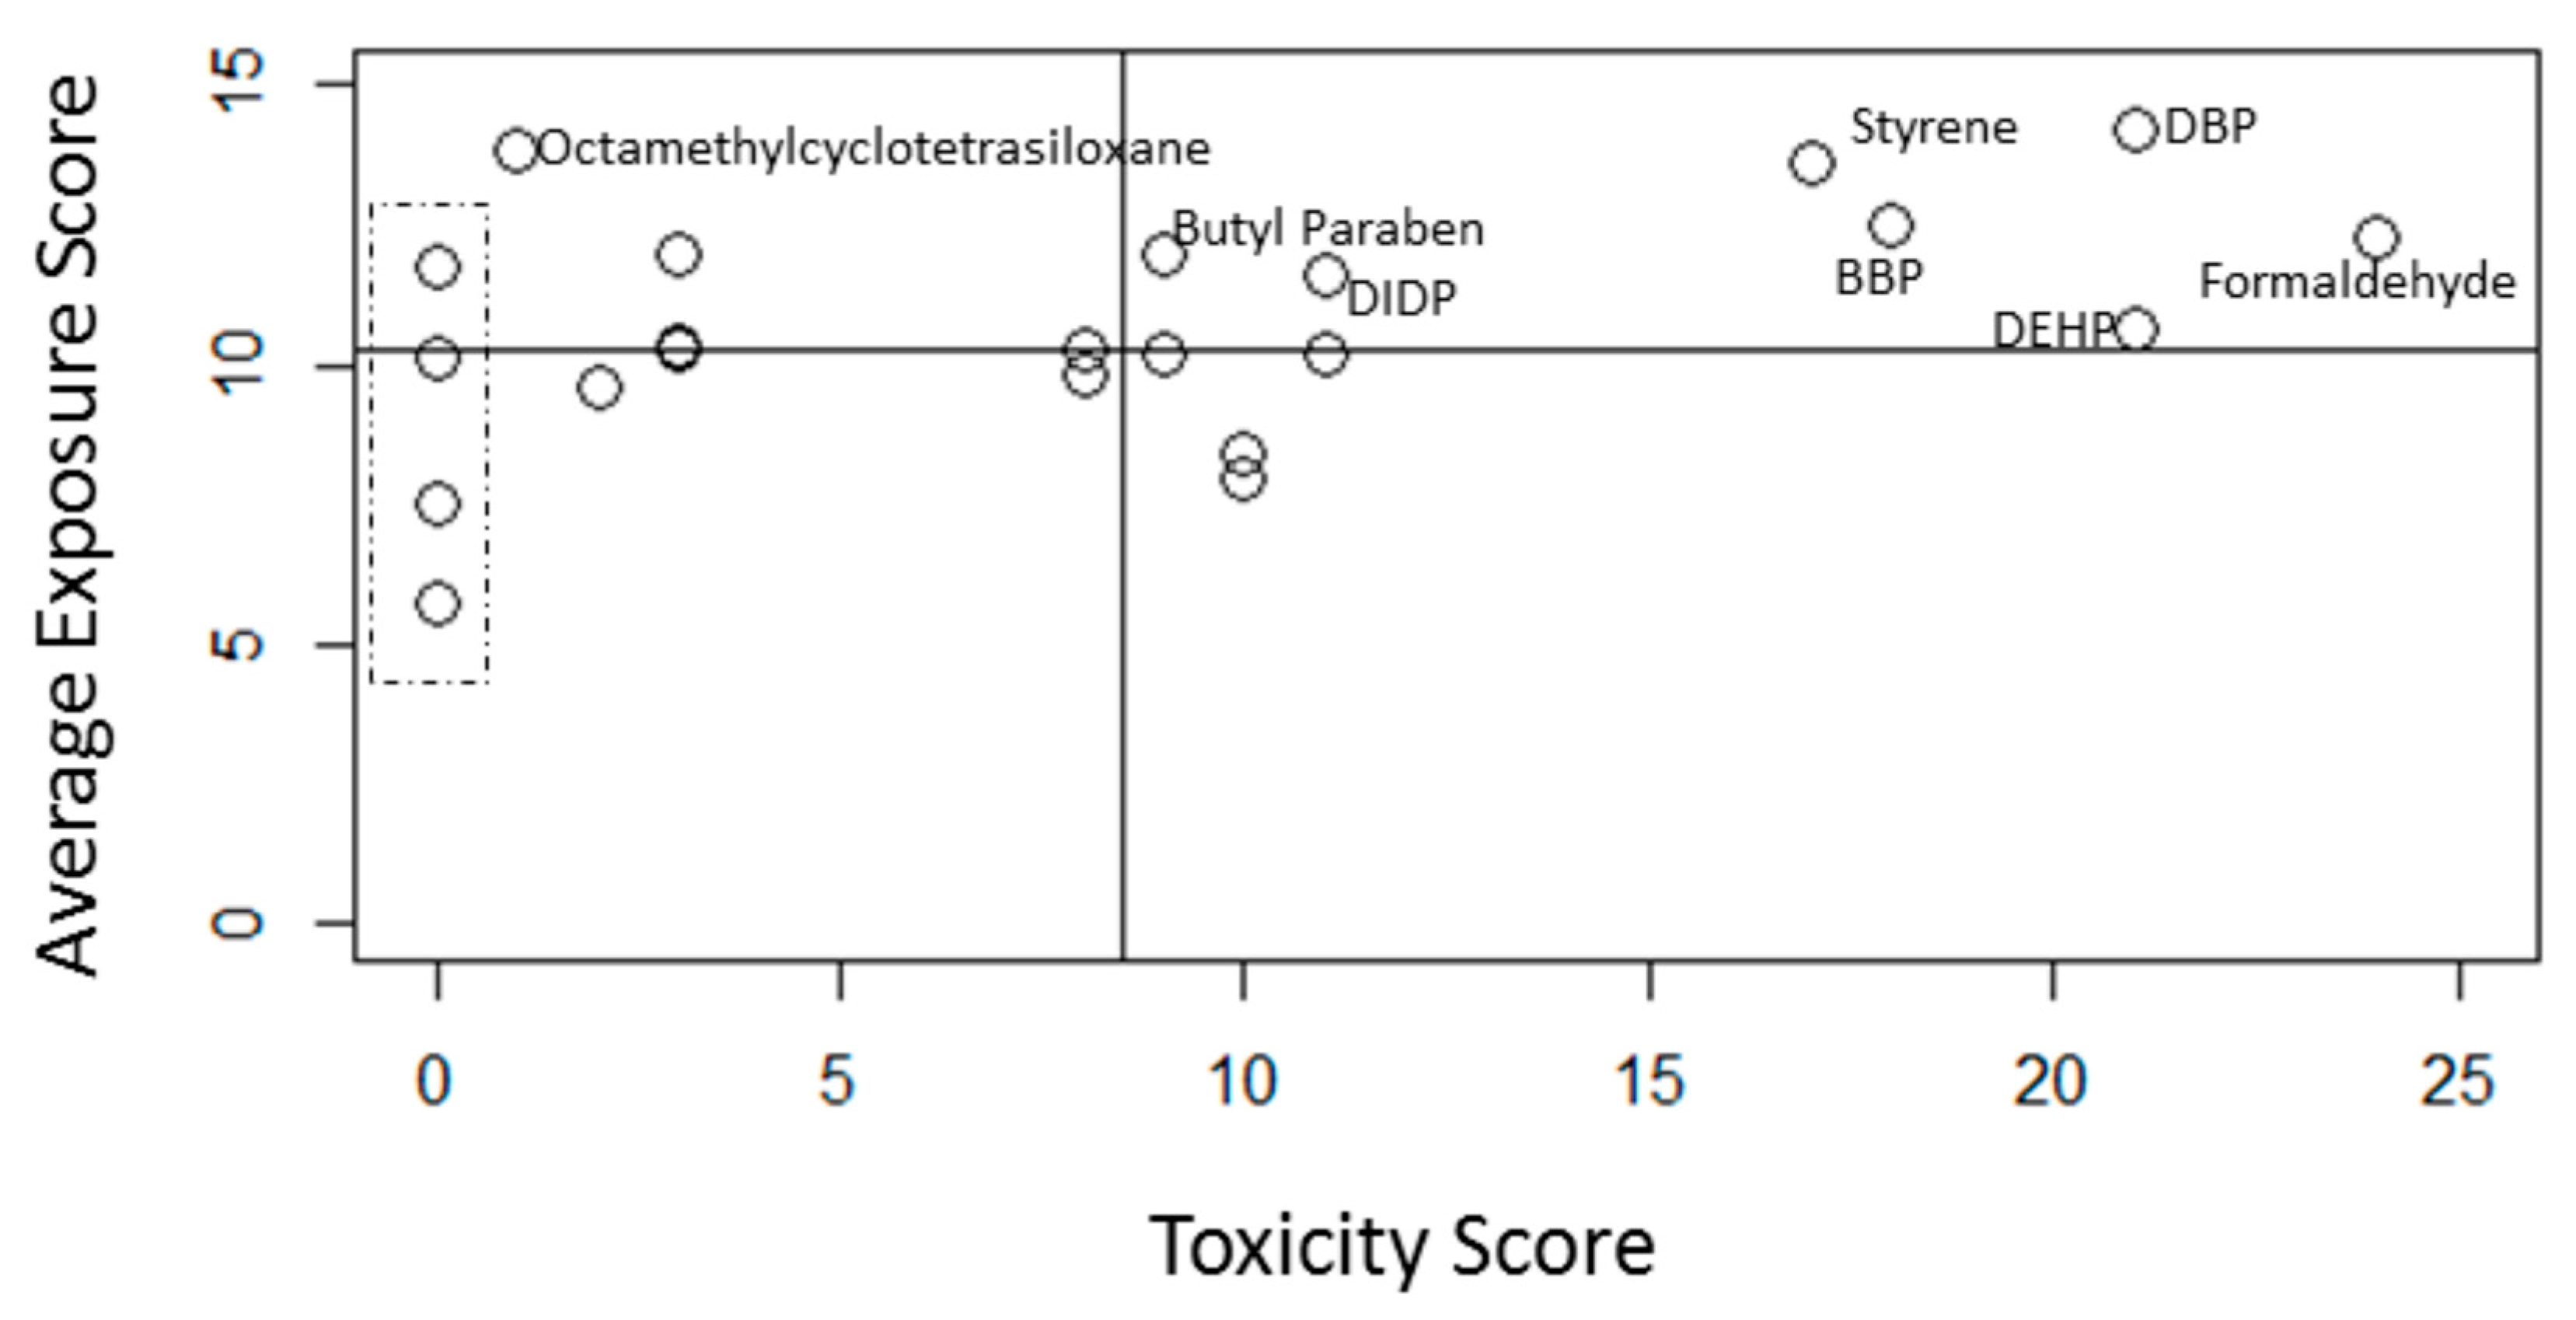
| CSPA Total Priority Index | Exposure potential, chemical properties, neurodevelopment, carcinogenicity, endocrine disruption, reproductive and developmental toxicity. | Formaldehyde, dibutyl phthalate and styrene |
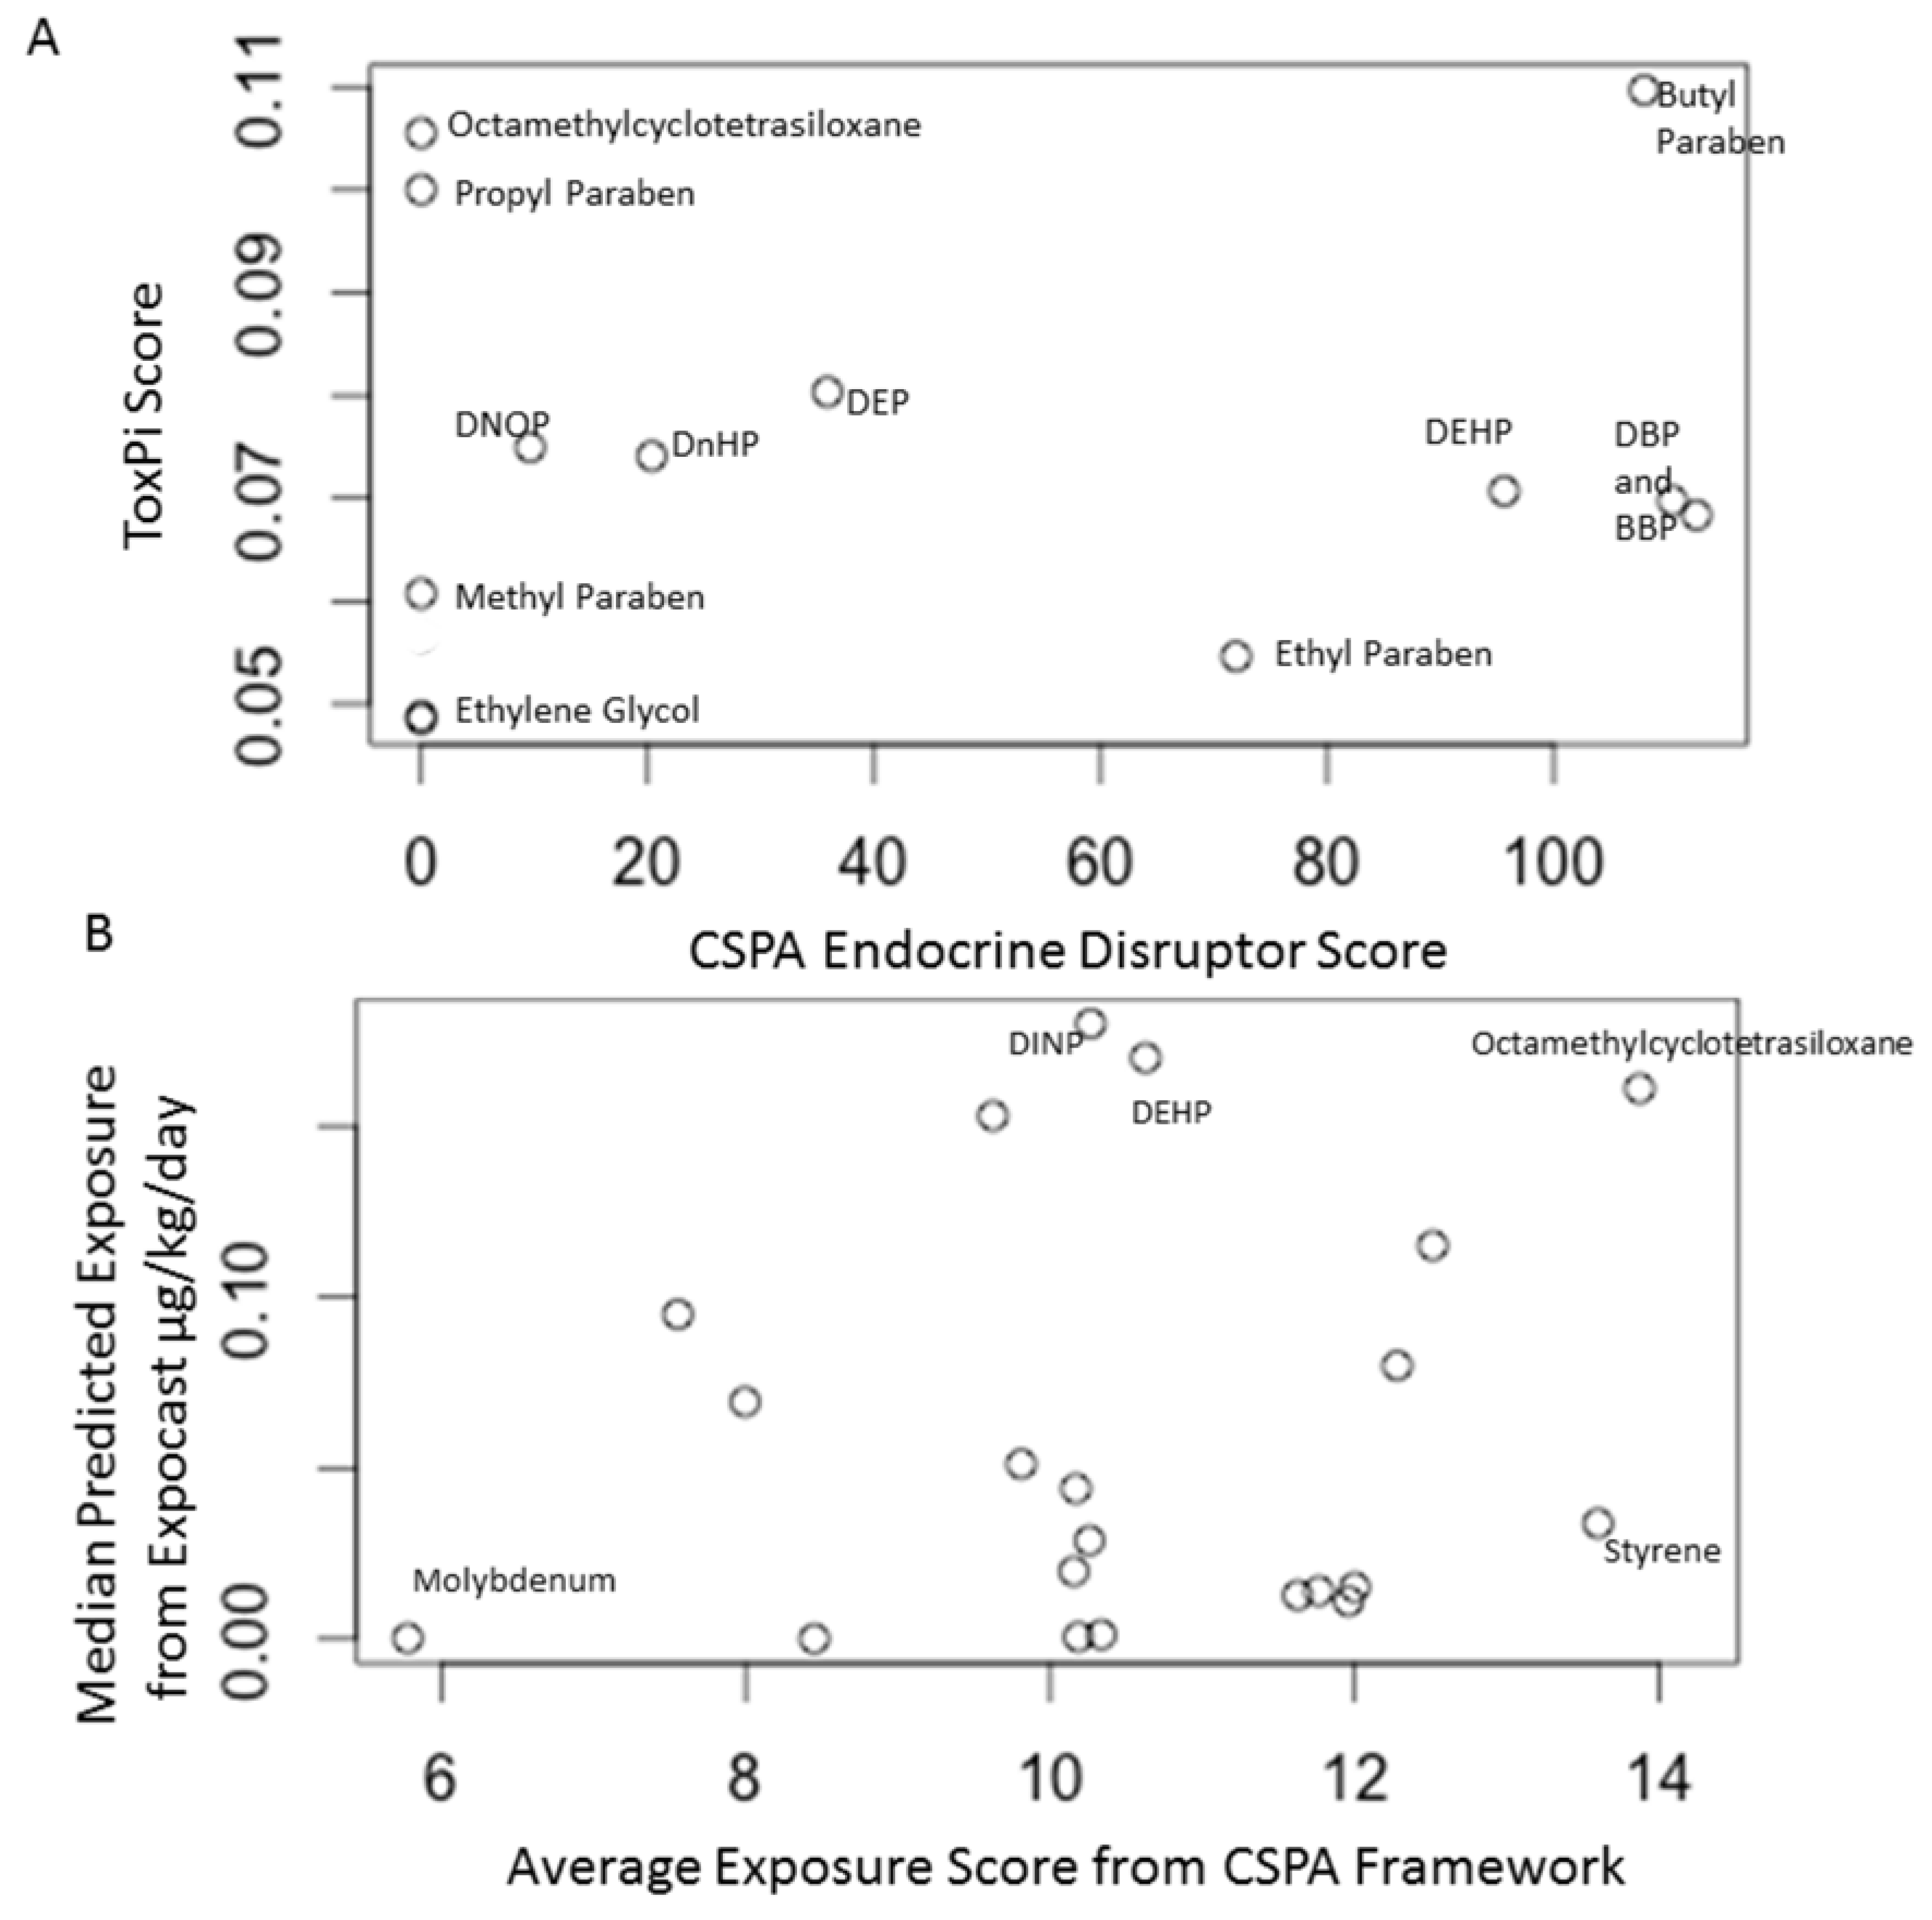
| CSPA Endocrine Disruptor Score | Exposure potential, chemical properties, endocrine disruption based on databases largely comprised of in vivo studies | Butyl paraben, dibutyl phthalate and butyl benzyl phthalate |
| ToxPi Endocrine Disruption Score | Chemical properties, endocrine disruption based on in vitro assays | Butyl paraben, propyl paraben and octamethylcyclotetrasiloxane |
| CSPA Exposure Score | Lifestage, product description, chemical properties, toxicokinetics and potential exposure routes | Formaldehyde, octamethylcyclotetrasiloxane and styrene |
| ExpoCast | Prediction of exposure from all routes | Diisononyl phthalate, Di-2-ethylhexyl phthalate and octamethylcyclotetrasiloxane |
© 2016 by the authors; licensee MDPI, Basel, Switzerland. This article is an open access article distributed under the terms and conditions of the Creative Commons by Attribution (CC-BY) license (http://creativecommons.org/licenses/by/4.0/).
Share and Cite
Smith, M.N.; Grice, J.; Cullen, A.; Faustman, E.M. A Toxicological Framework for the Prioritization of Children’s Safe Product Act Data. Int. J. Environ. Res. Public Health 2016, 13, 431. https://doi.org/10.3390/ijerph13040431
Smith MN, Grice J, Cullen A, Faustman EM. A Toxicological Framework for the Prioritization of Children’s Safe Product Act Data. International Journal of Environmental Research and Public Health. 2016; 13(4):431. https://doi.org/10.3390/ijerph13040431
Chicago/Turabian StyleSmith, Marissa N., Joshua Grice, Alison Cullen, and Elaine M. Faustman. 2016. "A Toxicological Framework for the Prioritization of Children’s Safe Product Act Data" International Journal of Environmental Research and Public Health 13, no. 4: 431. https://doi.org/10.3390/ijerph13040431
APA StyleSmith, M. N., Grice, J., Cullen, A., & Faustman, E. M. (2016). A Toxicological Framework for the Prioritization of Children’s Safe Product Act Data. International Journal of Environmental Research and Public Health, 13(4), 431. https://doi.org/10.3390/ijerph13040431