Article

Temporal Trends in Geographical Variation in Breast Cancer Mortality in China, 1973–2005: An Analysis of Nationwide Surveys on Cause of Death

1
National Office for Cancer Prevention and Control, National Cancer Center/Cancer Hospital, Chinese Academy of Medical Sciences and Peking Union Medical College, Beijing 100021, China
2
Cancer Council New South Wales, Sydney NSW 2011, Australia
3
State Key Laboratory of Resources and Environmental Information System, Institute of Geographic Sciences and Natural Resources Research, Chinese Academy of Sciences, Beijing 100101, China
4
Sydney School of Public Health, University of Sydney, Sydney NSW 2006, Australia
*
Authors to whom correspondence should be addressed.
Int. J. Environ. Res. Public Health 2016, 13(10), 963; https://doi.org/10.3390/ijerph13100963
Submission received: 17 August 2016 / Revised: 21 September 2016 / Accepted: 23 September 2016 / Published: 28 September 2016
(This article belongs to the Special Issue Geographical Variation in Breast Cancer Outcomes)

Abstract

:
To describe geographical variation in breast cancer mortality over time, we analysed breast cancer mortality data from three retrospective national surveys on causes of death in recent decades in China. We first calculated the age-standardized mortality rate (ASMR) for each of the 31 provinces in mainland China stratified by survey period (1973–1975, 1990–1992 and 2004–2005). To test whether the geographical variation in breast cancer mortality changed over time, we then estimated the rate ratio (RR) for the aggregated data for seven regions and three economic zones using generalized linear models. Finally, we examined the correlation between mortality rate and several macro-economic measures at the provincial level. We found that the overall ASMR increased from 2.98 per 100,000 in 1973–1975 to 3.08 per 100,000 in 1990–1992, and to 3.85 per 100,000 in 2004–2005. Geographical variation in breast cancer mortality also increased significantly over time at the regional level (p = 0.002) but not at the economic zone (p = 0.089) level, with RR being generally lower for Western China (Northwest and Southwest) and higher in Northeast China over the three survey periods. These temporal and spatial trends in breast cancer mortality were found to be correlated with per capita gross domestic product, number of hospitals and health centres’ beds per 10,000 population and number of practicing doctors per 10,000 population, and average number of live births for women aged 15–64. It may be necessary to target public health policies in China to address the widening geographic variation in breast cancer mortality, and to take steps to ensure that the ease of access and the quality of cancer care across the country is improved for all residents.

1. Introduction

Breast cancer is the most commonly diagnosed cancer among women worldwide, and the leading cause of cancer death among women in less developed regions [1]. In China, breast cancer is now the most frequently diagnosed cancer and the sixth leading cause of cancer-related death in women, with 273,000 Chinese women being diagnosed with breast cancer in 2012 and 62,000 dying of the disease [2]. While the incidence rate of breast cancer in China is still lower than is reported in developed countries, since the 1990s, breast cancer incidence in China has increased at a rate more than double the increases seen in global rates [3].
Since the late 1970s, when the initiation of economic reforms in China began to lead to a shift from a predominately rural lifestyle to a more urban lifestyle, breast cancer incidence and mortality rates in China have been gradually increasing [4]. These economic developments, along with accelerating urbanization and the adoption of a Westernized lifestyle, are believed to have contributed greatly to the overall increase in breast cancer incidence over time in China [4,5,6]. It also seems likely that these economic developments have significantly increased inequalities in breast cancer mortality within China due to uneven development across geographical regions [7,8,9]. In a recent study that compared the results of two death surveys in China, Zhou and colleagues found that the areas of highest breast cancer mortality shifted from being in the large cities (Beijing and Shanghai) in the 1970s to being in more rural areas of the provinces in Northeast China by the period 2004–2005 [10]. There are, however, some limitations to most previous studies of geographical variation in breast cancer mortality, as they tended to either use data from the 1990s to 2010s [7,8], and thus provide no information on breast cancer in the 1980s and later 1970s when the Chinese economic reforms began, or they use data from only two time periods [9].
To begin to address these concerns this study aimed to provide a detailed analysis of the geographical variation and temporal changes in female breast cancer mortality in China from 1973 to 2005. Data from three nationally representative death surveys were used to detect the temporal trends in geographical variation in breast cancer mortality and to explore the relationship between the distribution of breast cancer mortality and selected socioeconomic factors such as per capita gross domestic product (GDP), number of hospitals and health centers’ beds (NHHCB) per 10,000 population, number of practicing doctors (NPD) per 10,000 population and average number of live births for women aged 15–64.

2. Materials and Methods

2.1. Data Sources

Breast cancer mortality data were extracted from three national retrospective surveys on cause of death, conducted by the Chinese Ministry of Health in 1973–1975, 1990–1992 and 2004–2005. The data included the number and age of people dying from breast cancer, and the population of each geographical area. The three surveys of cause of death in China have been described in detail in previous publications [11,12,13]. Briefly, the First National Survey of Death Causes for the period 1973–1975 covered nearly all counties/cities/districts of mainland China (excluding Taiwan, Hong Kong, Macau, and 35 sparsely populated counties), with a total population of 850 million [11]. Using a retrospective method, this survey completed an ad hoc investigation of causes of all deaths in nearly all households in China during 1973–1975. The Second National Retrospective Sampling Survey of Death Causes for the period 1990–1992 included 263 sample points so that a total of 335 million person-years were investigated, accounting for 9.8% of the total national population [12]. The Third National Retrospective Sampling Survey of Death Causes for the period 2004–2005 covered 158 counties/cities/districts, accounting for 143 million person-years between 2004 and 2005 [13]. These two sampling surveys collected information from a nationally representative sample and recorded deaths which occurred in the study years. As this is published tabulated data, no ethics approval was required for this study.
Macro data on several socioeconomic development levels were used to examine the correlation between breast cancer mortality and economic development. The data of per capita GDP were derived from the China Compendium of Statistics 1949–2008 [14]. The NHHCB per 10,000 population, and NPD per 10,000 population for 1975 and 1992 were taken from the National Bureau of Statistics of the People’s Republic of China [15], and, for 2005, they were taken from the 2006 China Health Statistical Yearbook [16]. The data of average number of live births for women aged 15–64 were extracted from the tabulation of the three national population censuses collected from 1982 to 2000: the Third (1982), the Fourth (1990), and the Fifth National Population Census (2000).

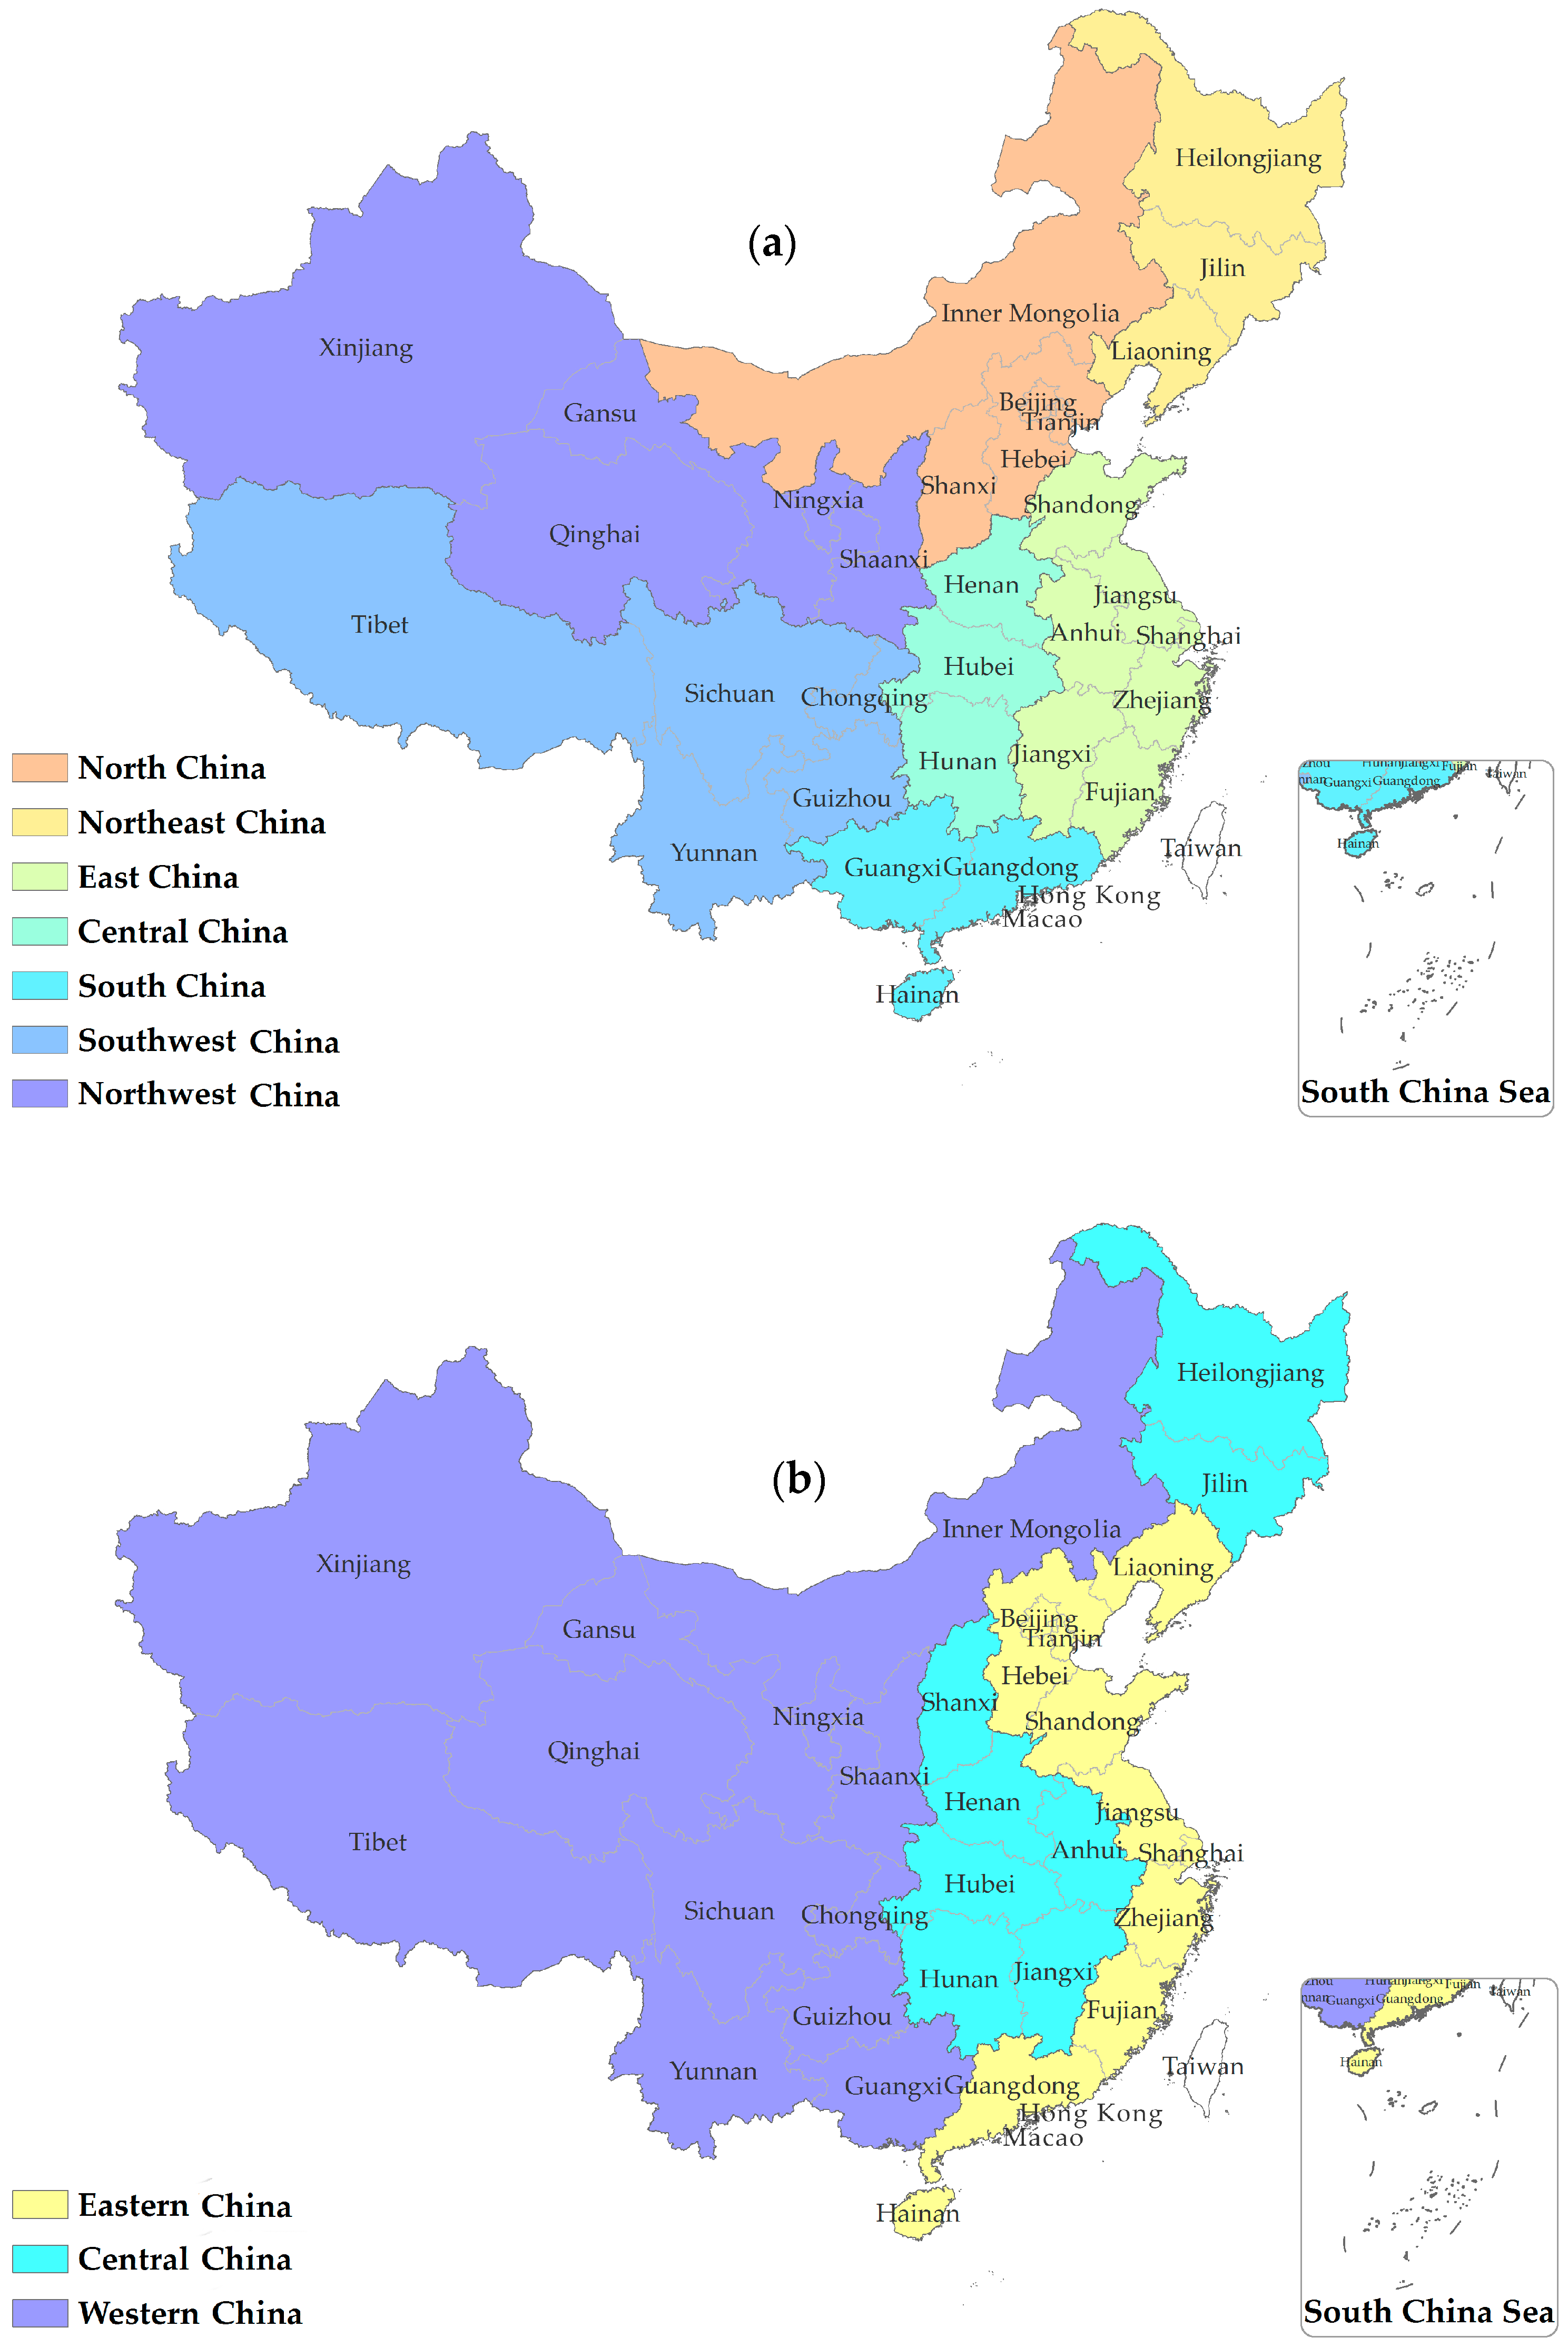
2.2. Geographical Unit Used in Analyses

The basic geographical unit used for analyses in this study is province, or autonomous region or municipality of Beijing, Tianjin, Shanghai and Chongqing.
We divided mainland China into seven geographical regions (Figure 1a) and three economic zones (Figure 1b). The list of provinces included in these regions or zones can be found in online Appendix A.

2.3. Data Analysis

We first calculated age-standardized morality rates (ASMR), using the direct standardization method (to the 1982 female Chinese standard population), for each province and each of the three cause of death surveys. These province-based data were then aggregated into seven geographical regions and three economic zones, respectively.
We used generalized linear models with a negative binomial error structure (to overcome over-dispersion [17]) to calculate the rate ratio (RR) of death from breast cancer for the aggregated data for region and zone. We calculated the RR of death for each geographical unit stratified by cause of death survey (1972–1975, 1990–1992 and 2004–2005). In this model, the main-effect variables were geographical unit (seven regions or three zones), age group at death (<25 years, 25–29 years,…, 75–79 years, ≥80 years), and the natural logarithm of the population size as the offset variable. The RR derived from this model is the ratio of death from breast cancer in a given geographical unit to that of the reference (the national average of each survey). Ninety-five percent confidence intervals (CIs) for the geographical units were calculated using the estimated coefficients and standard errors from the negative binomial regression model. We then added an interaction term for geographical unit and time period to the model, to allow the effect of geographical unit to change between periods, and then used a likelihood ratio test between the nested models to determine if this interaction was significant [18,19].
Correlation of the provincial mortality rate of breast cancer and provincial macro-economic measures was calculated separately for each survey period. In order to avoid any confounding caused by age, we used crude rate rather than age-adjusted rate.
All significance tests with p-value < 0.05 were taken to indicate statistical significance. Statistical analyses were performed using SAS software (version 9.3, Institute Inc., Cary, NC, USA). All maps were created using ESRI (Environmental Systems Research Institute, Inc., Redlands, CA, USA) ArcGIS 10.2 software.

3. Results

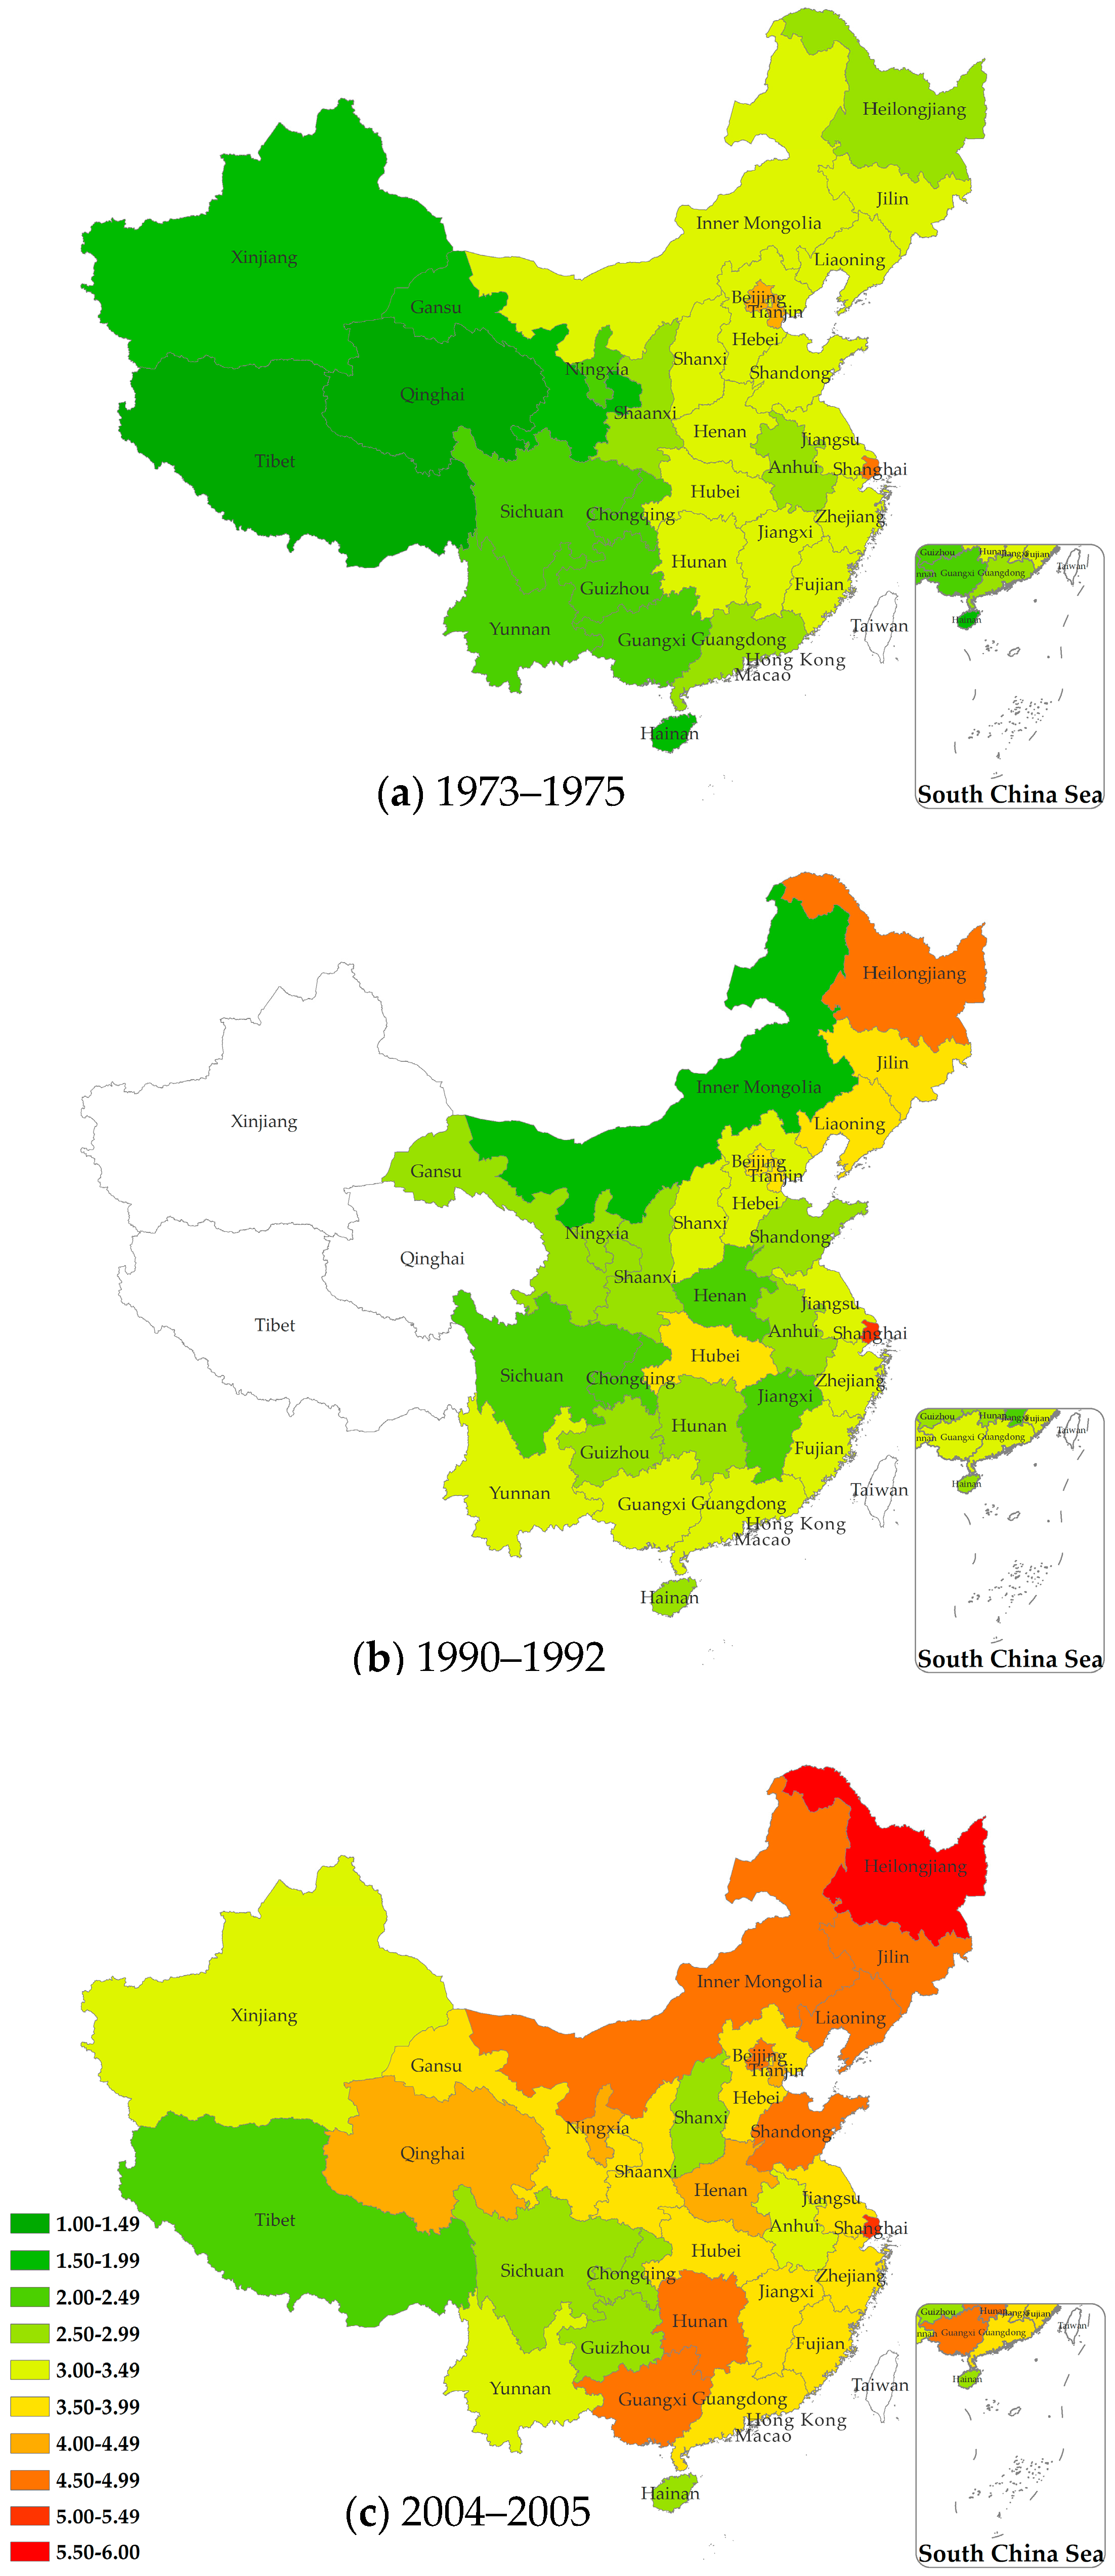
3.1. Age-Standardized Mortality Rate

Detailed data including the numbers of breast cancer deaths and corresponding populations by province and survey period can be found in online Appendix B Table B1. The economic measure of per capita GPD by province is also included.
From the mid-1970s to the mid-2000s, there was an increase in female breast cancer mortality in China. Average crude mortality rates (CMR) increased from 2.95 per 100,000 in 1973–1975, to 3.53 per 100,000 in 1990–1992, and 5.67 per 100,000 in 2004–2005, and age-standardized morality rates (ASMR) increased from 2.98 per 100,000 in 1973–1975 to 3.08 per 100,000 in 1990–1992, and 3.85 per 100,000 in 2004–2005.
Breast cancer ASMRs by province for the three mortality surveys are shown in Figure 2. Values of these provincial ASMR estimates are presented in online Appendix C Table C1. In the period 1973–1975, Shanghai, Beijing and Tianjin had the highest ASMR (4.25 per 100,000 to 4.80 per 100,000), while the provinces in the Southwest and Northwest had lower rates (from Tibet: 1.23 per 100,000; Qinghai: 1.48 per 100,000 to 1.92 and 1.97 per 100,000 for Hainan and Xinjiang respectively). In the period 1990–1992, Shanghai still had the highest breast cancer ASMR (5.03 per 100,000), and the rates for three provinces in the Northeast as well as Beijing, Tianjin and Hubei were also higher than other provinces. In 2004–2005, the areas with the highest breast cancer mortality rates were Shanghai (5.21 per 100,000) and Heilongjiang Province (5.69 per 100,000), while the mortality rates recorded in Liaoning, Jilin, Shandong, Guangxi, and Hunan (ranging from 4.53 to 4.84 per 100,000) were higher than those seen in the neighboring provinces.

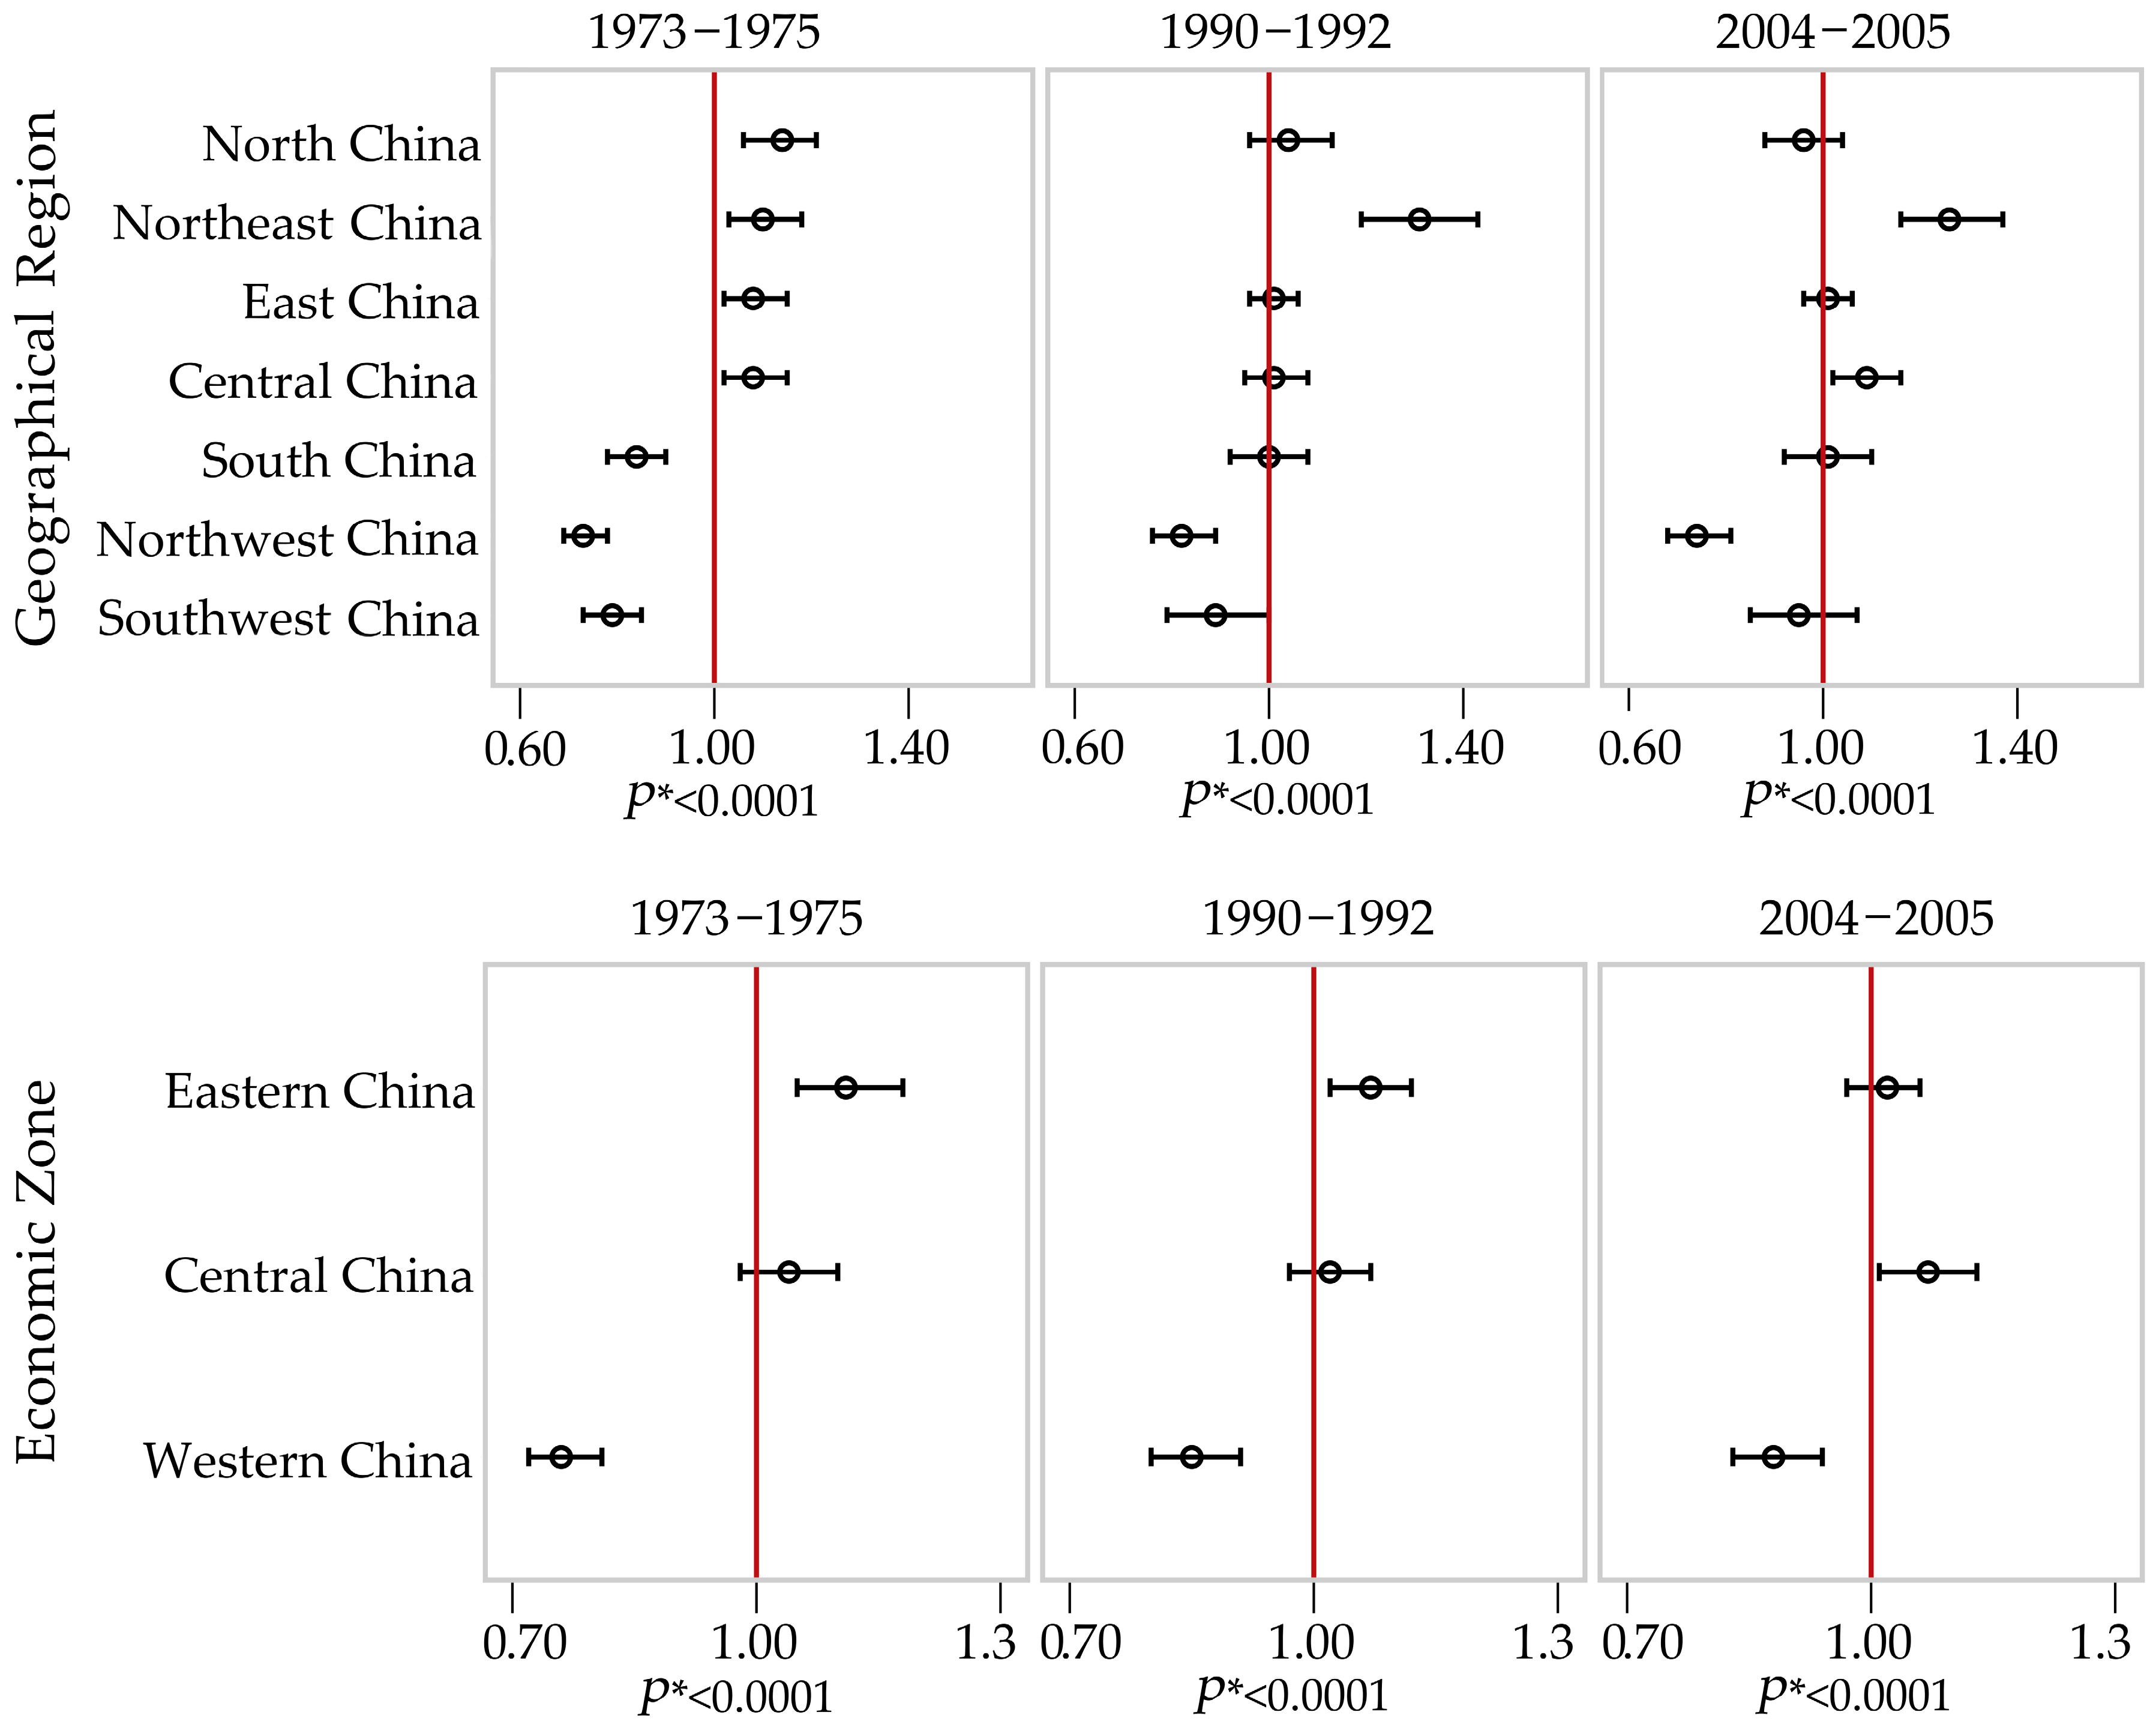
3.2. Geographical Variation over Time

Estimates of the rate ratios (RR) for female breast cancer death across seven geographical regions over the three surveys are shown in the upper panel in Figure 3. Values of these RR estimates and their 95% confidence intervals, by geographical regions and economic zones are presented in online Appendix D Table D1. Overall, the variation in breast cancer mortality was significant (p < 0.0001) between the seven geographical regions for each of the survey periods. Women living in the Northwest and Southwest areas had a lower risk of breast cancer mortality than the national average for all three survey periods, although there was an increase in risk over time, while women living in the Northeast had a higher rate than the national average for all three survey periods. The interaction between geographical region and death survey period was significant (p = 0.002), indicating that the geographical differential had widened over time.
When we looked at breast cancer mortality across the three economic zones (the lower panel in Figure 3), the results were consistent with those by the seven geographical regions. The Eastern economic zone had a higher breast cancer mortality rate than the national average, while the Western zone had a lower rate. The difference in the risk of breast cancer mortality in the three zones showed some gradual decrease over time, with the interaction between economic zone and survey period being non-significant (p = 0.089), but the geographical differential remained significant in each survey period (p < 0.001).

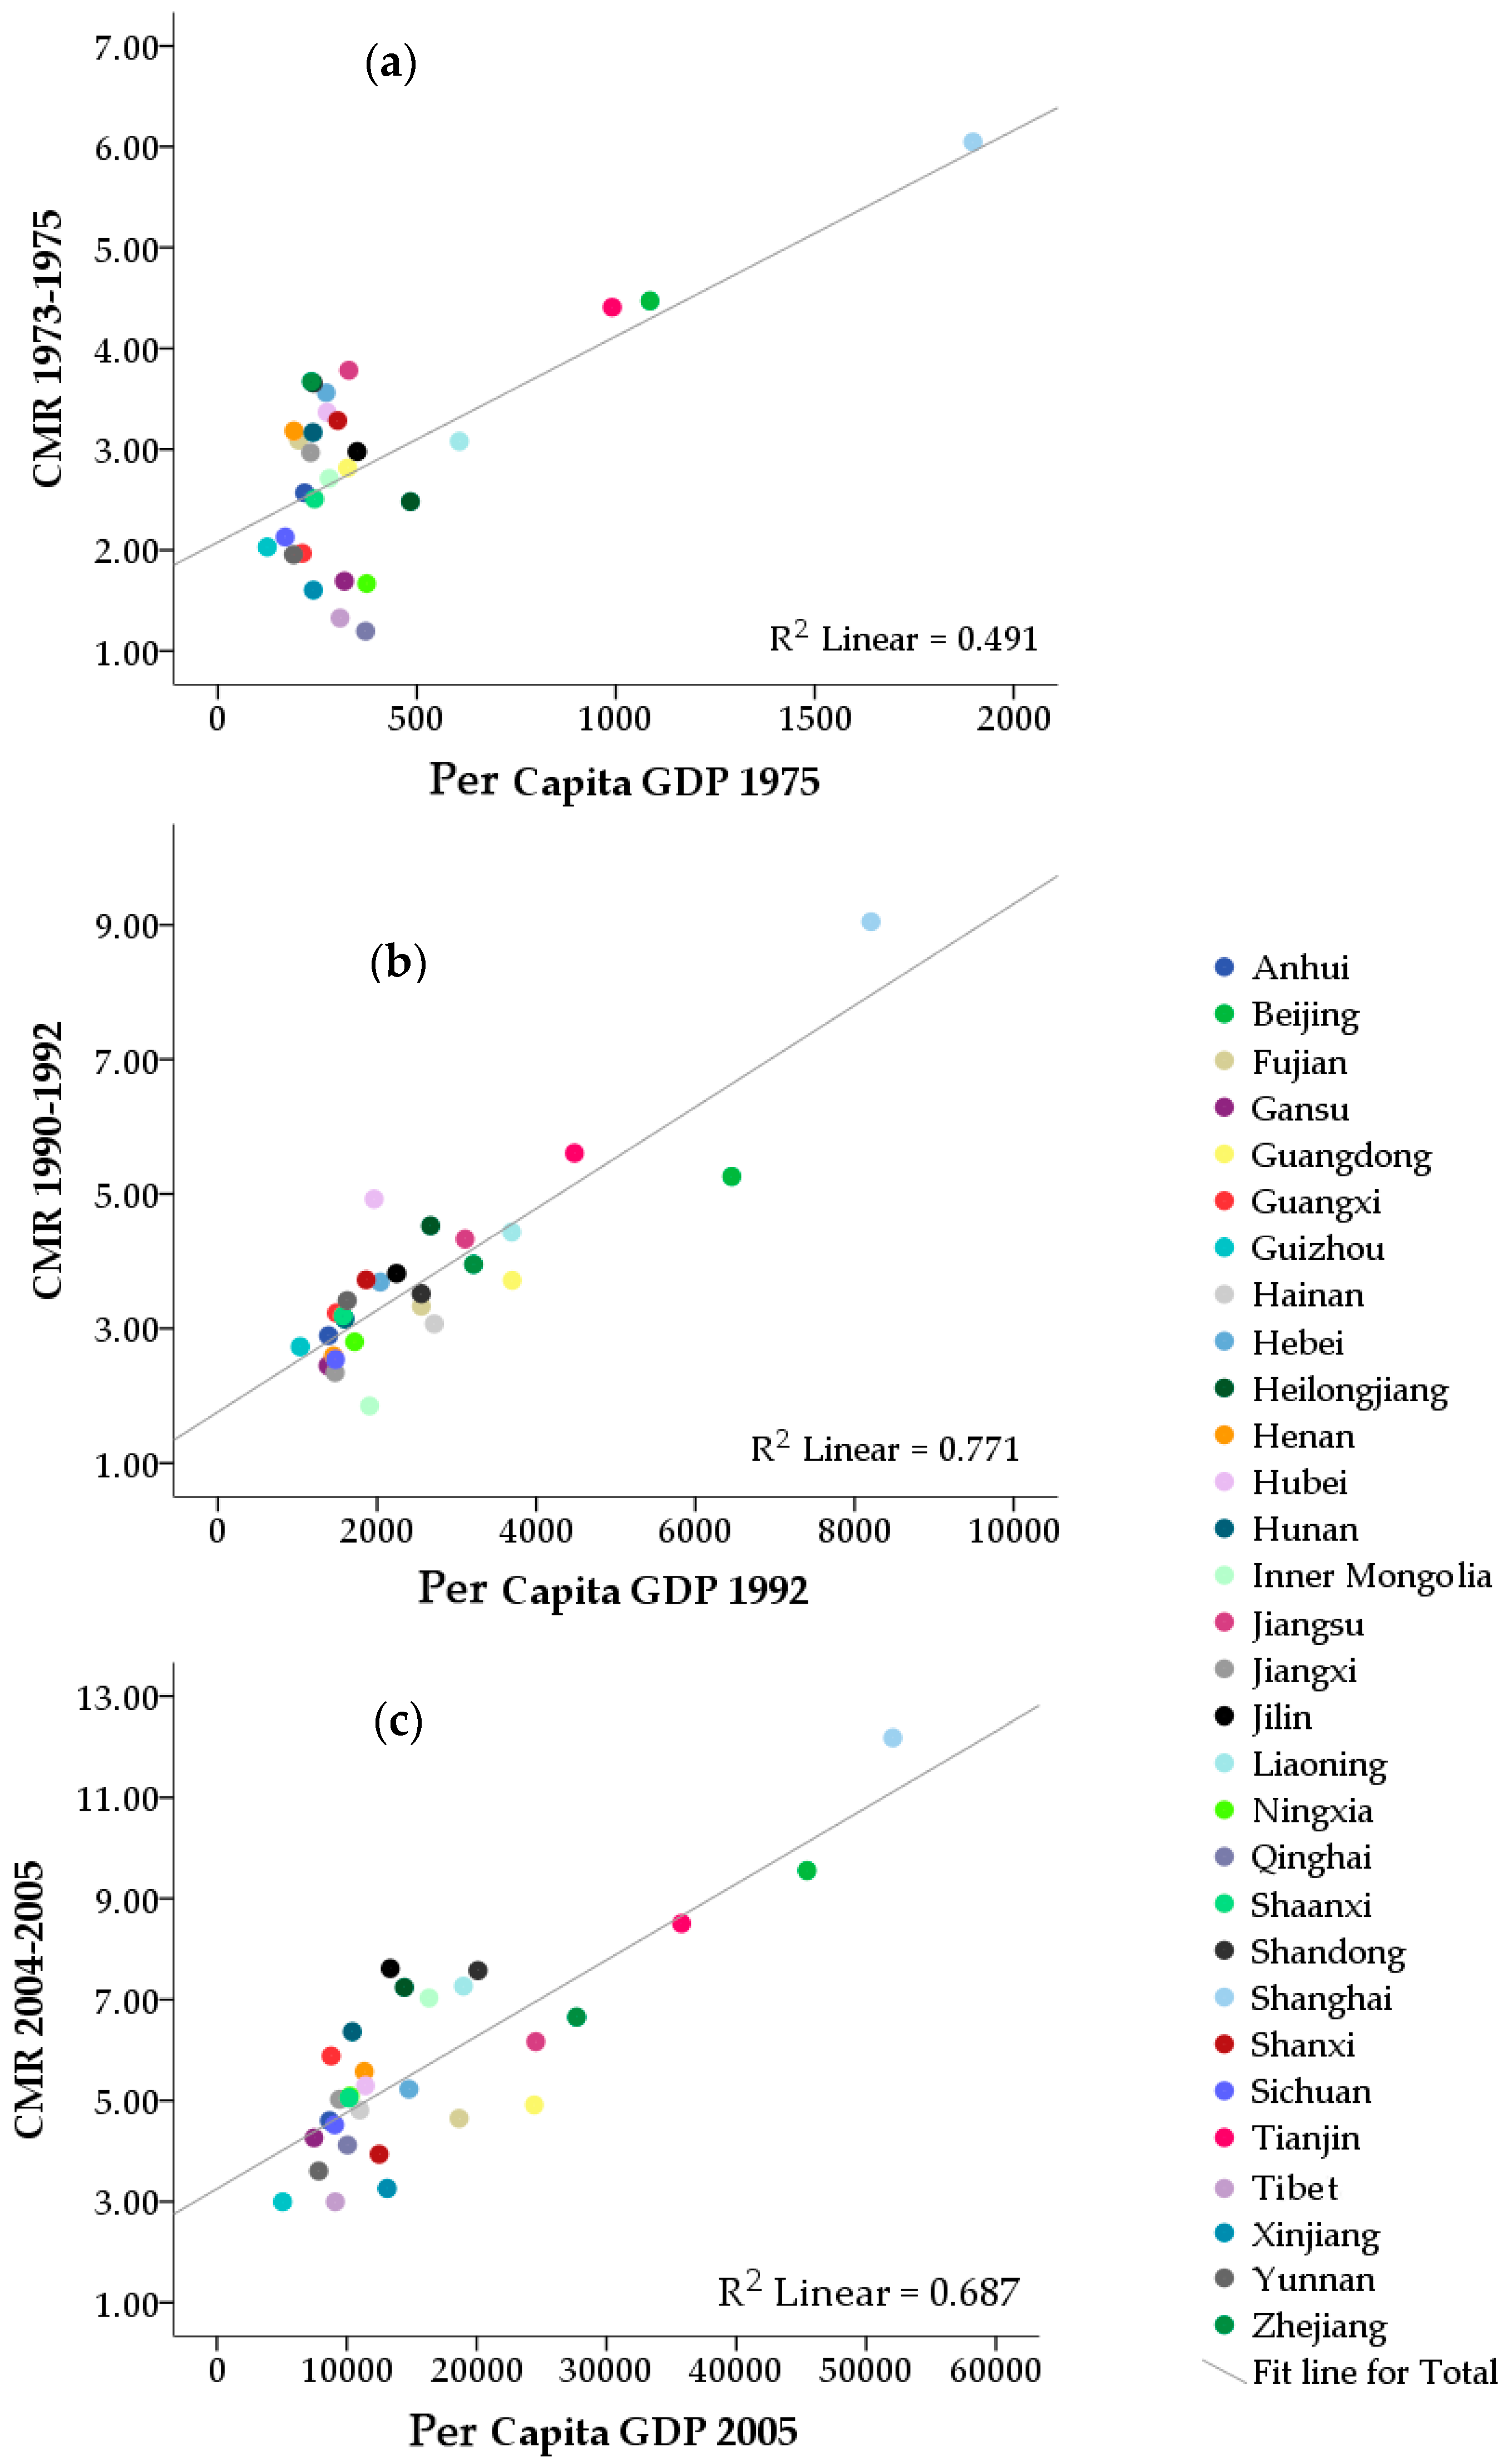
3.3. Correlation Analysis

Figure 4 shows scatterplots for the CMR of breast cancer and per capita GDP by province across each of the three death survey periods. The coefficient of determination (R2 value) is also presented. We found a moderate to high correlation between CMR of breast cancer and GDP over time.
The correlation between CMR of breast cancer and NHHCB per 10,000 people was significant at the 0.05 level for the two more recent survey periods 1990–1992 (r = 0.68) and 2004–2005 (r = 0.71), but was not significant for the period 1973–1975 (r = 0.28). The correlation between CMR of breast cancer and NPD per 10,000 people was significant across all three time periods, with the correlation coefficients being 0.40 for the period 1973–1975, 0.65 for 1990–1992, and 0.70 for 2004–2005.
Pearson correlation tests showed that there was a significant correlation between the breast cancer CMR and the average number of live births for women aged 15–64 for 1973–1975 (r = −0.82, p < 0.001), 1990–1992 (r = −0.73, p < 0.001) and 2004–2005 (r = −0.80, p < 0.001).

4. Discussion

As breast cancer is the most frequently diagnosed cancer in Chinese women, and a leading cause of cancer related death, there is a strong need for a greater understanding of the epidemiology of the disease in China. Whilst previous research has indicated that there are some distinct geographical patterns in the incidence and mortality of breast cancer in China [20], and that these patterns have changed over time [10], this study is, to our knowledge, the first to examine both temporal trends from the mid-1970s to the mid-2000s and the geographical variation in breast cancer mortality amongst Chinese women. The results of this study demonstrate that there was significant regional variation in each of the survey periods and that this regional differential had widened over time when we looked at breast cancer mortality across seven geographical regions in China.
Our results identified three important patterns. First, we found that across the country the overall mortality rate for female breast cancer increased over time (Figure 2). From the mid-1970s to early 1990s, the increase was only moderate (3.4%), but from the early 1990s to the mid-2000s, a relatively dramatic increase was observed (25.0%). An additional analysis indicates that this increasing temporal trend was significant (p < 0.001). These results are consistent with the latest data, which showed that the age-standardized female breast mortality rate in China increased by 1.1% per year from 2000 to 2011 [21]. This rise in the breast cancer mortality rate was observed across all provinces over the three study periods, and most studies also predict that this upward trend will continue in the foreseeable future [3,4,22].
Second, geographical variations in breast cancer mortality rates among Chinese women were observed for each period and increased over the three death survey periods from 1973–1975 to 2004–2005. Variation was found by province as shown in the maps of Figure 2, and by geographical region, and economic zone (Figure 3). Overall, breast cancer mortality rates were higher in large cities (Beijing, Tianjin, and Shanghai) and in the Northeast provinces than those observed in the Northwest and Southwest regions. The general trends we reported are similar to those found in previous studies [5,23], while our study also builds on the previous results by using cause of death survey data representative of the national population in each survey period and by including data from before the economic reforms that occurred in China in the late 1970s.
Lastly, we found that these temporal and spatial trends in breast cancer mortality were correlated with several social and economic measures. We found that the average per capita GDP level, and the level of medical facilities and number of practicing doctors in each province, had a positive correlation with the mortality rate of breast cancer in that province. It seems that high socioeconomic level is associated with high breast cancer mortality. This kind of association has previously been reported in China [24], but the opposite association has been found in many Western countries, with women of higher socioeconomic level having a lower mortality rate, mainly due to earlier diagnosis and more appropriate treatment, which then results in an increased breast cancer survival rate [25,26,27]. We also found that the average number of live births amongst women aged 15–64 in each province had a negative correlation with the mortality rate of breast cancer in each province, and that the average number of live births for Chinese women aged 15–64 decreased substantially over time (2.62 in 1982, 2.10 in 1990 and 1.35 in 2000, respectively). A previous meta-analysis of 14 studies showed that term birth is a protective factor for breast cancer in Chinese women, and that increasing numbers of term births will decrease the risk of breast cancer [28]. Women who were nulliparous were at increased risk of luminal breast cancer, whereas women with more than two children had a decreased risk [29]. We found that regions with a lower average number of live births, such as Beijing, Tianjin, Shanghai, had a higher CMR of breast cancer, while the regions with higher average number of live births such as Guizhou, Yunnan, Ningxia, had a lower CMR of breast cancer.
Temporal trends in breast cancer mortality can be explained by improved screening and treatment, as well as changes in exposure to risk factors. Because there is neither an organized nationwide screening program nor national breast cancer screening guidelines in China [30], changes in risk factors may contribute substantially to the temporal trends observed. In the same period in which we observed rising mortality trends for breast cancer, the GDP of China increased from 365 billion in 1978 to 18,458 billion in 2005, with an average annual economic growth rate of 11.56% [15]. The overall increase in breast cancer mortality from the mid-1970s to the mid-2000s in China is possibly a consequence of this increase in economic level in China, which then resulted in a shift in lifestyle (reduced levels of physical activity) and dietary habits (from a low-fat, high vegetable diet to a high-fat and animal protein diet) in the past few decades in China. It has been well documented internationally that higher body weight and lower levels of physical activity are associated with a greater risk of breast cancer incidence and mortality [31], and a Chinese study has also reported an association between body size, fat distribution and breast cancer incidence [32]. As a result of the increasing intake of Western style food and lack of exercise, the proportion of Chinese women who were overweight or obese increased over time from 4.6% in 1991 to 11.0% in 2011 [33]. In general, it is also likely that levels of physical activity amongst Chinese population decreased over time in the cities and more developed areas, while women in rural and less developed areas are still more likely to be undertaking more physical work than those living in more urbanized areas [34]. It is possible that these changes were another factor in the increasing number of breast cancer deaths we observed. It is also likely that the dramatic changes in reproductive history which have occurred in China (lower fertility rate and delayed first pregnancy), and especially the birth-control policies introduced in the mid-1970s, are a unique factor in this upward trend [3,35,36]. This possibility is supported by our finding that there was a negative correlation between the average number of live births and breast cancer mortality rate. The patterns in breast cancer mortality between geographical areas that we observed also reflect these changes.
As expected, we found that geographical variation in breast cancer mortality decreases as the geographical unit used increases (Figure 2 and Figure 3). The variation is largest when the analyses use province (n = 31), as a unit, is reduced substantially when the larger unit of geographical region (n = 7) is used, and is reduced even further when the whole nation is divided into three economic zones. However, the geographical variation observed was significant for all analyses no matter which geographical unit was used. The overall consistency of these results suggests these findings are reliable. Women in Western China had a lower risk of dying from breast cancer for the whole study period, while the risk ratio for women in Eastern China decreased significantly over time from higher in the first two survey periods to being closer to the national average in the most recent period. The opposite is true for Central China, with the risk increasing over time, so that, by the most recent period, it was significantly higher than the national average.
There are some possible explanations for the changes in breast cancer mortality across geographical regions that we observed. Geographical differences in cancer mortality may be the result of differences in access to cancer care, or differences in the rate of incidence of breast cancer in the area, or a combination of the two. The changing trends in breast cancer mortality over time for the three economic zones represent three typical patterns according to socioeconomic development levels. First, Eastern China includes large cities (Beijing, Shanghai and Tianjin) and coastal provinces, is an area with relatively high socioeconomic level and experienced the fastest economic growth from the economic reforms introduced in the late 1970s. As this area had a relatively high socioeconomic level even before the economic reform and the rapid growth after that, women living in Eastern China have historically had a higher risk of developing breast cancer, which resulted in higher mortality rates, as observed in the periods 1973–1975 and 1990–1992. Conversely, women in Eastern China generally have higher survival rates after diagnosis due to the fact that this area has the highest level of medical facilities in China [37], and women from advantaged areas tend to present with earlier stage disease than women from more disadvantaged areas [38]. This offsets the higher incidence rates, and leads to a reduced mortality rate close to the national average in the most recent survey period. Second, Western China includes inland provinces with historically a much lower economic development level, and which benefitted much less from the economic reforms, so that per capita GDP in Western China is less than half of that of Eastern China. As a result of this lower level of socioeconomic development, the risk of developing breast cancer was much lower among women in the west, which was likely the main reason for the lower mortality rates observed in this study for all three death survey periods. However, over time, the mortality rates in this economic zone were rising faster than in Eastern China, probably due to the generally lower level of medical facilities and lack of accessibility to top level medical care. Third, breast cancer mortality rates in Central China were generally somewhere in-between the other two economic zones, so that the mortality rates in the mid-1970s and early 1990s were similar as the national average. However, in the most recent period (2004–2005), the mortality rates became significantly higher than the national average. The constant increase in the incidence rate and the generally low survival rate with breast cancer (compared with women in more developed areas) are both contributing to the continued increase in the breast cancer mortality rate for women in Central China. Thus, while improved survival has led to a reduction in the pace of the increase in the mortality rate in areas of higher socioeconomic status such as Eastern China, the impact of the changes brought about by China’s economic development on breast cancer mortality rates is more obvious in the Western region of China, where breast cancer mortality rates have been increasing more quickly.
Our study had some possible limitations. First, although the sample sites covered by the two sampling surveys, which collected information on deaths occurred in the study years, are representative of the country as a whole [39], the population covered is relatively small and only a limited number of sites were selected from each province in the second and third national retrospective sampling death surveys [10]. Thus, the provincial mortality rates reported here may be an overestimate or underestimate for that province. Second, there were three provinces for which data was not available in the Second Survey (1990–1992), Xinjiang, Qinghai and Tibet, since most sampling counties in those provinces could not complete the survey and data were deemed invalid for analysis [12]. This may mean there is some bias in the rate for the Western area of China in that period. Furthermore, we grouped data based on where women live, thus it is possible that inferences at the geographical regional level do not transfer directly to individuals. Finally, as we acknowledged in a recent publication [21], in a country of 1.4 billion people, with a sizeable population of migrant workers (9% of the population), there are many challenges to ensuring that the mortality numerator data represents the same population at risk as the estimated resident population denominator, particularly when considering cases treated in major urban facilities and migrant workers from rural areas. The data used in this study was based on the place of permanent residence, not place of treatment. Despite these limitations, the data from the three national surveys on cause of death provides valuable information that we believe is currently underutilized [40].

5. Conclusions

We found that overall breast cancer mortality increased significantly from the mid-1970s to the mid-2000s in China. We also found that there were significant geographical variations in breast cancer mortality over the same time period and that the geographical differential had widened over time. Our findings of large differences in breast cancer mortality between geographical areas, changes in geographical patterns over time, and the correlation we observed between various economic measures and breast cancer mortality do suggest that there are differences in cancer prevention, diagnosis and care across China. If this is indeed the case, it may be possible to reverse these trends and reduce the widening geographical inequalities in breast cancer mortality with both prevention strategies, such as public health campaigns to promote healthy lifestyle choices [4] and more equitable access to diagnostic and treatment facilities.

Acknowledgments

This study is supported by a Program Grant in Fundamental Research from the Ministry of Science and Technology (Project No. 2014FY121100).

Author Contributions

Wanqing Chen and Xue Qin Yu conceived the study; Changfa Xia did the data analyses and interpreted the results under the guidance of Wanqing Chen and Xue Qin Yu; Changfa Xia made the first draft, and Xue Qin Yu and Clare Kahn revised the draft critically; Jinfeng Wang and Yilan Liao gave constructive suggestions for the modelling and writing. All authors contributed to and approved the final draft submitted.

Conflicts of Interest

The authors declare no conflict of interest.

Appendix A

Seven geographical region (Figure 1a)
Provinces in mainland China were grouped into seven geographical regions based on geographical location in this analysis:
  • North China (Beijing, Tianjin, Shanxi, Hebei, Inner Mongolia Autonomous Region)
  • Northeast China (Heilongjiang, Jilin, Liaoning)
  • East China (Shanghai, Jiangsu, Zhejiang, Anhui, Jiangxi, Shandong, Fujian)
  • Central China (Henan, Hubei, Hunan)
  • South China (Guangdong, Guangxi, Hainan)
  • Southwest China (Chongqing, Sichuan, Guizhou, Yunnan, Tibet)
  • Northwest China (Shaanxi, Gansu, Qinghai, Ningxia Hui Autonomous Region, Xinjiang Uygur Autonomous Region)
Three economic zone (Figure 1b)
According to the level and the speed of development in economic, China also been divided into three major economic zones:
The Eastern China zone includes Tianjin, Beijing, Hebei, Liaoning, Shanghai, Jiangsu, Zhejiang, Fujian, Shandong, Guangdong, and Hainan.
The Central China zone includes Shanxi, Jilin, Heilongjiang, Anhui, Jiangxi, Henan, Hubei, and Hunan.
The Western China zone includes Chongqing, Sichuan, Guizhou, Yunnan, Guangxi, Tibet, Shaanxi, Gansu, Ningxia, Inner Mongolia, Qinghai, and Xinjiang.

Appendix B

Table B1. Characteristics of the study population.
Number of DeathsPopulationPer Capita GPDNumber of DeathsPopulationPer Capita GPDNumber of DeathsPopulationPer Capita GPD
1973–19751990–19922004–2005
Province
Beijing53311,921,3851086801,521,39864581201,255,75445,444
Tianjin44110,003,046991681,213,04544811131,328,36535,783
Hebei249370,018,0762723499,461,85820402093,998,62714,782
Shanxi107432,697,7763011203,224,20518621243,149,89612,495
Inner Mongolia30611,286,804280221,189,8051906941,336,70816,331
Liaoning160552,136,2416071834,130,04536932853,921,90718,983
Jilin101934,233,7413501423,720,63122461552,035,30913,348
Heilongjiang101040,709,2504841824,022,42526721902,623,97814,434
Shanghai98516,287,70118981832,022,4058208103845,38652,060
Jiangsu312682,630,95532949211,367,74631065378,708,15724,560
Zhejiang189451,588,5532353508,855,35532124316,478,09327,703
Anhui164664,089,9792182317,985,47413902525,477,5078670
Fujian94930,708,6052031504,505,50225571543,314,82118,646
Jiangxi122241,191,6962331245,290,31614721643,265,1079440
Shandong196353,688,31024036310,323,29725565076,692,70220,096
Henan313498,471,37319128410,955,31414524908,789,05911,346
Hubei204560,725,26327450410,237,56019622915,495,82211,431
Hunan221369,870,3392392969,424,81715952674,196,17910,426
Guangdong177763,123,80532641711,227,88136992575,230,64224,438
Guangxi70635,877,3012122086,441,80814902454,164,8938788
Hainan1275,711,87432626847,327271935727,43710,998
Sichuan2811132,015,85116932212,685,42114772135,073,7079060
Guizhou72335,608,0361241485,424,9851034531,769,5715052
Yunnan81341,588,5651901975,768,51516251403,884,5357835
Tibet171,281,431307**14686200,3579114
Shaanxi89235,584,3752431484,642,55115711001,979,43410,161
Gansu36921,802,163318**13841012,370,3477477
Qinghai574,765,301371**191217412,73710,045
Ningxia804,795,6363741275,190,772171836707,64110,239
Xinjiang24115,028,025240311,106,5402477481,472,89413,108
Geographical Region
North China4847135,927,087 63916,610,311 66011,069,350
Northeast China3634127,079,232 50711,873,101 6308,581,194
East China11,785340,185,799 189350,350,065 214834,781,773
Central China7392229,066,975 108430,617,691 104818,481,060
South China2610104,712,980 65118,517,016 53710,122,972
Southwest China4364210,493,883 66723,878,939 55813,799,681
Northwest China163981,975,500 30610,939,863 3026,943,053
Economic zone
Eastern China15,893447,818,551 2661 65,475,829 287545,651,787
Central China13,363441,989,417 1883 54,860,742 180931,882,961
Western China7015339,633,488 1203 42,450,415 119926,244,335
* data not available.

Appendix C

Table C1. Age-standardized mortality rate of breast cancer by province as recorded by three mortality surveys in China: 1973–1975, 1990–1992 and 2004–2005.
CodeNameAreas197519922005
110000北京市Beijing4.323.714.73
120000天津市Tianjin4.253.764.36
130000河北省Hebei3.203.283.55
140000山西省Shanxi3.173.432.58
150000内蒙古自治区Inner Mongolia3.341.744.80
210000辽宁省Liaoning3.403.724.59
220000吉林省Jilin3.493.764.82
230000黑龙江省Heilongjiang2.854.635.69
310000上海市Shanghai4.805.035.21
320000江苏省Jiangsu3.503.223.63
330000浙江省Zhejiang3.403.023.84
340000安徽省Anhui2.562.593.38
350000福建省Fujian3.263.103.61
360000江西省Jiangxi3.072.453.62
370000山东省Shandong3.192.954.56
410000河南省Henan3.092.374.16
420000湖北省Hubei3.423.943.90
430000湖南省Hunan3.272.914.55
440000广东省Guangdong2.663.173.67
450000广西壮族自治区Guangxi2.163.074.53
460000海南省Hainan1.922.962.79
500000重庆市Chongqing2.242.202.92
510000四川省Sichuan2.242.202.92
520000贵州省Guizhou2.162.802.52
530000云南省Yunnan2.013.103.01
540000西藏自治区Tibet1.23 2.45
610000陕西省Shaanxi2.732.993.85
620000甘肃省Gansu1.882.593.82
630000青海省Qinghai1.48 4.15
640000宁夏回族自治区Ningxia2.412.614.36
650000新疆维吾尔自治区Xinjiang1.97 3.12

Appendix D

Table D1. Estimates of mortality rate ratio (RR) * and 95% confidence interval (CI) of breast cancer among Chinese women by geographical area across three time periods, 1973–1975, 1990–1992, and 2004–2005.
RR and 95% CI
1973–19751990–19922004–2005
Geographical region
Northern China1.14 (1.06–1.21)1.04 (0.96–1.13)0.96 (0.88–1.04)
Northeast China1.10 (1.03–1.18)1.31 (1.19–1.43)1.26 (1.16–1.37)
East China1.08 (1.02–1.15)1.01 (0.96–1.06)1.01 (0.96–1.06)
Central China1.08 (1.02–1.15)1.01 (0.95–1.08)1.09 (1.02–1.16)
South China0.84 (0.78–0.90)1.00 (0.92–1.08)1.01 (0.92–1.10)
Northwest China0.73 (0.69–0.78)0.82 (0.76–0.89)0.74 (0.68–0.81)
Southwest China0.79 (0.73–0.85)0.89 (0.79–1.00)0.95 (0.85–1.07)
p-value for the effect of geographical region<0.0001<0.0001<0.0001
Economic zone
East China1.11 (1.05–1.18)1.07 (1.02–1.12)1.02 (0.97–1.06)
Central China1.04 (0.98–1.10)1.02 (0.97–1.07)1.07 (1.01–1.13)
Western China0.76 (0.72–0.81)0.85 (0.80–0.91)0.88 (0.83–0.94)
p-value for the effect of economic zone<0.0001<0.0001<0.0001
* National average is set as the reference (1.00).

References

  1. Ferlay, J.; Soerjomataram, I.; Dikshit, R.; Eser, S.; Mathers, C.; Rebelo, M.; Parkin, D.M.; Forman, D.; Bray, F. Cancer incidence and mortality worldwide: Sources, methods and major patterns in GLOBOCAN 2012. Int. J. Cancer 2015, 136, E359–E386. [Google Scholar] [CrossRef] [PubMed]
  2. Chen, W.Q.; Zheng, R.S.; Zhang, S.W.; Zeng, H.M.; Zuo, T.T.; Jia, M.M.; Xia, C.F.; Zou, X.N.; He, J. Report of Cancer Incidence and Mortality in China, 2012. China Cancer 2016, 25, 1–8. [Google Scholar]
  3. Fan, L.; Zheng, Y.; Yu, K.D.; Liu, G.Y.; Wu, J.; Lu, J.S.; Shen, K.W.; Shen, Z.Z.; Shao, Z.M. Breast cancer in a transitional society over 18 years: Trends and present status in Shanghai, China. Breast Cancer Res. Treat 2009, 117, 409–416. [Google Scholar] [CrossRef] [PubMed]
  4. Fan, L.; Strasser-Weippl, K.; Li, J.J.; St Louis, J.; Finkelstein, D.M.; Yu, K.D.; Chen, W.Q.; Shao, Z.M.; Goss, P.E. Breast cancer in China. Lancet Oncol. 2014, 15, e279–e289. [Google Scholar] [CrossRef]
  5. Shi, X.J.; Au, W.W.; Wu, K.S.; Chen, L.X.; Lin, K. Mortality characteristics and prediction of female breast cancer in China from 1991 to 2011. Asian Pac. J. Cancer Prev. 2014, 15, 2785–2791. [Google Scholar] [CrossRef] [PubMed]
  6. Li, C.; Yu, C.; Wang, P. An age-period-cohort analysis of female breast cancer mortality from 1990–2009 in China. Int. J. Equity Health 2015. [Google Scholar] [CrossRef] [PubMed]
  7. Zheng, Y.; Wu, C.X.; Wu, F. Status and trends of breast cancer mortality in Chinese females. Chin. J. Prev. Med. 2011, 45, 150–154. (In Chinese) [Google Scholar]
  8. Peng, X.D.; Peng, L.; Wu, K.S. An Analysis of Spatial Risk Factors on Breast Cancer by Using Geographic Information System. China Cancer 2015, 24, 805–810. (In Chinese) [Google Scholar]
  9. Fei, X.; Wu, J.; Kong, Z.; Christakos, G. Urban-rural disparity of breast cancer and socioeconomic risk factors in China. PLoS ONE 2015. [Google Scholar] [CrossRef] [PubMed]
  10. Zhou, M.G.; Wang, X.F.; Hu, J.P.; Li, G.L.; Chen, W.Q.; Zhang, S.W.; Wan, X.; Wang, L.J.; Xiang, C.; Hu, Y.S.; et al. Geographical distribution of cancer mortality in China, 2004–2005. Chin. J. Prev. Med. 2010, 44, 303–308. (In Chinese) [Google Scholar]
  11. The National Cancer Control Office of the Ministry of Health. China Cancer Death Survey; People’s Medical Publishing House: Beijing, China, 1980. (In Chinese)
  12. National Office for Cancer Prevention and Control. China Cancer Death Survey (1990–1992); People’s Medical Publishing House: Beijing, China, 2008. (In Chinese)
  13. Chen, Z. The Third National Retrospective Sampling Survey of Death Causes in China; China Union Medical University Press: Beijing, China, 2008. (In Chinese) [Google Scholar]
  14. Department of Comprehensive Statistics of National Bureau of Statistics. China Compendium of Statistics 1949–2008; China Statistics Press: Beijing, China, 2010. (In Chinese)
  15. National Bureau of Statistics of China. National Data. Available online: http://data.stats.gov.cn/easyquery.htm?cn=C01 (accessed on 17 May 2016).
  16. Ministry of Health of the People’s Republic of China. China Health Statistics Yearbook, 2006; China Union Medical University Press: Beijing, China, 2006. (In Chinese)
  17. Rubin, M.S.; Clouston, S.; Link, B.G. A fundamental cause approach to the study of disparities in lung cancer and pancreatic cancer mortality in the United States. Soc. Sci. Med. 2014, 100, 54–61. [Google Scholar] [CrossRef] [PubMed]
  18. Yu, X.Q.; Luo, Q.; Kahn, C.; O’Connell, D.L.; Houssami, N. Temporal trends show improved breast cancer survival in Australia but widening urban-rural differences. Breast 2015, 24, 524–527. [Google Scholar] [CrossRef] [PubMed]
  19. Yu, X.Q.; Luo, Q.; Smith, D.P.; O’Connell, D.L.; Baade, P.D. Geographic variation in prostate cancer survival in New South Wales. Med. J. Aust. 2014, 200, 585–590. [Google Scholar] [CrossRef] [PubMed]
  20. Zheng, Y.; Wu, C.; Zhang, M. The epidemic and characteristics of female breast cancer in China. China Oncol. 2013, 23, 561–569. (In Chinese) [Google Scholar]
  21. Chen, W.; Zheng, R.; Baade, P.D.; Zhang, S.; Zeng, H.; Bray, F.; Jemal, A.; Yu, X.Q.; He, J. Cancer statistics in China, 2015. CA Cancer J. Clin. 2016, 66, 115–132. [Google Scholar] [CrossRef] [PubMed]
  22. Linos, E.; Spanos, D.; Rosner, B.A.; Linos, K.; Hesketh, T.; Qu, J.D.; Gao, Y.T.; Zheng, W.; Colditz, G.A. Effects of reproductive and demographic changes on breast cancer incidence in China: A modeling analysis. J. Natl. Cancer Inst. 2008, 100, 1352–1360. [Google Scholar] [CrossRef] [PubMed]
  23. Shi, X.J.; Zhang, X.J.; Wang, F.S.; Jiang, J.D.; Lin, K. Analysis on mortality distribution of female breast cancer in China, 1991–2010. Chin. J. Dis. Contr. Prev. 2012, 16, 743–747. (In Chinese) [Google Scholar]
  24. Yang, L.; Sun, T.; Yuan, Y.; Wang, N. Relationship between female breast cancer incidence and the socioeconomic status in Beijing. Chin. J. Oncol. 2014, 36, 713–716. (In Chinese) [Google Scholar]
  25. Yu, X.Q. Socioeconomic disparities in breast cancer survival: Relation to stage at diagnosis, treatment and race. BMC Cancer 2009. [Google Scholar] [CrossRef] [PubMed]
  26. Walsh, P.M.; Byrne, J.; Kelly, M.; McDevitt, J.; Comber, H. Socioeconomic disparity in survival after breast cancer in ireland: Observational study. PLoS ONE 2014. [Google Scholar] [CrossRef] [PubMed]
  27. Yu, X.Q.; O’Connell, D.L.; Gibberd, R.W.; Armstrong, B.K. Assessing the impact of socio-economic status on cancer survival in New South Wales, Australia 1996–2001. Cancer Causes Contr. 2008, 19, 1383–1390. [Google Scholar] [CrossRef] [PubMed]
  28. Jin, Z.; Yang, Y.H.; Mei, Y.; Cheng, G.W. Relationship between Birth Number and Breast Cancer Risk of Chinese Female: A Meta-analysis. Chin. J. Evid.-Based Med. 2015, 15, 1148–1152. (In Chinese) [Google Scholar]
  29. Turkoz, F.P.; Solak, M.; Petekkaya, I.; Keskin, O.; Kertmen, N.; Sarici, F.; Arik, Z.; Babacan, T.; Ozisik, Y.; Altundag, K. Association between common risk factors and molecular subtypes in breast cancer patients. Breast 2013, 22, 344–350. [Google Scholar] [CrossRef] [PubMed]
  30. Wang, Q.; Lian, Z.Q. Current status and challenges of screening and early diangosis for breast cancer in China. J. Chin. Oncol. 2011, 17, 321–324. (In Chinese) [Google Scholar]
  31. Davies, N.J.; Batehup, L.; Thomas, R. The role of diet and physical activity in breast, colorectal, and prostate cancer survivorship: A review of the literature. Br. J. Cancer 2011, 105 (Suppl. 1), S52–S73. [Google Scholar] [CrossRef] [PubMed]
  32. Shu, X.O.; Jin, F.; Dai, Q.; Shi, J.R.; Potter, J.D.; Brinton, L.A.; Hebert, J.R.; Ruan, Z.; Gao, Y.T.; Zheng, W. Association of body size and fat distribution with risk of breast cancer among Chinese women. Int. J. Cancer 2001, 94, 449–455. [Google Scholar] [CrossRef] [PubMed]
  33. Mi, Y.J.; Zhang, B.; Wang, H.J.; Yan, J.; Han, W.; Zhao, J.; Liu, D.W.; Tian, Q.B. Prevalence and Secular Trends in Obesity Among Chinese Adults, 1991–2011. Am. J. Prev. Med. 2015, 49, 661–669. [Google Scholar] [CrossRef] [PubMed]
  34. He, M.; Guo, Q.; Hu, G. Reversed urban-rural differences in breast cancer mortality (China, 2002–2008). Breast Cancer Res. Treat 2011, 126, 231–234. [Google Scholar] [CrossRef] [PubMed]
  35. Huang, Z.; Wen, W.; Zheng, Y.; Gao, Y.T.; Wu, C.; Bao, P.; Wang, C.; Gu, K.; Peng, P.; Gong, Y.; et al. Breast cancer incidence and mortality: Trends over 40 years among women in Shanghai, China. Ann. Oncol. 2016, 27, 1129–1134. [Google Scholar] [CrossRef] [PubMed]
  36. Wang, Z.; Bao, J.; Yu, C.; Wang, J.; Li, C. Secular Trends of Breast Cancer in China, South Korea, Japan and the United States: Application of the Age-Period-Cohort Analysis. Int. J. Environ. Res. Public Health 2015, 12, 15409–15418. [Google Scholar] [CrossRef] [PubMed]
  37. Zeng, H.; Zheng, R.; Guo, Y.; Zhang, S.; Zou, X.; Wang, N.; Zhang, L.; Tang, J.; Chen, J.; Wei, K.; et al. Cancer survival in China, 2003–2005: A population-based study. Int. J. Cancer 2015, 136, 1921–1930. [Google Scholar] [CrossRef] [PubMed]
  38. Li, J.; Zhang, B.N.; Fan, J.H.; Pang, Y.; Zhang, P.; Wang, S.L.; Zheng, S.; Zhang, B.; Yang, H.J.; Xie, X.M.; et al. A nation-wide multicenter 10-year (1999–2008) retrospective clinical epidemiological study of female breast cancer in China. BMC Cancer 2011. [Google Scholar] [CrossRef] [PubMed]
  39. Yang, G.; Hu, J.; Rao, K.Q.; Ma, J.; Rao, C.; Lopez, A.D. Mortality registration and surveillance in China: History, current situation and challenges. Popul. Health Metr. 2005. [Google Scholar] [CrossRef] [PubMed] [Green Version]
  40. Zhao, Z.; Chen, W.; Zhao, J.; Zhang, X. Mortality in China: Data Sources, Trends and Patterns. In Analysing China’s Population; Attané, I., Gu, B., Eds.; Springer: New York, NY, USA, 2014; pp. 205–225. [Google Scholar]
Figure 1. Schematic diagram of the division of China into the geographical units used for analyses showing (a) the seven geographical regions; and (b) three economic zones. Map source: Sino Maps Press.
Ijerph 13 00963 g001
Figure 2. Female breast cancer age-standardized morality rates (ASMRs) by province (excluding Taiwan, Hong Kong, Macau) as recorded by three mortality surveys: (a) 1973–1975 the First National Survey of Death Causes; (b) 1990–1992 the Second National Retrospective Sampling Survey of Death Causes, with Xinjiang, Qinghai, Tibet not included; and (c) 2004–2005 the Third National Retrospective Sampling Survey of Death Causes. Map source: Sino Maps Press.
Ijerph 13 00963 g002
Figure 3. Rate ratios (RR) and 95% confidence intervals for female breast cancer mortality in China by geographical region and economic zone across three time periods, 1973–1975, 1990–1992 and 2004–2005, with the national average being the reference (1.00). * p-value for the effect of geographical unit.
Ijerph 13 00963 g003
Figure 4. Scatterplot for the crude mortality rate (CMR) of breast cancer and per capita GDP by province. The linear relation between breast cancer CMR over the period: (a) 1973–1975 and per capita GDP for 1975 across 30 provinces; (b) 1990–1992 and per capita GDP for 1992 across 27 provinces; (c) 2004–2005 and per capita GDP for 2005 across 30 provinces.
Ijerph 13 00963 g004

