Article

Airborne Particulate Matter in School Classrooms of Northern Italy

1
Dipartimento di Scienza e Alta Tecnologia, Università degli Studi dell'Insubria, via Vallegio 11, Como 22100, Italy
2
Dipartimento di Scienze Biomediche e Cliniche "L. Sacco", Università degli Studi di Milano, via G.B. Grassi 74, Milano 20157, Italy
*
Author to whom correspondence should be addressed.
Int. J. Environ. Res. Public Health 2014, 11(2), 1398-1421; https://doi.org/10.3390/ijerph110201398
Submission received: 29 November 2013 / Revised: 23 December 2013 / Accepted: 18 January 2014 / Published: 27 January 2014

Abstract

:
Indoor size-fractioned particulate matter (PM) was measured in seven schools in Milan, to characterize their concentration levels in classrooms, compare the measured concentrations with the recommended guideline values, and provide a preliminary assessment of the efficacy of the intervention measures, based on the guidelines developed by the Italian Ministry of Healthand applied to mitigate exposure to undesirable air pollutants. Indoor sampling was performed from Monday morning to Friday afternoon in three classrooms of each school and was repeated in winter 2011–2012 and 2012–2013. Simultaneously, PM2.5 samples were also collected outdoors. Two different photometers were used to collect the PM continuous data, which were corrected a posteriori using simultaneous gravimetric PM2.5 measurements. Furthermore, the concentrations of carbon dioxide (CO2) were monitored and used to determine the Air Exchange Rates in the classrooms. The results revealed poor IAQ in the school environment. In several cases, the PM2.5 and PM10 24 h concentrations exceeded the 24 h guideline values established by the World Health Organization (WHO). In addition, the indoor CO2 levels often surpassed the CO2 ASHRAE Standard. Our findings confirmed that important indoor sources (human movements, personal clouds, cleaning activities) emitted coarse particles, markedly increasing the measured PM during school hours. In general, the mean PM2.5 indoor concentrations were lower than the average outdoor PM2.5 levels, with I/O ratios generally <1. Fine PM was less affected by indoor sources, exerting a major impact on the PM1–2.5 fraction. Over half of the indoor fine particles were estimated to originate from outdoors. To a first approximation, the intervention proposed to reduce indoor particle levels did not seem to significantly influence the indoor fine PM concentrations. Conversely, the frequent opening of doors and windows appeared to significantly contribute to the reduction of the average indoor CO2 levels.

1. Introduction

The inhabitants of industrialized countries spend more than 90% of their time in indoor environments, where some air pollutants can reach levels far greater than those found outdoors [1]. As a consequence, in recent years, the Indoor Air Quality (IAQ) of residential buildings and workplaces has become an increasing interest for scientists and the public. Moreover, specific guidelines were recently developed by the World Health Organization (WHO) [2].
Indoor air pollution is of significant concern due to the numerous potential health hazards it presents to a large fraction of the population, including susceptible groups such as children, the elderly or people affected by chronic diseases [3]. Therefore, a good IAQ in homes, offices, and schools is crucial to ensure public wellbeing, as the presence of various indoor stressors can lead to short-term and long-term adverse effects [4].
Indoor air pollution is the result of physical, chemical and biological factors that are often present simultaneously and is determined by the local outdoor air, specific building characteristics and furnishings, ventilation systems, and human and indoor activities [5,6].
Schools in particular represent an important microenvironment, and the promotion of good IAQ in schools is of special relevance because the majority of children in Europe spend at least 30% of their week-days inside school buildings; furthermore, children are exposed to greater amounts of air pollution because they breath higher volumes of air in comparison with adults due to their low body weight and developing immune systems [7].
The importance of IAQ in school environments has been underlined by a large number of studies worldwide [5,6,8,9]. Poor IAQ in classrooms can increase the possibility of health problems for occupants, in addition to reducing scholarly performance, the attendance of students and ambient comfort [9], whereas good air quality can enhance children’s concentration as well as teacher productivity [10].
Particulate matter (PM) is one of the most common pollutants that could potentially reduce air quality in classrooms. Indoor PM levels derive from both indoor and outdoor sources and are influenced by numerous variables, such as air exchange rates and infiltration processes, outdoor air pollution levels, the type and intensity of indoor activities, and the aerodynamic diameters of the particles [11]. Although in school buildings many principal indoor PM sources, such as smoking and cooking, are not usually present, several studies have demonstrated that exposure to airborne particles in classrooms can nonetheless be high [11,12,13,14]. This may be due to: (a) insufficient and inadequate ventilation, especially in winter; (b) infrequently cleaned indoor surfaces; and (c) a large number of students in relation to the room area and volume, whose movements cause the re-suspension of settled particles. Some authors have determined that re-suspension is a significant factor affecting indoor particle concentrations, with suspension rates increasing with particle size; this phenomenon is particularly relevant for particles >1 µm and is even more important for particles in the 5–10 µm range [15]. The presence of children and their movements can also affect indoor PM levels through the interception of personal clouds (primarily comprising coarse particles) recorded by the PM sampling devices. Fromme et al. found an average indoor PM2.5 concentration higher than the corresponding outdoor level in a German primary school [12]. Similar findings have been confirmed by a Belgian survey [16]. Oeder et al. reported indoor PM10 concentrations 5 times higher than outdoor levels for six schools in Munich [17].
In Italy a prevention program for indoor environments is provided in the guidelines developed by the Ministry of Health “Schema di linee di indirizzo per la prevenzione nelle scuole dei fattori di rischio indoor per allergie e asma (Italian Ministry of Health, 2010) [18]. In this context, the Ministry of Health has promoted the “Indoor school” project (CCM 2010) whose main objective was the implementation of these guidelines.
The first phase of the project involved 29 public schools of Milan and assessed the knowledge of the school principals on issues related to IAQ and building characteristics of the schools through a questionnaire. In the second phase seven schools were selected, considering the year of construction, the characteristics of the schools and the traffic exposure, to assess the indoor environment by measurement of physical characteristics, chemical pollutants and biological agents and to assess its impact on health through questionnaires and clinical tests.
The primary aims of the present paper were to investigate the PM mass concentrations in elementary and secondary schools in Milan to evaluate the impact of indoor activities or outdoor sources on these levels, and to compare the measured indoor concentrations with recommended IAQ values.
Furthermore, the efficacy of some intervention measures promoted to improve IAQ in school environments was assessed. Indeed, to date, only a limited number of surveys have tackled the problem of assessing PM exposure following risk mitigation interventions. Thus, a preliminary analysis of the measures undertaken to reduce the exposure of school occupants to airborne pollutants will be proposed.

2. Materials and Methods

2.1. Study Design

Airborne particulate samples (as Total Suspended Particulates (TSP), PM10, PM5, PM2.5, PM1, PM0.5 and particles in the size ranges 0.3–0.5–1–2.5–5–10–>10 μm) were obtained from seven selected schools (three primary schools and four secondary schools) in the urban area of Milan, a large metropolitan city of 1,345,000 inhabitants located in the center of the Po Valley, which is the most industrialized and populated area of Italy.
As depicted in Figure 1, the school buildings identified with the initials S1 to S7 were distributed around the city center. S6 was located within the so-called “Area C” a limited traffic zone located in the center of Milan that prohibits the circulation of diesel cars Euro 0, 1, 2 and 3, while a ticket is required for vehicles meeting the other Euro standards. Schools S2 and S7 were just outside this area and the other four schools were located in suburban areas at a maximum distance of 7 kilometers from the center. More details are reported in Table 1.
Figure 1. Location of study schools (S1 to S7).
Ijerph 11 01398 g001
The selected schools were investigated during two sampling campaigns; the first (SC1) from November 2011 to March 2012 and the second (SC2) during the following winter, from November 2012 to February 2013. School S6 was monitored only during winter 2011–2012. Moreover, prior to the start of SC2, intervention measures were proposed in four schools (S1, S2, S4 and S5) to improve the IAQ in classrooms, through meetings with school principals, teachers and pupils, by the implementation of the guidelines developed by the Italian Ministry of Health (Italian Ministry of Health, 2010) [18]. The measures suggested daily cleaning of all classroom surfaces (blackboards, desks, chairs) with damp floor cloths, the cleaning of floors with vacuum cleaners equipped with High Efficiency Particulate Air Filters (HEPA), and ensuring adequate ventilation rates through the frequent opening of doors and windows. A limitation of the study is that no information about time-activity patterns were available, thus making the interpretation of results somewhat uncertain.
In every building, the measurements were conducted once for each monitoring session over five consecutive days during the school week, from Monday morning (8/8:30 AM) to Friday afternoon (4/4:30 PM), following a detailed operating protocol. A pilot study lasting two days was conducted prior to the start of sampling to evaluate the sampling protocols for potential sources of error.
Within each school, the PM2.5 indoor samples were collected in the same three classrooms during both sampling sessions. Furthermore, in some of the investigated rooms (8 classrooms during SC1 and 12 during SC2), airborne particles within 6 size intervals ranging from 0.3 µm to particles >10 µm were also monitored. All the rooms were naturally ventilated and were provided with at least one blackboard with chalk. Table 1 summarizes some information about the classrooms where the measurements have been performed. Sampling devices were placed at the same sampling site in classrooms, away from blackboards, at a distance of over 50 cm from walls and approximately 1 m above the ground, which corresponded to the breathing zone of the occupants. Simultaneously, in each school, PM2.5 air samples were also collected outdoors following the same sampling protocol but using environmental protective cases to shield the instruments against rainfall (Figure 2).
Furthermore, the indoor and outdoor concentrations of carbon dioxide (CO2) were collected and used to determine the Air Exchange Rates (AERs) in classrooms. AERs were then employed to estimate the outdoor air supply rates per person (Qp) using the class volumes and the average number of students occupying the rooms [19].
All the weekly concentrations are referred to an average exposure time of 5-days (5-d), from Monday morning to Friday afternoon.
Figure 2. The indoor (a) and outdoor (b) sampling site. The PM and CO2 monitors are showed.
Ijerph 11 01398 g002

2.2. Sampling Methods

2.2.1. PM

Continuous measurements of indoor and outdoor PM2.5 with a sampling interval of 1 min were performed using a nephelometer (DustTrak TM II Aerosol Monitor Model 8530, TSI Inc., Shoreview, MN, USA) operating at 3 L/min and equipped with a size-selective impactor for PM2.5 (Figure 2).
Table 1. Specific school and room characteristics, number of occupants and average occupancy of classrooms; e.s. = elementary school, s.s. = secondary school, s.n.d. = sampling not done.
SchoolType of SiteRoomClassroom Grade—Age of ChildrenFloor and Direction of ClassroomsFloor Area (m2)Room Volume (m3)Number of Students aOccupancy (N Person/100 m2)
SC1SC2SC1SC2
S1 (s.s.)Suburban, at about 100 m from a main road (Viale Enrico Fermi)R1Second grade—12y (SC1); third grade—13y (SC2)First floor, on the schoolyard46.6140.022.625.04854
R246.8140.525.024.05351
R348.0144.024.225.05052
S2 (e.s.)Urban (just outside Area C)R1Third grade—8y (SC1); fourth grade —9y (SC2)Second floor, on the schoolyard61.7271.417.619.02931
R264.0281.418.217.62828
R364.0281.417.619.02830
S3 (s.s.)SuburbanR1First grade—11y (SC1); second grade —12y (SC2)Ground floor, on the schoolyard49.9149.622.422.24544
R2Second grade—12y (SC1); third grade—13y (SC2)46.2143.024.623.85352
R3First grade—11y (SC1); second grade —12y (SC2)Ground floor, on a private street58.9176.822.820.63935
S4 (e.s.)Suburban, at about 1 Km from a highway (A51)R1Fourth grade—9y (SC1); fifth grade—10y (SC2)Ground floor, on the schoolyard49.7159.022.220.84542
R249.7159.020.823.04246
R349.7159.020.222.24145
S5 (s.s.)SuburbanR1First grade—11y (SC1); second grade—12y (SC2)First floor, on the schoolyard41.4132.522.820.65550
R2Second floor, on the schoolyard43.2138.021.620.65048
R3Third floor, on the school yard44.2141.516.819.23843
S6 (s.s.)Urban (in Area C)R1Second grade—12y (SC1)Second floor, on the schoolyard33.0108.918.0 55
R254.7180.024.6s.n.d.45s.n.d.
R335.8118.026.6 74
S7 (e.s.)Urban (just outside Area C)R1Fourth grade—9y (SC1); first grade—6y (SC2)First floor, on the schoolyard57.9254.515.821.22737
R2Fourth grade—9y (SC1); fifht grade—10y (SC2)Second floor, on the schoolyard48.0192.024.024.85052
R348.0192.019.020.44043
Note: a Average number of students occupying the classrooms during the sampling week.
After each sampling, the impactors were cleaned and greased, the instrument was zeroed following the manufacturer’s instructions, and a pre- and post- calibration of the flow rate was conducted using a primary standard bubble-meter (Mini-Buck Calibrator M30, Buck Co., Orlando, FL, USA) to improve the accuracy of the sampling volume estimates and verify that considerable flux variations did not occur during sampling (<5%).
The collection of PM2.5 on internal filters (PTFE membranes with a 2 µm pore size and 37 mm diameter) was conducted in every sampling session to assess the accuracy of the instrument and to correct the data a posteriori. Indeed, the factory calibration factor cannot be used to obtain accurate data when the analyzed particulates exhibit different morphologies, size distributions and chemical compositions as well as densities that differ significantly from the standard ISO 12103-1, A1 test dust. Because urban particulates in Milan are typically less dense than standard dust [20], a significant overestimation of concentrations is possible. This hazard has been addressed in the literature, which notes that PM levels measured by photometers may be 2-5 times greater than the reference gravimetrical method and that the differences increase when the ultrafine fraction predominates [21].
A photometer (OPC, Lighthouse 3016-IAQ, Fremont, CA, USA) was also used to collect continuous measurements of size-fractioned PM (PM0.5, PM1, PM2.5, PM5, PM10 and TSP) and airborne particles within the size ranges 0.3–0.5–1–2.5–5–10–>10 µm (Figure 2).
The PM2.5 mass concentrations determined by the OPC with a sampling interval of 2.5 minutes were corrected a posteriori with the PM2.5 gravimetric data obtained using the nephelometer. The same correction factor was also used to correct the PM optical data assuming the same density for PM2.5 and all other PM fractions. Thus, the mass concentrations of the other PM classes are not expected to be as accurate as those of PM2.5. If gravimetric sampling in the same room was not possible, the average gravimetric data collected in the other two classrooms of the same school was used for the correction.

2.2.2. CO2

Indoor CO2 levels were monitored with a high sampling frequency (2.5 min) using a non-dispersive infrared analyzer (GE sensing Telaire 7001, Goleta, CA, USA) with a battery-operated data logger (Hobo H8/U12; Onset Computer Inc., Pocasset, MA, USA) (Figure 2) to assess the short-term variations and differences between school hours and other periods.
Before and after each sampling, all the monitors were set to zero through the flux of N2 at 0.5 bar, and the calibration was verified in a glove bag with a span gas bottle (1,000 ppm). Data were corrected a posteriori only when the accuracy exceeded the ± 10% range.

2.3. Analytical Procedures

The mass of PM2.5 collected on membrane filters was determined gravimetrically following the standard operating procedure. Before weighing, each filter was conditioned at 50% ± 5% relative humidity and 20 °C ± 1 °C for a minimum of 24 hours in a climatic cabinet (Activa Climatic Cabinet, Acquaria; Lacchiarella, Milan, Italy). The filters were weighed three times (every 20′′) by a micro-balance with a precision of 1 µg (Mettler M3, W. Pabisch spa, Milan, Italy), ensuring a standard deviation ≤ 3 µg. An electrical C-shaped ionizer (HAUG GmbH & CO. KG, Osnabruck, Germany) was used to eliminate electrostatic charges from the filter surfaces. This procedure was repeated before and after each sampling, and the mass of the PM was determined by differential weighing. Two laboratory blanks were always weighed under the same conditions to verify possible anomalies during the conditioning. Prior to the analysis, the micro-balance was auto-calibrated, and the calibration check was performed using certified standard weights of 1 and 100 mg, allowing deviations from the true value ≤ 3 µg.

2.4. Data Analysis

The average indoor-generated PM2.5 concentration (Cig) was estimated though a regression analysis of the indoor (Ci) versus outdoor (Co) gravimetrical concentrations. We chose to use the gravimetrical data collected by the nephelometers due to their greater accuracy relative to the optical data. Our model was based on the following Equation [22]:
Ci = Cog + Cig = FiCo + Cig
The slope of the regression estimates the infiltration factor (Fi), while the intercept estimates the Cig. Furthermore, the outdoor-generated average value (Cog) was estimated as the difference between the total indoor PM2.5 level and the corresponding fraction of Cig.
Indoor-outdoor AERs were estimated using the tracer gas decay technique employing occupant-generated CO2 as a tracer gas to estimate the ventilation rate after occupants left the building [19]. Specifically, the decay rate of metabolic CO2 was observed at the end of lessons, when no occupants were present in the rooms and the windows and doors were closed (typically after 5:30/6:00 PM). The AERs were estimated for each classroom when a good exponential decay curve was observed.
Descriptive statistics and other statistical analysis parameters were determined using the SPSS package (SPSS Inc., Chicago, IL, USA). The Gaussian distribution of the variables was verified by the Kolmogorov-Smirnov test. The correlations between the variables were expressed by Spearman correlation coefficients because the continuous data distribution was neither normal nor log-normal.
The differences between the average values collected during different time periods and between the 5-d average pre- and post-intervention concentrations were analyzed by the paired t-test, as the data sets exhibited a normal distribution.

3. Results

Table 1 summarizes the specific room characteristics and the average number of people occupying the classrooms during the sampling weeks. The occupancy of every monitored classroom, in terms of number of people per 100 m2, was calculated.
The weather conditions—rainfall, relative humidity and wind speed—collected by the fixed monitoring stations of the Regional Agency for Prevention and Environment of Lombardy in the same weeks over which the indoor measurements were performed are outlined in Table 2.
Descriptive statistics for the 5-d values of all the PM fractions collected during both sampling campaigns and throughout the survey are provided in Table 3. The indoor and outdoor CO2 values are also reported. During SC1, 1.9% of the indoor continuous CO2 data were underestimated due to the use of data loggers with a maximum recordable concentration of 2,485 ppm.

3.1. Indoor and Outdoor PM2.5 Levels

In general, the 5-d mean indoor PM2.5 concentration measured in the school environments was lower than the average outdoor PM2.5 level (Table 3). This trend was observed in all of the schools, with the exception of school S1 during the first sampling campaign, and, to a lesser extent, schools S2 and S4 during the second campaign, in which the 5-d indoor PM2.5 levels were higher (33.8 µg/m3, 13.5 µg/m3 and 31.6 µg/m3, respectively) than the associated outdoor mean concentrations (23.1 µg/m3, 12.0 µg/m3 and 27.3 µg/m3, respectively).
The ratios between the 5-d indoor and outdoor PM2.5 levels were calculated for every monitored classroom and ranged from 0.48 to 1.50 (mean = 0.83, median = 0.73).
Table 2. Summary of the 5-d weather conditions during the experimental campaigns; n.a. = not available, s.n.d. = sampling not done.
Rainfall (mm) a% RHWind Speed (m/s)
SchoolSC1SC2SC1SC2SC1SC2
S117.6088.078.11.51.0
S2034.478.684.60.92.2
S35.4n.a.92.755.51.21.1
S405.886.984.61.21.3
S50064.288.81.31.3
S60s.n.d.55.3s.n.d.1.6s.n.d.
S70649.875.31.31.7
Total 2346.273.677.81.31.4
Note: a mm of cumulative rainfall during every sampling week.
Figure 3. Linear regression between the 5-d gravimetrical outdoor PM2.5 concentrations (Co) and the corresponding indoor levels (Ci) for every school building during both monitoring sessions.
Ijerph 11 01398 g003
The indoor and outdoor levels showed quite good correlations, as the Spearman’s coefficients between the indoor optical data and the corresponding outdoor concentrations for each classroom during both sampling campaigns were <0.5 for 4 out of the 37 classrooms and between 0.54 and 0.92 for the remaining 33 classrooms.
Through the regression analysis for the gravimetrical indoor and outdoor PM2.5 mean data of each school, it was estimated that, on average, 53% of the total indoor PM2.5 originated from outdoors in the winter months and 47% was generated indoors, with an average Finf of 0.38 (Figure 3).
Table 3. Descriptive statistics for the indoor and outdoor 5-d PM concentrations (µg/m3) and CO2 levels (ppm). AERs (h−1) and Qp (L/sp) are also reported. n = number of classrooms or outdoor sampling sites in which airborne particles and CO2 were monitored, AM = arithmetic mean, SD = standard deviation.
NAM ± SD MedianRange nAM ± SD MedianRange
PM0.5 indPM10 ind
SC1813.2 ± 6.513.44.4–21.7SC18130.3 ± 55.8114.460.2–219.8
SC2129.7 ± 4.1 9.82.5–15.9SC212136.0 ± 77.2128.940.9–282.3
Total2011.1 ± 5.310.12.1–21.7Total20133.8 ± 67.9127.340.9–282.3
PM1 indTSPind
SC1823.7 ± 8.427.111.4–33.0SC18235.0 ± 87.3229.0101.3–354.9
SC21216.3 ± 4.516.95.9–23.0SC212252.3 ± 129.5243.9100.6–504.9
Total2019.2 ± 7.217.55.9–33.0Total20245.4 ± 112.2235.2100.6–504.9
PM2.5 indCO2 ind
SC12039.0 ± 8.737.923.9–59.2SC121891 ± 174859567–1191
SC21826.7 ± 7.129.610.7–35.5SC218870 ± 181806698–1370
Total3833.2 ± 10.032.710.7–59.2Total39881 ± 175840567–1370
PM2.5 outCO2 out
SC1760.5 ± 26.566.523.1–106.8SC17505 ± 37501448–552
SC2630.9 ± 11.931.512.0–48.9SC24479 ± 11477469–492
Total1346.9 ± 25.443.612.0–106.8Total11496 ± 32490448–552
PM5 indAERs
SC18105.5 ± 43.394.353.1–177.1SC1210.35 ± 0.140.370.10–0.60
SC212103.4 ± 56.297.931.4–206.6 SC2180.39 ± 0.110.380.24–0.61
Total20104.2 ± 50.297.931.4–206.6Total390.37 ± 0.120.370.10–0.61
Qp
SC1213.0 ± 1.62.90.7–7.7
SC2183.2 ± 1.0 3.01.8–5.6
Total393.1 ± 1.43.00.7–7.7

3.2. Indoor PMconcentrations

To better identify and assess the influence of indoor particle sources on the PM mass concentrations, the indoor PM continuous data were divided into three periods: school hours (S), when the rooms were occupied by students during lessons; other activities (OA), with data recorded during gym class and lunch time, after the end of lessons, and in the early morning when no students were present in the classrooms but other activities, such as cleaning, might be performed; and night (N), from 10:00 PM to 6:00 AM, when the rooms were empty and no human activity was performed (Table 4).
Statistically significant differences were found between the 5-d levels measured in each classroom during S and N and during OA and N for TSP, PM10, PM5 and PM2.5 (p ≤ 0.001). Conversely, no significant differences were observed for PM1 and PM0.5 between the same periods (p > 0.05).
Within the range of particle sizes collected by the photometer, the ratios between the 5-d concentrations detected during S and N were always greater than or close to unity and varied as a function of particle size. The S/N values ranged from 0.8 to 5.1 for particle sizes up to 1 µm, then significantly increased (to nearly 500) for coarse particles and particles >10 µm, as depicted in Figure 4.
Figure 4. Ratios between the 5-d mean concentrations detected during S and N in the monitored schools. The y-axis is on a logarithmic scale.
Ijerph 11 01398 g004
The indoor PM10 was characterized by large variations during S and OA but exhibited relatively constant levels during N. In contrast, the PM2.5 variability was low throughout the three different time periods (Table 4). Furthermore, during S and OA the mean PM10 levels were significantly higher than the median values, and markedly higher than the average PM2.5 levels, due to the occurrence of extremely high concentrations as a result of the contributions of coarse particles (d.a. = 2.5–10 µm).
Figure 5. Mean contributions of the size-fractioned PM (PM0.5, PM0.5–1, PM1–2.5, PM2.5–5, PM5–10) to the 5-d PM10 levels. The absolute (µg/m3) and relative values (%) are reported in the histograms.
Ijerph 11 01398 g005
Table 4. Descriptive statistics for the 5-d indoor PM (µg/m3) and CO2 (ppm) concentrations collected during S, OA and N in SC1 and SC2. The PM2.5 and CO2 I/O ratios for the same periods are also reported; n = number of continuous data recorded throughout the sampling sessions, AM = arithmetic mean, SD = standard deviation.
SC1SC2
I/O ratio I/O ratio
nAM ± SD Median10th–90thMean (range)nAM ± SD Median10th–90thMean (range)
PM0.5
S5,49912.8 ± 8.511.72.6–24.9 9,14810.8 ± 8.28.01.6–19.8
OA7,32813.3 ± 8.812.92.7–26.0 10,96410.6 ± 9.18.42.1–21.1
N5,76013.6 ± 7.412.84.7–23.3 9,0248.8 ± 5.28.52.3–16.1
PM1
S5,49922.9 ± 12.723.25.5–39.7 9,14816.9 ± 12.114.73.2–32.1
OA7,32823.2 ± 14.024.04.8–41.8 10,96417.8 ± 13.414.63.9–33.8
N5,76023.6 ± 12.024.57.7–38.9 9,02414.4 ± 8.014.43.7–25.8
PM2.5
S5,49941.0 ± 19.739.615.7–66.10.82 (0.47–1.62)9,14831.9 ± 22.428.57.9–57.40.85 (0.63–1.28)
OA7,32837.1 ± 22.433.39.0–66.20.80 (0.49–1.59)10,96429.1 ± 23.423.25.8–54.70.90 (0.50–1.39)
N5,76035.1 ± 22.132.711.0–61.50.71 (0.37–1.35)9,02420.1 ± 11.219.94.8–36.30.70 (0.48–0.97)
PM5
S5,499158.2 ± 114.3129.258.5–299.7 9,148169.7 ± 190.6118.940.4–325.0
OA7,328104.5 ± 142.068.825.2–212.0 10,964113.0 ± 236.449.014.6–234.3
N5,76046.3 ± 24.241.622.9–78.3 9,02427.7 ± 14.727.66.1–47.4
PM10
S5,499205.7 ± 160.0162.367.7–393.9 9,148231.6 ± 270.1157.653.1–452.3
OA7,328129.0 ± 233.473.526.3–269.5 10,964148.5 ± 369.853.015.8–306.8
N5,76047.0 ± 24.442.123.7–80.8 9,02428.4 ± 14.928.56.2–48.4
TSP
S5,499421.0 ± 334.2330.0140.1–797.8 9,148469.2 ± 546.5320.1116.3– 922.8
OA7,328224.9 ± 728.186.929.4–454.2 10,964260.2 ± 912.064.419.2–522.6
N5,76049.3 ± 25.643.624.8–91.4 9,02429.7 ± 15.929.86.9–50.1
CO2
S16,0491,423 ± 5621333728–2,3002.84 (1.60–3.90)13,4701,428 ± 6091271802–2,3242.67 (2.10–3.30)
OA19,803733 ± 314620474–1,1381.50 (1.10–1.90)15,921686 ± 334573455–1,0371.31 (1.06–1.50)
N16,128556 ± 98542444–6881.18 (0.90–1.80)13,645500 ± 63490435–5761.03 (0.92–1.14)
Table 5. Spearman correlation coefficients between the indoor PM fractions during S, OA and N.
SOAN
PM0.5PM1PM2.5PM5PM10PM0.5PM1PM2.5PM5PM10PM0.5PM1PM2.5PM5PM10
PM0.51.000 1.000 1.000
PM10.9321.000 0.9321.000 0.9041.000
PM2.50.7430.8891.000 0.7770.9151.000 0.7790.9621.000
PM50.4380.4180.5871.000 0.4980.5660.7501.000 0.7980.9320.9481.000
PM100.4000.3730.5370.9941.0000.4540.5240.7120.9961.0000.7880.9240.9410.9991.000
TSP0.2700.2660.4440.9190.9480.3370.4200.6280.9510.9730.7520.8990.9280.9900.994
Note: All values significant (p < 0.05).
Indeed, during school activities the PM10 samples were primarily comprised of PM2.5–10, which increased, on average, from 9.7 µg/m3 (29% of PM10) during N to 186.5 µg/m3 (77% of PM10) when students were in the classrooms (Figure 5). Coarse particles remained the major fraction during OA as well (54% of PM10), with an average concentration of 108.3 µg/m3. At night, fine particles were dominant (71% of PM10), and all the indoor PM fractions under study were highly correlated (r > 0.75) (Table 5). In addition, the PM1-2.5 average levels decreased from S to N (from 16.2 µg/m3 to 8.0 µg/m3, respectively), while the PM0.5–1 and PM0.5 mean concentrations remained roughly constant throughout the day (Figure 5).

3.3. Indoor and Outdoor CO2 Concentrations

As expected, the 5-d indoor CO2 concentrations were higher than the corresponding outdoor values, with the 5-d indoor CO2 levels between 567 and 1,370 ppm and the ambient concentrations between 448 and 552 ppm.
The indoor concentrations were highly variable and closely related to the occupation of the rooms (Table 4). A typical diurnal CO2 pattern is reported in Figure 6. The decrease of the CO2 I/O ratios from, on average, 2.76 during S to 1.11 during N (Table 4) further confirmed this behavior.
AERs estimated with the tracer gas-decay technique (Table 3) represent the worst-case scenario for the ventilation conditions in the studied classrooms because they were calculated when the windows and doors were likely closed (wintertime), and ventilation rates depended only on the air tightness of the building envelope. In naturally ventilated classrooms, as in all studied rooms, the AERs during S should not differ markedly from those estimated in the late afternoon, except when the ventilation increased due to the opening of windows and doors during breaks, lunch time or other periods when the classrooms were unoccupied. No statistically significant correlations were found between the AERs and the average indoor PM concentrations.
Figure 6. Typical daily indoor variation in CO2 levels and the corresponding outdoor trend for one monitored classroom.
Ijerph 11 01398 g006
Furthermore, the outdoor air supply rates per person (Qp) (Table 3) were estimated for each classroom using the AERs, the class volumes and the average number of students occupying the study rooms according to Persily [19]. The mean value of the estimated rates was close to 3 L/ps.

3.4. Comparison of the Pre- and Post-Intervention Indoor PM2.5 and CO2 Levels

A further aim of the present study was to evaluate the efficacy of some intervention measures (e.g., better cleaning of surfaces with vacuum cleaner and frequent opening of windows) promoted in four schools prior to SC2 as part of a campaign to improve the IAQ in school environments.
The indoor 5-d PM2.5 and CO2 concentrations were evaluated for each classroom and paired t-tests between the two sampling campaigns were performed for these data sets, separating the classrooms that utilized intervention measures from the classrooms not involved in the intervention program. As regards CO2, only data recorded during S were analyzed and the 5-d mean values of each classroom were normalized to the average number of people occupying the room during sampling. Due to the use of different data loggers during SC1 and SC2, the CO2 data collected in SC2 were cut to 2,485 ppm to make the two data sets comparable.
The analysis revealed statistically significant differences (p < 0.01) between SC1 and SC2 for the classrooms that implemented the recommended intervention measures, with lower post-intervention indoor PM2.5 and CO2 5-d concentrations typically observed. In contrast, no statistically significant differences (p > 0.05) were found for the classrooms not subjected to the intervention, which were also characterized by higher indoor 5-d CO2 levels during SC2 relative to those of SC1 (Table 6). In addition, paired t-tests between SC1 and SC2 for PM2.5 outdoor 5-d average levels and for PM2.5 5-d mean I/O ratios of the schools involved in the intervention program were performed. The results showed no statistically significant differences neither in PM2.5 outdoor data nor in PM2.5 I/O ratios.
Table 6. Results of paired t-tests between pre- and post- intervention indoor PM2.5 and CO2 5-d concentrations.
PM2.5CO2
n5-d mean concentrations (µg/m3)p (2-tailed)n5-d mean during S normalized to the average number of students (ppm/p)p (2-tailed)
SC1SC2SC1SC2
Rooms with intervention1043.127.60.0011273.062.30.006
Rooms without intervention632.927.00.150657.661.60.084
Out (schools subjected to intervention)466.330.40.164
I/O ratio
Rooms with intervention100.770.940.286

3.5. Comparison with International Guidelines

Recently, WHO developed specific guidelines for selected indoor pollutants [2], which referred to existing ambient Air Quality Guidelines (AQGs) in the case of indoor PM2.5 and PM10 [23].
To compare the indoor PM2.5 and PM10 levels with the 24-hour WHO guidelines (25 µg/m3 and 50 µg/m3, respectively), we considered for each classroom the average 24-h concentrations for the days in which an entire 24-h sampling was performed (Tuesday, Wednesday and Thursday). Cases in which the monitoring was interrupted due to instrumental or electrical problems were excluded from analysis.
The indoor PM2.5 24-h levels exceeded the WHO AQG limit on several sampling days (67.9% of the total 24-h indoor concentrations considered).
The WHO AQG levels were also exceeded for the indoor 24-h measurements of PM10. Only 8.8% of cases fell below the recommended PM10 value.
As regards CO2 levels we considered data collected during S to better represent the exposure of pupils and teachers to human body odors, noting that the reference guideline value has no specific average exposure times. It was calculated that, on average, for 73% of the time spent by students in the classrooms, the indoor continuous CO2 concentrations exceeded the standard recommended by the American Society of Heating Refrigerating and Air-Conditioning Engineers (ASHRAE) of 1,000 ppm [24].

4. Discussion

4.1. Comparison of PM Concentrations with Historical Data

Overall, the 5-d mean PM2.5 and PM10 concentrations measured in the present study (Table 3) were quite comparable with the results of previous investigations. A Dutch survey identified average indoor PM10 levels between 51 µg/m3 and 166 µg/m3 [25], but was performed in summer, and higher values would likely be expected during winter. A German study examining 54 classrooms in winter and spring found quite low indoor PM2.5 concentrations (median = 15 µg/m3, range: 5–40 µg/m3) [26].
The majority of studies, however, evaluated PM concentrations only during teaching hours when pupils attended class.
The 5-d indoor PM10 concentrations during S (Table 4) were comparable to the results of Diapouli et al. [27], which measured 8-h PM10 concentrations of 229 ± 182 µg/m3. The respective indoor PM2.5 concentrations (82 ± 56 µg/m3) were approximately 1.5-fold higher than those measured in our study.
Nevertheless, our 5-d indoor PM10 levels during lesson hours were generally elevated in comparison with similar studies. Wheeler et al. measured in the U.K. mean PM10 winter concentrations of 80 µg/m3 [28], while average indoor 8-h PM10 levels < 50 µg/m3 were found in Detroit [29]. Noteworthy is that during re-suspension phenomena caused by human presence and activities the re-suspended particles (primarily coarse particles and PM10 of crustal origin) can exhibit densities markedly higher than PM2.5 (primarily elementary and organic carbon), which was used in our study to correct all the PM optical data. Thus, especially during S, the high indoor PM10 concentrations registered in the studied classrooms could be overestimated.
The PM 5-d median values during S (Table 4) were comparable to those reported in a German study (118.2 µg/m3 for PM10 and 37 µg/m3 for PM2.5) [12]. Lower median PM10 values during teaching hours were found by Janssen et al. (81 µg/m3) [30] and Fromme et al. (92 µg/m3) [13].

4.2. Indoor and Outdoor Fine PM Concentrations

Contrary to the results of previous studies [12,16], we identified indoor 5-d PM2.5 concentrations lower than the associated outdoor levels during both sampling campaigns (Table 3).
During SC1, a lower 5-d outdoor PM2.5 was observed only for school S1, primarily because the ambient PM levels were decreased to values close to zero by heavy rains (Table 2). Overall, however, SC1 was characterized by 5-d PM2.5 outdoor levels higher than SC2 (Table 3).
Notably, in the Po Valley the atmospheric stability is high, especially during wintertime, and frequent thermal inversions at low altitude, low mixing layer heights and prolonged foggy periods can occur. Specifically, the sampling during SC1 was affected by a lower rainfall rate and a slightly lower average wind speed in comparison with SC2 (Table 2), thus promoting the accumulation of outdoor pollutants, as occurred for school S4, which exhibited the highest outdoor and indoor 5-d PM2.5 levels (106.8 µg/m3 and 57.9 µg/m3, respectively) found in our survey.
In contrast, the outdoor concentrations in SC2 were approximately 50% lower than those in SC1. The lowest 5-d ambient concentration (12.0 µg/m3) was found during a rainy and windy sampling week (S2) (Table 2). In the same week, the lowest indoor 5-d PM2.5 concentration (13.5 µg/m3) was also registered.

4.3. Influence of Indoor Sources on Indoor PM Levels

Although school environments usually lack typical indoor PM sources, such as smoking, wood-burning and cooking, high levels of airborne particles in classrooms are often present nonetheless.
It has been demonstrated that in indoor microenvironments where there is no specific indoor source of pollution (e.g., combustion processes), human presence and activities may represent the main source of indoor particulates [11,31].
In our work, the highest mean concentrations of PM2.5, PM5, PM10 and TSP were observed when the classrooms were occupied by students (Table 4), whose movements and activities led to the re-suspension of settled particles and also affected indoor PM levels through personal clouds.
A chemical characterization of the particles collected in our survey was not conducted, but other studies have reported that PM in classrooms is partly of human origin (skin flakes) and partly of mineral origin (building materials such as cement and gypsum as well as chalk and soil material brought in by children’s shoes) [12].
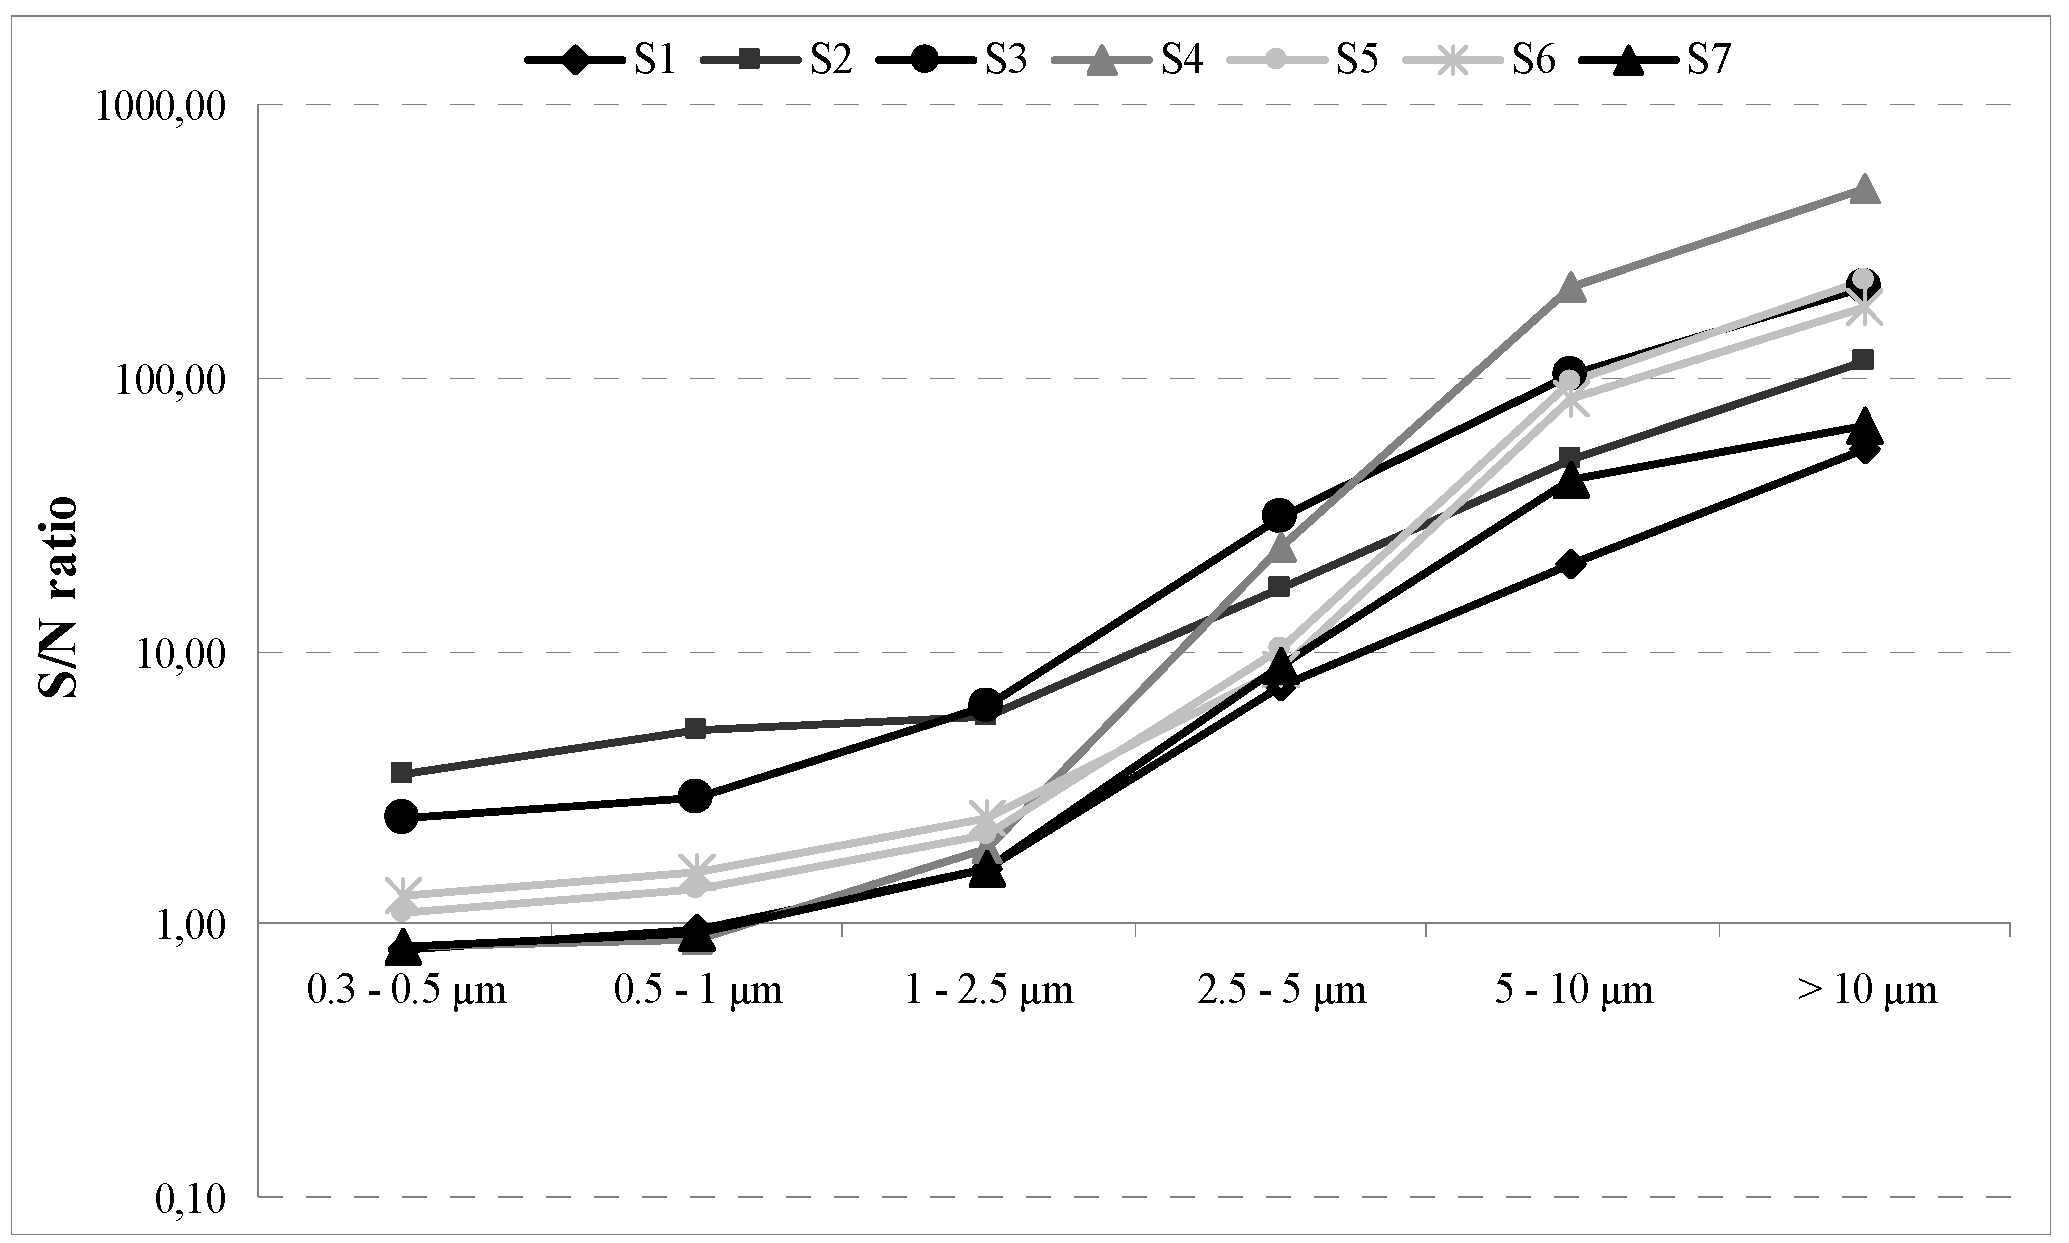
The ratios of the 5-d mean concentrations during S and N (Figure 4) highlighted the strong influence of occupancy on indoor airborne particle concentrations. The exponential growth of the S/N ratios for particles > 1 µm indicated that re-suspension became relevant from particulates of 1 µm in aerodynamic diameter but was predominant for particles in the ranges 2.5–10 µm and > 10 µm, with re-suspension rates increasing with particles size, as demonstrated by other studies [8,15]. Overcrowding of classrooms can contribute to increased re-suspension phenomena. The maximum occupancy in a classroom environment, as recommended by the ASHRAE Standard 62-1989 is 50 people/100 m2 [24]. In our study, 23.8% of classrooms exceeded the recommended standard during the first sampling campaign, and three rooms were borderline. During SC2, the Standard was exceeded by 27.7% of the classrooms, with one room lying on the threshold (Table 1).
The high indoor PM levels found during OA for particles > 2.5 µm (Table 4) were likely the result of cleaning activities, as the cleaning of rooms was normally performed during this time period. It is well known that cleaning activities, such as dusting or vacuuming, are potentially significant indoor PM sources, especially of coarse-mode particles, causing considerable variations in PM levels over short time periods [32].
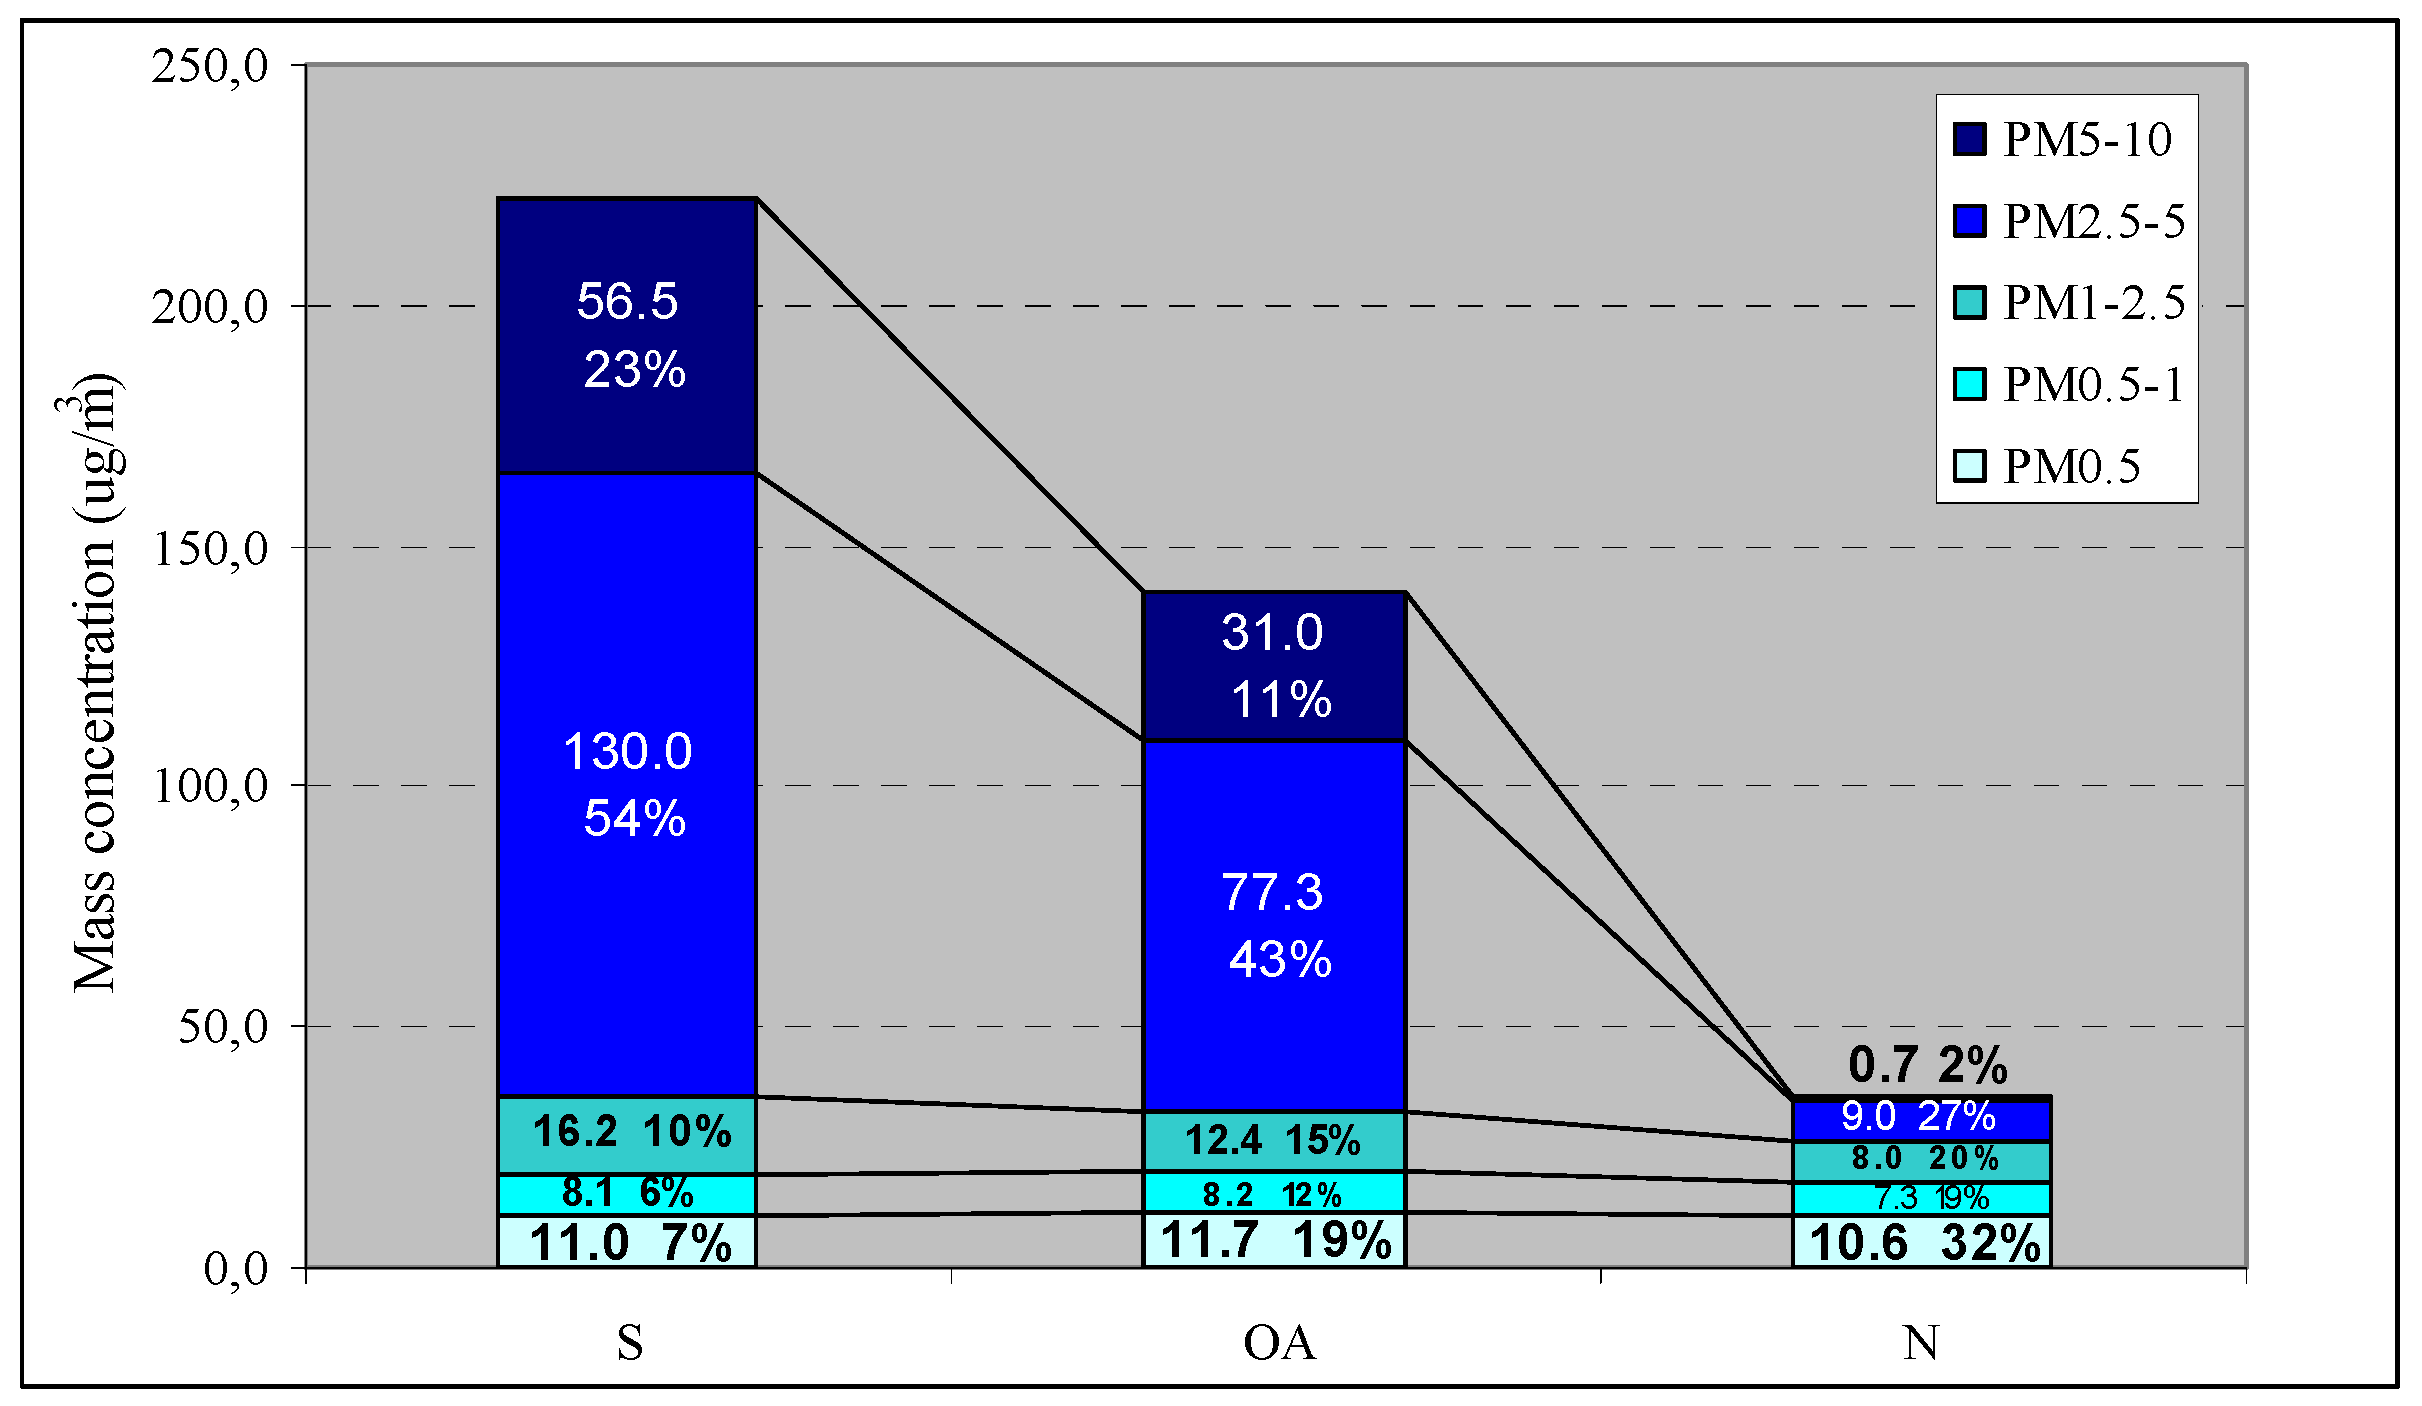
In the absence of indoor PM sources, when the classrooms were empty and no activities were being performed, the indoor PM10 was primarily composed of PM2.5 (Figure 5), as also observed by Branis et al. [11]. The influence of human presence and activities on particle levels was also demonstrated by the poor correlation between the fine and coarse PM fractions during S and OA (Table 5), suggesting that various classroom sources exerted different effects on the indoor particle levels, with the greatest influence on the largest particle sizes. In addition, the higher correlations observed during N (Table 5) underlined that, without human activities, no particular indoor source could be identified, and the only relevant determinant of indoor concentrations was the particle infiltration from outdoors.
In contrast to the results of other studies [11,31], we did not observe a significant correlation between the indoor PM levels, especially for coarse particles and PM10, and the occupants’ number and density. This observation could be due to the lack of differences in the number of students among the studied classrooms. Further, the various types and intensity of activities performed in the classrooms by the students (whose details were not available) could determine the high indoor particle levels regardless of the number of occupants.
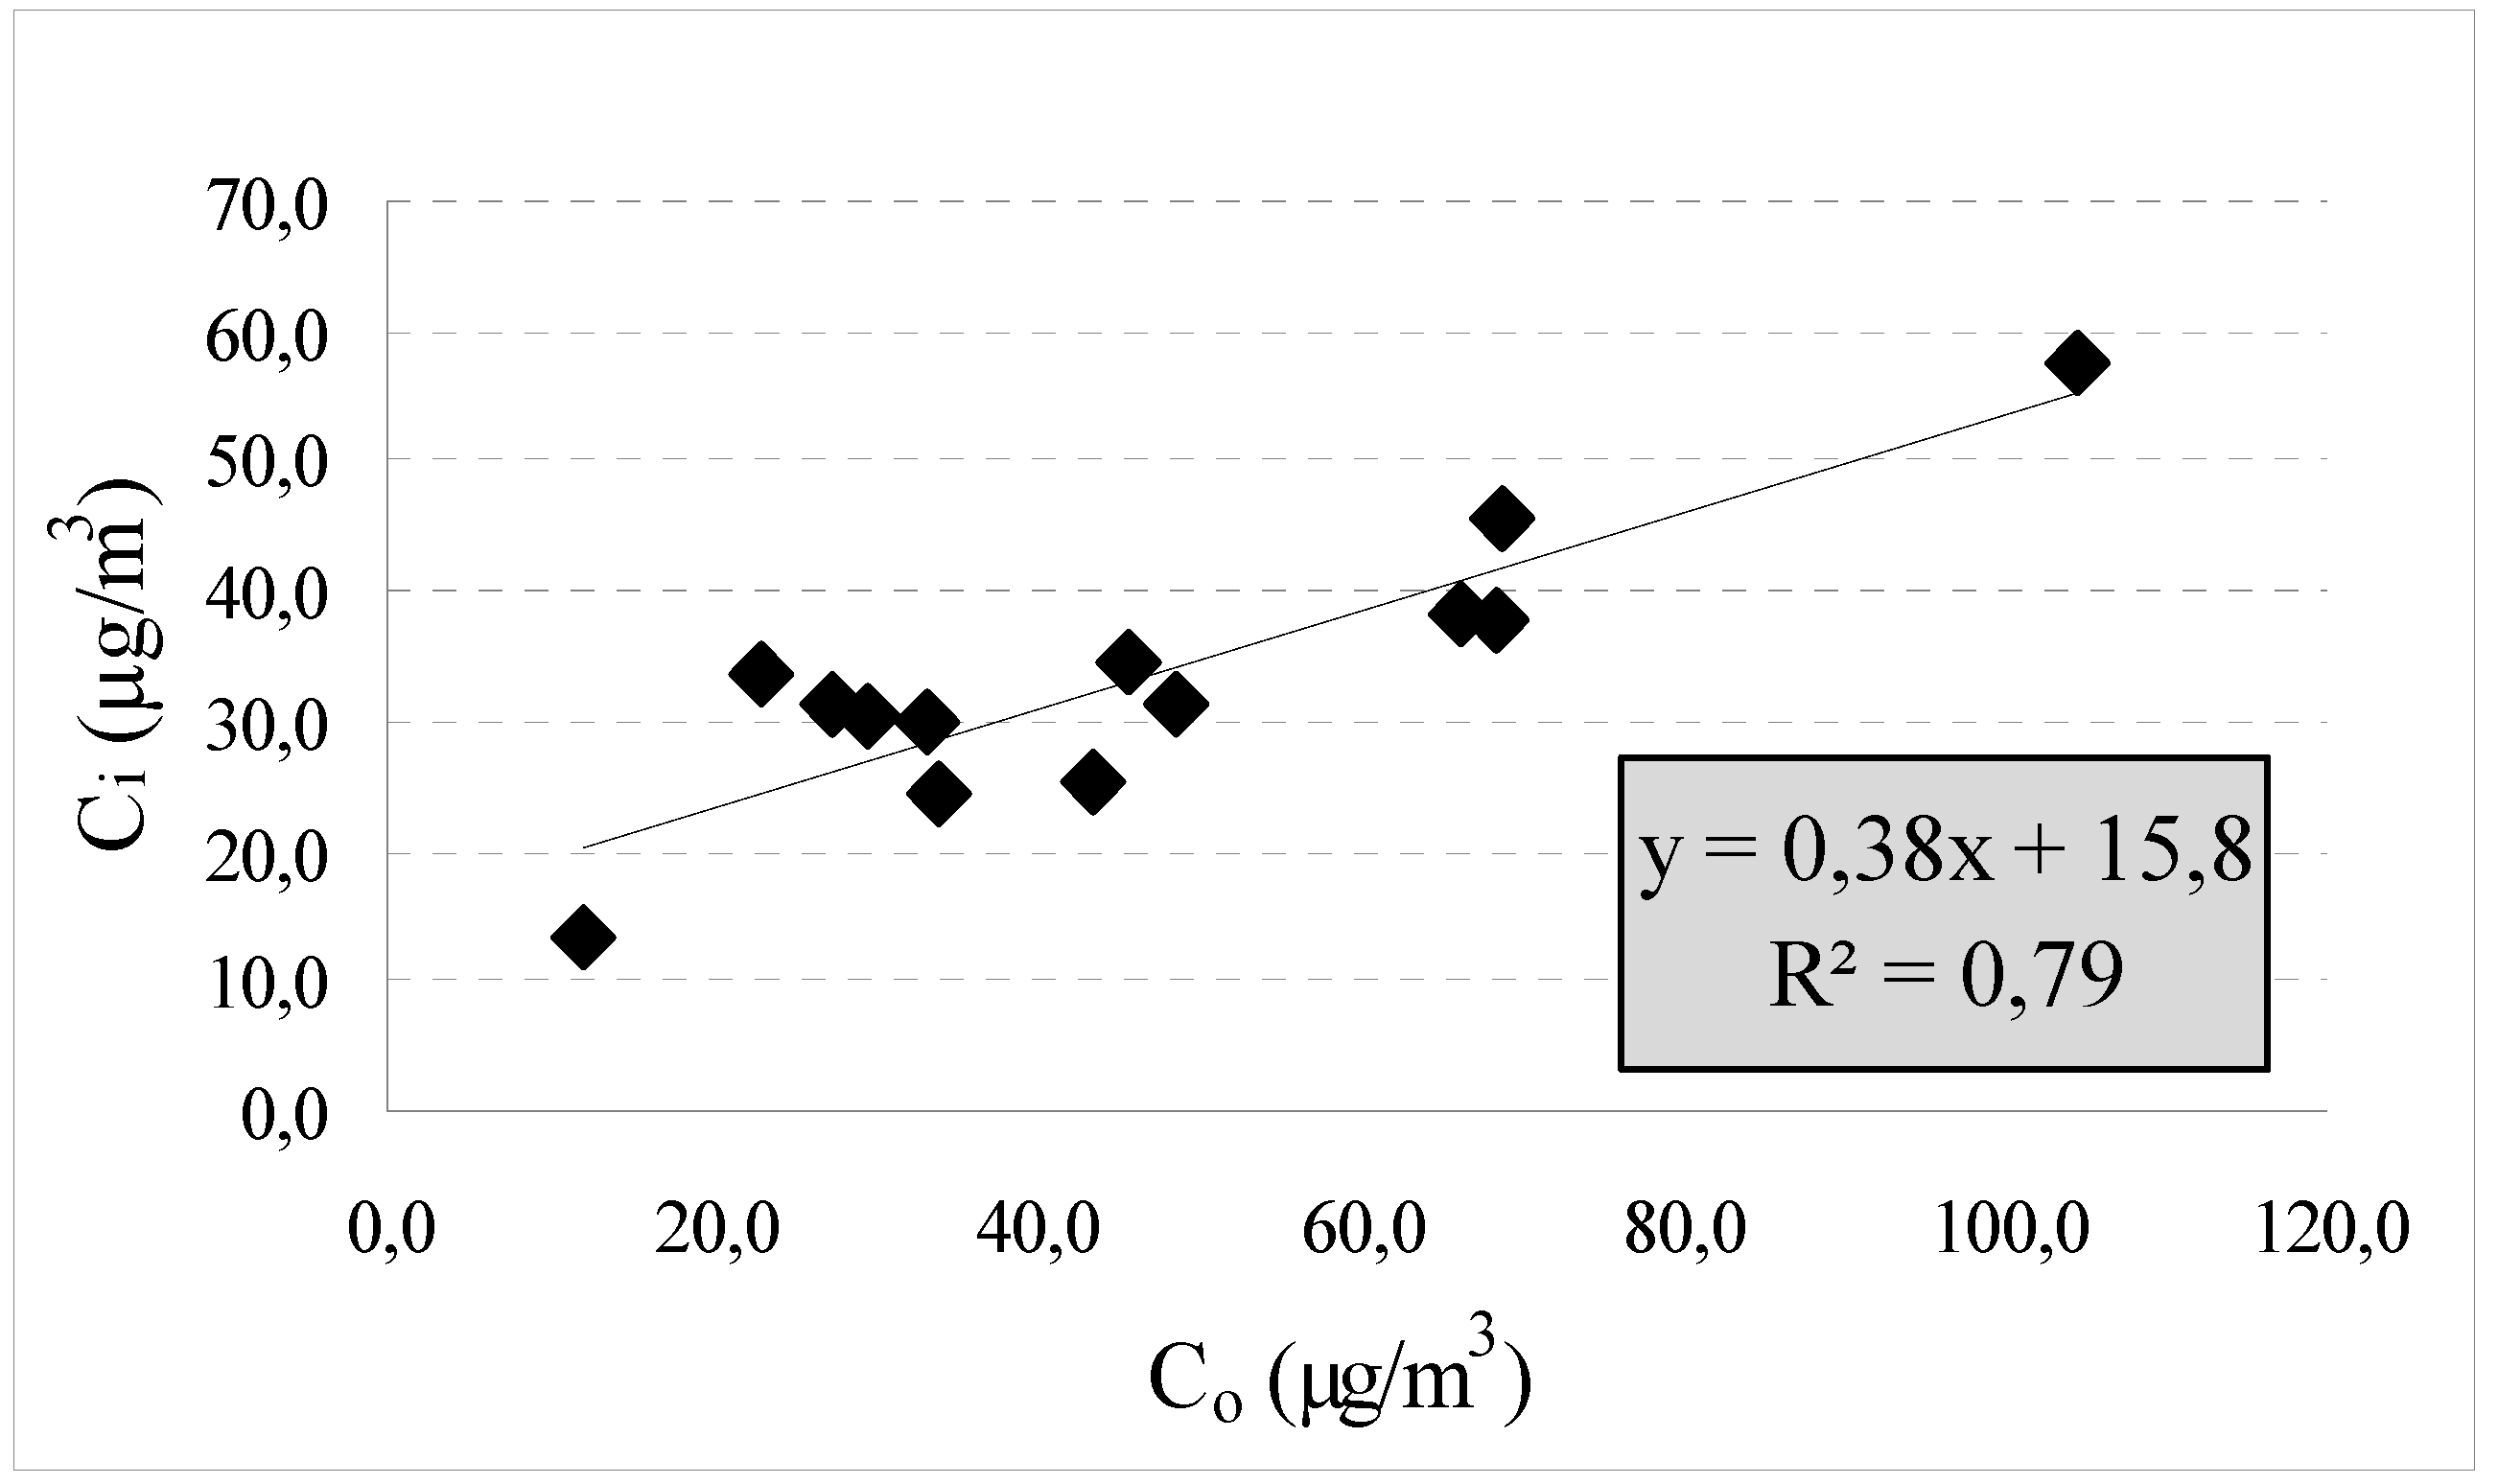
The estimation of the indoor- and outdoor-generated PM2.5 suggested that slightly less than half of the 5-d indoor PM2.5 in classrooms originated indoors and 53% infiltrated from outdoors. This results could have arisen because the re-suspension phenomena primarily affected the coarse particle concentrations but also the PM1-2.5 fraction, which was found to decrease from S to N (Figure 5). The slight reduction in the PM2.5 I/O ratios when students were not present in the buildings and no activities were being performed (Table 4) confirmed this behavior. Similar results were reported by Crist et al., who demonstrated a decline in PM2.5 indoor concentrations and I/O ratios associated with the absence of students in school [33].
As discussed below, the most innovative goal of this study was to evaluate the efficacy of the intervention measures suggested to improve the IAQ in classrooms, since, to date, only a limited number of surveys have tackled the problem of assessing PM exposure following risk mitigation interventions.

4.4. Evaluation of the Efficacy of Intervention Measures in School Classrooms

To evaluate the efficacy of the proposed intervention measures, we considered PM2.5 and CO2 as being possibly and beneficially affected by the improved cleaning of surfaces with vacuum cleaner and/or the frequent opening of doors and windows. No time-activity diaries were provided for obtaining information on windows opening and cleaning activities. Thus, no specific detail regarding the recommended intervention was available.
A comparison for PM5, PM10 and TSP would be very important because of the considerable influence of cleaning activities on these size particle ranges. Unfortunately, we were unable to consider all of the PM fractions due to the small number of comparable OPC samples between the two monitoring sessions.
Statistically significant differences for PM2.5 (p = 0.001) were found in the classrooms affected by the intervention measures, with lower post-intervention PM2.5 5-d concentrations. Conversely, no significant differences were found in the classrooms not subjected to the intervention program (p = 0.150). Nonetheless, this improvement should not be considered as the direct consequence of risk mitigation interventions, as a parallel decrease in the corresponding outdoor PM2.5 levels was registered for the schools involved in the intervention program, although not in a statistically significant way (p = 0.164). Furthermore, no statistically significant differences were found between SC1 and SC2 PM2.5 I/O ratios (Table 6). We can therefore conclude that the intervention measures proposed to reduce indoor particle levels did not seem to significantly influence the indoor fine PM concentrations.
Conversely, the statistically significant decrease in the indoor CO2 levels reported in SC2 during S (p = 0.006) could be attributed to the more frequent opening of doors and windows. No significant differences were found in the classrooms where intervention measures were not implemented (p = 0.084).
These preliminary findings should be further investigated using a larger number of samples and more detailed information about all the possible factors and confounders of the PM and CO2 measurements (e.g., climatic conditions and the frequency and intensity of cleaning activities and opening of windows). Furthermore, such an assessment would have greater value if performed using parameters that are significantly influenced by the types of interventions proposed (i.e., coarse particles and PM10).

4.5. Comparison of Indoor PM and CO2 Levels with International Guidelines

The indoor AQGs recently proposed by the WHO aimed to provide a uniform basis for the protection of public health from adverse health effects of exposure to indoor air pollutants [2]. When defining the chemicals to be considered for the development of new indoor guidelines, PM (PM2.5 and PM10) was included in Group 1, as all the priority pollutants for which the definition of guidelines for indoor air was recommended. Nevertheless, no convincing evidence of a difference in the hazardous nature of particulate matter from indoor sources as compared with those from outdoors was found. Therefore, the PM ambient AQGs defined by the 2005 Global Update were recommended also for indoor spaces [2,23].
In general, the high concentrations that could be achieved in school buildings do not necessarily result in higher health risk to pupils, because the sources and composition of PM in indoor air may differ from those in outdoor air [34]. Among other things, studies highlighted the need of further investigations of the chemical composition and source apportionment of indoor PM, also to better clarify the toxicological and biological relevance of PM exposure in schools in comparison to outdoors [12].
67.9% of the total 24-h PM2.5 indoor concentrations found in this study exceeded the WHO AQG limit established to prevent excess mortality and morbidity among human populations.
Furthermore, 40.3% of these cases did not achieve the PM2.5 Interim target 3 (37.5 µg/m3), implying an estimated increase of 1.2% in short-term mortality; some of the measurements (31%) also exceeded the PM2.5 Interim target 2 (50 µg/m3), which is related to an estimated 2.5% increase in daily mortality compared with the guideline value [23]. None of the 24-h indoor concentrations exceeded the PM2.5 Interim target 1 (75 µg/m3), although during SC1 two classrooms in school S4 achieved indoor 24-h PM2.5 levels close to that threshold (73.4 µg/m3 and 73.6 µg/m3).
PM10 is less hazardous to human health because coarse particles are unable to reach the deepest parts of the respiratory tree. In the majority of cases (91.2%), the 24-h WHO guideline value was exceeded, with 78.8% of 24-h levels surpassing the PM10 Interim target 3 (75 µg/m3). 32.7% of cases exceeding the 24-h limit value also exceeded the PM10 Interim target 1 (150 µg/m3), with an estimated 5% increase in short-term mortality [23].
24-h classroom concentrations were calculated for comparison with the 24-h WHO guidelines in terms of average exposure times, although they are not fully representative of the students’ daily exposure to PM. Pupils, indeed, spent on average of 30% of their week-day time in the school environment, where, moreover, they might have frequented locations and rooms in which the airborne PM exposure could be higher or lower (e.g., gymnasium or library) [27]. Moreover, students passed the remainder of the day in other outdoor or indoor microenvironments—primarily at home—where the indoor PM concentrations were likely to be high [35].
With respect to long-term exposure, the collected data were not directly comparable with the 1-year values recommended for PM2.5 and PM10 (10 µg/m3 and 20 µg/m3, respectively) because our study provided only winter levels. However, an average annual indoor value lower than the mean winter concentration is expected, due to typical PM seasonal trends in European countries [13,17].
According to the ASHRAE Standard 62-1989, indoor CO2 levels should not exceed 1,000 ppm to ensure satisfactory comfort [24]. Values exceeding this threshold indicate insufficient fresh air and are associated with a higher frequency of health complaints, primarily due to undesirable levels of body odor, although no health impact on humans has been reported at these concentration levels [22]. Several studies have demonstrated that, during lesson hours, classrooms are often inadequately ventilated, especially in wintertime, with high indoor CO2 levels reached [6,13,36].
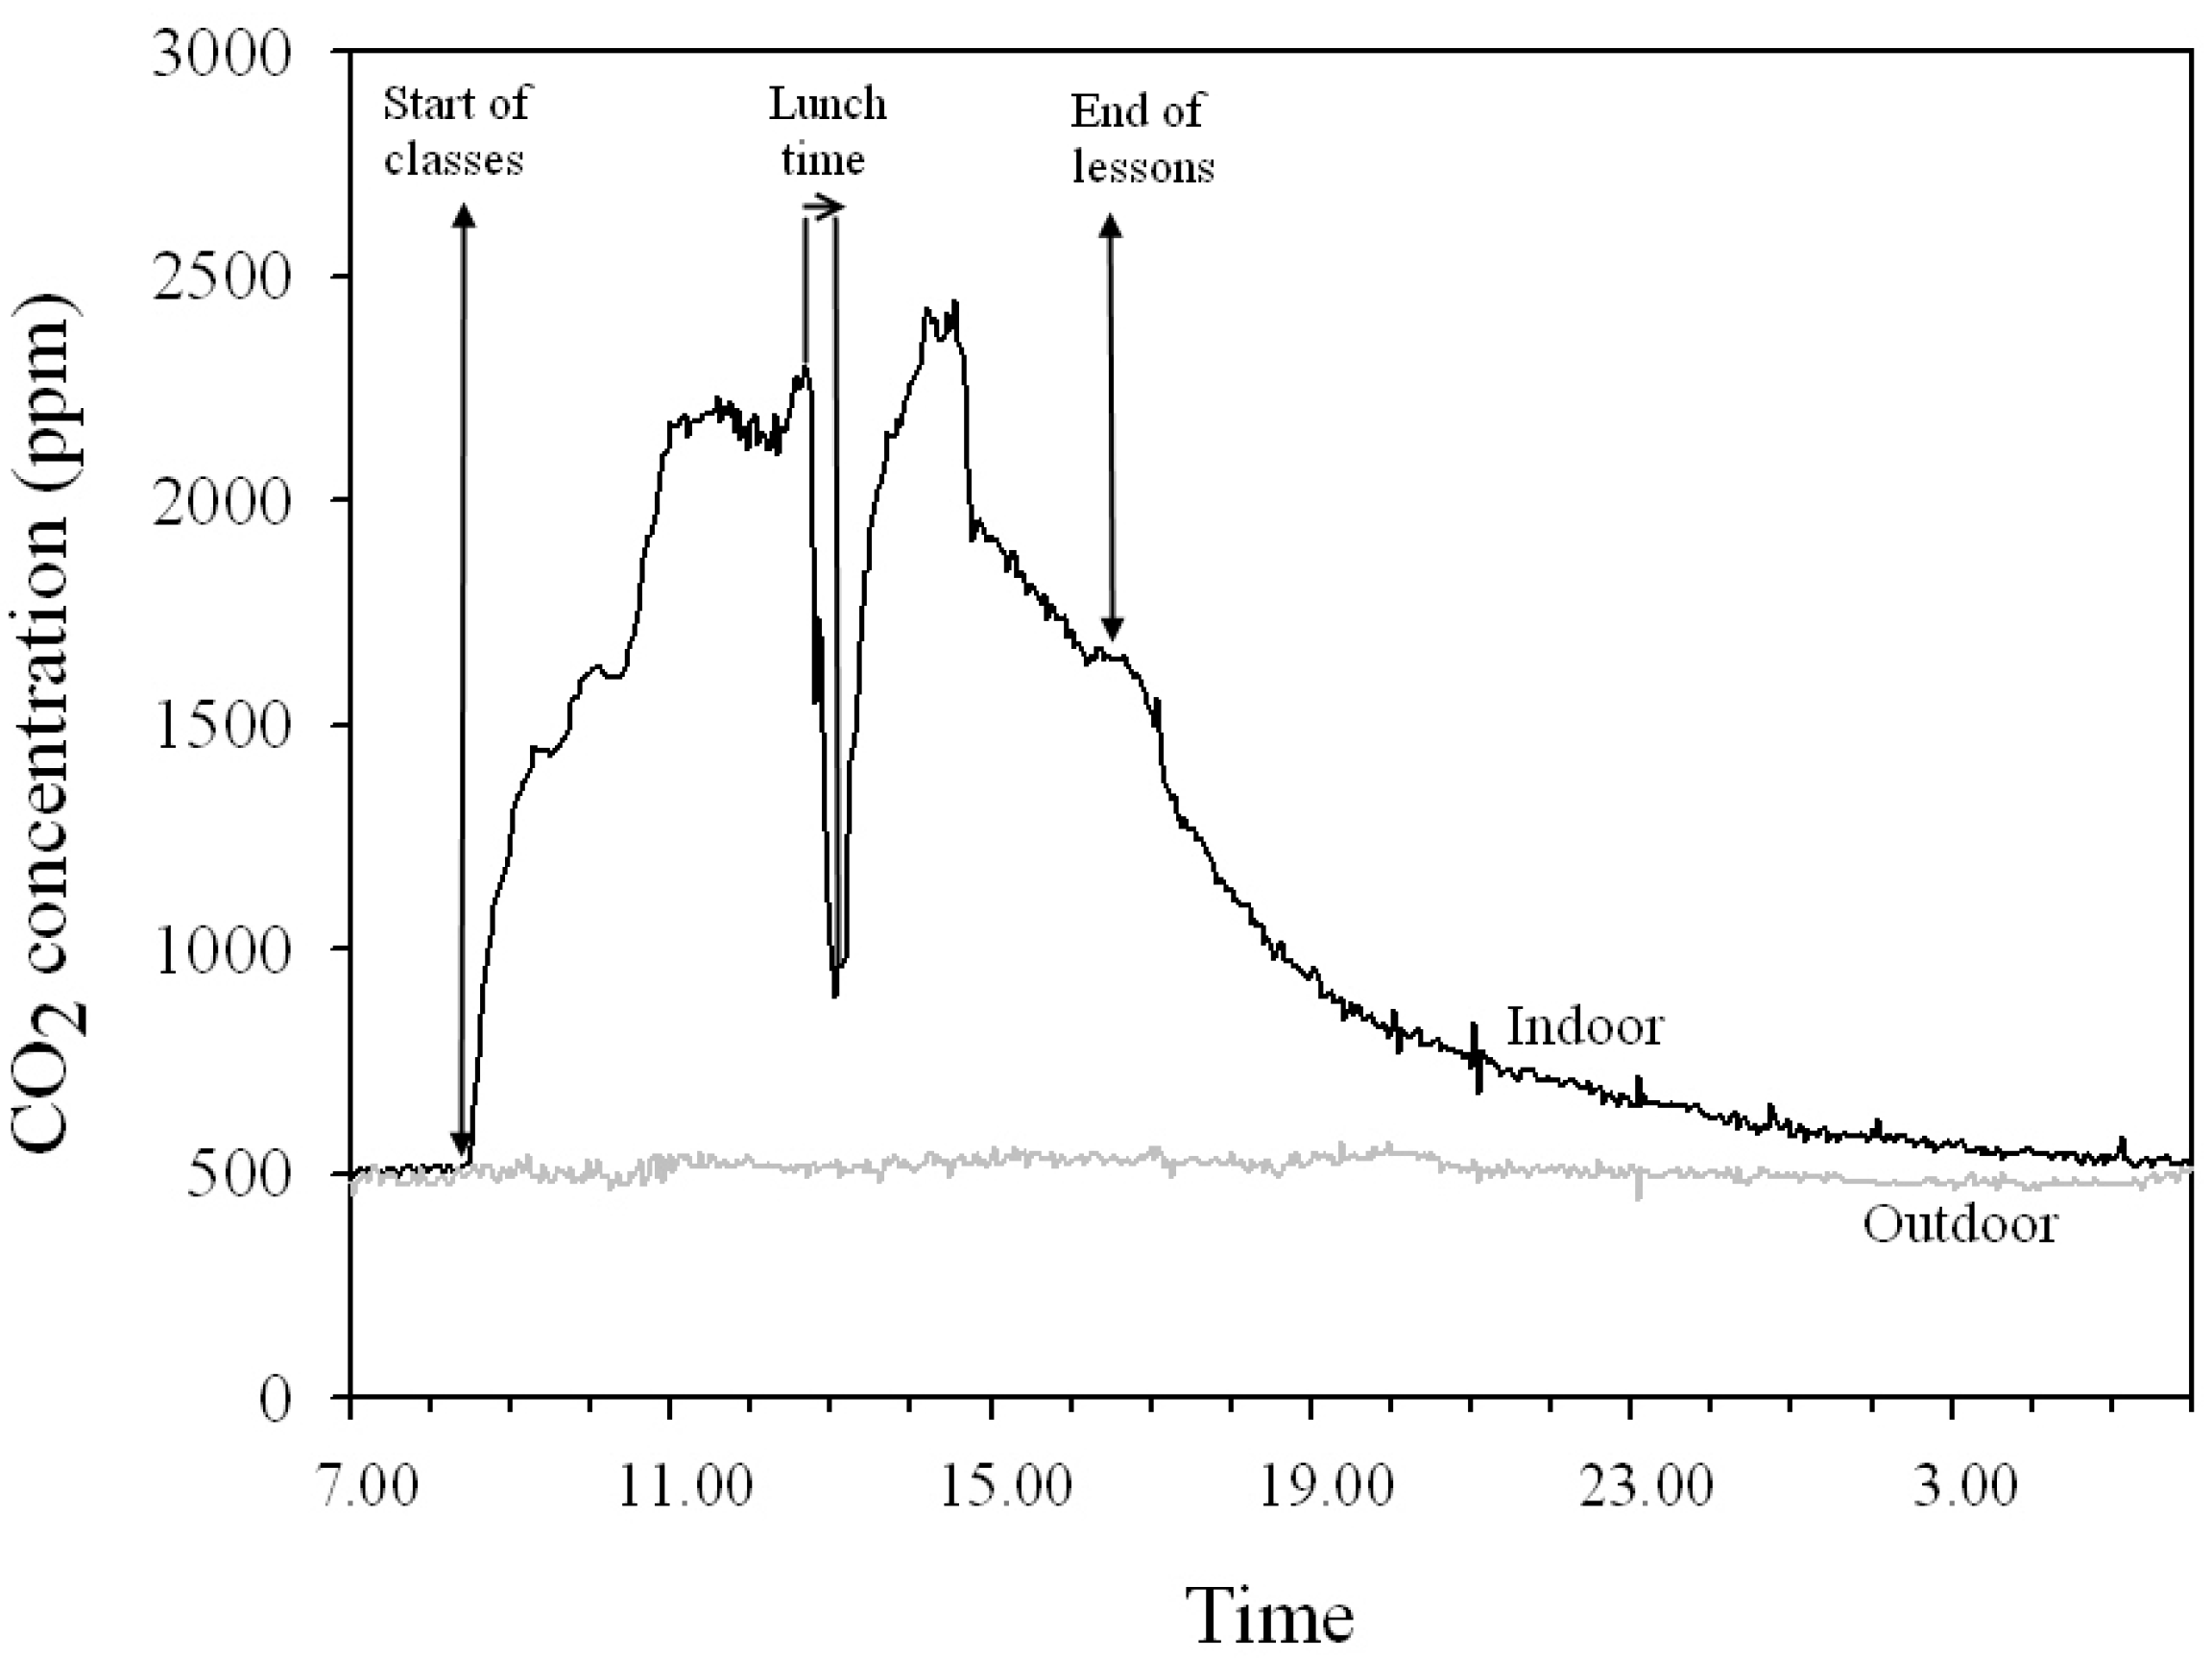
In our study, the CO2 ASRHAE Standard was exceeded for the majority of the time occupants spent in the classrooms (73%). The closing of windows and doors, inadequate ventilation rates and overcrowded rooms could be responsible for the high indoor CO2 levels monitored during lessons. Intervention measures that appeared to decrease the indoor CO2 levels in SC2 were unable, anyway, to reduce the classroom CO2 concentrations below 1,000 ppm during teaching hours (Table 4).

5. Conclusions

Indoor and outdoor size-fractioned PM was measured in seven school buildings in Milan, in order to characterize the concentration levels in classrooms, compare the measured concentrations with the recommended guideline values and give a first assessment regarding the efficacy of intervention measures applied to mitigate the exposure to indoor air pollutants.
Results revealed a general situation of poor IAQ in schools and confirmed that PM represents a significant concern in school classrooms, especially for the particle fractions affected by indoor re-suspension phenomena. The presence of important indoor sources of coarse particles (human movements, personal clouds, and cleaning activities) markedly increased PM levels during school hours. PM2.5 indoor levels were less affected by indoor sources, with a major impact on the PM1–2.5 fraction. Over half of the indoor fine particles were estimated to originate from outdoors. In several cases, indoor PM2.5 and PM10 24-h concentrations exceeded the corresponding 24-h guideline values established by the WHO. Furthermore, indoor CO2 levels often exceeded the ASHRAE Standard, related with the possible perception of body odors.
Risk mitigation measures are strongly recommended to improve IAQ in classrooms. In general, better cleaning of surfaces can aid the removal of settled particles, preventing their re-suspension, with a major impact on the coarse particle fraction; PM may also be diluted by more adequate ventilation of rooms through the opening of windows or the use of exhaust fans. In addition, increasing the rate of ventilation and decreasing the occupant density could reduce indoor CO2 concentrations, with beneficial effects on IAQ and the productivity of the children.
To a first approximation, the intervention proposed between SC1 and SC2 to reduce indoor particle levels didn’t seem to significantly influence the indoor fine PM concentrations, probably due to the limited available information and the limited number of classrooms involved in the risk mitigation program. The intervention effectiveness would likely be more pronounced if coarse particles or PM10 would be selected for study. As regard CO2, the more frequent opening of doors and windows seemed to significantly reduce the average CO2 indoor levels in naturally ventilated classrooms.
In light of these preliminary findings and the lack of studies assessing PM exposure following intervention of risk mitigation in classrooms, similar investigations, supported by a greater number of schools and more detailed information about the frequency and intensity of cleaning activities and opening of windows, are suggested.

Acknowledgments

The present study was conducted within the framework of the CCM-Indoor school project co-funded by the National Center for the Prevention and Control of Diseases of the Ministry of Health (Projects CCM 2010). The authors acknowledge Alessia Limonta, Marina Limonta, Luca Del Buono and Davide Campagnolo for their help with sampling and data collection.

Author Contributions

Sabrina Rovelli: environmental monitoring, data treatment, statistical analysis and manuscript writing; Andrea Cattaneo: environmental monitoring, collaboration to data analysis, interpretation and manuscript writing; Camilla Paola Nuzzi: environmental monitoring; Andrea Spinazzè: environmental monitoring and collaboration to statistical analysis; Silvia Piazza: contact with school principals and teachers, gathering information on classroom occupancy and lesson hours; Paolo Carrer: project local supervisor; Domenico Maria Cavallo: scientific supervisor of environmental monitoring.

Conflicts of Interest

The authors declare no conflict of interest.

References

  1. Moschandreas, D.J.; Zabransky, J.; Pelton, D.J. Comparison of Indoor-Outdoor Concentrations of Atmospheric Pollutants. In GEOMET Report; No. ES-823; Electric Power Research Institute: Palo Alto, CA, USA, 1980. [Google Scholar]
  2. World Health Organization (WHO). WHO Guidelines for Indoor Air Quality: Selected Pollutants; WHO: Geneva, Switzerland, 2010. [Google Scholar]
  3. Maroni, M.; Seifert, B.; Lindvall, T. Indoor Air Quality—A Comprehensive Reference Book; Elsevier: Amsterdam, The Netherlands, 1995. [Google Scholar]
  4. Bluyssen, P.M.; Janssen, S.; van den Brink, L.H.; de Kluizenaar, Y. Assessment of wellbeing in an indoor office environment. Build. Environ. 2011, 46, 2632–2640. [Google Scholar] [CrossRef]
  5. Godoi, R.H.M.; Avigo, D., Jr.; Campos, V.P.; Tavares, T.M.; de Marchi, M.M.R.; van Grieker, R.; Godoi, A.F.L. Indoor air quality assessment of elementary schools in Curitiba, Brazil. Water Air Soil Poll. 2009, 9, 171–177. [Google Scholar] [CrossRef]
  6. Lee, S.C.; Chang, M. Indoor and outdoor air quality investigation at schools in Hong Kong. Chemosphere 2000, 41, 109–113. [Google Scholar] [CrossRef]
  7. Avigo, D., Jr.; Godoi, A.F.L.; Janissek, P.R.; Makarovska, Y.; Krata, A.; Potgieter-Vermaak, S.; Alfoldy, B.; Grieken, R.V.; Godoi, R.H.M. Particulate Matter analysis at elementary schools in Curitiba, Brazil. Anal. Bioanal. Chem. 2008, 391, 1459–1468. [Google Scholar] [CrossRef]
  8. Blondeau, P.; Iordache, V.; Poupard, O.; Genin, D.; Allard, F. Relationship between outdoor and indoor air quality in eight French schools. Indoor Air 2005, 15, 2–12. [Google Scholar]
  9. Mendell, M.J.; Heath, G.A. Do indoor pollutants and thermal conditions in schools influence student performance? A critical review of the literature. Indoor Air 2005, 15, 27–52. [Google Scholar] [CrossRef]
  10. Myhrvold, A.N.; Olsen, E.; Lauridsen, Ø. Indoor Environment in Schools—Pupils Health and Performance In Regard To CO2 Concentrations. In Proceedings of Indoor Air ’96, the 7th International Conference on Indoor Air Quality and Climate, Nagoya, Japan, 21–26 July 1996.
  11. Branis, M.; Rezacova, P.; Domasova, M. The effect of outdoor air and indoor human activity on mass concentration of PM10, PM2.5 and PM1 in a classroom. Environ. Res. 2005, 99, 143–149. [Google Scholar] [CrossRef]
  12. Fromme, H.; Diemer, J.; Dietrich, S.; Cyrys, J.; Heinrich, J.; Lang, W.; Kiranoglu, M.; Twardella, D. Chemical and morphological properties of particulate matter (PM10, PM2.5) in school classrooms and outdoor air. Atmos. Environ. 2008, 42, 6597–6605. [Google Scholar] [CrossRef]
  13. Fromme, H.; Twardella, D.; Dietrich, S.; Heitmann, D.; Schierl, R.; Liebl, B.; Ruden, H. Particulate matter in the indoor air of classrooms—exploratory results from Munich and surrounding area. Atmos. Environ. 2007, 41, 854–866. [Google Scholar] [CrossRef]
  14. Stranger, M.; Potgieter-Vermaak, S.S.; van Grieken, R. Comparative overview of indoor air quality in Antwerp, Belgium. Environ. Int. 2007, 33, 789–797. [Google Scholar] [CrossRef]
  15. Thatcher, T.L.; Layton, D.W. Deposition, resuspension and penetration of particles within a residence. Atmos. Environ. 1995, 29, 1487–1497. [Google Scholar] [CrossRef]
  16. Stranger, M.; Potgieter-Vermaak, S.S.; van Grieken, R. Characterization of indoor air quality in primary schools in Antwerp, Belgium. Indoor Air 2008, 18, 454–463. [Google Scholar]
  17. Oeder, S.; Dietrich, S.; Weichenmeir, I.; Schober, W.; Pusch, G.; Jorres, R.A.; Schierl, R.; Nowak, D.; Fromme, H.; Behrendt, H.; et al. Toxicity and elemental composition of particulate matter from outdoor and indoor air of elementary schools in Munich, Germany. Indoor Air 2012, 22, 148–158. [Google Scholar]
  18. Italian Ministry of Health. Schema Di Linee Di Indirizzo Per La Prevenzione Nelle Scuole Dei Fattori Di Rischio Indoor Per Allergie E Asma; Italian Ministry of Health: Rome, Italy, 2010. Available online: http://www.statoregioni.it/Documenti/DOC_029580_124%20cu.pdf (accessed on 29 November 2013).
  19. Evaluating Building IAQ and Ventilation with Indoor Carbon Dioxide. Available online: http://fire.nist.gov/bfrlpubs/build97/PDF/b97044.pdf (accessed on 29 November 2013).
  20. Vecchi, R.; Marcazzan, G.; Valli, G.; Ceriani, M.; Antoniazzi, C. The role of atmospheric dispersion in the seasonal variation of PM1 and PM2.5 concentration and composition in the urban area of Milan (Italy). Atmos. Environ. 2004, 38, 4437–4446. [Google Scholar] [CrossRef]
  21. Branis, M. The Effects of Season and Microenvironment Type on Measurement Bias of A DustTrak Photometer. In Proceedings of the European Aerosol Conference, Karlsruhe, Germany, 6–11 September 2009.
  22. Hanninen, O.O.; Lebret, E.; Ilacqua, V.; Katsouyanni, K.; Kunzli, N.; Sram, R.J.; Jantunen, M. Infiltration of ambient PM2.5 and levels of indoor generated non-ETS PM2.5 in residences of four European cities. Atmos. Environ. 2004, 38, 6411–6423. [Google Scholar] [CrossRef]
  23. World Health Organization (WHO). Air Quality Guidelines: Global Update 2005: Particulate Matter, Ozone, Nitrogen Dioxide and Sulfur Dioxide; WHO Regional Office for Europe: Copenhagen, Denmark, 2006. [Google Scholar]
  24. American Society of Heating, Refrigeration and Air Conditioning Engineers (ASHRAE). Standard 62–1989. Ventilation for Acceptable Indoor Air Quality; ASHRAE Inc.: Atlanta, GA, USA, 1989. [Google Scholar]
  25. Roorda-Knape, M.C.; Janssen, N.A.H.; de Hartog, J.J.; van Vliet, P.H.N.; Harssema, H.; Brunekreef, B. Air pollution from traffic in city districts near major motorways. Atmos. Environ. 1998, 32, 1921–1930. [Google Scholar] [CrossRef]
  26. Link, B.; Gabrio, T.; Zollner, I.; Schwenk, M.; Siegel, D.; Schultz, E.; Scharring, S.; Borm, P. Feinstaubbelastung Und Deren Gesundheitliche Wirkungen Bei Kinder; Bericht des landesgesundheitsamtes Baden-Württemberg: Stuttgart, Germany, 2004. [Google Scholar]
  27. Diapouli, E.; Chaloulakou, A.; Mihalopoulos, N.; Spyrellis, N. Indoor and outdoor PM mass and number concentrations at schools in the Athens area. Environ. Monit. Assess. 2008, 136, 13–20. [Google Scholar]
  28. Wheeler, A.J.; Williams, I.; Beaumont, R.A.; Hamilton, R.S. Characterization of particulate matter sampled during a study of children’s personal exposure to airborne matter in a UK urban environment. Environ. Monit. Assess. 2000, 65, 69–77. [Google Scholar] [CrossRef]
  29. Yip, F.Y.; Keeler, G.J.; Dvonch, J.T.; Robins, T.G.; Parker, E.A.; Israel, B.A.; Brakefield-Caldwell, W. Personal exposures to particulate matter among children with asthma in Detroit, Michigan. Atmos. Environ. 2004, 38, 5227–5236. [Google Scholar] [CrossRef]
  30. Janssen, N.A.H.; Hoek, G.; Harssema, H.; Brunekreef, B. Childhood exposure to PM10: Relation between personal, classroom and outdoor concentrations. Occup. Environ. Med. 1997, 54, 888–894. [Google Scholar] [CrossRef]
  31. Luoma, M.; Batterman, A. Characterization of particulate emissions from occupant activities in offices. Indoor Air 2001, 11, 35–48. [Google Scholar]
  32. Long, C.M.; Suh, H.H.; Koutrakis, P. Characterization of indoor particle sources using continuous mass and size monitors. J. Air Waste Manage. 2000, 50, 1236–1250. [Google Scholar] [CrossRef]
  33. Crist, K.C.; Liu, B.; Kim, M.; Deshpande, S.R.; John, K. Characterization of fine particulate matter in Ohio: Indoor, outdoor and personal exposures. Environ. Res. 2008, 106, 62–71. [Google Scholar] [CrossRef]
  34. Schwarze, P.E.; Øvrevik, J.; Lag, M.; Refsnes, M.; Nafstad, P.; Hetland, R.B.; Dybing, E. Particulate matter properties and health effects: Consistency of epidemiological and toxicological studies. Hum. Exp. Toxicol. 2006, 25, 559–579. [Google Scholar] [CrossRef]
  35. Cattaneo, A.; Peruzzo, C.; Garramone, G.; Urso, P.; Ruggeri, R.; Carrer, P.; Cavallo, D.M. Airborne particulate matter and gaseous air pollutants in residential structures in Lodi province, Italy. Indoor Air 2011, 21, 489–500. [Google Scholar]
  36. Yang, W.; Sohn, J.; Kim, J.; Son, B.; Park, J. Indoor air quality investigation according to age of the school buildings in Korea. J. Environ. Manage. 2009, 90, 348–354. [Google Scholar] [CrossRef]

