A Bayesian Approach to Estimate the Prevalence of Schistosomiasis japonica Infection in the Hubei Province Lake Regions, China


Abstract
:1. Introduction
2. Methods
2.1. Ethics Statement
2.2. Kato-Katz and IHA
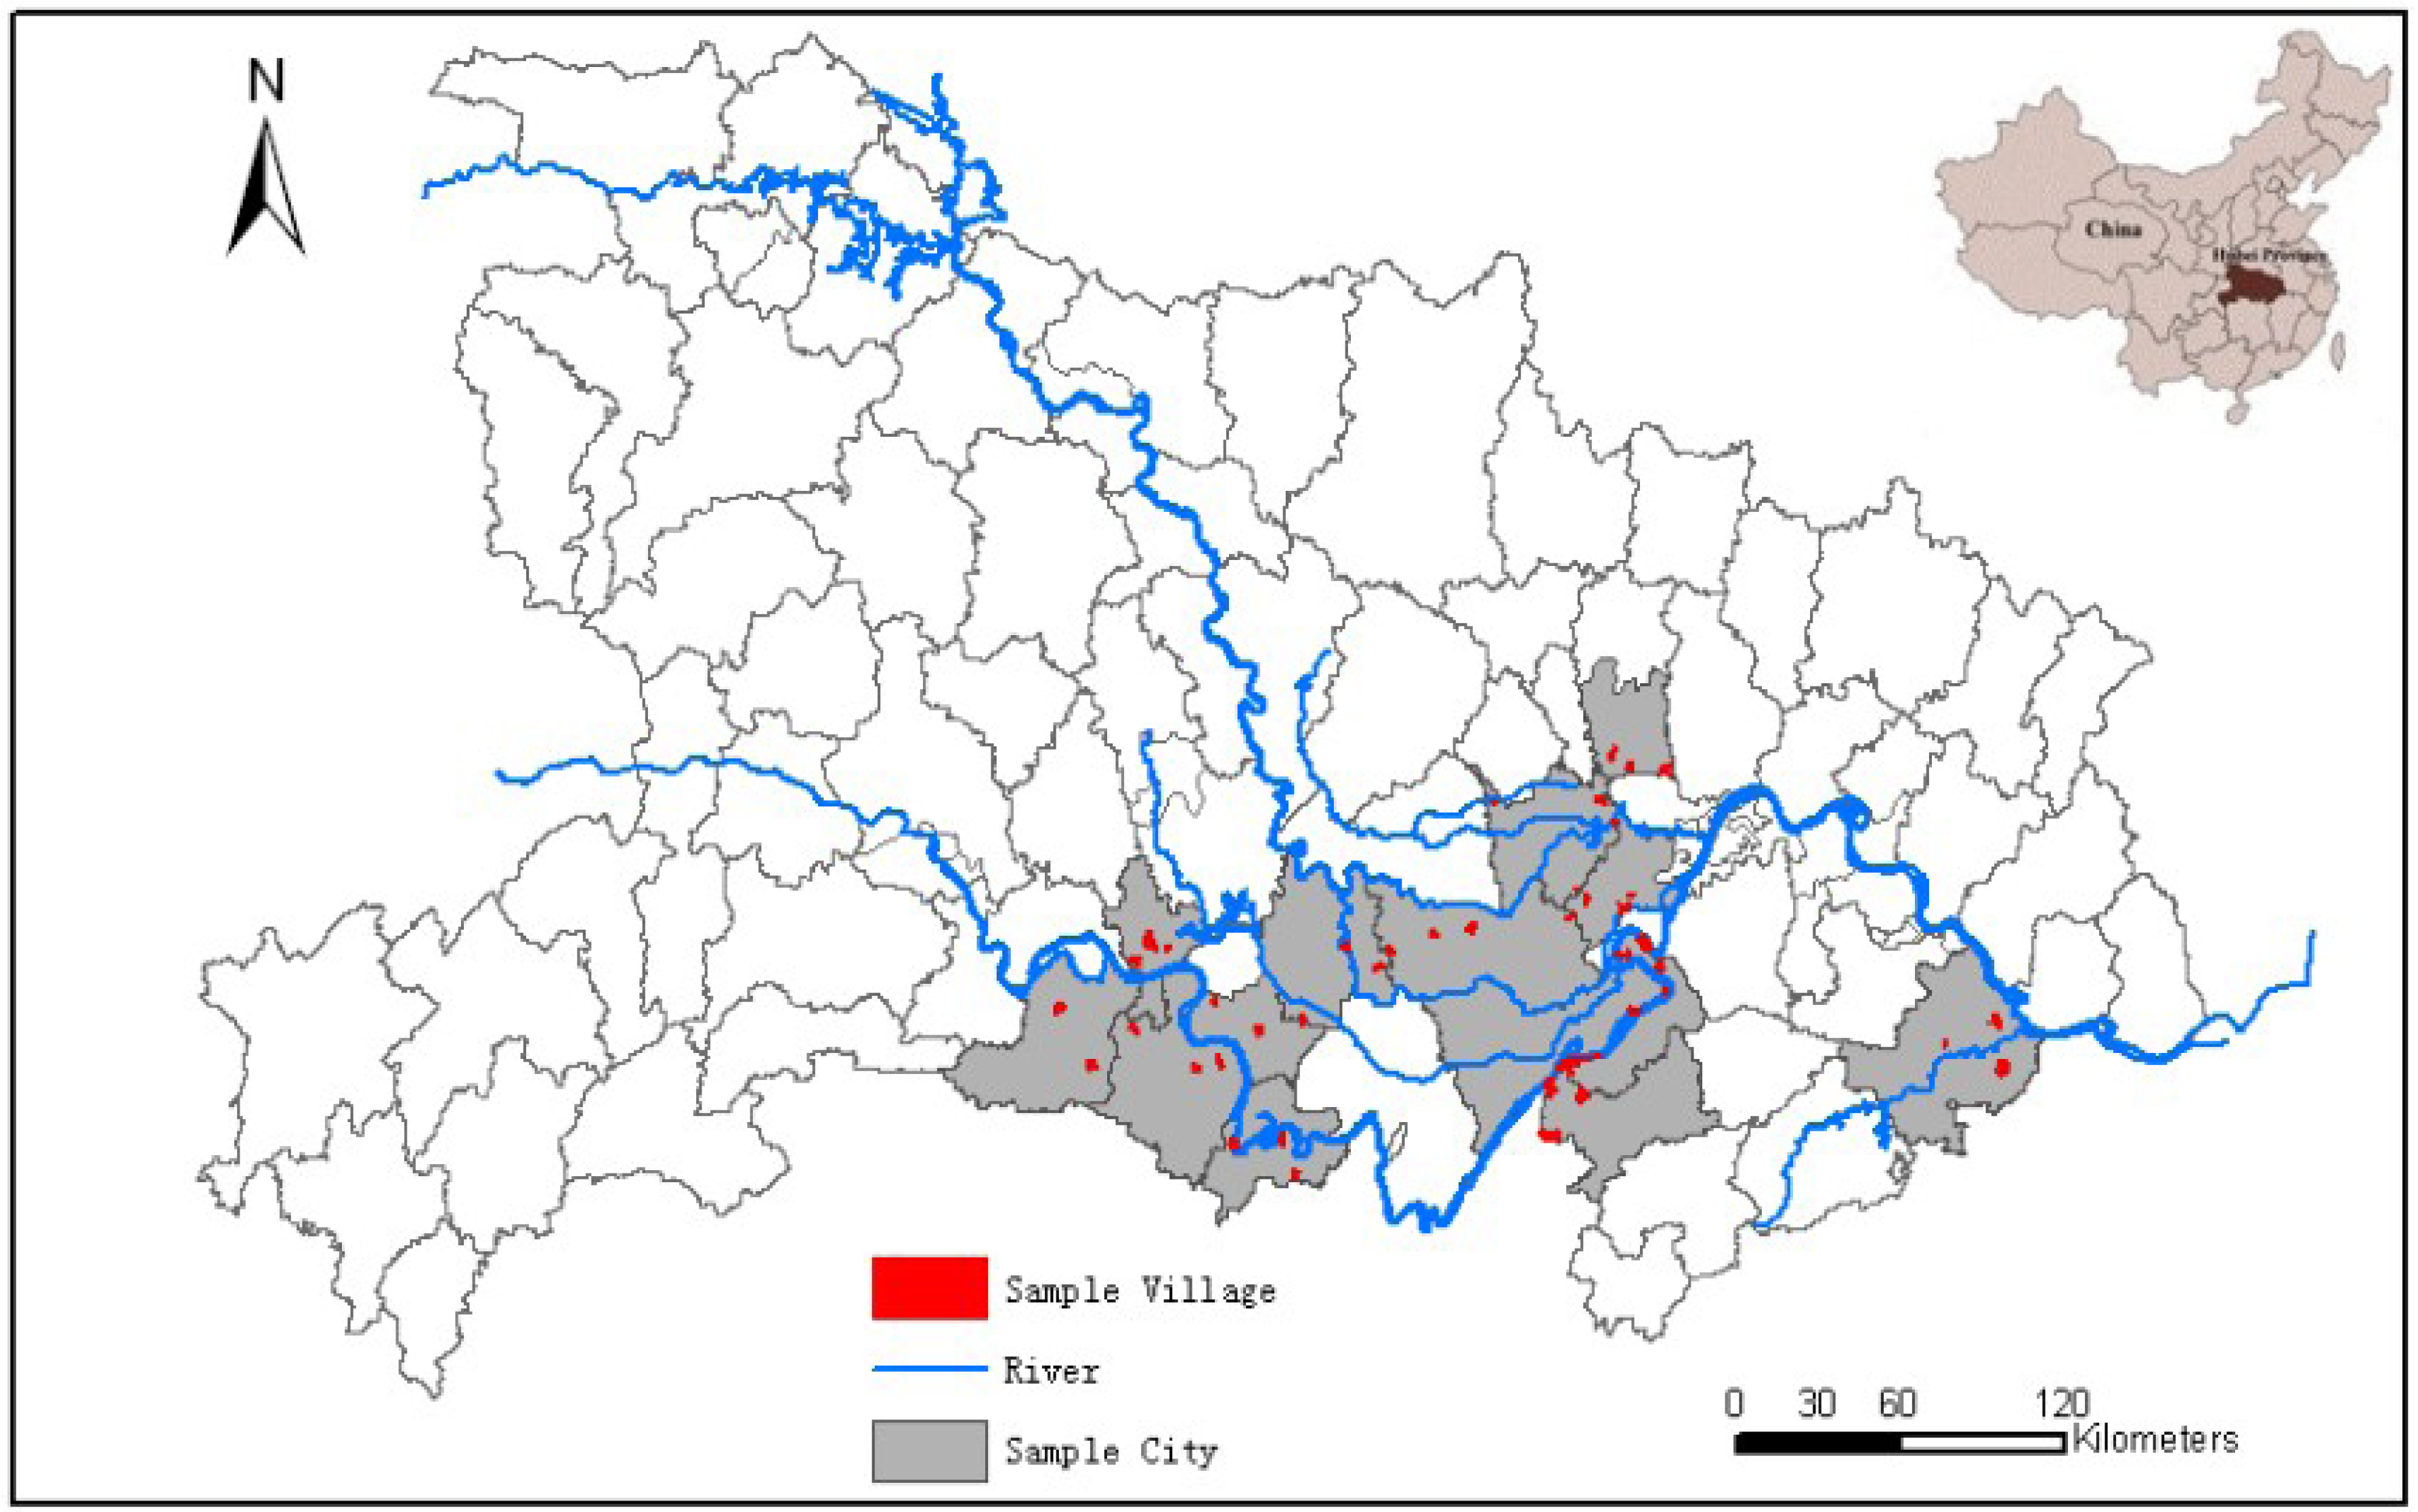
2.3. Investigation of S. japonica Prevalence
2.4. Sensitivities and Specificities of the Tests
2.5. Statistical Analysis
2.5.1. Traditional Statistics
2.5.2. Prior Distribution
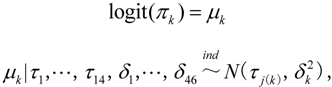
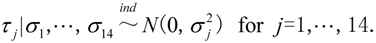
2.5.3. Bayesian Statistics

| IHA | Kato-Katz | Total | |
|---|---|---|---|
| + | − | ||
| + | t2k | t1k − t2k | t1k |
| – | n1k − t1k | ||
| Total | n1k | ||
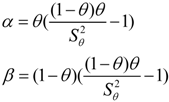
 and
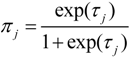
and  accordingly represented the variance. The prevalence of S. japonica infection in each city could be calculated according to the random effects τj as follows:
 and ) of each random effect.
3. Results
| City | IHA Test | Kato-Katz Test | ||||
|---|---|---|---|---|---|---|
| Detected Numbers | Positive Number | seroprevalence a | Detected Numbers | Positive Number | Prevalence of infection b | |
| Caidian [1] | 964 | 13 | 1.3 | 13 | 3 | 0.3 |
| Chibi [2] | 1,002 | 145 | 8.7 | 138 | 12 | 2.1 |
| Gongan [3] | 5,657 | 56 | 15.8 | 42 | 4 | 1.1 |
| Hanchuan [4] | 5,193 | 413 | 8.0 | 385 | 51 | 1.0 |
| Honghu [5] | 6,408 | 124 | 9.3 | 80 | 9 | 1.2 |
| Jiayu [6] | 1,592 | 894 | 5.2 | 880 | 63 | 1.1 |
| Jiangling [7] | 2,449 | 248 | 10.1 | 235 | 32 | 1.4 |
| Jingzhou [8] | 1,562 | 395 | 8.0 | 362 | 40 | 0.9 |
| Qianjiang [9] | 5,019 | 596 | 8.1 | 555 | 71 | 0.8 |
| Shishou [10] | 3,115 | 266 | 12.7 | 175 | 31 | 1.4 |
| Songzi [11] | 3,041 | 83 | 8.7 | 81 | 17 | 1.6 |
| Xiantao [12] | 6,823 | 87 | 2.7 | 38 | 9 | 0.8 |
| Xiaonan [13] | 915 | 182 | 6.1 | 177 | 51 | 0.5 |
| Yangxin [14] | 3,723 | 408 | 3.9 | 371 | 38 | 0.3 |
| Total | 47,463 | 3,912 | 8.2 | 3,532 | 432 | 1.0 |
| Test | Sensitivity | Specificity | ||||
|---|---|---|---|---|---|---|
| Range | α | β | Range | α | β | |
| IHA | 0.80–0.90 | 172.55 | 30.45 | 0.70–0.80 | 224.25 | 74.75 |
| Kato-Katz | 0.20–0.70 | 6.68 | 8.16 | 0.90–1.00 | 71.25 | 3.75 |
| Min | Q1 | Median | Q3 | Max | |
|---|---|---|---|---|---|
| Village prevalence (%) | |||||
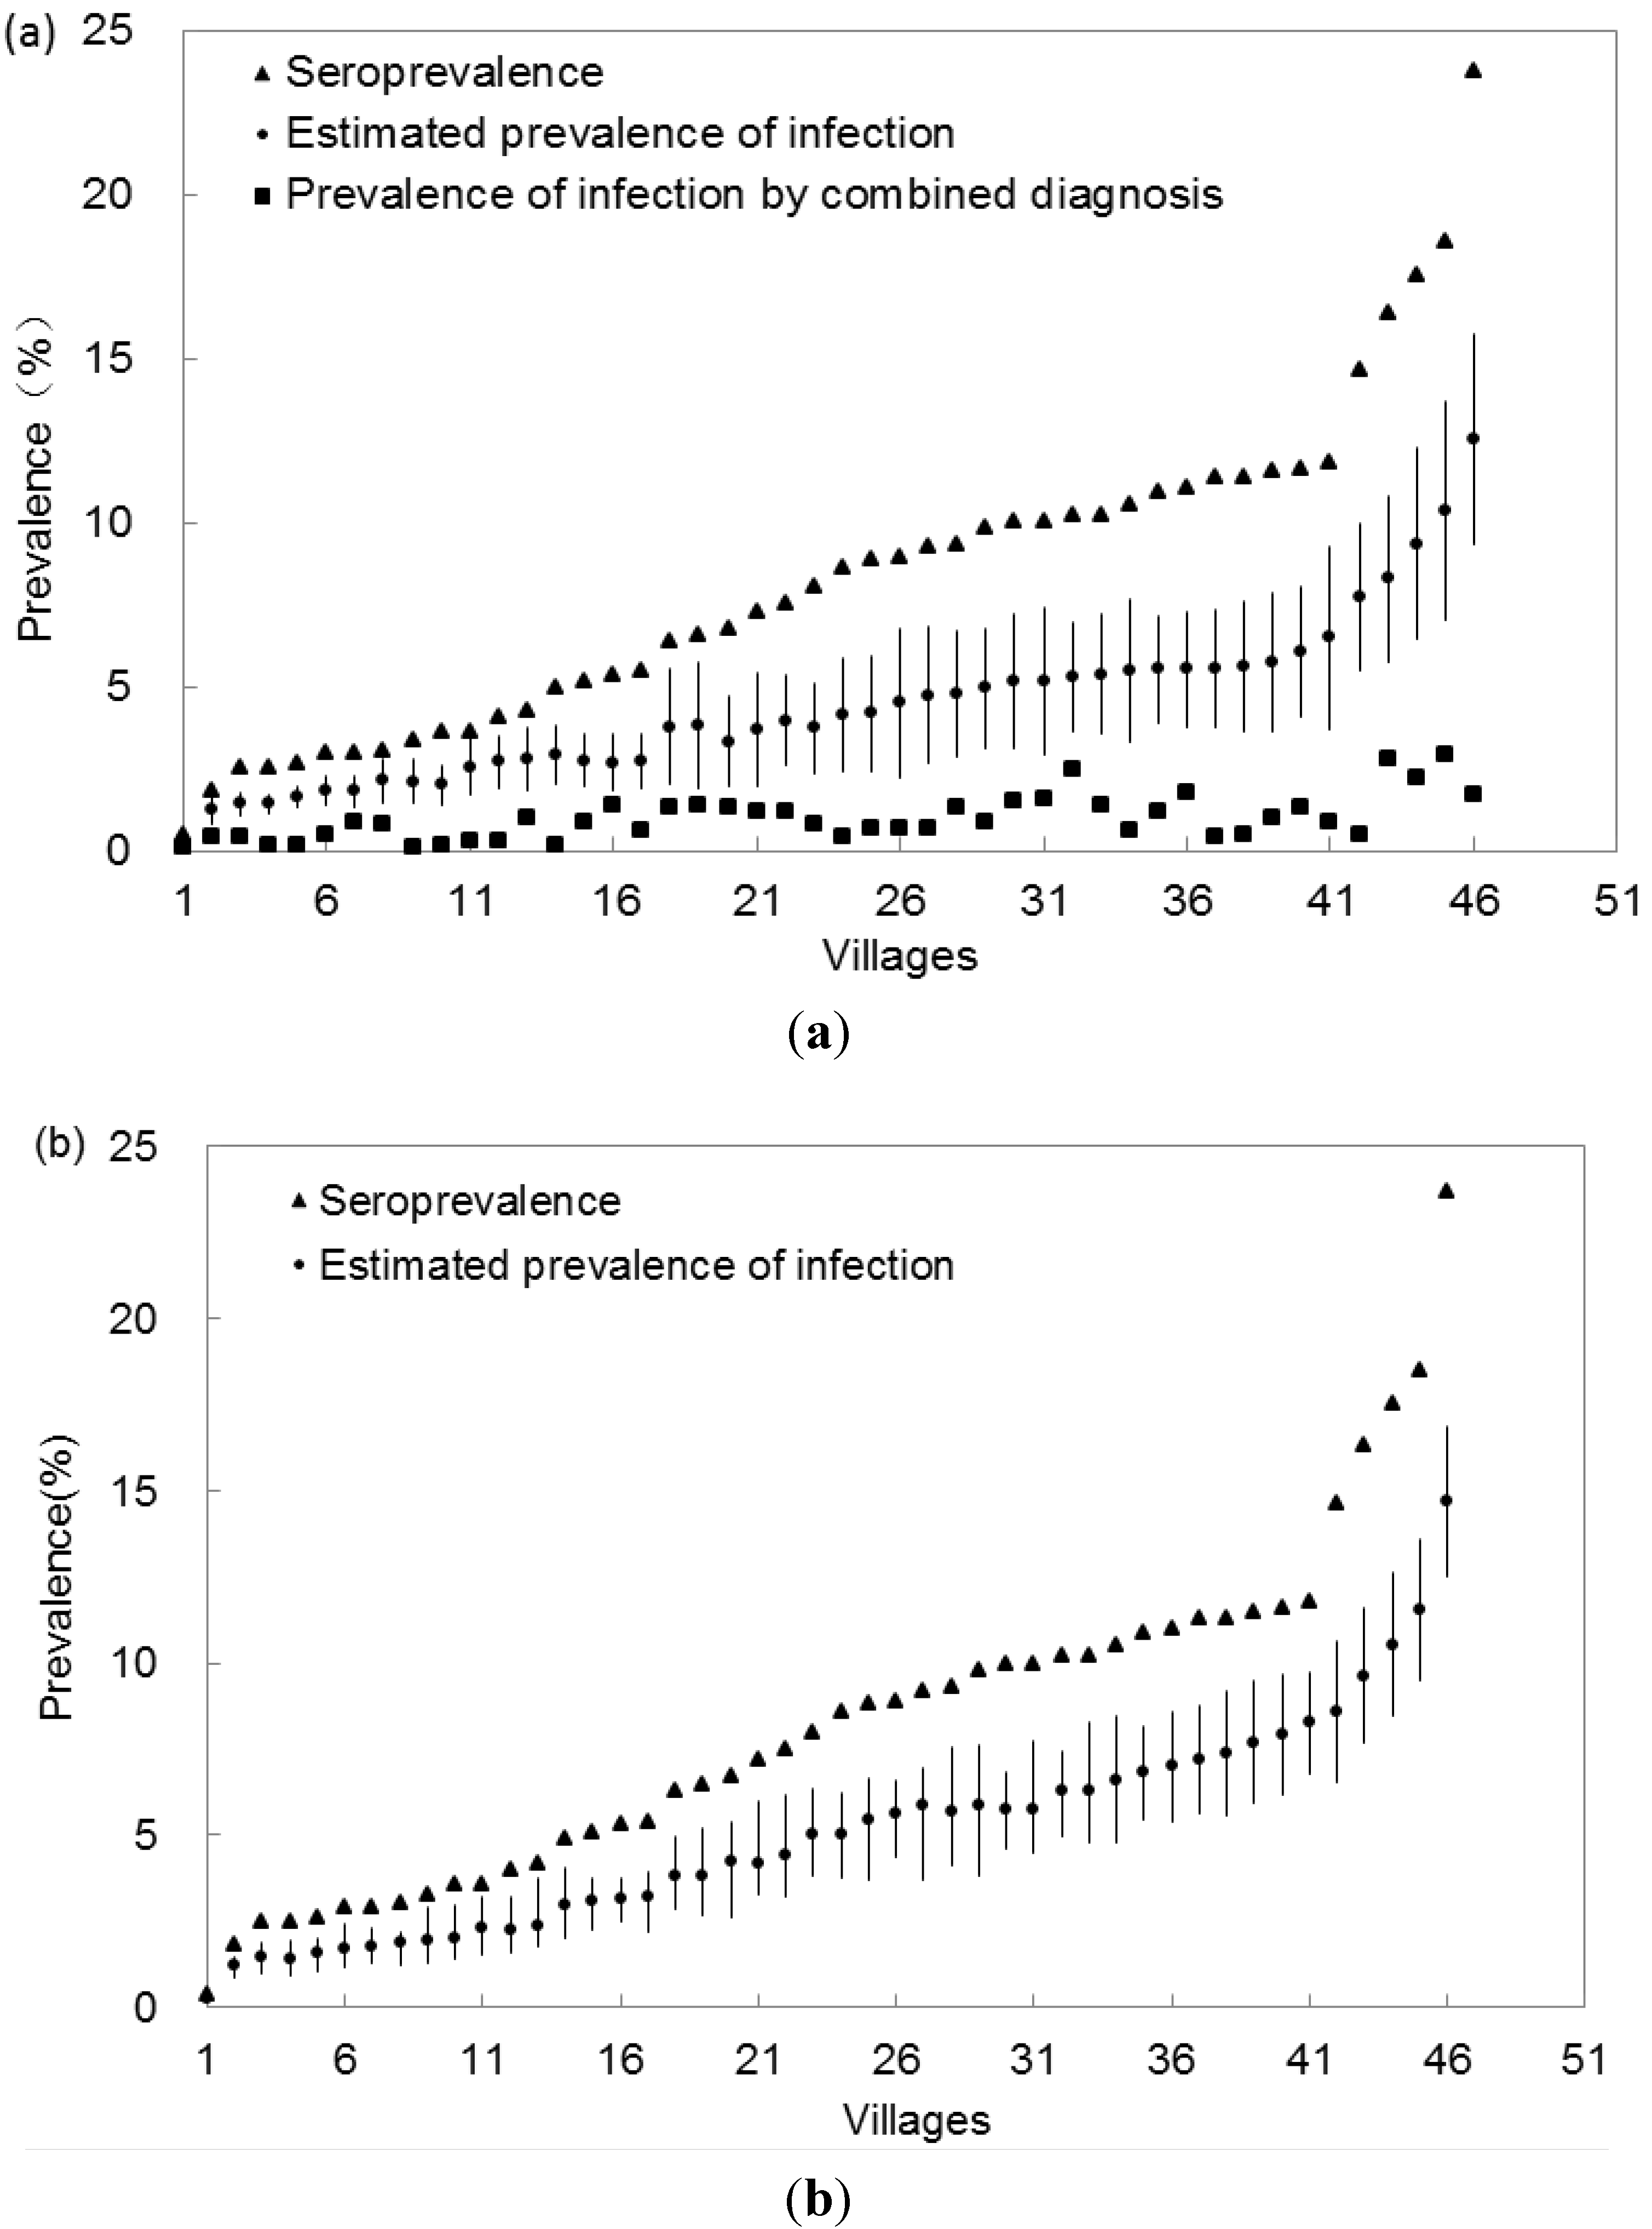
| Situation 1 a | 0.32 | 2.39 | 3.72 | 5.23 | 12.1 |
| Situation 2 b | 0.95 | 2.07 | 4.5 | 5.79 | 12.3 |
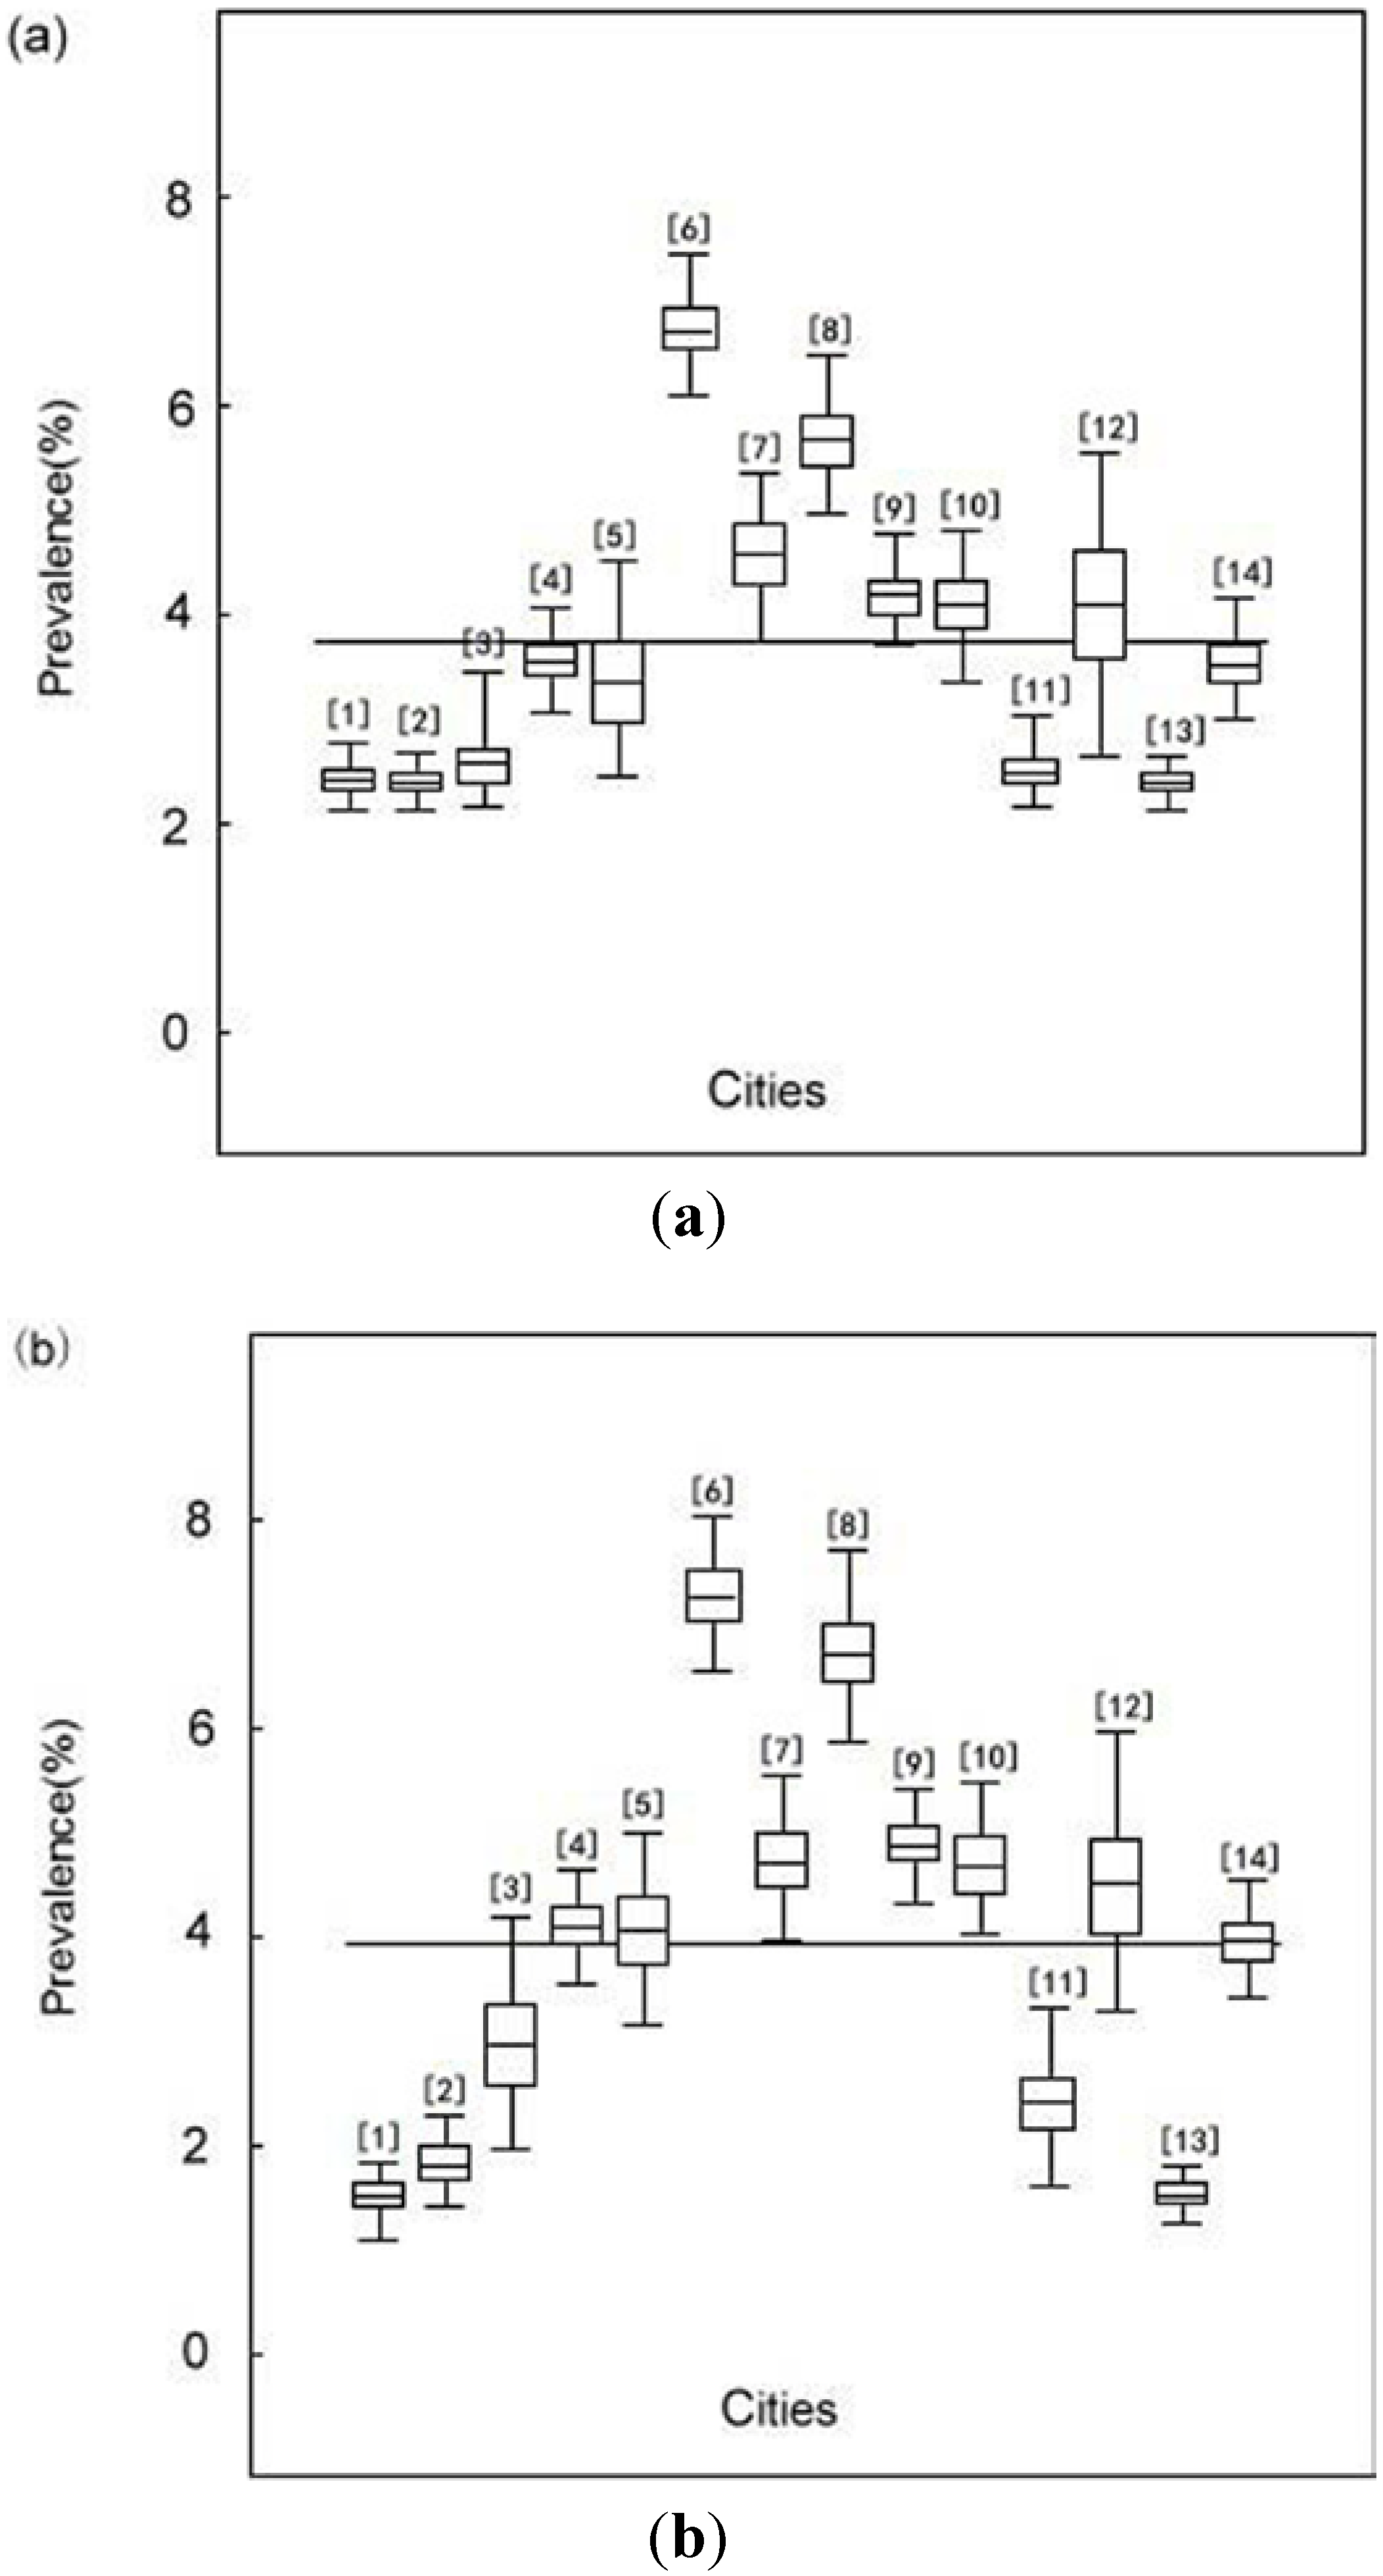
| City prevalence (%) | |||||
| Situation 1 a | 2.39 | 2.51 | 3.54 | 4.17 | 6.72 |
| Situation 2 b | 1.52 | 2.41 | 4.06 | 4.72 | 7.26 |
4. Discussion and Study Limitations
5. Conclusions
Acknowledgements
Conflict of Interest
References
- Zhou, X.N.; Wang, T.P.; Wang, L.Y.; Guo, J.G.; Yu, Q.; Xu, J.; Wang, R.B.; Chen, Z.; Jia, T.W. The current status of schistosomisasis epidemics in China. Chin. J. Epidemiol. 2004, 25, 555–558. [Google Scholar]
- Zhou, X.N.; Wang, L.Y.; Chen, M.G.; Wu, X.H.; Jiang, Q.W.; Chen, X.Y.; Zheng, J.; Utzinger, J. The public health significance and control of schistosomiasis in China—Then and now. Acta Trop. 2005, 96, 97–105. [Google Scholar] [CrossRef]
- Zhou, X.N.; Guo, J.G.; Wu, X.H. Epidemiology of schistosomiasis in the People Republic of China. Emerg. Infect. Dis. 2007, 13, 1470–1476. [Google Scholar] [CrossRef]
- Li, S.Z.; Luz, A.; Wang, X.H.; Xu, L.L.; Wang, Q.; Qian, Y.J.; Wu, X.H.; Guo, J.G.; Xia, G.; Wang, L.Y.; Zhou, X.N. Schistosomiasis in China: Acute infections during 2005–2008. Chin. Med. J. 2009, 122, 1009–1014. [Google Scholar]
- Wang, X.H.; Wang, L.Y.; Xia, G.; Hao, Y.; Chin, D.P.; Zhou, X.N. A strategy to control transmission of Schistosomiasis japonicum in China. N. Engl. J. Med. 2009, 360, 121–128. [Google Scholar] [CrossRef]
- Zhu, H.P.; Yu, C.H.; Xia, X.; Dong, G.Y.; Tang, J.; Fang, L.; Du, Y.K. Assessing the diagnostic accuracy of immunodiagnostic techniques in the diagnosis of Schistosomiasis japonica, a meta-analysis. Parasitol. Res. 2010, 107, 1067–1073. [Google Scholar] [CrossRef]
- Dai, R.J.; Zhu, Y.C.; Liang, Y.S.; Zhao, S.; Li, H.J.; Xu, Y.L.; Hua, W.Q.; Cao, G.Q.; Xu, M. Study on scheme for screening schistosomiasis in low endemic areas. Chi. J. Sch. Con. 2004, 16, 13–15. [Google Scholar]
- Georgiadis, M.P.; Johnson, W.O.; Gardner, I.A.; Singh, R. Correlation adjusted estimation of sensitivity and specificity of two diagnostic tests. Appl. Stat. 2003, 52, 63–76. [Google Scholar]
- Smith, A.F.M.; Robert, G.O. Bayesian computation via the Gibbs sampler and related Marko chain Monte Carlo method. J. Roy. Stat. Soc. 1993, 55, 3–24. [Google Scholar]
- Yu, J.M.; Yuan, H.C.; Yang, Q.J.; de Vlas, S.J.; Gryseels, B. Comparison of common methods in field diagnosis of Schistosoma japonicum infection. Tongji Univ. 2001, 22, 1–4. [Google Scholar]
- Steinmann, P.; Zhou, X.N.; Matthys, B.; Li, Y.L.; Chen, S.R.; Yang, Z.; Fan, W.; Jia, T.W.; Vounatsou, P.; Utzinger, J. Spatial risk profiling of Schistosoma japonicum in Eryuan county, Yunnan province, China. Geospat. Health 2007, 2, 59–73. [Google Scholar]
- He, W.; Zhu, Y.C.; Liang, Y.S.; Dai, J.R.; Xu, M.; Tang, J.X.; Cao, G.Q.; Hua, W.Q.; Li, Y.L.; Yang, Z. Comparison of stool examination and immunodiagnosis for schistosomiasis. Chi. J. Sch. Con. 2007, 19, 107–109. [Google Scholar]
- Xu, J.; Peeling, R.W.; Chen, J.X.; Wu, X.H.; Wu, Z.D.; Wang, S.P.; Feng, T.; Chen, S.H.; Li, H.; Guo, J.G.; Zhou, X.N. Evaluation of immunoassays for the diagnosis of Schistosoma japonicum infection using archived sera. PLoS. Negl. Trop. Dis. 2011, 5. [Google Scholar] [CrossRef]
- Katz, N.; Chaves, A.; Pellegrino, J. A simple device for quantitative stool thick smear technique in Schistosomiasis mansoni. Rev. Inst. Med. Trop. 1972, 14, 397–400. [Google Scholar]
- Yu, J.M.; de Vlas, S.J.; Yuan, H.C.; Gryseels, B. Variations in faecal Schistosoma japonicum egg counts. Am. J. Trop. Med. Hyg. 1998, 59, 370–375. [Google Scholar]
- Wang, E.M.; Xu, Q.; Zhang, S.Q.; Zhang, L.S.; Xie, J.F.; Hao, X.J.; Xiao, X. Advance development of standardized indirect hemagglutination assay kit for detection of Schistosoma japonicum antibody. J. Pathogen. Biol. 2007, 2, 421–423. [Google Scholar]
- Willian, M.B. Introduction to Bayesian Statistics; Wiley: Hoboken, NJ, USA, 2004; pp. 129–146. [Google Scholar]
- Joseph, L.; Gyorkos, T.W.; Coupal, L. Bayesian estimation of disease prevalence and the parameters of diagnostic tests in the absence of a gold standard. Am. J. Epi. 1995, 141, 263–272. [Google Scholar]
- Mao, S.S. Bayesian Statistics, 2nd Ed. ed; Beijing Press: Beijng, China, 1999; pp. 20–23. [Google Scholar]
- Basanez, M.G.; Marshall, C.; Carabing, H.; Gyorkos, T.; Joseph, L. Bayesian statistics for pararsitologists. Trends Parasitol. 2004, 20, 85–91. [Google Scholar] [CrossRef]
- Carabin, H.; Marshall, C.M.; Joseph, L.; Riley, S.; Olveda, R.; McGarvey, S.T. Estimating the intensity of infection with Schistosoma japonicum in villagers of Leyte, Philippines. Part I: A Bayesian cumulative logit model. The schistosomiasis transmission and ecology project (STEP). Am. J. Trop. Med. Hyg. 2005, 72, 745–753. [Google Scholar]
- Schurink, C.A.; Lucas, P.J.; Hoepelman, I.M.; Bonten, M.J. Computer-assisted decision support for the diagnosis and treatment of infectious diseases in intensive care units. Lancet. Infect. Dis. 2005, 5, 305–312. [Google Scholar] [CrossRef]
- Wang, X.H.; Wu, X.H.; Zhou, X.N. Bayesian estimation of community prevalences of Schistosoma japnicum infection in China. Int. J. Parasitol. 2006, 36, 895–902. [Google Scholar] [CrossRef]
- Toft, N.; Jorgensen, E.; Hojsgaard, S. Diagnosing diagnostic tests: Evaluating the assumptions underlying the estimation of sensitivity and specificity in the absence of a gold standard. Prev. Vet. Med. 2005, 68, 19–33. [Google Scholar] [CrossRef]
- Branscum, A.J.; Gardner, I.A.; Johnson, W.O. Bayesian modeling of animal-level and herd-level prevalence. Prev. Vet. Med. 2004, 66, 101–112. [Google Scholar] [CrossRef]
- Hanson, T.E.; Johnson, W.O.; Gardner, I.A. Log-linear and logistic modeling of dependence among diagnostic tests. Prev. Vet. Med. 2000, 45, 123–137. [Google Scholar] [CrossRef]
© 2013 by the authors; licensee MDPI, Basel, Switzerland. This article is an open access article distributed under the terms and conditions of the Creative Commons Attribution license (http://creativecommons.org/licenses/by/3.0/).
Share and Cite
Xia, X.; Zhu, H.-P.; Yu, C.-H.; Xu, X.-J.; Li, R.-D.; Qiu, J. A Bayesian Approach to Estimate the Prevalence of Schistosomiasis japonica Infection in the Hubei Province Lake Regions, China. Int. J. Environ. Res. Public Health 2013, 10, 2799-2812. https://doi.org/10.3390/ijerph10072799
Xia X, Zhu H-P, Yu C-H, Xu X-J, Li R-D, Qiu J. A Bayesian Approach to Estimate the Prevalence of Schistosomiasis japonica Infection in the Hubei Province Lake Regions, China. International Journal of Environmental Research and Public Health. 2013; 10(7):2799-2812. https://doi.org/10.3390/ijerph10072799
Chicago/Turabian StyleXia, Xin, Hui-Ping Zhu, Chuan-Hua Yu, Xing-Jian Xu, Ren-Dong Li, and Juan Qiu. 2013. "A Bayesian Approach to Estimate the Prevalence of Schistosomiasis japonica Infection in the Hubei Province Lake Regions, China" International Journal of Environmental Research and Public Health 10, no. 7: 2799-2812. https://doi.org/10.3390/ijerph10072799