Article

Vibrio vulnificus MO6-24/O Lipopolysaccharide Stimulates Superoxide Anion, Thromboxane B2, Matrix Metalloproteinase-9, Cytokine and Chemokine Release by Rat Brain Microglia in Vitro

1
Department of Pharmacology, Chicago College of Osteopathic Medicine, Midwestern University, 555 31st Street, Downers Grove, IL 60515, USA
2
Biomedical Sciences Program, College of Health Science, Midwestern University, 555 31st Street, Downers Grove, IL 60515, USA
3
Department of Chemical Sciences, University of Napoli, Via Cintia 4, 80126 Napoli, Italy
4
Department of Biomedical and Pharmaceutical Sciences, College of Pharmacy, University of Rhode Island, 7 Greenhouse Road, Kingston, RI 02881, USA
5
Department of Epidemiology and Preventive Medicine, University of Maryland School of Medicine, 10 Pine St, Baltimore, MD 21201, USA
6
Shire Human Genetic Therapies, 300 Shire Way, Lexington, MA 02421, USA
*
Author to whom correspondence should be addressed.
Mar. Drugs 2014, 12(4), 1732-1756; https://doi.org/10.3390/md12041732
Submission received: 28 December 2013 / Revised: 26 February 2014 / Accepted: 26 February 2014 / Published: 26 March 2014
(This article belongs to the Special Issue Marine Lipopolysaccharides)

Abstract

:
Although human exposure to Gram-negative Vibrio vulnificus (V. vulnificus) lipopolysaccharide (LPS) has been reported to result in septic shock, its impact on the central nervous system’s innate immunity remains undetermined. The purpose of this study was to determine whether V. vulnificus MO6-24/O LPS might activate rat microglia in vitro and stimulate the release of superoxide anion (O2), a reactive oxygen species known to cause oxidative stress and neuronal injury in vivo. Brain microglia were isolated from neonatal rats, and then treated with either V. vulnificus MO6-24/O LPS or Escherichia coli O26:B6 LPS for 17 hours in vitro. O2 was determined by cytochrome C reduction, and matrix metalloproteinase-2 (MMP-2) and MMP-9 by gelatinase zymography. Generation of cytokines tumor necrosis factor alpha (TNF-α), interleukin-1 alpha (IL-1α), IL-6, and transforming growth factor-beta 1 (TGF-β1), chemokines macrophage inflammatory protein (MIP-1α)/chemokine (C-C motif) ligand 3 (CCL3), MIP-2/chemokine (C-X-C motif) ligand 2 (CXCL2), monocyte chemotactic protein-1 (MCP-1)/CCL2, and cytokine-induced neutrophil chemoattractant-2alpha/beta (CINC-2α/β)/CXCL3, and brain-derived neurotrophic factor (BDNF), were determined by specific immunoassays. Priming of rat microglia by V. vulnificus MO6-24/O LPS in vitro yielded a bell-shaped dose-response curve for PMA (phorbol 12-myristate 13-acetate)-stimulated O2 generation: (1) 0.1–1 ng/mL V. vulnificus LPS enhanced O2 generation significantly but with limited inflammatory mediator generation; (2) 10–100 ng/mL V. vulnificus LPS maximized O2 generation with concomitant release of thromboxane B2 (TXB2), matrix metalloproteinase-9 (MMP-9), and several cytokines and chemokines; (3) 1000–100,000 ng/mL V. vulnificus LPS, with the exception of TXB2, yielded both attenuated O2 production, and a progressive decrease in MMP-9, cytokines and chemokines investigated. Thus concentration-dependent treatment of neonatal brain microglia with V. vulnificus MO6-24/O LPS resulted in a significant rise in O2 production, followed by a progressive decrease in O2 release, with concomitant release of lactic dehydrogenase (LDH), and generation of TXB2, MMP-9, cytokines and chemokines. We hypothesize that the inflammatory mediators investigated may be cytotoxic to microglia in vitro, by an as yet undetermined autocrine mechanism. Although V. vulnificus LPS was less potent than E. coli LPS in vitro, inflammatory mediator release by the former was clearly more efficacious. Finally, we hypothesize that should V. vulnificus LPS gain entry into the CNS, it would be possible that microglia might become activated, resulting in high levels of O2 as well as neuroinflammatory TXB2, MMP-9, cytokines and chemokines.

1. Introduction

Vibrio vulnificus (V. vulnificus) is a virulent halophilic motile Gram-negative bacterium present in marine, estuarine and aquaculture warm water environments worldwide [1,2]. V. vulnificus may infect humans through contaminated seafood or skin wounds, causing gastroenteritis, necrotic skin infections, primary septicemia, with fatality rates reported to exceed 50% [2,3], and meningitis [4,5]. Although combination antimicrobial therapy of V. vulnificus meningitis has resulted in effective treatment [5], antibiotic resistance in V. vulnificus is a definite concern [3,6]. Clinical and environmental sources of V. vulnificus, which include pathogenic as well as non-pathogenic strains, are currently divided into three biotypes [7,8]. Interestingly, because the biotype of V. vulnificus isolated from cerebrospinal fluid in meningoencephalitis and meningitis cases was not characterized, a correlation between clinical and environmental V. vulnificus biotypes and potential brain infections in humans remains presently undetermined [4,5].
Research into the chemistry and immunotoxicology of V. vulnificus lipopolysaccharides (LPS) was initiated more than two decades ago with the isolation of V. vulnificus LPS [9]. Previous studies have investigated both the O-polysaccharide or O-antigen of the LPS molecule, which are responsible for immunogenicity [10], as well as the lipid A moiety which is associated with Gram-negative septic shock [11]. Several studies on the pathogenicity of V. vulnificus LPS in mice and rats have revealed that it may be pyrogenic and cause cardiovascular injury [10,12,13], which may progress to septic shock and high mortality [10,14], pathological conditions which have been shown to be affected by chronic iron overload, estrogen and low-density lipoprotein [15,16,17,18]. V. vulnificus Biotype 1, strain MO6-24/O, which has been shown to be lethal to mice [14] and to induce both interleukin-6 mRNA and tumor necrosis factor-α (TNF-α) release from human peripheral blood mononuclear cells [19], was used in this study. To our knowledge, there is no report in the literature that has determined the effect of V. vulnificus LPS on brain microglia, the main cell type involved in neuroinflammation [20].
In humans, Gram-negative infections and release of LPS in the circulation may result in a systemic inflammatory response that contributes to sepsis and refractory septic shock [21] and may also impact the brain [22]. Furthermore, if LPS causes a pathological disruption of the blood-brain barrier (BBB) [23] or penetrates the brain via regions where the BBB is defective, it may activate brain microglia [24]. When microglia are activated by LPS via interaction with the CD14 receptor and Toll-like receptor 4 [22,25], inflammatory mediators are released including reactive oxygen species, e.g., O2 [26,27], which may cause neuronal injury [28], and progressive neurodegeneration [29,30]. To our knowledge no studies have been completed to determine the effect of V. vulnificus LPS on brain microglia O2 generation.
The purpose of this investigation was to test the hypothesis that in vitro treatment of neonatal rat microglia with V. vulnificus MO6-24/O LPS might stimulate release of O2, a reactive oxygen species hypothesized to be associated with brain injury [31]. Together with our preliminary communications [32,33,34], the current study provides experimental support for our working hypothesis, namely that V. vulnificus LPS primes rat brain microglia in vitro for O2 generation. Furthermore, O2 generation appeared to be concomitant with the release of several pro-inflammatory mediators, namely thromboxane B2 and matrix metalloproteinases, as well as several cytokines and chemokines.

2. Results

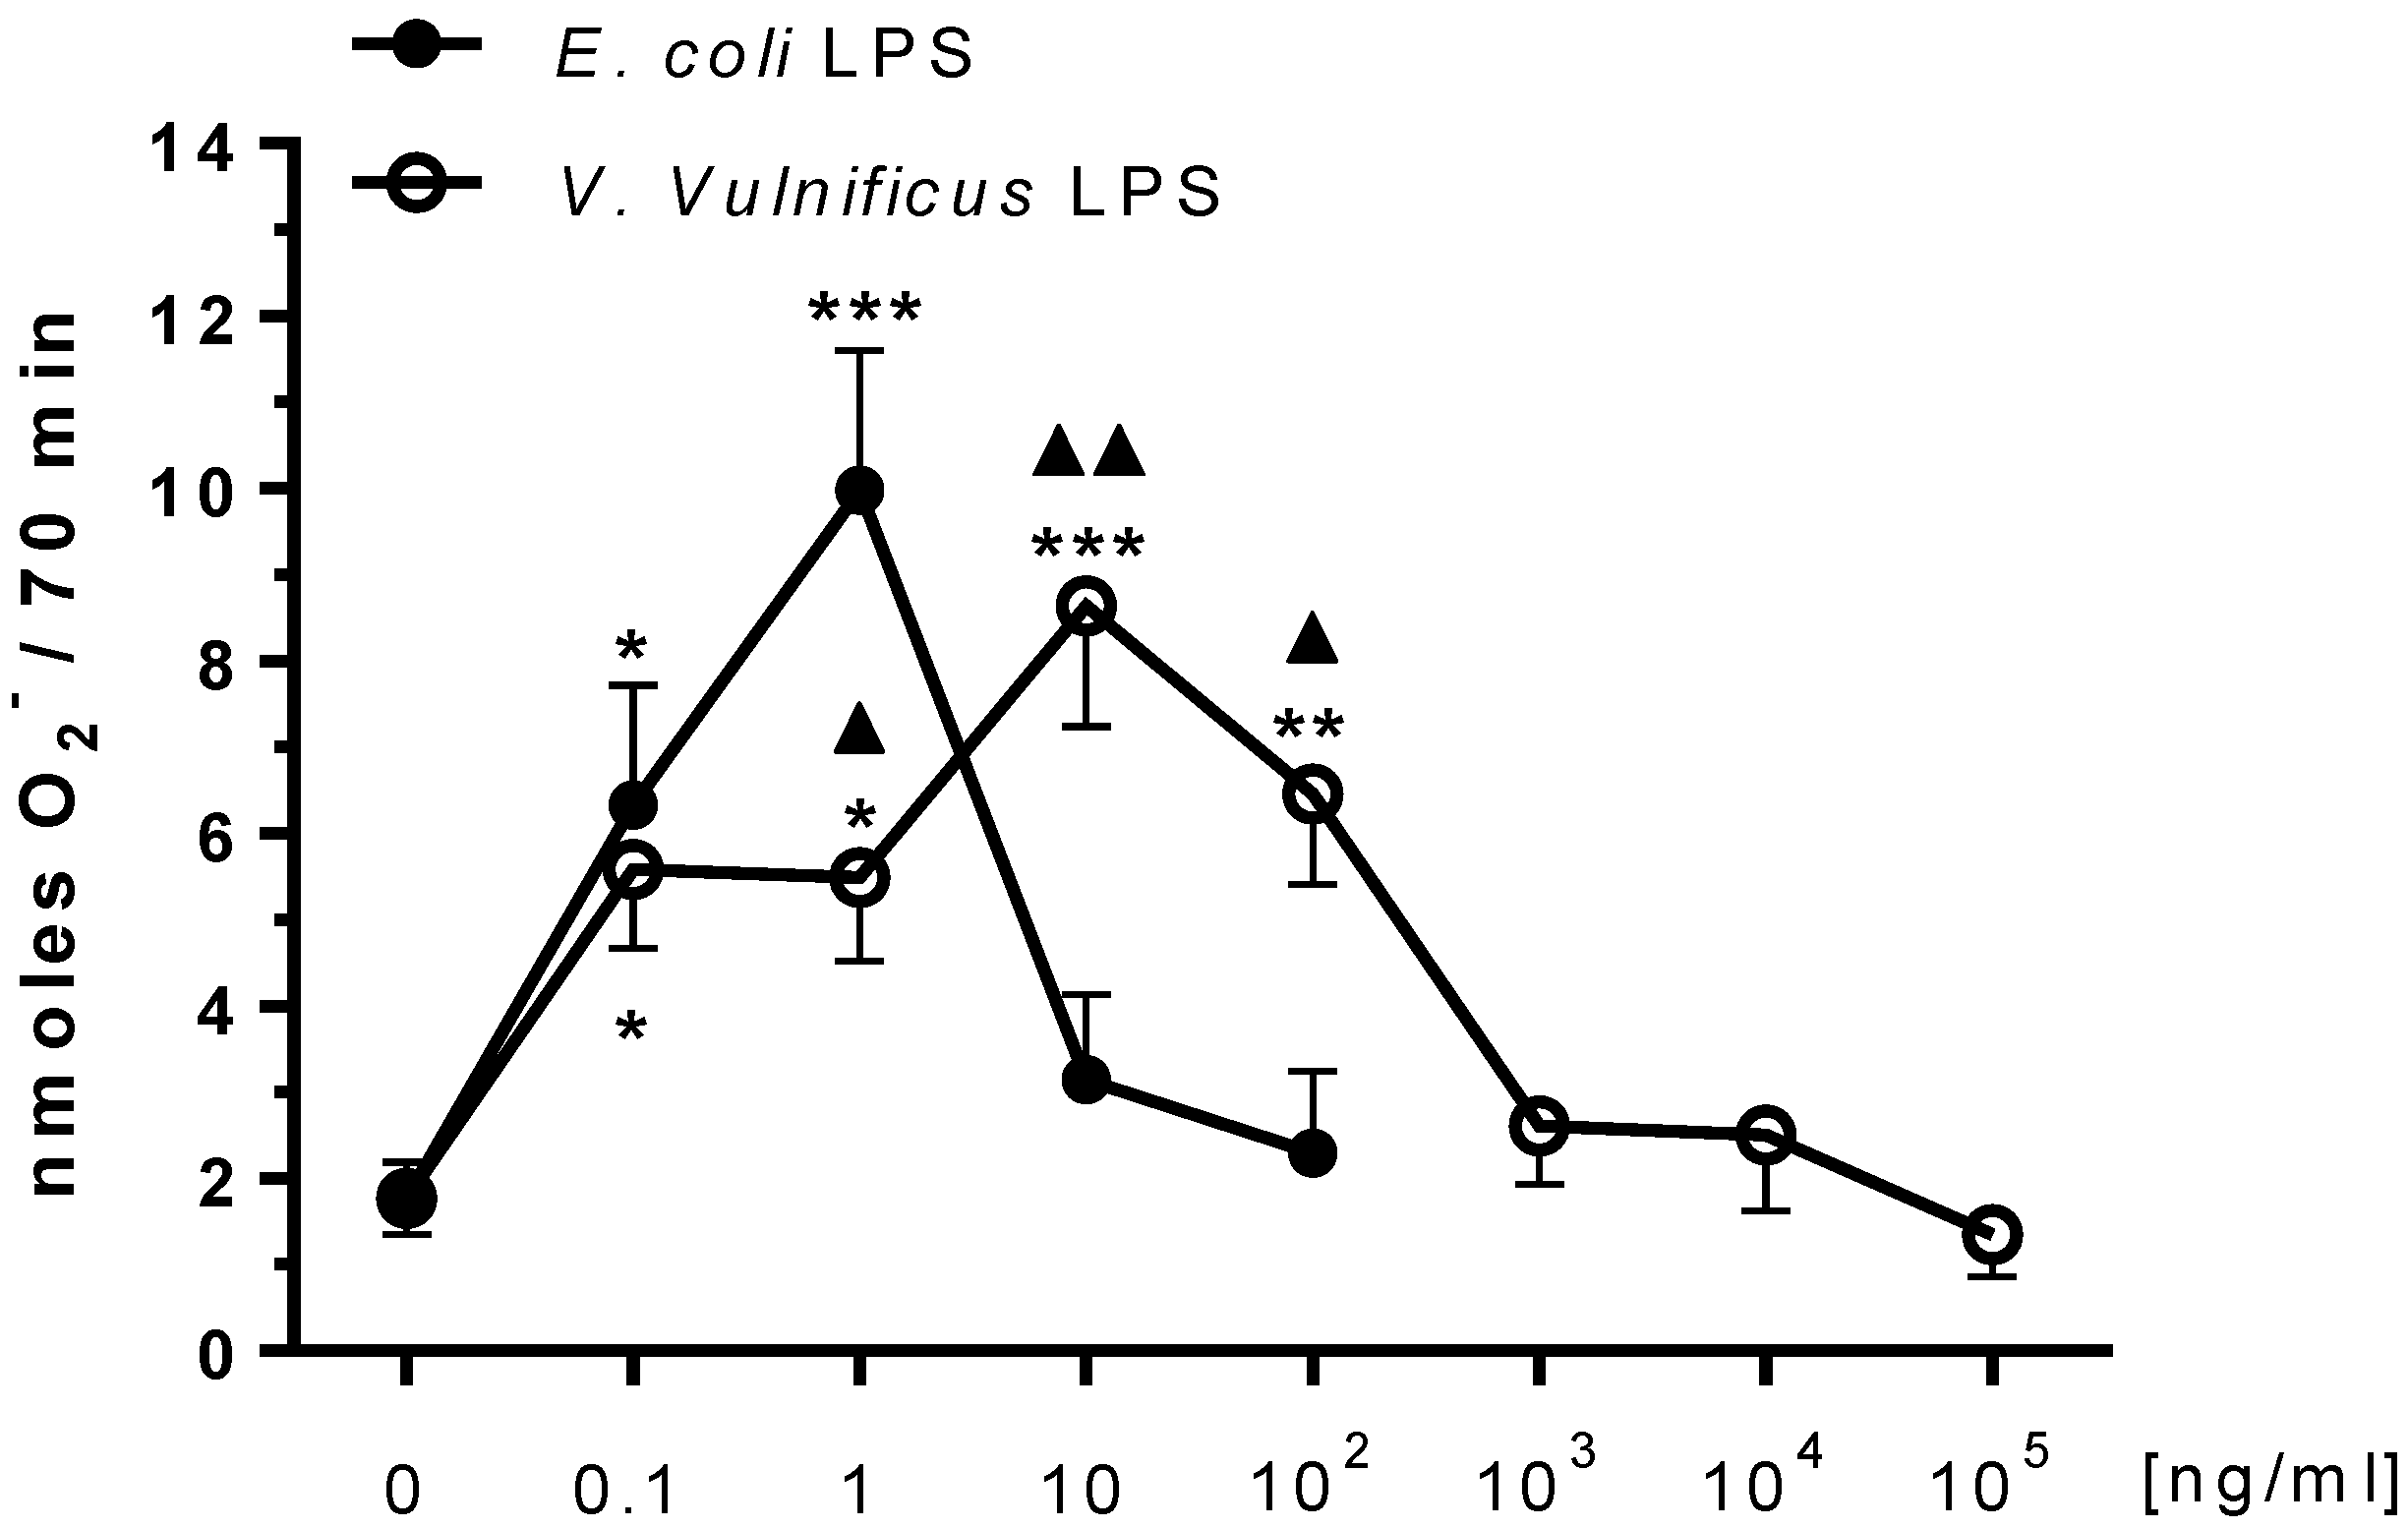
2.1. Effect of V. vulnificus LPS on Rat Brain Microglia O2 Generation

Microglia reactive oxygen species generation has been reported to be associated with oxidative stress in chronic neurodegenerative diseases [35,36,37]. We have repeatedly observed that E. coli LPS pre-treatment primes rat microglia for agonist-stimulated O2 generation in vitro [27,38]. As shown in Figure 1, untreated microglia release low levels of O2 after phorbol 12-myristate 13-acetate (PMA) stimulation. However, when E. coli LPS-treated microglia were stimulated with PMA, O2 generation was bell-shaped with maximal O2 at 1 ng/mL LPS (9.98 ± 1.6 nmoles O2, n = 14, P < 0.001), confirming our previous observations [27]. In contrast, when microglia were pre-treated with V. vulnificus LPS for 17 h, concentration-dependent O2 release became maximal at 10 ng/mL V. vulnificus LPS (8.6 ± 1.4 nmoles O2, n = 13, P < 0.001), and then progressively decreased. Thus V. vulnificus LPS appeared to be approximately a tenth less potent than E. coli LPS in stimulating O2 production from microglia in vitro.
Figure 1. The effect of E. coli and V. vulnificus lipopolysaccharide (LPS) on rat microglia phorbol 12-myristate 13-acetate (PMA)-stimulated O2 release. Neonatal rat microglia (2 × 10⁵ cells/well) were treated with E. coli LPS (0.1–100 ng/mL) or V. vulnificus LPS (0.1–105 ng/mL) for 17 h in vitro, and then stimulated with PMA (1 μM) for 70 min. O2 was determined as described in Experimental Section. Data expressed as nanomoles O2 is the mean ± SEM of 13–14 independent experiments (n), each experiment with duplicate determinations. ** P < 0.01, *** P < 0.001 versus untreated control (0). P < 0.05, ▲▲ P < 0.01 V. vulnificus LPS vs. E. coli LPS.
Marinedrugs 12 01732 g001

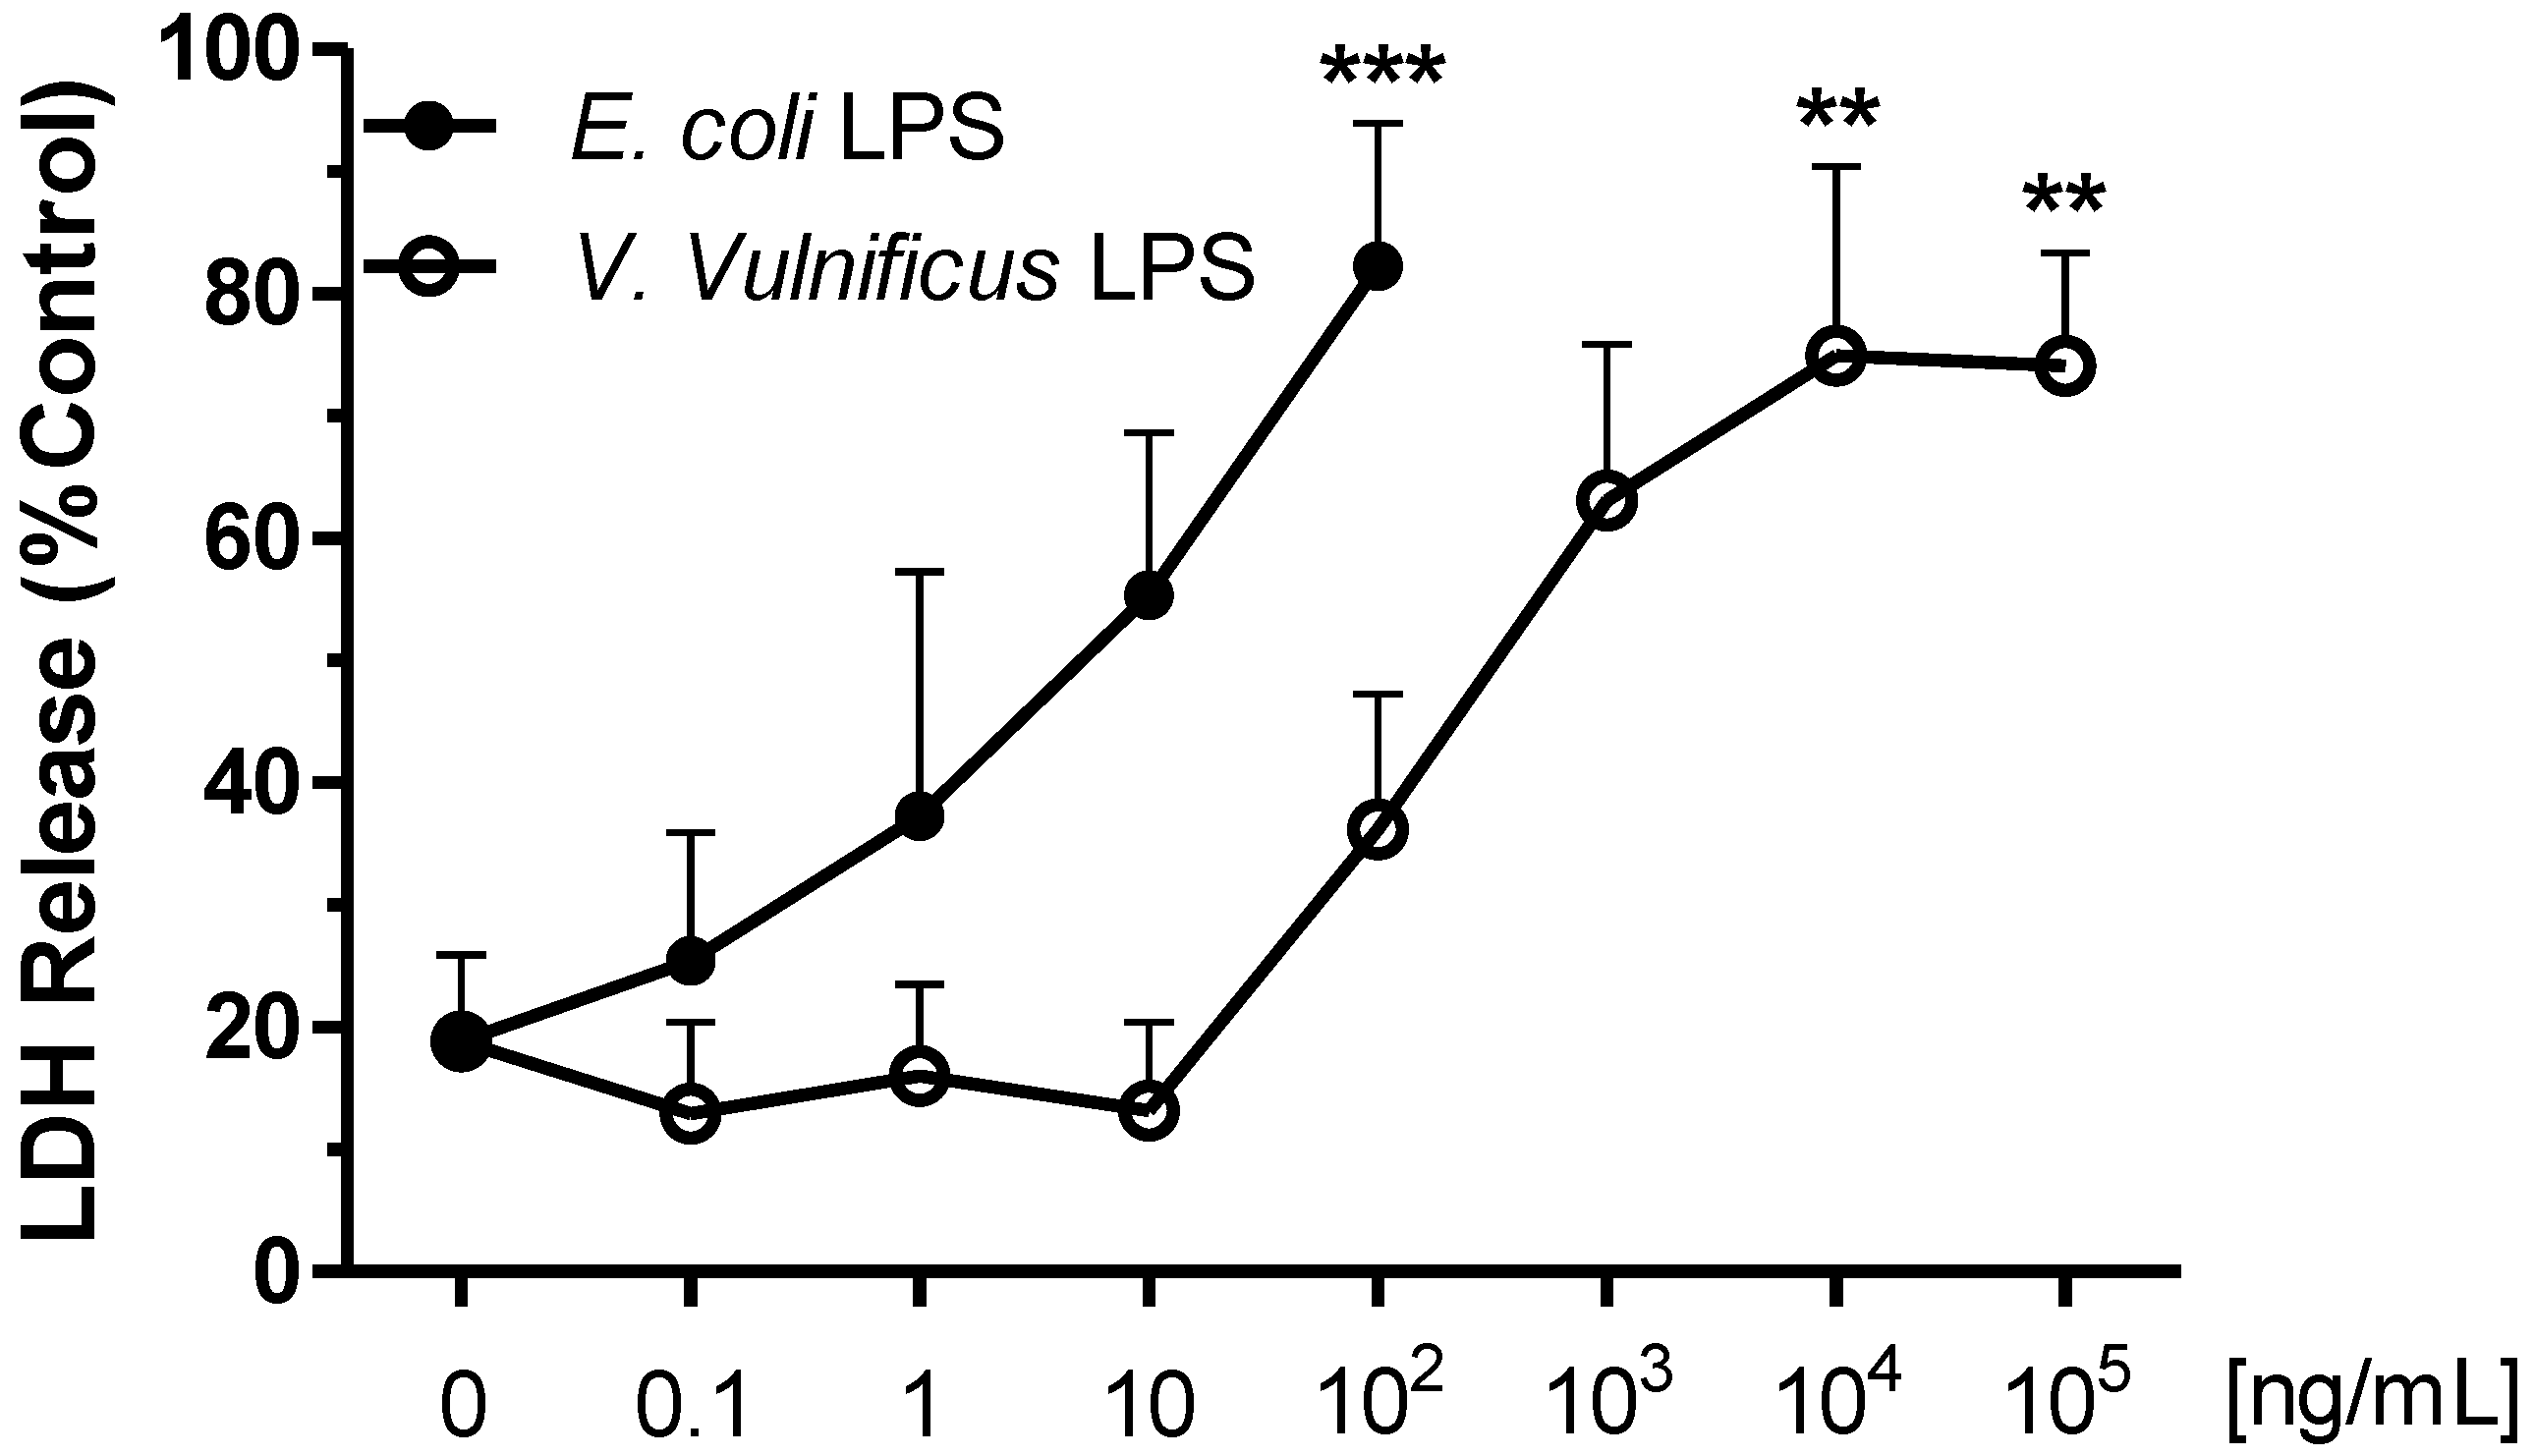
2.2. Effect of V. vulnificus LPS on Rat Brain Microglia LDH Generation

In order to determine whether the progressive decrease in O2 release shown in Figure 1 was caused by toxicity of E. coli or V. vulnificus LPS to microglia, we measured the presence of lactate dehydrogenase (LDH), a marker for cellular toxicity, in microglia tissue culture supernatants after the 17 h in vitro incubation [39].
As shown in Figure 2, there was a dose-dependent increase in LDH release in vitro that paralleled the decrease in O2 generation observed with increasing E. coli or V. vulnificus LPS concentrations. Thus in E. coli LPS-pretreated microglia, statistically significant LDH release was observed at 100 ng/mL LPS (73.6 ± 8.4% of control, n = 12, P < 0.001). In contrast, in V. vulnificus LPS-pretreated microglia, a maximum of 70.3 ± 16% of control LDH release was observed at 104 ng/mL (n = 12, P < 0.01).
Figure 2. The effect of E. coli and V. vulnificus LPS on rat microglia lactate dehydrogenase (LDH) release.Neonatal rat microglia (2 × 10⁵ cells/well) were treated with either E. coli LPS (0.1–100 ng/mL) or V. vulnificus LPS (0.1–105 ng/mL) for 17 h in vitro. LDH release was determined as described in Experimental Section. Data expressed as % of Triton X-100 0.1% treated microglia LDH release is the mean ± SEM of 12–13 independent experiments (n), each experiment with duplicate determinations. ** P < 0.01, *** P < 0.001 versus untreated control (0).
Marinedrugs 12 01732 g002

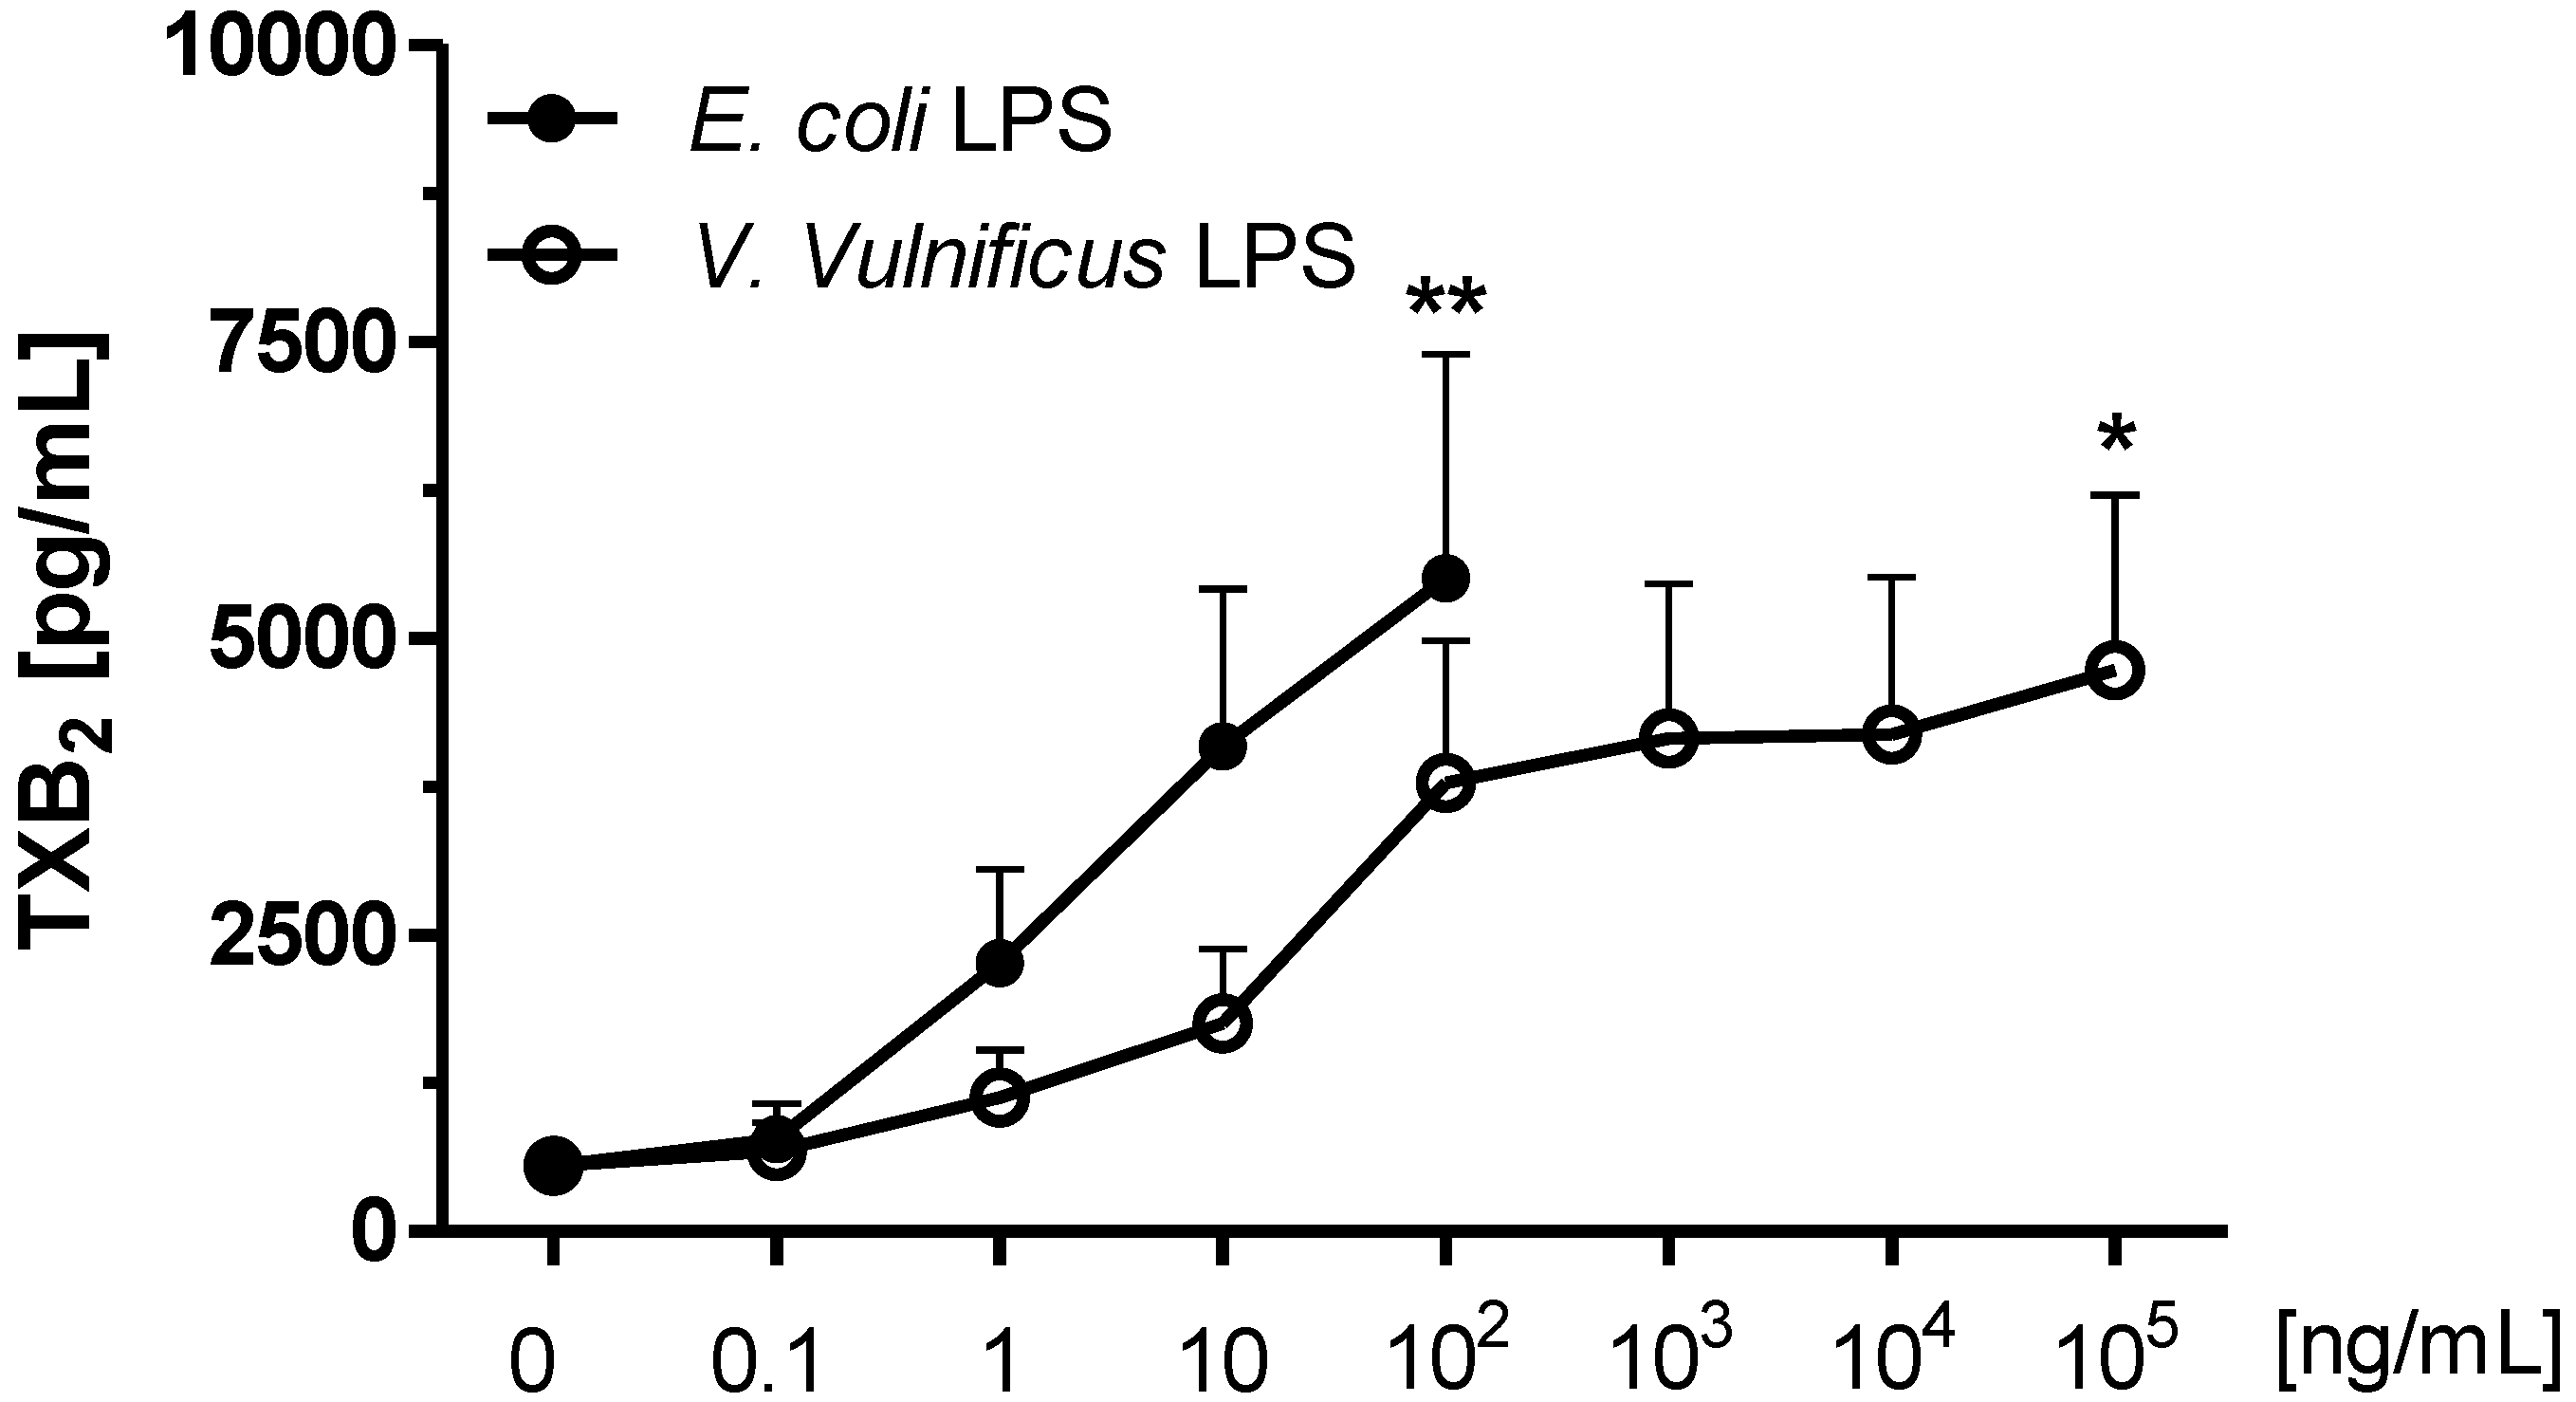
2.3. Effect of V. vulnificus LPS on Rat Brain Microglia TXB2 Generation

Release of eicosanoids by activated microglia appears to play a significant role in neuroinflammation [26], and E. coli LPS-treated rat microglia generate TXB2 in vitro [27,40]. As depicted in Figure 3, unstimulated microglia released low levels of TXB2 (550 ± 200 pg/mL, n = 8). Confirming prior observations [27,38], when microglia were pre-treated with 100 ng/mL E. coli LPS, high concentrations of TXB2 were detected in the tissue culture supernates (5504.5 ± 1881 pg/mL TXB2, n = 7, P < 0.01), which was concomitant with attenuated O2 generation (Figure 1), and enhanced LDH release (Figure 2). In contrast, V. vulnificus LPS-treated microglia TXB2 generation yielded a sigmoid curve, and became statistically significant at 105 ng/mL LPS (4731 ± 1475 pg/mL TXB2 n = 7, P < 0.05), when there was minimal O2 generation (Figure 1) and high LDH release (Figure 2). Thus, although V. vulnificus LPS appeared less potent than E. coli LPS in inducing a concentration-dependent TXB2 release from rat microglia in vitro, it was as effective as E. coli LPS, because maximal TXB2 release was of a similar magnitude.
Figure 3. The effect of E. coli and V. vulnificus LPS on rat microglia thromboxane B2 (TXB2) release. Neonatal rat microglia (2 × 10⁵ cells/well) were treated with E. coli LPS (0.1–100 ng/mL) or V. vulnificus LPS (0.1–105 ng/mL) for 17 h in vitro. TXB2 was determined as described in Experimental Section. Data expressed as TXB2 pg/mL is the mean ± SEM of seven independent experiments (n), each experiment with duplicate determinations. * P < 0.05, ** P < 0.01 versus untreated control (0).
Marinedrugs 12 01732 g003

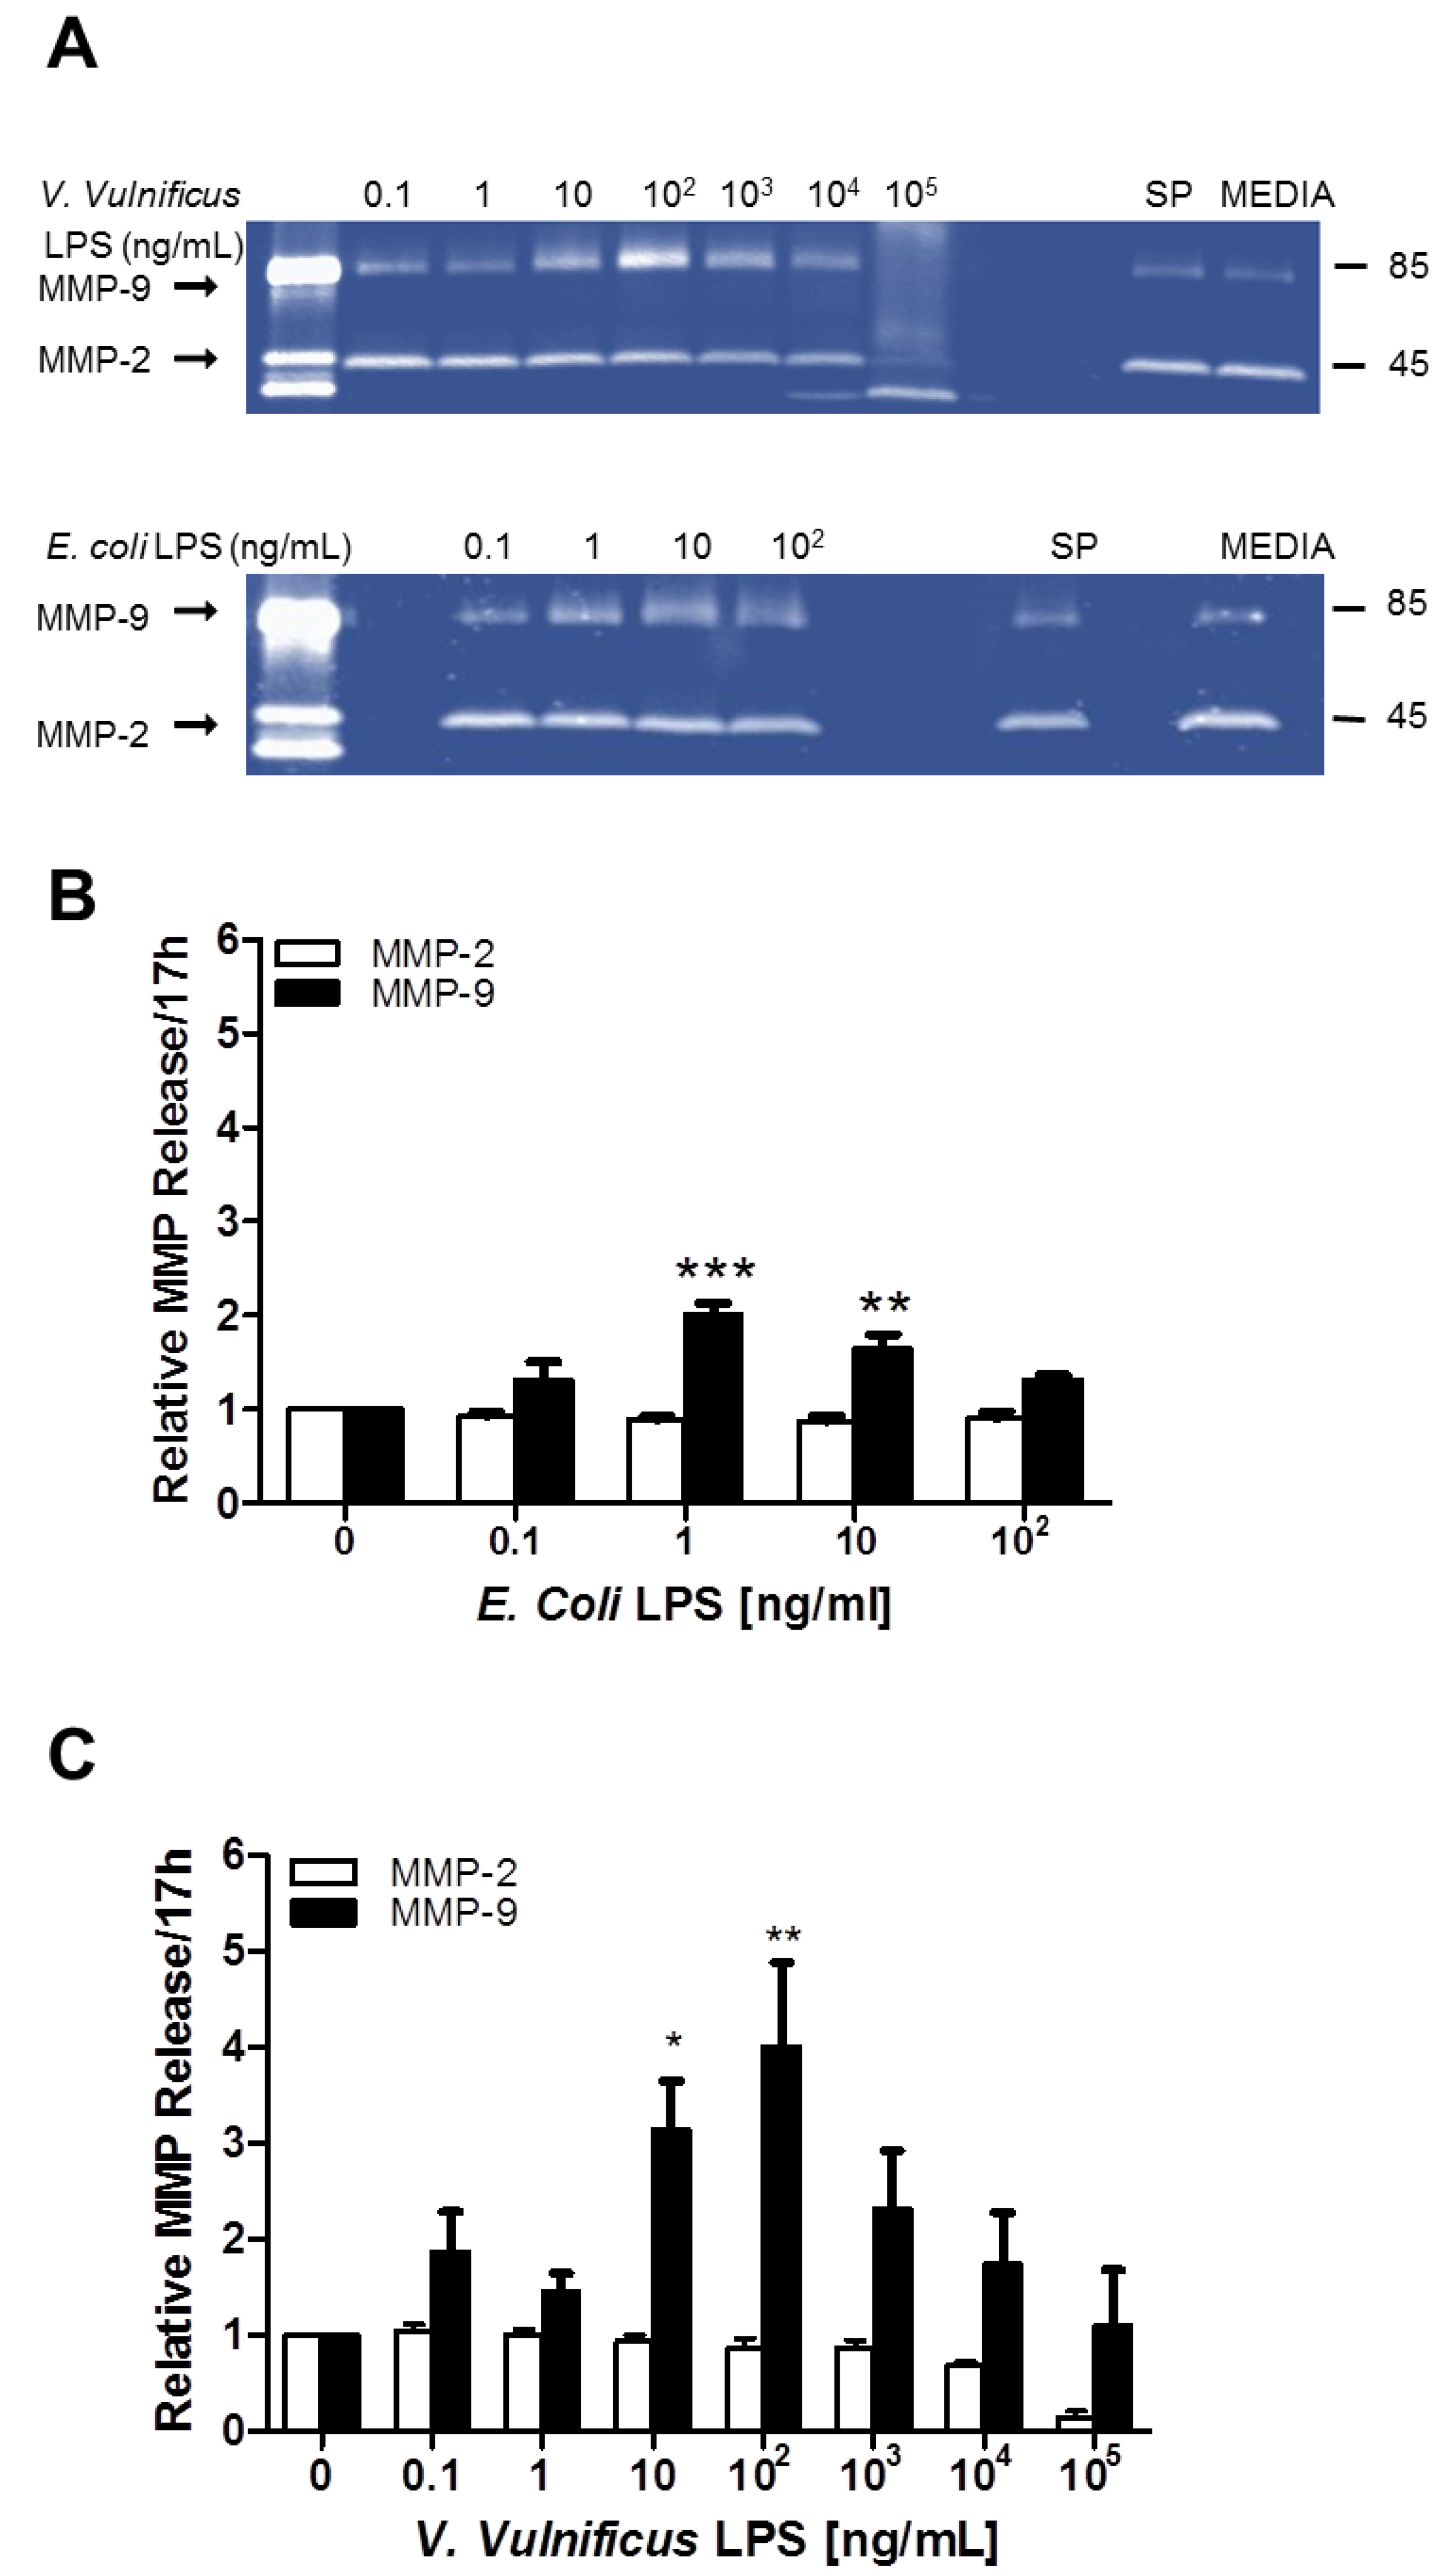
2.4. Effect of V. vulnificus LPS on Rat Brain Microglia MMP-2 and MMP-9 Generation

Matrix metalloproteinases (MMP) released by activated microglia have been proposed to be proinflammatory in both sepsis and neuroinflammation [41,42]. We, and others, have observed MMP-2 and MMP-9 generation by E. coli LPS-stimulated rat microglia in vitro [27,43]. As shown in Figure 4, in E. coli LPS-stimulated microglia, MMP-9 levels were statistically significant at the following LPS concentrations (ng/mL): One (2.0 ± 0.12-fold, n = 5, P < 0.001), and 10 (1.64 ± 0.15-fold, n = 5, P < 0.01), respectively. Similarly, microglia stimulated with V. vulnificus LPS for 17 h demonstrated a concentration-dependent increase of MMP-9, but not of MMP-2, at the following LPS concentrations (ng/mL): 10 (3.1 ± 0.5- fold, n = 5, P < 0.05), and 100 (4.0 ± 0.9-fold, n = 5, P < 0.01). Thus while V. vulnificus LPS was a tenth less potent than E. coli LPS in inducing a concentration-dependent release of MMP-9, it was more effective than E. coli LPS, because maximal release MMP-9 was two-fold higher.
Figure 4. The effect of E. coli and V. vulnificus LPS on rat microglia matrix metalloproteinase-2 (MMP-2) and -9 release. Neonatal rat microglia (2 × 10⁵ cells/well) were treated with E. coli LPS (0.1–100 ng/mL) or V. vulnificus LPS (0.1–105 ng/mL) for 17 h in vitro. As described in Experimental Section, MMP-2 and MMP-9 were determined by sodium dodecyl sulfate polyacrylamide gel electrophoresis (SDS-PAGE) zymography (panel A), and quantitated results for E. coli LPS (panel B) and for V. vulnificus LPS (panel C) are depicted in the bar graphs. Data is expressed as mean ± SEM of normalized MMP release from five independent experiments (n). * P < 0.05, ** P < 0.01, *** P < 0.001 versus untreated control (0).
Marinedrugs 12 01732 g004

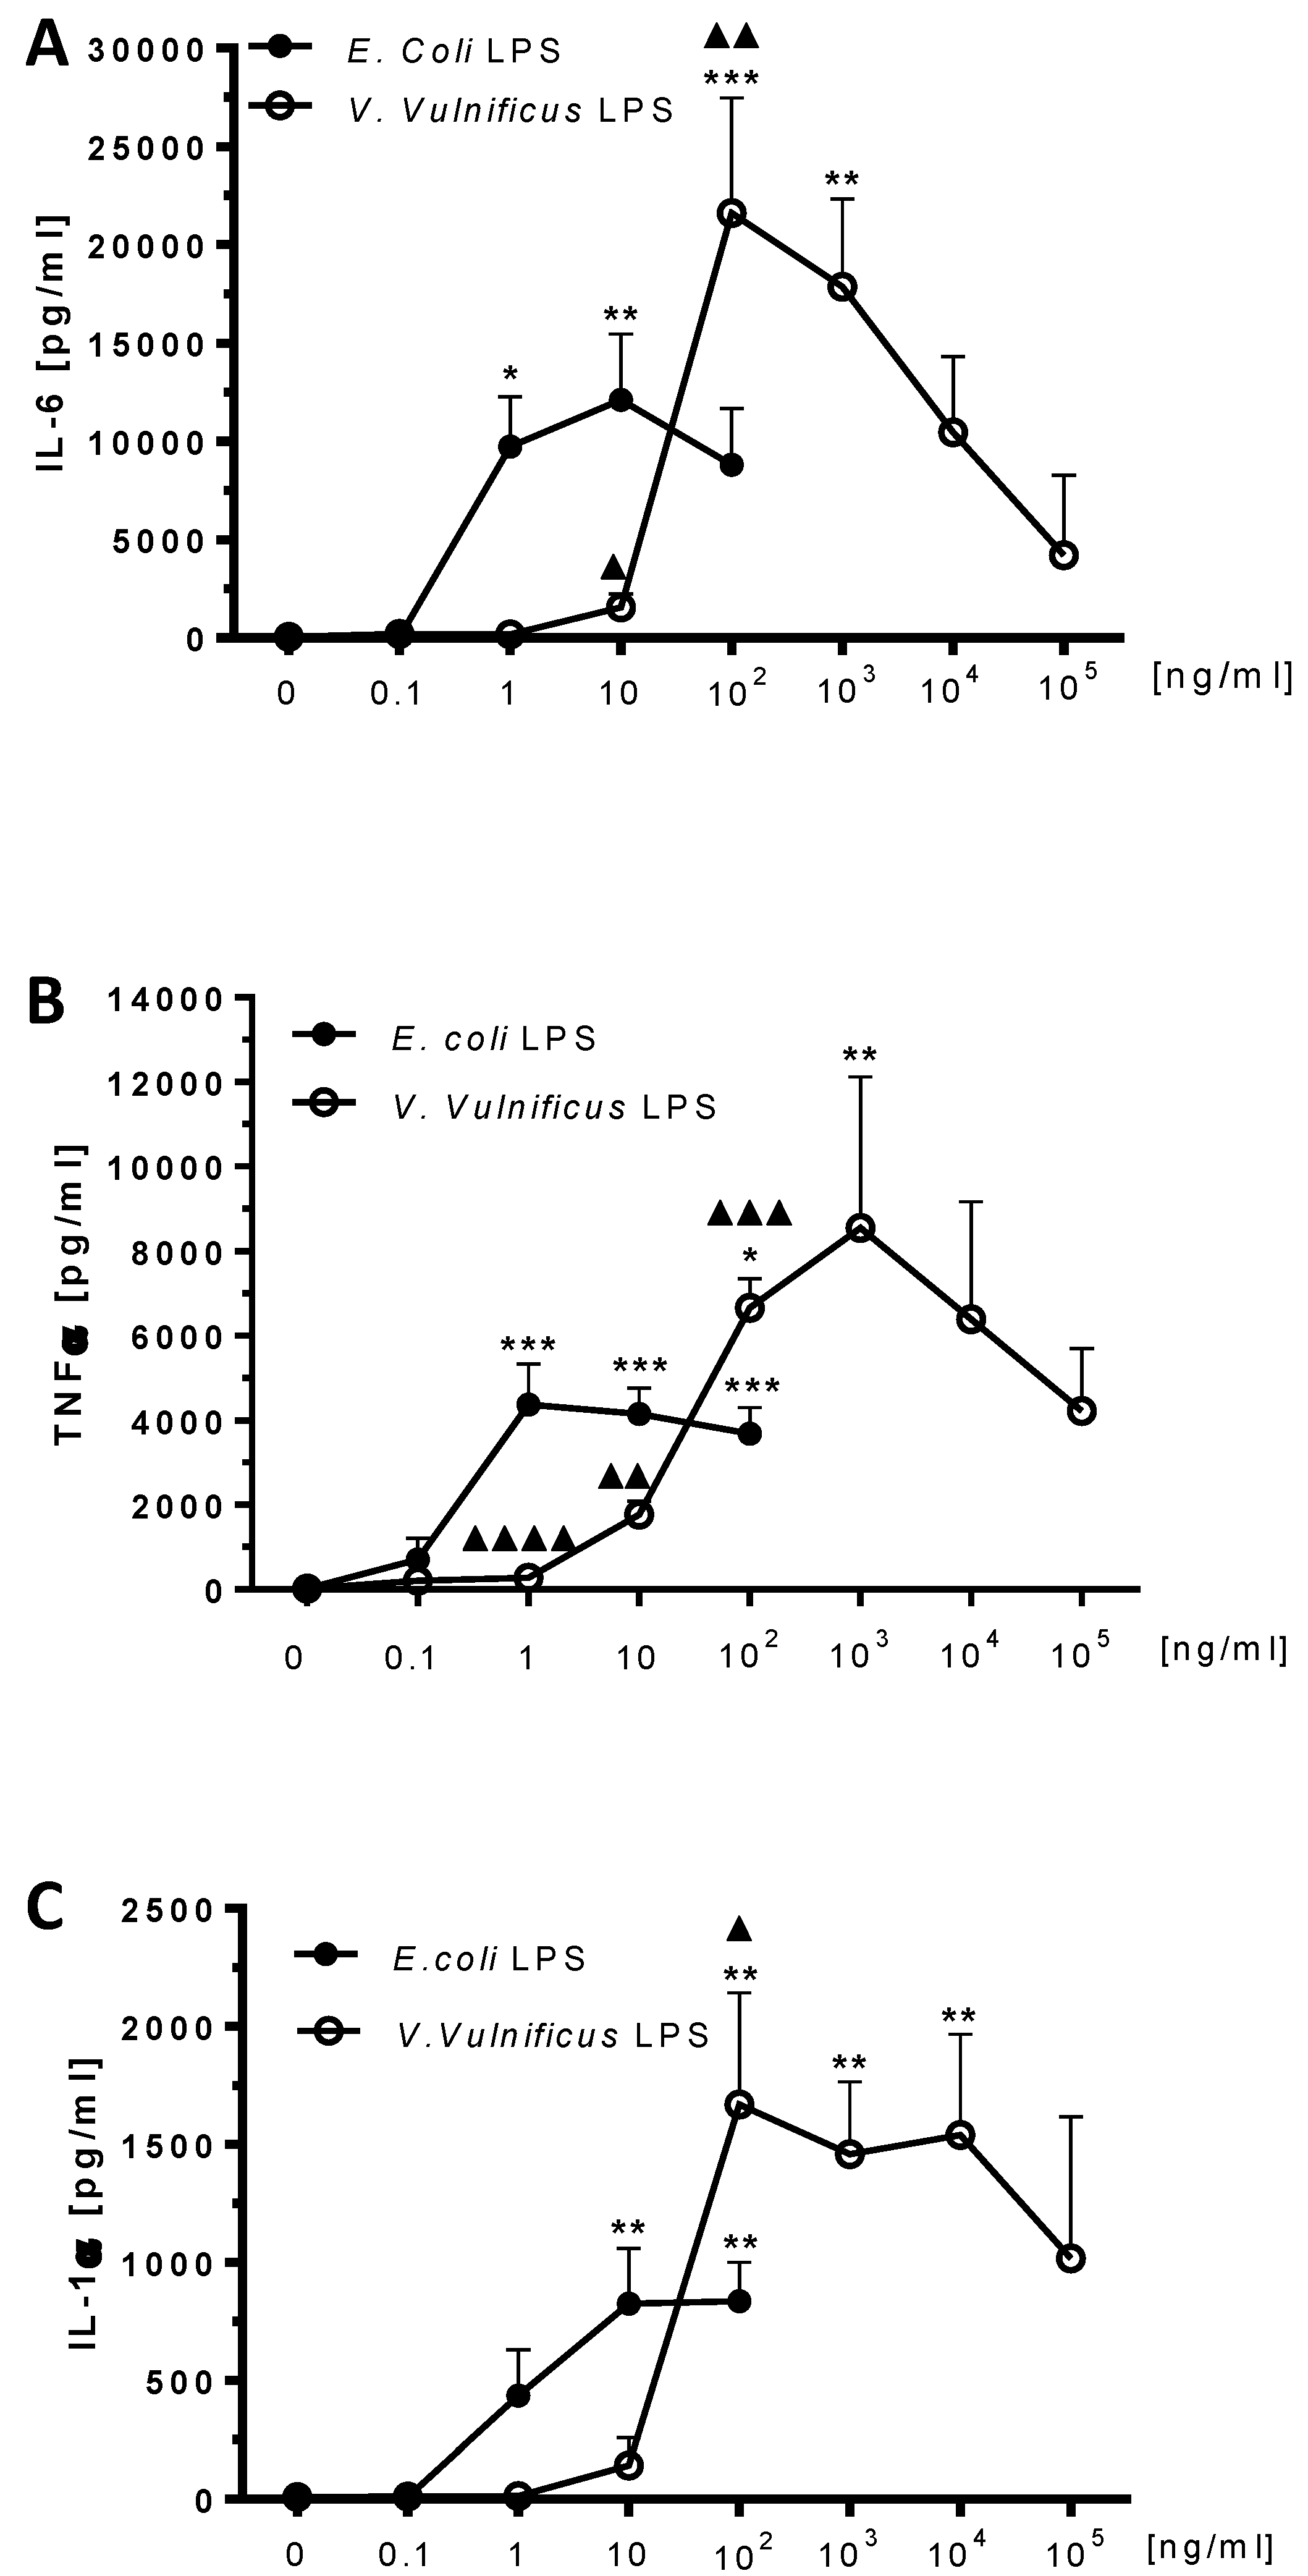
2.5. Effect of V. vulnificus LPS On Rat Brain Microglia Cytokines IL-6, TNF-α and IL-1α Release

After a 17 h in vitro incubation, both E. coli and V. vulnificus LPS-treated microglia released the inflammatory cytokines IL-6, TNF-α, and IL-1α into the tissue culture supernates, in the following decreasing concentrations (pg/mL): IL-6 > TNF-α > IL-1α.
The cytokine IL-6 has been shown to play a role in the immune response, inflammation and hematopoiesis [44], and in neuroimmunomodulation in Alzheimer’s disease [45]. E. coli LPS has been reported to stimulate human [46], murine [47] and rat [43,48] microglia to release IL-6 in vitro. In our investigation, unstimulated microglia released low levels of IL-6 (71.7 ± 35 pg/mL, n = 4). As shown in Figure 5 (Panel A), IL-6 levels in E. coli LPS-stimulated microglia were significant at 1 ng/mL LPS (9733 ± 2539 pg/mL IL-6, n = 4, P < 0.05). In V. vulnificus LPS-stimulated microglia, IL-6 levels became statistically significant at 100 ng/mL (21,605 ± 5864 pg/mL IL-6, n = 4, P < 0.001). Thus, V. vulnificus LPS appeared to be a hundredth less potent than E. coli LPS in inducing concentration-dependent release of IL-6 from rat microglia in vitro, but was more efficacious than E. coli LPS, because maximal release of IL-6 was 78% higher.
The cytokine TNF-α has been shown to play an important role in normal brain function as well as in neurodegenerative disease [49]. Treatment of human [46], murine [47,50], and rat microglia [27,48] with E. coli LPS in vitro resulted in TNF-α release. In our present investigation, unstimulated rat microglia released low levels of TNF-α (16.5 ± 7.9 pg/mL, n =6). As shown in Figure 5 (Panel B), in E. coli LPS-stimulated microglia, a concentration-dependent TNF-α release became statistically significant at 1 ng/mL LPS (4363 ± 961 pg/mL TNF-α, n = 5, P < 0.001), thus confirming our previous observations [27]. In contrast, in V. vulnificus LPS-stimulated rat microglia cells, TNF-α release was significant at 100 ng/mL, and peaked at 1000 ng/mL (8547 ± 3570 pg/mL TNF-α, n = 6, P < 0.01). Thus, similar to O2 (Figure 1) and TXB2 (Figure 3), V. vulnificus LPS appeared to be a hundredth less potent than E. coli LPS in inducing TNF-α production from rat microglia in vitro, and yet V. vulnificus LPS was clearly more efficacious than E. coli LPS, because maximal TNF-α release was 132% higher.
The cytokine IL-1α has been proposed as a key mediator in inflammatory neurodegeneration and neuronal injury [51,52]. E. coli LPS primes rat microglia to release IL-1α in vitro [53]. In our present study, unstimulated microglia released low levels of IL-1α (9.2 ± 5.1 pg/mL, n = 4). As shown in Figure 5 (Panel C), in E. coli LPS-stimulated microglia, IL-1α levels peak at 10 ng/mL (825.7 ± 234.6 pg/mL IL-1α, n = 4, P < 0.01). In contrast, in V. vulnificus LPS-stimulated microglia, IL-1α levels become statistically significant at 100 ng/mL (1669.7 ± 473.3 pg/mL IL-1α, n = 4, P < 0.01). Thus, although V. vulnificus LPS was a tenth less potent than E. coli LPS in inducing IL-1α generation from rat microglia in vitro, as observed for TNF-α (Figure 5, panel B) generation, the overall magnitude of the V. vulnificus LPS response was higher than E. coli LPS, with an increase in maximal release of IL-1α of 102%.
Figure 5. The effect of E. coli and V. vulnificus LPS on rat microglia cytokines IL-6, tumor necrosis factor-alpha (TNF-α) and interleukin-one alpha (IL-1α) release. Neonatal rat microglia (2 × 10⁵ cells/well) were treated with E. coli LPS (0.1–100 ng/mL) or V. vulnificus LPS (0.1–105 ng/mL) for 17 h in vitro. IL-6 (Panel A), TNF-α (Panel B), and IL-1α (Panel C) were determined as described under Experimental Section. Data expressed as pg/mL is the mean ± SEM of values from four to six independent experiments (n), each experiment with duplicate determinations. * P < 0.05, ** P < 0.01, *** P < 0.001 versus untreated control (0). P < 0.05, ▲▲ P < 0.01, ▲▲▲ P < 0.001, ▲▲▲▲ P < 0.0001 V. vulnificus LPS vs. E. coli LPS.
Marinedrugs 12 01732 g005

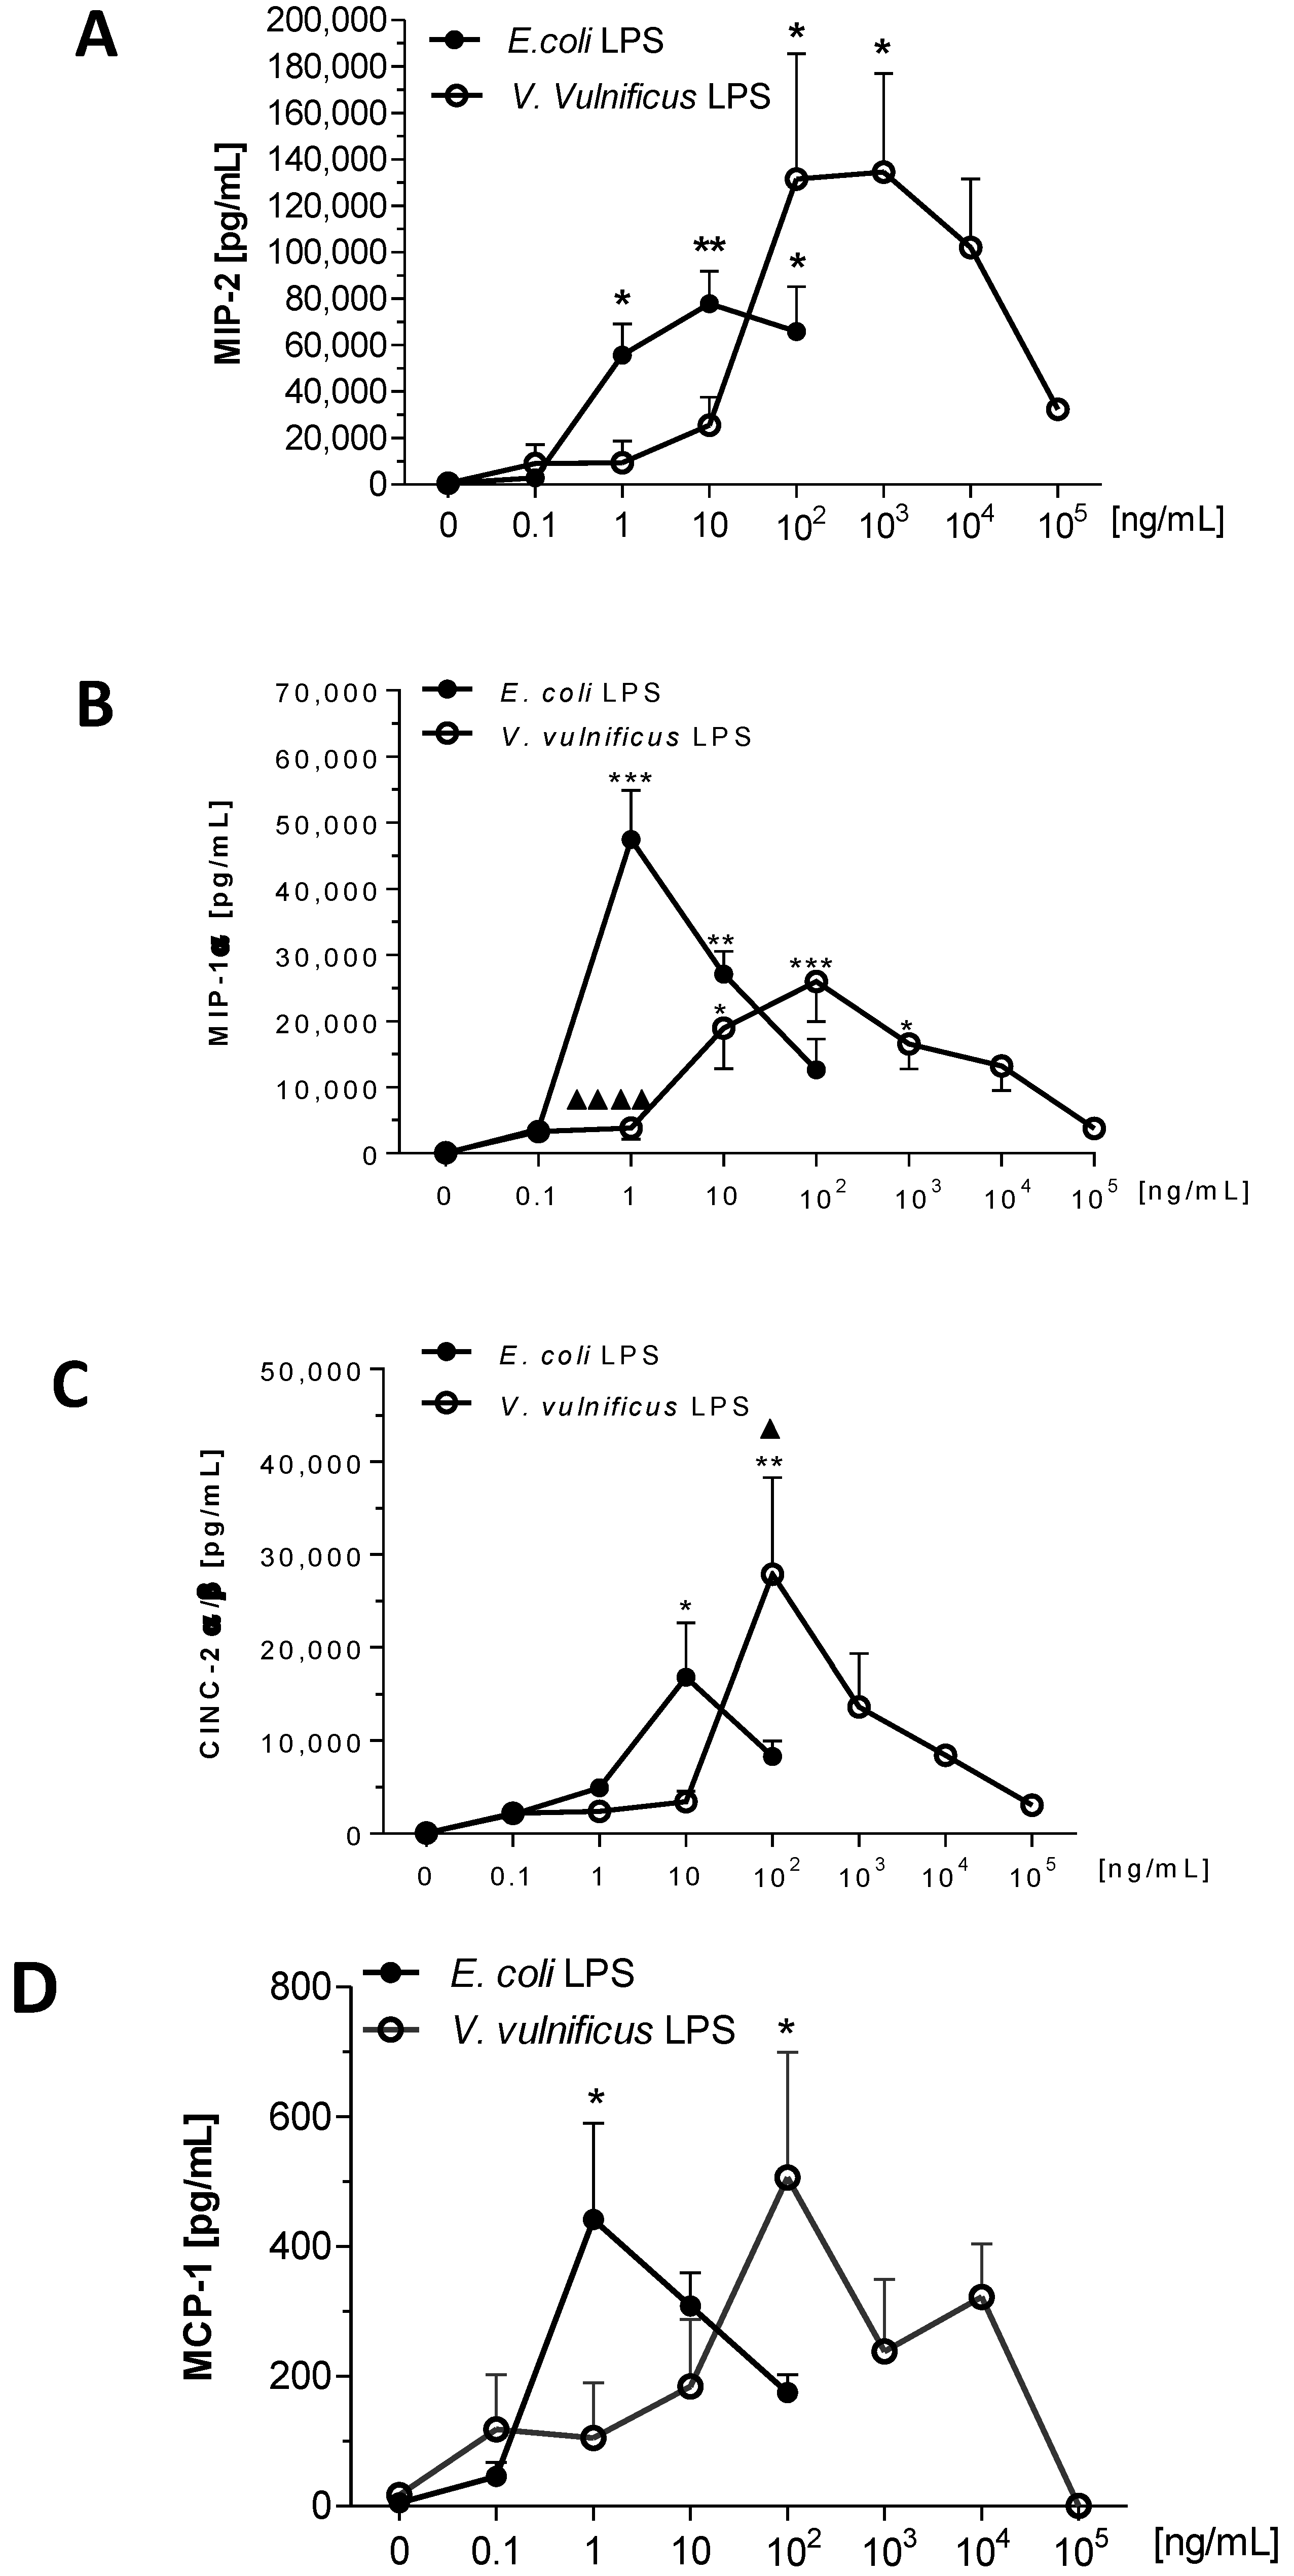
2.6. Effect of V. vulnificus LPS on Rat Brain Microglia MIP-2/CXCL2, MIP-1α/CCL3, CINC-2α/β (CXCL3) and MCP-1/CCL2 Generation

E. coli and V. vulnificus LPS-treated microglia released several inflammatory chemokines into the tissue culture supernates after a 17 h in vitro incubation in the following decreasing concentrations (pg/mL): MIP-2/CXCL2 > MIP-1α/CCL3 > CINC-2α/β (CXCL3) > MCP-1/CCL2.
The chemokine MIP-2 or CXCL2, which is involved in neuroinflammation [54], has been reported to be released by LPS-treated murine [47,55] and rat [56] microglia in vitro. Unstimulated microglia released low levels of MIP-2 constitutively (560 ± 302 pg/mL, n = 3). As shown in Figure 6 (Panel A), MIP-2/CXCL2 levels in E. coli LPS-stimulated microglia rose after 0.1 ng/mL LPS, and were maximal at 10 ng/mL LPS (77,951 ± 13,927 pg/mL MIP-2/CXCL2, n = 3, P < 0.01). In V. vulnificus LPS-stimulated microglia, MIP-2/CXCL2 release progressively increased at 10 ng/mL LPS, and became statistically significant at 100 ng/mL (131,581 ± 54,023 pg/mL MIP-2/CXCL2, n = 3, P < 0.05). Thus, similar to the cytokines TNF-α, IL-1α and IL-6, V. vulnificus LPS was less potent than E. coli LPS in inducing concentration-dependent release of the chemokine MIP-2/CXCL2 in vitro but more efficacious because maximal release was 73% higher.
The chemokine MIP-1α or CCL3, involved in CNS inflammation [54] and in multiple sclerosis [57], has been reported to be generated by LPS-treated mouse [47,50], rat [58] and human microglia cells in vitro [59]. As shown in Figure 6 (Panel B), E. coli LPS-induced MIP-1α/CCL3 release occurred at greater than 0.1 ng/mL and was significant at 1 ng/mL (47,464.9 ± 4298.8 pg/mL MIP-1α/CCL3, n = 3, P < 0.001). V. vulnificus LPS-stimulated MIP-1α/CCL3 release, which was statistically significant at 10 ng/mL (18,936 ± 6142 pg/mL MIP-1α/CCL3, n = 4, P < 0.05), peaked at 100 ng/mL. Thus V. vulnificus LPS was a tenth less potent than E. coli LPS in inducing MIP-1α/CCL3 release from rat microglia. Interestingly, and in contrast to TNF-α, IL-1-α, IL-6 and MIP-2 release by microglia stimulated by E. coli LPS, the effect of V. vulnificus LPS on the release of MIP-1α/ CCL3 was diminished by 45%.
The chemokine cytokine-induced neutrophil chemoattractant (CINC)-2α/β or CXCL3, earlier known as growth-regulated oncogene or GRO, plays a role in chemotaxis and inflammation in the CNS [60]. Although human microglia released GRO α in vitro [61], the effect of LPS on microglia and CINC-2α/β (CXCL3) generation has not been investigated to our knowledge. As shown in Figure 6 (Panel C), E. coli LPS-induced CINC-2α/β (CXCL3) release peaked at 10 ng/mL (16,864 ± 5792 pg/mL CINC-2α/β (CXCL3), n = 2, P < 0.05). V. vulnificus LPS-induced CINC-2α/β (CXCL3) release was statistically significant at 100 ng/mL (27,910 ± 10,443 pg/mL CINC-2α/β (CXCL3), n = 2, P < 0.01). Thus, similar to TNF-α, IL-1α, IL-6, and MIP-2, V. vulnificus LPS was a tenth less potent than E. coli LPS in inducing concentration-dependent release of the chemokine CINC-2α/β (CXCL3) in vitro, but more effective because maximal release was 65% higher.
The chemokine MCP-1 or CCL2, which plays a role in both neuroinflammation [54] and multiple sclerosis [57], is released by murine [47], rat [48,58] and human microglia in vitro [59]. Unstimulated microglia released low levels of MCP-1/CCL2 constitutively (17 ± 9 pg/mL, n = 3). As shown in Figure 6 (Panel D), E. coli LPS-induced MCP-1/CCL2 release yielding a bell-shaped curve which peaked at 1 ng/mL (441 ± 149 pg/mL MCP-1/CCL2, n = 3, P < 0.05). Similarly, V. vulnificus LPS-induced MCP-1/CCL2 release was statistically significant at 100 ng/mL (506 ± 193 pg/mL MCP-1/CCL2, n = 4, P < 0.05). Although V. vulnificus LPS was a hundredth less potent than E. coli LPS at inducing concentration-dependent release of the chemokine MCP-1/CCL2, maximal observed release was similar.
Figure 6. The effect of E. coli and V. vulnificus LPS on rat microglia chemokines macrophage inflammatory protein-2 (MIP-2)/chemokine (C-X-C motif) ligand 2 (CXCL2), MIP-1α/chemokine (C-C motif) ligand 3 (CCL3), CINC-2α/β/CXCL3 and monocyte chemotactic protein-1 (MCP-1)/CCL2 release. Neonatal rat microglia (2 × 10⁵ cells/well) were treated with E. coli (0.1–100 ng/mL) or V. vulnificus (0.1–105 ng/mL) LPS for 17 h in vitro. MIP-2/CXCL2 (Panel A), MIP-1α/CCL3 (Panel B), CINC-2α/β/CXCL3 (Panel C) and MCP-1/CCL2 (Panel D) release was determined as described in Experimental Section. Data expressed as pg/mL is the mean ± SEM of two to four independent experiments (n), each experiment with duplicate determinations. * P < 0.05; ** P < 0.01; *** P < 0.001 versus untreated control (0). P < 0.05, ▲▲▲▲ P < 0.0001 V. vulnificus LPS vs. E. coli LPS.
Marinedrugs 12 01732 g006

2.7. Effect of V. vulnificus LPS on Rat Brain Microglia TGF-β1 and BDNF

In order to determine whether V. vulnificus LPS affected release of anti-inflammatory cytokines and neurotrophins into the conditioned medium [35], we investigated the presence of TGF-β1 and BDNF which have been studied for their neuroprotective effects [62], and have been shown to be expressed constitutively in rat microglia [63], and in vitro in E. coli LPS-activated human [64] and murine [65] microglia. As shown in Table 1, unstimulated rat microglia released TGF-β1 constitutively (320 ± 50 pg/mL, n = 3), but in contrast there was no detectable BDNF. Furthermore, V. vulnificus LPS but not E. coli LPS significantly enhanced TGF-β1 release from microglia after the 17 h in vitro incubation (973.5 ± 264.5 pg/mL TGF-β1, (n = 2), p < 0.001). No significant increase of BDNF was observed in either E. coli or V. vulnificus LPS-treated microglia (n = 2).
Table 1. The effect of E. coli and V. vulnificus LPS on rat microglia TGF-β1 and brain-derived neurotrophic factor (BDNF) release.
TGF-β1 Release BDNF Release
LPSE. coliV. vulnificusE. coliV. vulnificus
(ng/mL)(pg/mL)n 1(pg/mL)n 1(pg/mL)n 1(pg/mL)n 1
0319.7 ± 50.13319.7 ± 50.130202
0.1424.3 ± 40.33386 ± 16.025.1 ± 4.421.4 ± 0.82
1363.3 ± 363419 ± 66.9318.4 ± 14.9210.2 ± 6.22
10318.7 ± 73.23358 ± 50.136.9 ± 3.926.5 ± 5.52
100333.3 ± 58.63310 ± 51.636.6 ± 3.029.1 ± 4.72
1000ND 352 ± 55.53ND 7.5 ± 7.52
10,000ND 613 ± 58.73ND 0 ± 02
100,000ND 973.5 ± 264.5 *2ND 2.05 ± 2.052
1 Rat microglia (2 × 10⁵ cells/well) were treated with E. coli LPS (0.1–100 ng/mL) or V. vulnificus LPS (0.1–105 ng/mL) for 17 h in vitro. TGF-β1 and BDNF were determined as described in Experimental Section. Data expressed as pg/mL and is the mean ± SEM of 3 and 2 independent experiments (n) for TGF-β1 and BDNF, respectively, each experiment with duplicate determinations. * P < 0.001 versus untreated control (0).

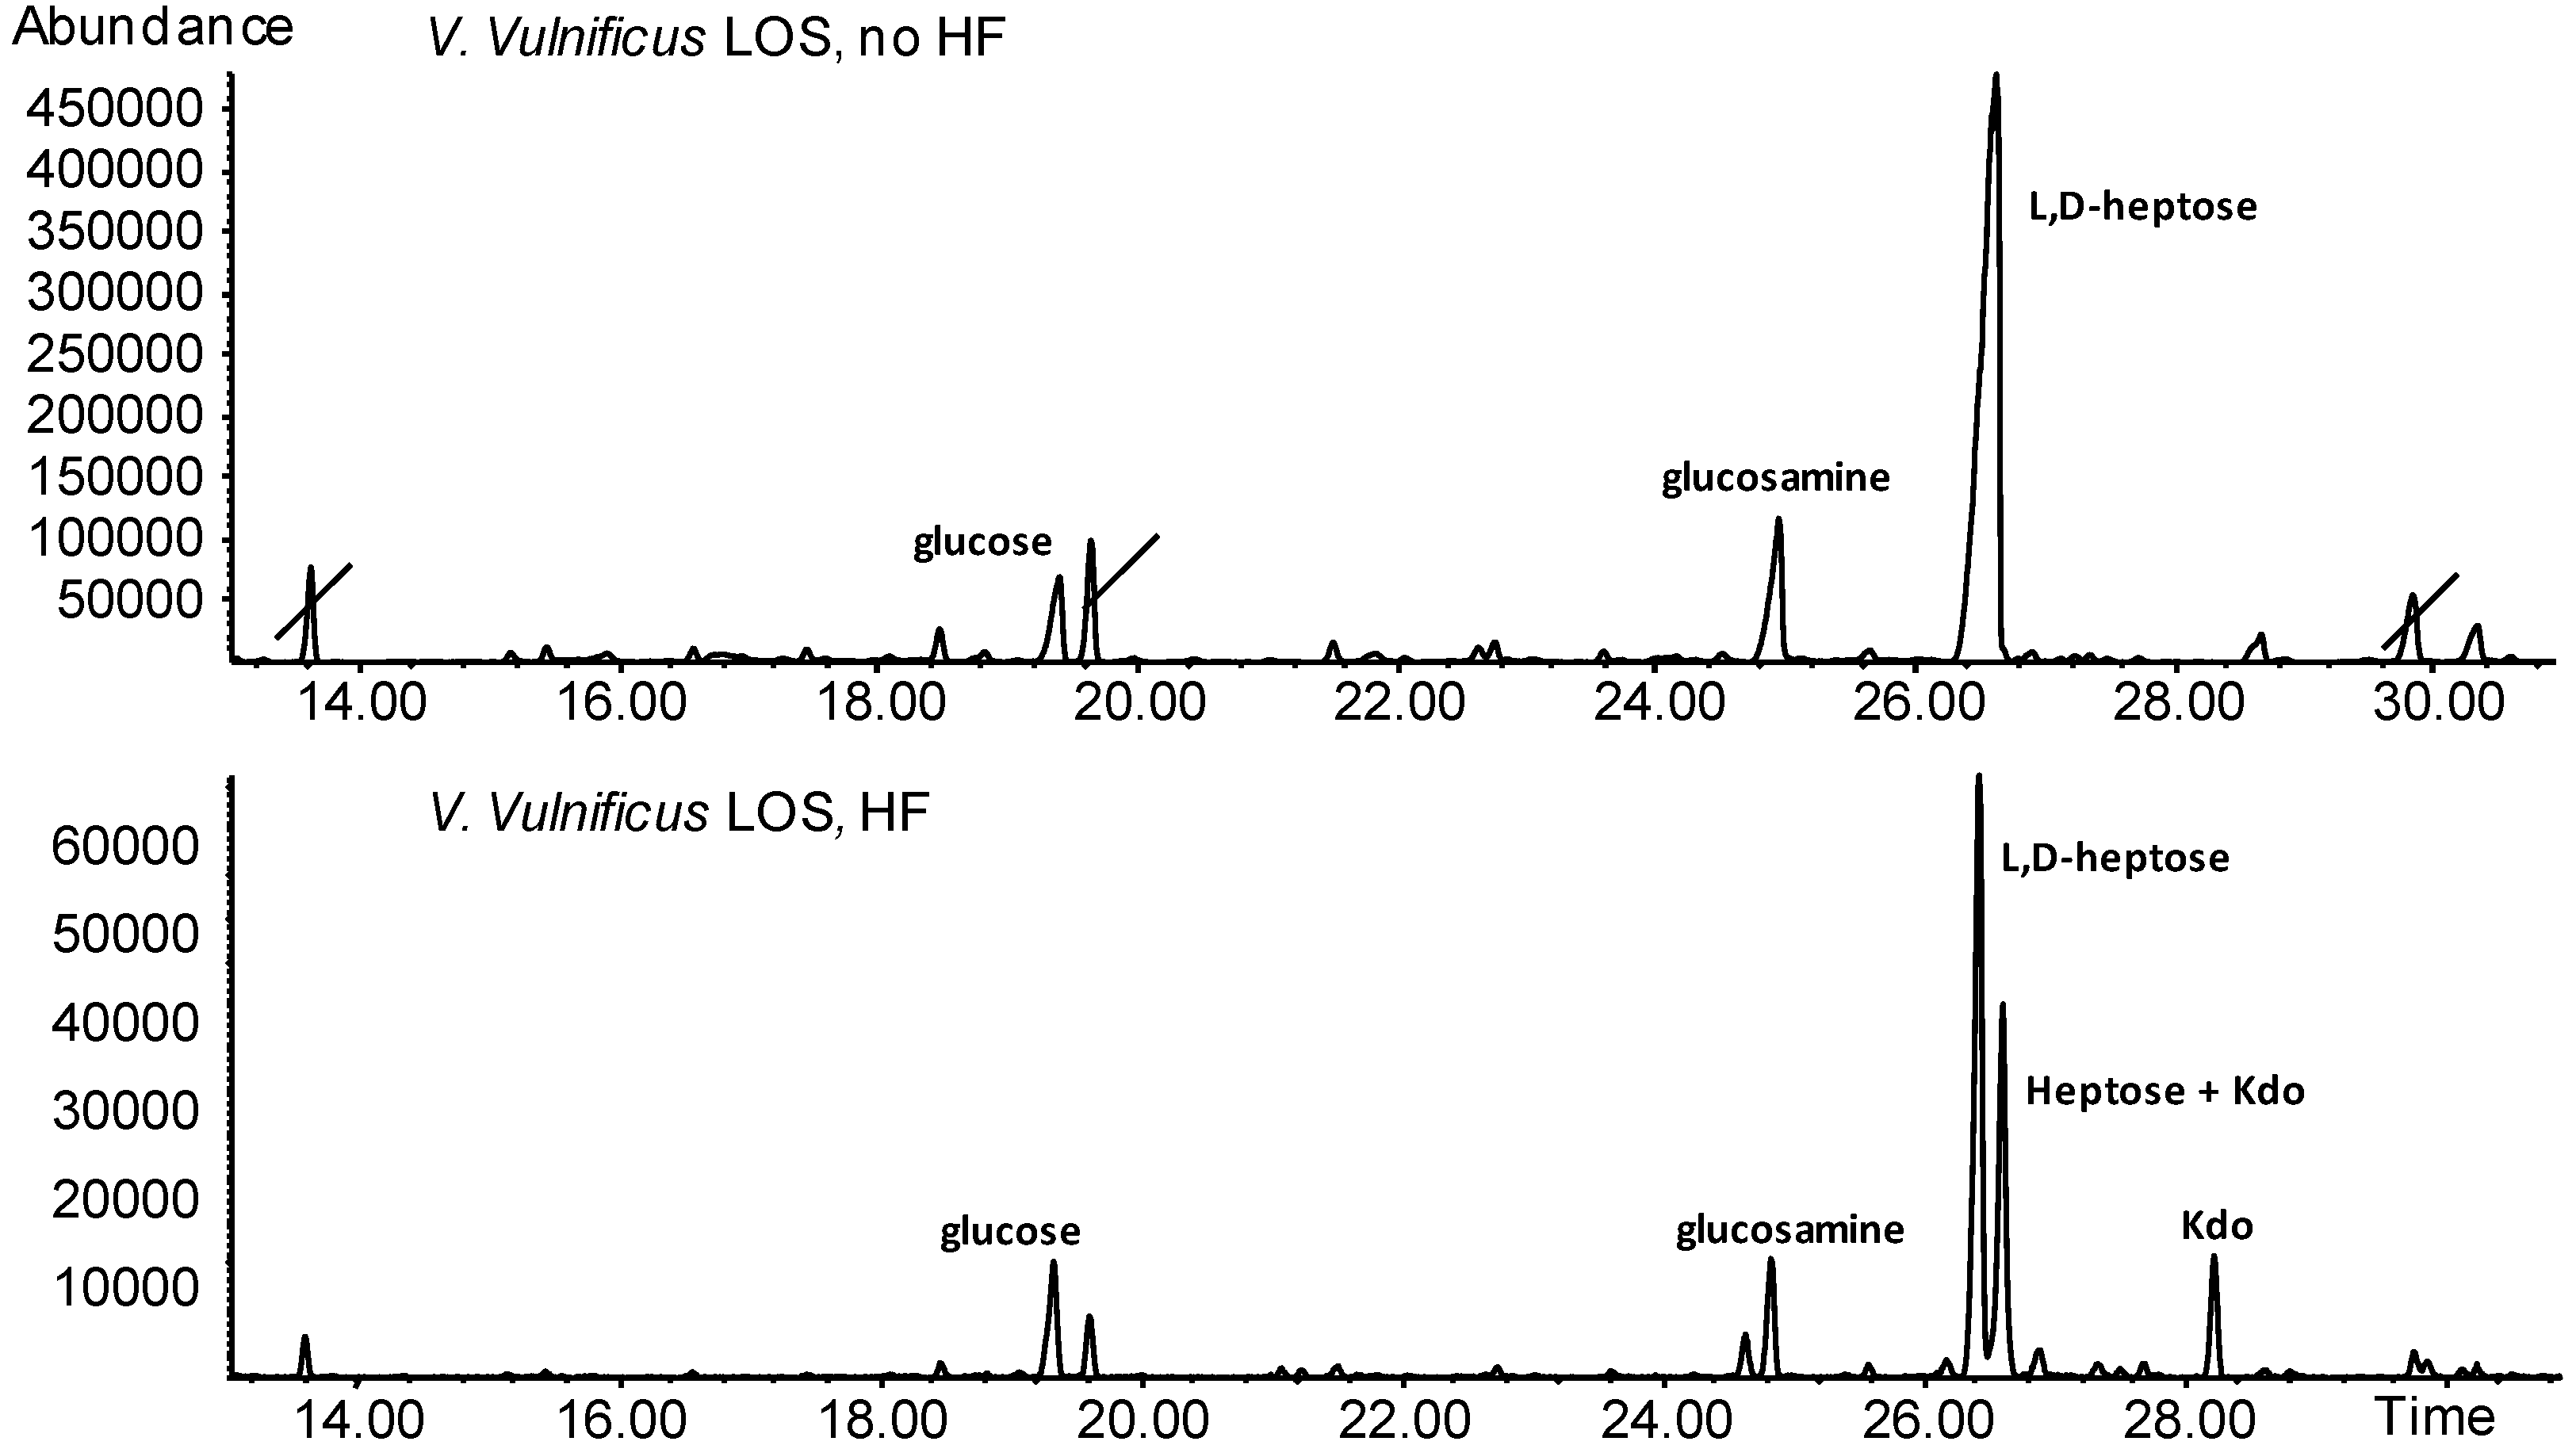
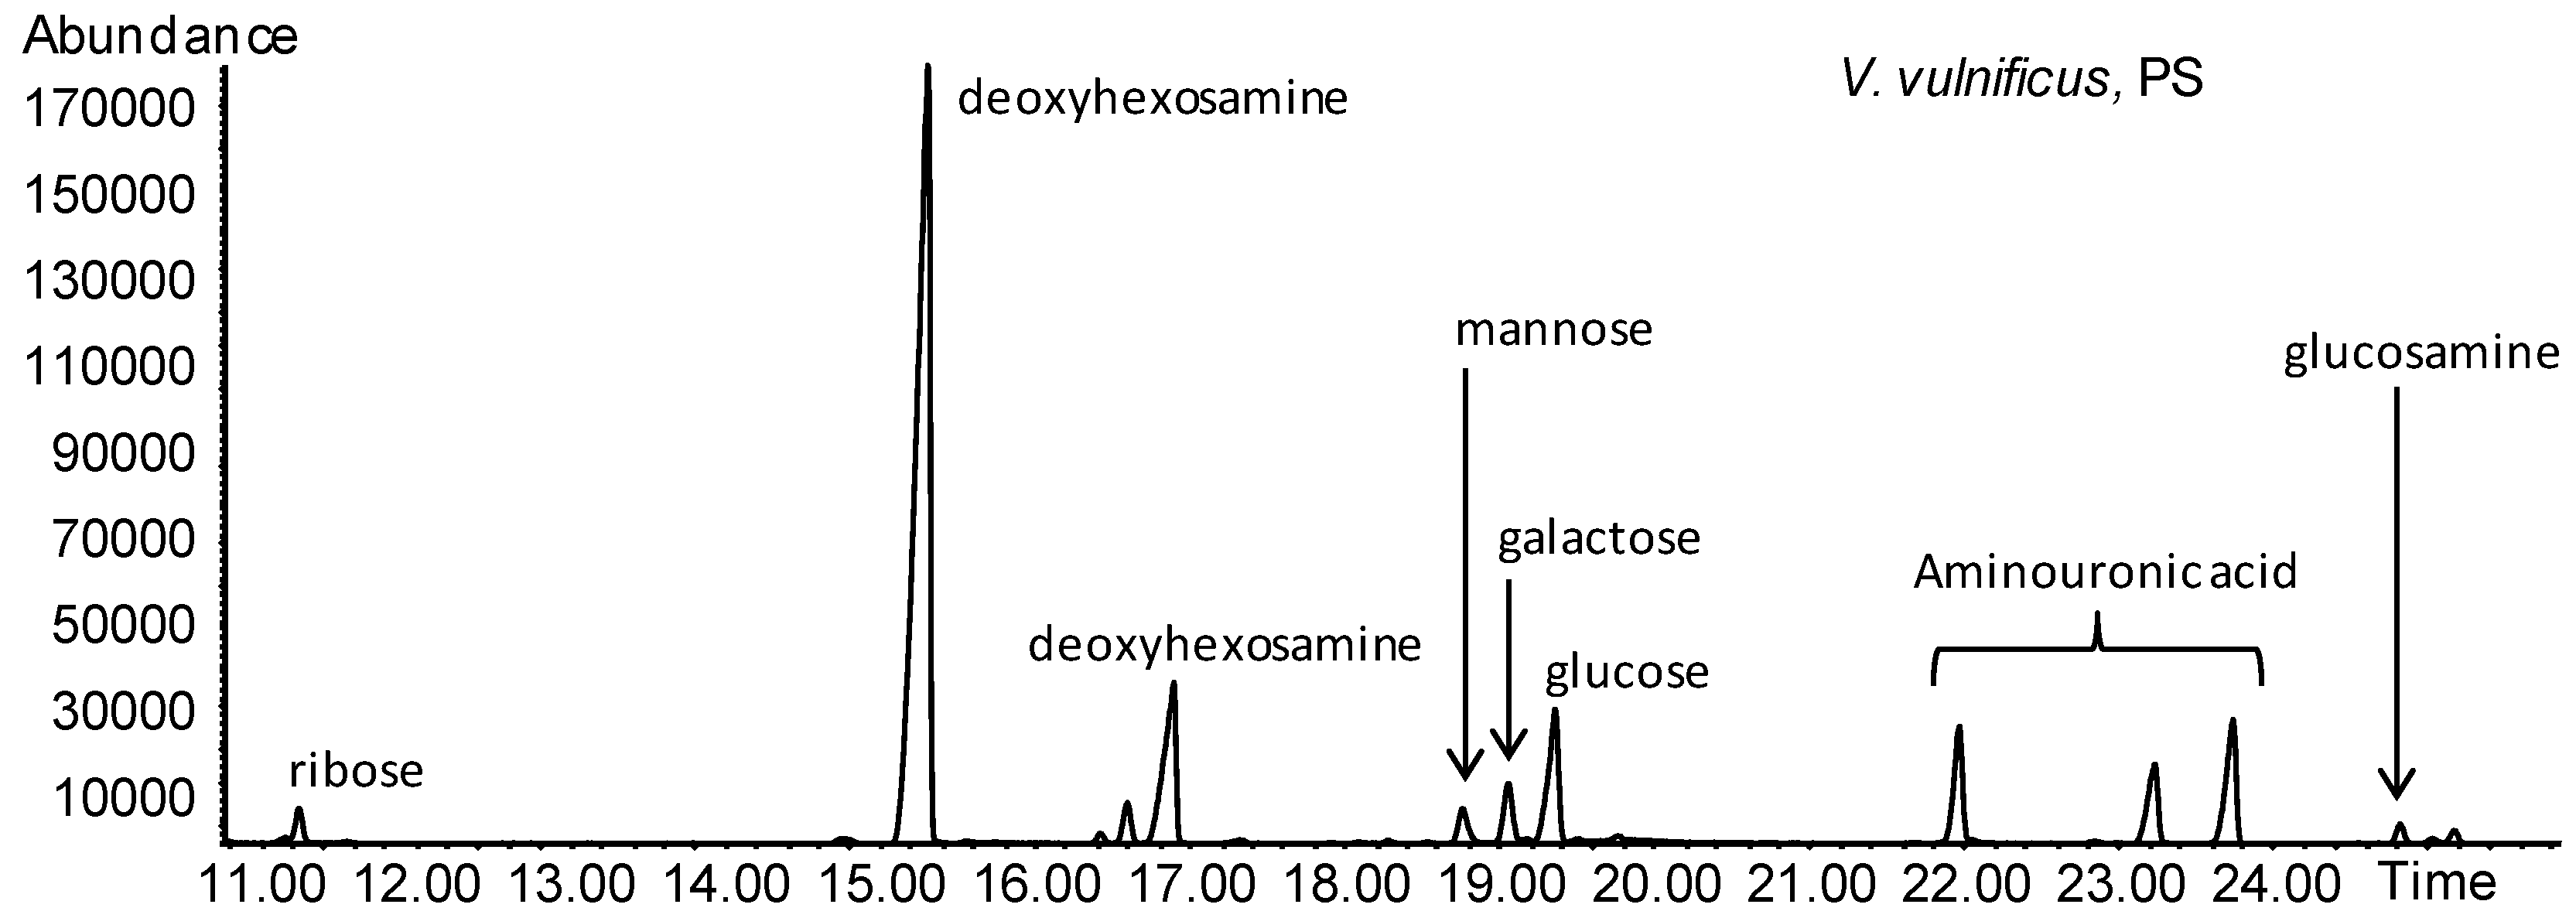
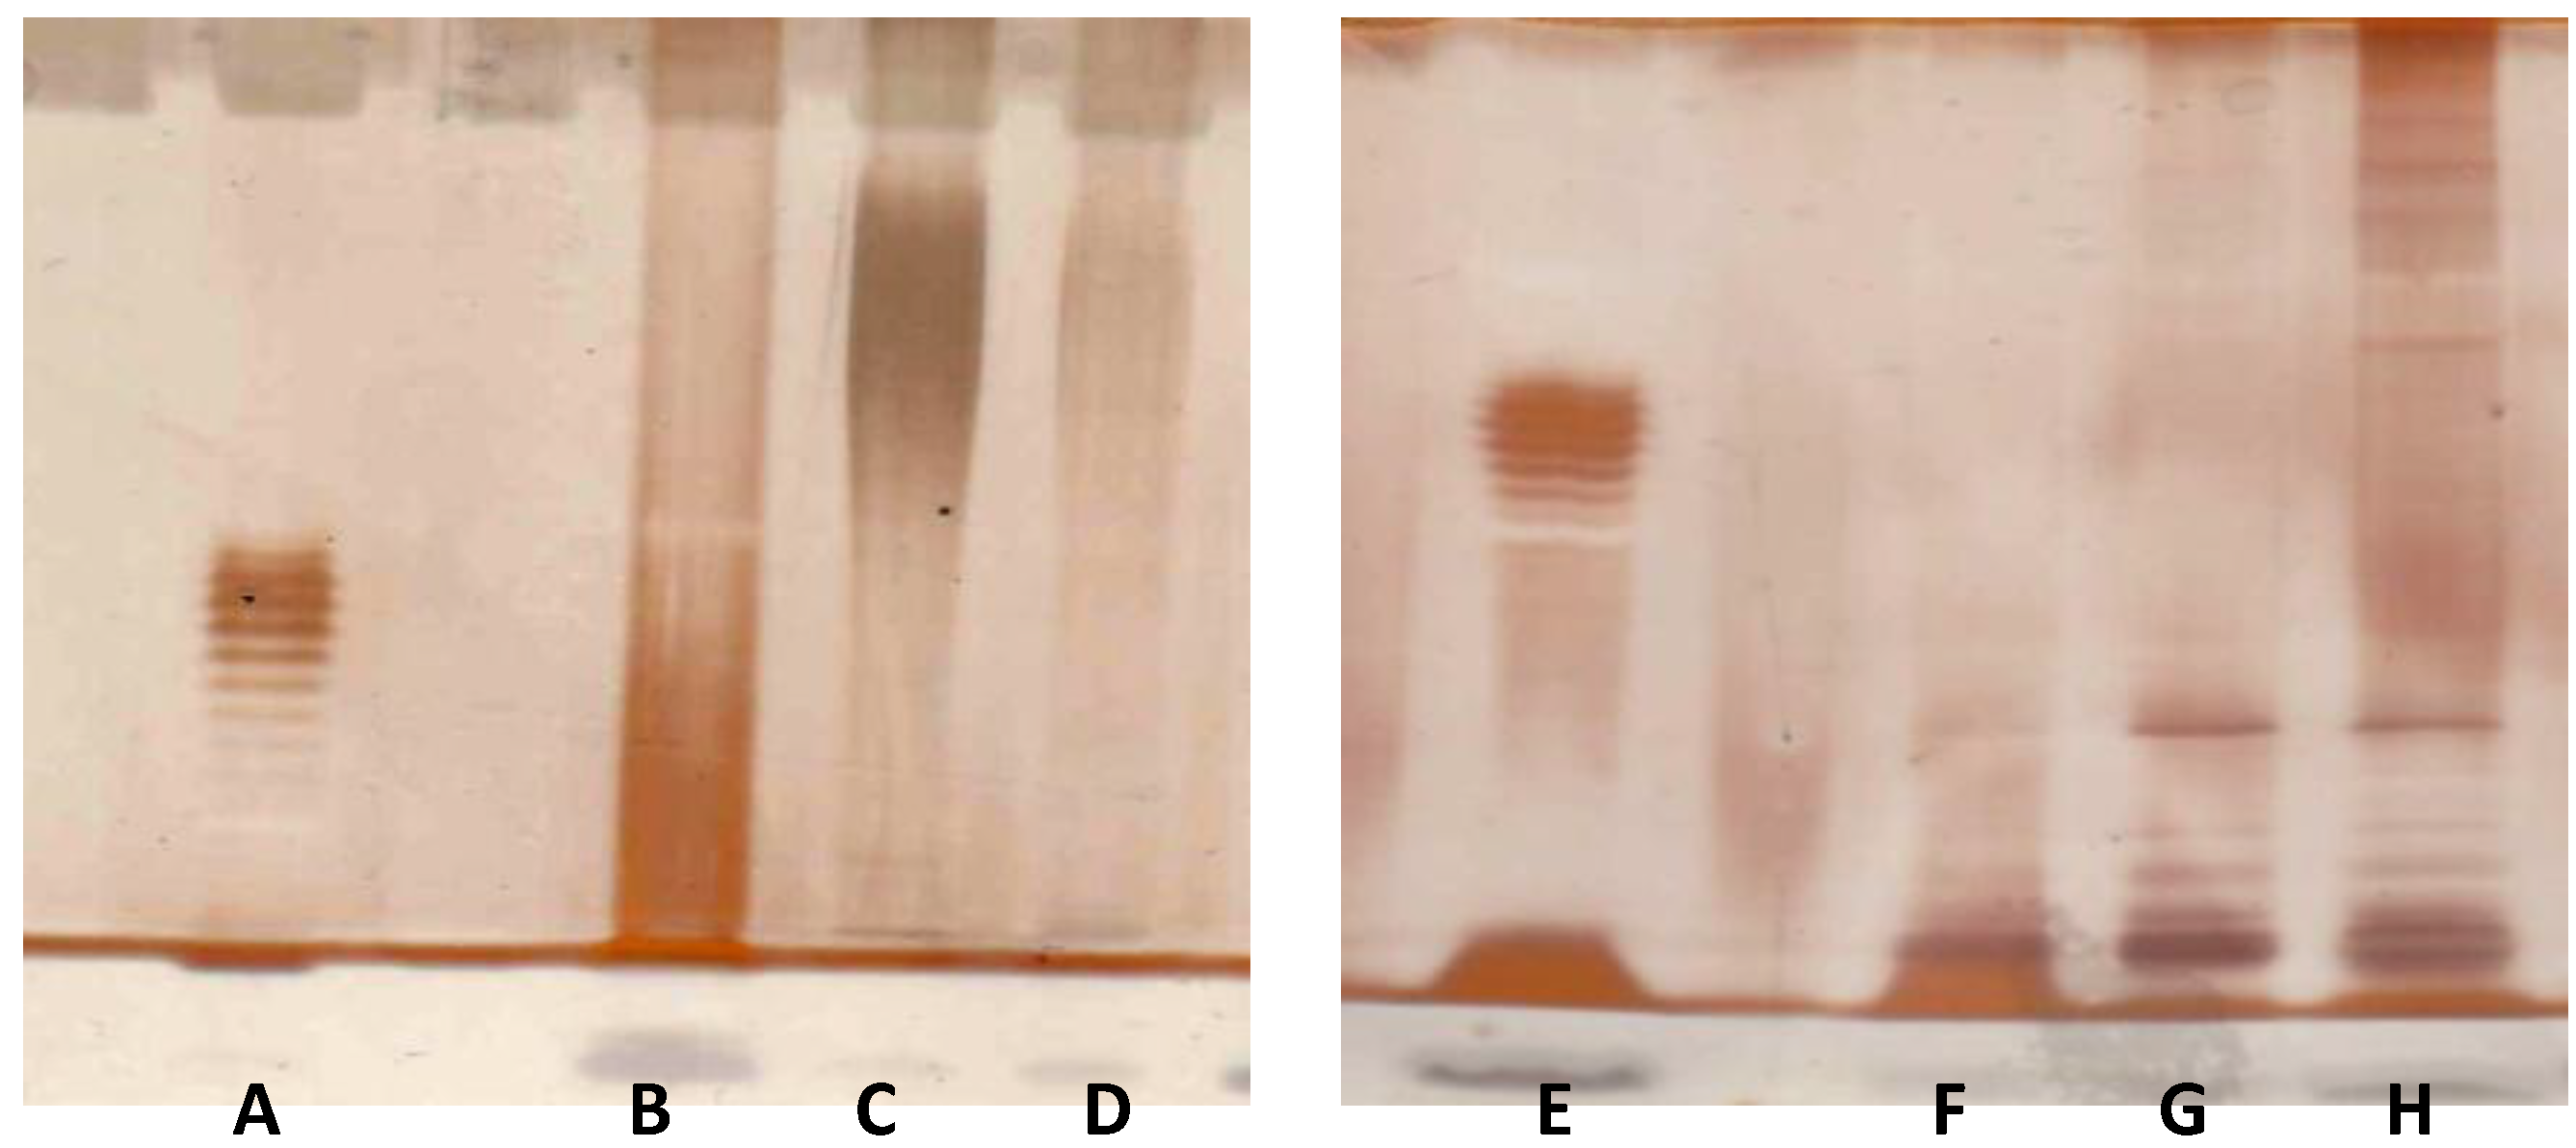
2.8. V. vulnificus LPS Isolation and Chemical Analyses

In order to determine whether the results reported in Figure 1, Figure 2, Figure 3, Figure 4, Figure 5, Figure 6 and Table 1 might reflect a chemical difference between E. coli vs. V. vulnificus LPS, Vibrio vulnificus strain MO6-24/O cells were extracted according two different methodologies; the extracts were checked by sodium dodecyl sulfate polyacrylamide gel electrophoresis (SDS-PAGE) electrophoresis (Figure 7) and the gels were stained with the silver nitrate protocol. Alcian blue was used as fixative in one case to detect the occurrence of acidic polysaccharide [66]. As expected, lipooligosaccharide (LOS, 162 mg, Figure 7 Lanes B and F) was recovered after PCP (Petroleum ether–Chloroform–aqueous phenol) extraction of cells. The remaining pellet was extracted according to the hot water/phenol protocol. The silver stained SDS-PAGE profile of the crude extract of the water layer (Figure 7, Lane H) contained a dense banding spread throughout the gel, while comparison of the same sample stained applying Alcian blue fixative first suggested the occurrence of a polysaccharide (PS) in the upper part of the gel (Figure 7, Lane D). To confirm this hypothesis, the crude sample (219 mg) was treated with DNAse, RNAse and proteinase K; SDS-PAGE control of the purified sample (79 mg) indeed showed that the dense banding was lost (Figure 7, Lane G) while the use of the fixative gave a positive and intense staining of the PS (Figure 7, Lane C). In addition, SDS-PAGE profiles showed that LOS was pure and not contaminated from the acidic polysaccharide, while minimal traces of LOS were seen in the water extracts.
Figure 7. SDS-PAGE of cell wall extracts from V. vulnificus. Left panel: Twelve percent gel fixed with Alcian blue prior to silver staining. Right panel: Fifteen percent gel stained directly with the silver nitrate protocol. Lanes A and E: E. coli O55 (8 μg); Lanes B and F: Petroleum ether–Chloroform–aqueous phenol (PCP) extract (16 μg); Lanes C and G: Water layer of the phenol/water extraction (16 μg) after enzyme treatment; Lanes D and H: Water layer of the phenol/water extraction (16 μg) before enzyme treatment.
Marinedrugs 12 01732 g007
Further information on the chemical constituents of both LOS and PS from V. vulnificus, came from gas chromatography–mass spectrometry (GC-MS) analysis of the corresponding acetylated methyl glycosides. As for the LOS (Figure 8, upper panel), composition analysis detected the occurrence of l-glycero-d-manno-heptose, glucosamine and glucose but not Kdo (2-keto-3-deoxy-d-manno-octulosonic acid), the hallmark monosaccharide of LOS. Therefore, suspecting the presence of phosphate on this residue, LOS was treated with aqueous hydrogen fluoride (HF) and the analysis repeated (Figure 8, lower panel). The chromatogram contained two additional peaks, of which the one at 28.2 min was the main peak of Kdo, while the one at 26.2 min was another type of heptose together with the minor peak produced from Kdo during this chemical procedure. Lipid composition was inferred by GC-MS analysis as well and showed the presence of C12:0 3-OH, C14:0, C14:0 2-OH and C14:0 3-OH (data not shown).
Figure 8. Gas chromatography-mass spectrometry (GC-MS) chromatograms of the acetylated methyl glycosides of the lipooligosaccharide (LOS) fraction from V. vulnificus. The upper profiles indicate the monosaccharide composition of the LOS without hydrogen fluoride (HF) treatment and does not contain 2-keto-3-deoxy-d-manno-octulosonic acid (Kdo); the low profile is obtained after HF treatment of the sample. Peaks barred are impurities.
Marinedrugs 12 01732 g008
As for the PS composition (Figure 9), residues characteristic of the LOS were below the detection limit, even when HF treatment was performed (data not shown). This polysaccharide contained mainly a 6-deoxy-hexosamine residue and an amino uronic acid residue. The ring stereochemistry of both these monosaccharides could not be determined at this stage because of the lack of appropriate standards and will be the object of further work.
Figure 9. GC-MS chromatograms of the acetylated methyl glycosides of V. vulnificus polysaccharide (PS). Ribose peak is a reminiscence of the RNA contaminating the sample.
Marinedrugs 12 01732 g009

3. Discussion

The role of microglia activation in central nervous system infections [25] as well as the involvement of O2 generation in the mechanism of neuroinflammation and neurodegeneration has received considerable attention over the past two decades [26,30,67]. One significant activator of microglia is LPS [68], which may activate microglia via the lipid A portion of the macromolecule, and then stimulate release of O2 as well as additional proinflammatory mediators such as matrix metalloproteinases, arachidonic acid metabolites, cytokines and chemokines [26].
The first aim of our investigation was to test the hypothesis that LPS purified from human clinical V. vulnificus strain MO6-24/O might activate rat brain microglia and result in O2 release in vitro. Our experimental data lends support to our working hypothesis and the following deductions: First, as previously reported [27,38], a 17 h incubation of microglia with E. coli LPS resulted in an initial dose-dependent enhancement of PMA-stimulated O2 release followed by a progressive inhibition at greater than 1 ng/mL, which paralleled an increase in LDH release. Second, V. vulnificus MO6-24/O LPS-treated microglia generated O2 as depicted by a bell-shaped dose-response curve that in contrast to E. coli LPS peaked at 10 ng/mL, whereupon a progressive attenuation of O2 generation concomitant to increased LDH release was observed. Third, the observed right shift of the bell-shaped dose-response curve depicting O2 generation by microglia treated with V. vulnificus MO6-24/O LPS indicates that this particular V. vulnificus LPS was less potent than E. coli LPS. Future studies should be undertaken to determine whether peak O2 generation by V. vulnificus MO6-24/O LPS require 18-24 h to develop, as observed with E. coli LPS-treated microglia [27].
Our second aim was to investigate whether concomitant with O2 generation, V. vulnificus MO6-24/O LPS-treated microglia might release pro-inflammatory mediators, as we have observed with both E. coli LPS [27] and, more recently, with M. aeruginosa LPS-treated microglia [38]. Our data supports the following observations: First, confirming the above mentioned studies, after a 17 h in vitro incubation with E. coli LPS, microglia released both TXB2 and MMP-9, as well as the following cytokines and chemokines in the following rank order: MIP-2/CXCL2 > MIP-1α/CCL3 > CINC-2α&β/CXCL3 > IL-6 > TNF-α > IL-1α > MCP-1/CCL2. Second, and for the first time to our knowledge, concomitant with significant O2 release, V. vulnificus MO6-24/O LPS-treated microglia generated not only TXB2 and MMP-9, but also proinflammatory cytokines and chemokines in the following rank order: MIP-2/CXCL2 > CINC-2α & β/CXCL3 > IL-6 > MIP-1α/CCL3 > TNF-α > IL-1α > MCP-1/CCL2. Third, similar to O2 generation, and supporting the notion that V. vulnificus MO6-24/O LPS was less potent but more effective than E. coli LPS, with the exception of MIP-1α, all the pro-inflammatory mediators investigated were released in larger quantities in vitro. Fourth, the progressive in vitro attenuation of PMA-elicited O2 generation in V. vulnificus MO6-24/O LPS-treated microglia correlated with both the concentration-dependent LDH release as well as the presence of TXB2, MMP-9, and the cytokines and chemokines that were investigated. Our current study suggests, but does not conclusively prove, that the studied proinflammatory mediators may contribute to the mechanism of V. vulnificus MO6-24/O LPS-induced cytotoxicity to microglia in vitro. This intriguing possibility remains to be investigated in future studies.
It is important to reflect on several potential new lines of inquiry that have emerged from the observed effects of V. vulnificus MO6-24/O LPS on rat neonatal microglia in vitro. First, because the present study was completed with V. vulnificus MO6-24/O LPS, an archetypical clinical V. vulnificus strain [7,8], it would be important to determine whether LPS isolated from other V. vulnificus strains, particularly those from the environment, would also be bioactive in the in vitro rat microglia model. Second, because our experimental paradigm used neonatal brain microglia, an important next study would be to determine whether V. vulnificus MO6-24/O LPS might activate adult rat microglia, which release higher levels of PGE2 than neonatal microglia [69], and may perhaps differ in their capacity to generate O2, as well as other inflammatory mediators. Third, determining whether treatment of human microglia with V. vulnificus LPS in vitro would also show an in vitro biphasic O2 generation should be investigated, because E. coli LPS would prime human microglia O2 release in vitro [70]. Fourth, in vivo studies should be undertaken to determine whether systemic inflammation caused by V. vulnificus MO6-24/O LPS may be pathogenic to the brain immune system, perhaps being less potent but more efficacious than E. coli LPS, as we have observed in our in vitro studies, because this V. vulnificus biotype has been shown to be lethal to mice [14] and induce cytokine release from human peripheral blood leukocytes [19]. The induction of reactive oxygen species by V. vulnificus LPS is also intriguing in light of recent work suggesting that the inflammatory response is attenuated in peripheral blood mononuclear cells from chronic alcohol users with evidence of oxidative stress following in vitro exposure to live V. vulnificus bacterial cells [71]. Fifth, further studies on the chemical structure of V. vulnificus LPS are necessary to determine its potential relationship with the observed bioactivity in this study. We are hopeful that further investigation of the immunotoxicology of V. vulnificus LPS on brain microglia both in vitro and in vivo will contribute to the development of novel therapeutic strategies to protect and treat humans exposed to both clinical and environmental sources of V. vulnificus strains.

4. Experimental Section

4.1. Reagents

Escherichia coli LPS (E. coli) (O26:B6) was from Difco Laboratories, Detroit, MI, USA, and V. vulnificus LPS (1.075 × 10⁵ endotoxin units/mg), prepared from V. vulnificus strain MO6-24/O LPS as described [19], was used in experiments depicted in Figure 1, Figure 2, Figure 3, Figure 4, Figure 5, Figure 6 and Table 1. Dulbecco’s modified Eagle medium (DMEM) with high glucose (4500 mg/L), Hanks’ balanced salt solution (HBSS), penicillin (P), streptomycin (S) and trypsin (0.25%)-EDTA (1 mM) were from GIBCO Laboratories, Life Technologies Inc., Grand Island, NY, USA; heat-inactivated fetal bovine serum certified (FBS) was from Hyclone, Logan, UT, USA; ferricytochrome c type III (from horse heart) (FCC), superoxide dismutase (from bovine liver) (SOD), phorbol 12-myristate 13-acetate (PMA) were from Sigma Chemical Co., St. Louis, MO, USA. PMA was maintained at −20 °C as a 8 mM stock solution in DMSO.

4.2. LPS Contamination

All glassware and metal spatulas were baked for 4 h at 210 °C to inactivate LPS [72]. Sterile and LPS-free 225 cm2 vented cell culture flasks were from BD Biosciences, San Jose, CA, USA; 24-well flat-bottom culture clusters were from Costar®, Corning Inc., Corning, NY, USA; disposable serological pipettes were from Greiner Bio-One, Monroe, NC, USA. Sterile and pyrogen-free Eppendorf Biopur pipette tips were from Brinkmann Instruments, Inc., Westbury, NY, USA.

4.3. Isolation of Rat Neonatal Microglia

Experiments were performed in adherence to National Institutes of Health guidelines on the use of experimental animals, with protocols approved by Midwestern University's Research and Animal Care Committee. Rat brain neonatal microglia were isolated and characterized as previously described [27]. Briefly, cerebral cortices of 1–2 day-old Sprague-Dawley rats from Charles Rivers Laboratories, Portage, MI, USA, were surgically removed, placed in cold DMEM containing 120 U/mL P and 12 μg/mL S, the meninges removed, and brain tissue minced and dissociated with trypsin-EDTA at 35.9 °C for 3–5 min. The mixed glial cell suspension was plated in 225 cm2 vented cell culture flasks with DMEM medium supplemented with 10% FBS containing 120 U/mL P and 12 μg/mL S, and grown in a humidified 5% CO2 incubator at 35.9 °C for 12–14 days. Upon confluence (Day 14) and every week thereafter, microglia were detached using an orbital shaker (150 rpm, 0.5 h, 35.9 °C, 5% CO2), centrifuged (400× g, 25 min, 4 °C), and cell number and viability assessed by trypan blue exclusion. In our laboratory, rat neonatal microglia yields averaged 1.1 × 10⁶ microglia per tissue culture flask (225 cm2) per week. Depending on the particular experimental design (see below), microglia averaging > than 95% viability were plated in 24-well cell culture clusters, with DMEM supplemented with 10% FBS containing 120 U/mL P and 12 μg/mL S, and placed in a humidified 5% CO2 incubator at 35.9 °C 24 h prior to the experiments.

4.4. Activation of Microglia with LPS (Experimental Design)

To determine the in vitro effect of V. vulnificus MO6-24/O LPS on rat neonatal microglia activation and inflammatory mediator release (O2, eicosanoids, matrix metalloproteinases, cytokines, and chemokines), 2 × 10⁵ rat neonatal microglia were seeded in DMEM + 10% FBS + 120 U/mL P + 12 μg/mL S into each well of nonpyrogenic polystyrene 24-well flat-bottom culture clusters (Costar®, Corning Inc., Corning, NY, USA), and stimulated with 0.1–105 ng/mL V. vulnificus LPS for 17 h in a humidified 5% CO2 incubator at 35.9 °C. E. coli LPS (0.1–100 ng/mL) was used as a control in all the experiments described herein [27]. After the 17h incubation, conditioned media (1 mL) from each tissue culture well was aspirated and split into two aliquots. One aliquot (0.1 mL) was used to measure lactic dehydrogenase (LDH) levels, as a measure of cell viability [39]. The remaining aliquot (0.9 mL) was frozen (−84 °C) until determination of eicosanoids, cytokines, chemokines, and matrix metalloproteinases, as described below. Once the conditioned media had been removed, both V. vulnificus and E. coli LPS–treated microglia cells were washed with warm (37 °C) HBSS, and O2 was determined as described below.

4.5. Assay for Superoxide Anion (O2) Generation

O2 generation was determined by the superoxide dismutase (SOD)-inhibitable reduction of ferricytochrome C (FCC) [27]. Briefly, PMA (1 μM)-triggered O2 release from either E. coli or V. vulnificus LPS-activated microglia was measured in the presence of FCC (50 μM) and HBSS, with or without SOD (700 Units), which inhibited >95% of FCC reduction, during a 70 min incubation in a humidified 5% CO2 incubator at 35.9 °C. All experimental treatments were run in duplicate and in a final volume of 1 mL. Changes in FCC absorbance were measured at 550 nm using a Beckman DU-800 spectrophotometer. Differences in the amount of reduced FCC in the presence and absence of SOD were used to determine microglia O2 generation by employing the molecular extinction coefficient of 21.0 × 10³ M−1 cm−1 and expressed in nmol.

4.6. Assay for Lactic Dehydrogenase (LDH)

To assess cell viability of microglia treated with either V. vulnificus LPS or E. coli LPS as described in our experimental design, conditioned media was harvested following preincubation and LDH release was determined as described [27,39]. Microglia LDH release was expressed as a percent of total LDH released by 0.1% Triton X-100-lysed microglia. Because the fetal bovine serum contained LDH (data not shown), unless LDH release from LPS-treated microglia was greater than 15% of that observed from Triton X-100 (0.1%)-treated microglia (total LDH), LPS treatment was considered to have had no effect on microglia viability.

4.7. Assay for Thromboxane B2 (TXB2) Generation

Following incubation of microglia with either V. vulnificus LPS or E. coli LPS for 17 h, TXB2 generation in cell-free conditioned media was measured using a TXB2 immunoassay (Cayman Chemical, Ann Arbor, MI, USA), as indicated in the manufacturer’s protocol. Results were expressed as picogram per mL (pg/mL). The minimum detectable concentration was 7.8 pg/mL TXB2.

4.8. Gelatinase Zymography for MMP-2 and MMP-9 Analysis

Gelatin-containing zymograms were used to detect MMP-2 (68 kDa) and MMP-9 (92 kDa) and their identification was based on molecular weight. Following incubation of cultured rat neonatal microglia with either V. vulnificus LPS or E. coli LPS, MMP-2 and -9 release were determined in the cell-free conditioned media. As the rat neonatal microglia cultures were normalized for cell number, equal volumes of harvested media obtained from each condition were analyzed. Briefly, 90 μg of each protein sample were electrophoresed using a 10% polyacrylamide gel containing 0.1% gelatin. The gels were then incubated twice for 30 min in 1× Novex Zymogram Renaturing Buffer (Invitrogen, Carlsbad, CA, USA), incubated overnight in a 5% CO2 incubator at 37 °C, and stained in 0.4% (wt/vol) Coomassie Brilliant Blue R-250 Solution (Bio-Rad, Hercules, CA, USA). Sequential destaining first in 40% methanol, 10% acetic acid, and then in 10% methanol, 10% acetic acid allowed MMP activity to be visualized as clear bands against a blue background. Images of zymograms were obtained using a Kodak Gel Logic 1500 Imaging System and Molecular Imaging Software (Kodak, Rochester, NY, USA). Semiquantitation of zymograms was performed using the UN-SCAN-IT™ gel automated digitizing system from Silk Scientific (Orem, UT, USA). Microglia MMP release was normalized between experiments by dividing values in pixels for treated samples by their respective controls.

4.9. Assays for Cytokines: TNF-α, IL-1α, IL-6 and TGF-β1

The presence of immunoreactive cytokines TNF-α, IL-1α, IL-6, TGF-β1 in the cell-free conditioned media was determined using rat-specific ELISAs from Biosource International (Camarillo, CA, USA). The results were expressed in pg/mL. The minimum detectable cytokine concentrations were: TNF-α, less than 4 pg/mL; IL-1α, less than 3 pg/mL; IL-6, less than 7 pg/mL and TGF-β1, less than 15.6 pg/mL.

4.10. Assays for Chemokines: MIP-1α/CCL3, MIP-2/CXCL2, MCP-1/CCL2 and CINC-2α/β/CXCL3

The presence of immunoreactive chemokines in cell-free conditioned media was determined using rat-specific ELISAs: For MIP-1α/CCL3 from Koma Biotech, Seoul, South Korea; for MIP-2/CXCL2 and MCP-1/CCL2 from Biosource International, Camarillo, CA, USA, and for CINC-2α/β/CXCL3 from R & D Systems, Minneapolis, MN, USA. The results were expressed in pg/mL. The minimum detectable chemokine concentrations were: MIP-1α/CCL3, less than 16 pg/mL; MIP-2/CXCL2, less than 1 pg/mL; MCP-1/CCL2, less than 8 pg/mL; and CINC-2α/β/CXCL3, less than 0.8 pg/mL.

4.11. Assay for the Neurotrophin Brain Derived Neurotrophic Factor (BDNF)

BDNF generation in cell-free conditioned media was measured using a rat-specific ELISA for BDNF from EMD Millipore, Billerica, MA. The results were expressed in pg/mL. The minimum detectable concentration was less than 7.8 pg/mL.

4.12. V. vulnificus LPS Chemical Analyses

V. vulnificus strain MO6-24/O LPS was streaked from frozen stocks onto LB agar medium and incubated at 37 °C overnight. Bacteria from single colonies were inoculated into 10 mL LB broth and shaken overnight at 37 °C. Two mL of the overnight culture were spread onto each of five 21.5 × 27 cm pans containing approximately 250 mL of LB agar medium and incubated overnight at 37 °C. Cells were harvested from the trays, suspended in 15 mL deionized water, and heat shocked at 70 °C for 7 min. The cell suspension was then frozen and lyophilized. V. vulnificus LPS was prepared for chemical analysis from the V. vulnificus strain MO6-24/O LPS as described [73]. LPS monosaccharides and lipids were analysed as acetylated O-methyl glycosides and methylesters, respectively, as described [66]. Dephosphorylation was carried out keeping LPS (0.5 mg) in aqueous HF (50%, 50 μL) at room temperature overnight. The solution was evaporated under a stream of air and the dried material was analysed after transformation into the corresponding acetylated methyl glycosides. GC-MS analyses were performed with an Agilent 6850 coupled to MS Agilent 5973, equipped with a SPB-5 capillary column (Supelco, 30 m × 0.25 mm i.d., flow rate, 0.8 mL min−1) and He as carrier gas. Electron impact mass spectra were recorded with an ionization energy of 70 eV and an ionizing current of 0.2 mA. The temperature program used for the analyses was the following: 150 °C for 5 min, 150→300 °C at 3 °C/min, 300 °C for 5 min.

4.13. Statistical Analysis

Data was expressed as mean ± SEM from two to four independent experiments (n), each experiment with triplicate determinations. Data were analyzed with Prism® software package Version 6 from GraphPad, San Diego, CA, USA. LPS-treated microglia were compared with the vehicle-treated microglia (control), shown as zero in the corresponding figures. One-way ANOVA followed by Dunnett’s post hoc procedure was performed on all sets of data. Statistical significance between the effect of a single dose of E. coli and V. vulnificus LPS on the generation of each mediator investigated (e.g., O2) was determined using two-way ANOVA. Differences were considered statistically significant at p < 0.05 and reported in each figure legend.

5. Conclusions

Concentration-dependent treatment of neonatal brain microglia with V. vulnificus MO6-24/O LPS resulted in a significant rise in O2 production, followed by progressive decrease in O2 release, concomitant with release of LDH, and generation of TXB2, MMP-9, cytokines and chemokines. We hypothesize that the inflammatory mediators investigated may be involved in the mechanism of injury to microglia in vitro, by an as yet undetermined autocrine mechanism. Although in vitro V. vulnificus LPS was less potent than E. coli LPS, inflammatory mediator release was clearly more efficacious. A possible explanation for this result is that the in vitro microglia system is able to perceive chemical differences between V. vulnificus and E. coli LPS. Our chemical data show that Kdo in V. vulnificus LPS is fully phosphorylated and that the fatty acid pattern is similar with the exception of C14:0 2-OH which is absent in E. coli. These differences may be of importance in the modulation of the biological activity by LPS and more insights will probably be gained after the complete structure of V. vulnificus LPS is elucidated.
Finally, we hypothesize that should V. vulnificus LPS gain entry into the CNS, it is possible that microglia may become activated, resulting in high levels of O2 release as well as neuroinflammatory TXB2, MMP-9, cytokines and chemokines. In vivo studies with V. vulnificus LPS will be required to test this intriguing hypothesis.

Abbreviations

BDNF
brain derived neurotrophic factor
CINC-2α/β/CXCL3
cytokine-induced neutrophil chemoattractant or macrophage inflammatory protein-2b or chemokine ligand 3
DMEM
Dulbecco’s modified Eagle medium
E. coli
Escherichia coli
FBS
fetal bovine serum certified
FCC
ferricytochrome c type III
HBSS
Hank’s balanced salt solution
IL
interleukin
LDH
lactic dehydrogenase
LPS
lipopolysaccharide
MCP-1/CCL2
monocyte chemotactic protein-1 or chemokine ligand 2
MIP-1α/CCL3
macrophage inflammatory protein 1α or chemokine ligand 3
MIP-2/CXCL2
macrophage inflammatory protein-2
MMP-9
matrix metalloproteinase-9
O2
superoxide anion
P
penicillin
PBS
phosphate buffered saline
PMA
phorbol 12-myristate 13-acetate
S
streptomycin
SEM
standard error of the mean
SOD
superoxide dismutase
TGF-β1
transforming growth factor β1
TNF-α
tumor necrosis factor
TXB2
thromboxane B2
V. vulnificus
Vibrio vulnificus

Acknowledgments

This research was completed with institutional support provided by the Office of Research and Sponsored Programs at Midwestern University, and the Biomedical Sciences Program, College of Health Sciences, Midwestern University. Valuable assistance by Midwestern University’s animal facility and library staff as well as the excellent secretarial assistance of Victoria Sears is gratefully acknowledged.

Author Contributions

A.M.S.M conceived and planned the study and wrote most of the manuscript. M.L.H. supervised all experiments and performed both data and statistical analysis. M.H., M.A., J.F., L.O. were students in A.M.S.M.’s laboratory and performed the experiments and assays corresponding to Figure 1, Figure 2, Figure 3, Figure 4, Figure 5, Figure 6 and Table 1. J.P. generously provided the V. vulnificus LPS strain MO6-24/O used for experiments depicted in Figure 1, Figure 2, Figure 3, Figure 4, Figure 5, Figure 6 and Table 1. D.R. prepared cultures of V. Vulnificus strain MO6-24/O used for chemical analysis. C.D.C. and A.M. performed the V. vulnificus LPS chemical analysis shown in Figure 7, Figure 8 and Figure 9.

Conflicts of Interest

The authors declare no conflict of interest.

References

  1. Cazorla, C.; Guigon, A.; Noel, M.; Quilici, M.L.; Lacassin, F. Fatal Vibrio vulnificus infection associated with eating raw oysters, New Caledonia. Emerg. Infect. Dis. 2011, 17, 136–137. [Google Scholar] [CrossRef]
  2. Oliver, J.D. Wound infections caused by Vibrio vulnificus and other marine bacteria. Epidemiol. Infect. 2005, 133, 383–391. [Google Scholar] [CrossRef]
  3. Horseman, M.A.; Surani, S. A comprehensive review of Vibrio vulnificus: An important cause of severe sepsis and skin and soft-tissue infection. Int. J. Infect. Dis. 2011, 15, e157–e166. [Google Scholar] [CrossRef]
  4. Kim, S.J.; Kim, B.C.; Kim, D.C.; Kim, M.K.; Cho, K.H.; Seo, J.J.; Shin, J.H. A fatal case of Vibrio vulnificus meningoencephalitis. Clin. Microbiol. Infect. 2003, 9, 568–571. [Google Scholar] [CrossRef]
  5. Katz, B.Z. Vibrio vulnificus meningitis in a boy with thalassemia after eating raw oysters. Pediatrics 1988, 82, 784–786. [Google Scholar]
  6. Baker-Austin, C.; McArthur, J.V.; Lindell, A.H.; Wright, M.S.; Tuckfield, R.C.; Gooch, J.; Warner, L.; Oliver, J.; Stepanauskas, R. Multi-site analysis reveals widespread antibiotic resistance in the marine pathogen Vibrio vulnificus. Microb. Ecol. 2009, 57, 151–159. [Google Scholar]
  7. Broza, Y.Y.; Raz, N.; Lerner, L.; Danin-Poleg, Y.; Kashi, Y. Genetic diversity of the human pathogen Vibrio vulnificus: A new phylogroup. Int. J. Food Microbiol. 2012, 153, 436–443. [Google Scholar] [CrossRef]
  8. Baker-Austin, C.; Lemm, E.; Hartnell, R.; Lowther, J.; Onley, R.; Amaro, C.; Oliver, J.D.; Lees, D. pilF polymorphism-based real-time PCR to distinguish Vibrio vulnificus strains of human health relevance. Food Microbiol. 2012, 30, 17–23. [Google Scholar] [CrossRef]
  9. Bahrani, K.; Oliver, J.D. Studies on the lipopolysaccharide of a virulent and an avirulent strain of Vibrio vulnificus. Biochem. Cell Biol. 1990, 68, 547–551. [Google Scholar] [CrossRef]
  10. Biosca, E.G.; Collado, R.M.; Oliver, J.D.; Amaro, C. Comparative study of biological properties and electrophoretic characteristics of lipopolysaccharide from eel-virulent and eel-A virulent Vibrio vulnificus strains. Appl. Environ. Microbiol. 1999, 65, 856–858. [Google Scholar]
  11. Vinogradov, E.; Wilde, C.; Anderson, E.M.; Nakhamchik, A.; Lam, J.S.; Rowe-Magnus, D.A. Structure of the lipopolysaccharide core of Vibrio vulnificus type strain 27562. Carbohydr. Res. 2009, 344, 484–490. [Google Scholar] [CrossRef]
  12. McPherson, V.L.; Watts, J.A.; Simpson, L.M.; Oliver, J.D. Physiological effects of the lipopolysaccharide of Vibrio vulnificus on mice and rats. Microbios 1991, 67, 141–149. [Google Scholar]
  13. Chatzidaki-Livanis, M.; Hubbard, M.A.; Gordon, K.; Harwood, V.J.; Wright, A.C. Genetic distinctions among clinical and environmental strains of Vibrio vulnificus. Appl. Environ. Microbiol. 2006, 72, 6136–6141. [Google Scholar] [CrossRef]
  14. Chae, M.R.; Park, B.H.; Kim, J.S.; Rho, H.W.; Park, J.W.; Kim, H.R. Protective effect of C-reactive protein against the lethality induced by Vibrio vulnificus lipopolysaccharide. Microbiol. Immunol. 2000, 44, 335–340. [Google Scholar] [CrossRef]
  15. Park, K.H.; Kim, J.S.; Lee, Y.R.; Moon, Y.J.; Hur, H.; Choi, Y.H.; Kim, C.H.; Kim, U.H.; Song, E.K.; Yoo, W.H.; et al. Low-density lipoprotein protects Vibrio vulnificus-induced lethality through blocking lipopolysaccharide action. Exp. Mol. Med. 2007, 39, 673–678. [Google Scholar] [CrossRef]
  16. Merkel, S.M.; Alexander, S.; Zufall, E.; Oliver, J.D.; Huet-Hudson, Y.M. Essential role for estrogen in protection against Vibrio vulnificus-induced endotoxic shock. Infect. Immun. 2001, 69, 6119–6122. [Google Scholar] [CrossRef]
  17. Jones, M.K.; Oliver, J.D. Vibrio vulnificus: Disease and pathogenesis. Infect. Immun. 2009, 77, 1723–1733. [Google Scholar] [CrossRef]
  18. Starks, A.M.; Schoeb, T.R.; Tamplin, M.L.; Parveen, S.; Doyle, T.J.; Bomeisl, P.E.; Escudero, G.M.; Gulig, P.A. Pathogenesis of infection by clinical and environmental strains of Vibrio vulnificus in iron-dextran-treated mice. Infect. Immun. 2000, 68, 5785–5793. [Google Scholar] [CrossRef]
  19. Powell, J.L.; Wright, A.C.; Wasserman, S.S.; Hone, D.M.; Morris, J.G., Jr. Release of tumor necrosis factor alpha in response to Vibrio vulnificus capsular polysaccharide in in vivo and in vitro models. Infect. Immun. 1997, 65, 3713–3718. [Google Scholar]
  20. Cunningham, C.; Wilcockson, D.C.; Campion, S.; Lunnon, K.; Perry, V.H. Central and systemic endotoxin challenges exacerbate the local inflammatory response and increase neuronal death during chronic neurodegeneration. J. Neurosci. 2005, 25, 9275–9284. [Google Scholar] [CrossRef]
  21. Opal, S.M. Endotoxins and other sepsis triggers. Contrib. Nephrol. 2010, 167, 14–24. [Google Scholar] [CrossRef]
  22. Teeling, J.L.; Perry, V.H. Systemic infection and inflammation in acute CNS injury and chronic neurodegeneration: Underlying mechanisms. Neuroscience 2009, 158, 1062–1073. [Google Scholar] [CrossRef]
  23. Banks, W.A.; Erickson, M.A. The blood-brain barrier and immune function and dysfunction. Neurobiol. Dis. 2010, 37, 26–32. [Google Scholar] [CrossRef]
  24. Hannestad, J.; Gallezot, J.D.; Schafbauer, T.; Lim, K.; Kloczynski, T.; Morris, E.D.; Carson, R.E.; Ding, Y.S.; Cosgrove, K. Endotoxin-induced systemic inflammation activates microglia: [11C]PBR28 positron emission tomography in nonhuman primates. Neuroimage 2012, 63, 232–239. [Google Scholar] [CrossRef]
  25. Rock, R.B.; Gekker, G.; Hu, S.; Sheng, W.S.; Cheeran, M.; Lokensgard, J.R.; Peterson, P.K. Role of microglia in central nervous system infections. Clin. Microbiol. Rev. 2004, 17, 942–964. [Google Scholar] [CrossRef]
  26. Mayer, A.M. Therapeutic implications of microglia activation by lipopolysaccharide and reactive oxygen species generation in septic shock and central nervous system pathologies: A review. Medicina 1998, 58, 377–385. [Google Scholar]
  27. Mayer, A.M.; Oh, S.; Ramsey, K.H.; Jacobson, P.B.; Glaser, K.B.; Romanic, A.M. Escherichia coli lipopolysaccharide potentiation and inhibition of rat neonatal microglia superoxide anion generation: Correlation with prior lactic dehydrogenase, nitric oxide, tumor necrosis factor-alpha, thromboxane B2, and metalloprotease release. Shock 1999, 11, 180–186. [Google Scholar] [CrossRef]
  28. Banati, R.B.; Gehrmann, J.; Schubert, P.; Kreutzberg, G.W. Cytotoxicity of microglia. Glia 1993, 7, 111–118. [Google Scholar] [CrossRef]
  29. Qin, L.; Wu, X.; Block, M.L.; Liu, Y.; Breese, G.R.; Hong, J.S.; Knapp, D.J.; Crews, F.T. Systemic LPS causes chronic neuroinflammation and progressive neurodegeneration. Glia 2007, 55, 453–462. [Google Scholar] [CrossRef]
  30. Perry, V.H.; Nicoll, J.A.; Holmes, C. Microglia in neurodegenerative disease. Nat. Rev. Neurol. 2010, 6, 193–201. [Google Scholar] [CrossRef]
  31. Halliwell, B. Reactive oxygen species and the central nervous system. J. Neurochem. 1992, 59, 1609–1623. [Google Scholar] [CrossRef]
  32. Mayer, A.M.S.; Hall, M.L.; Jacobson, P.B.; Powell, J.L. Differential effect of Vibrio vulnificus and Escherichia coli LPS on rat brain neonatal microglia release of thromboxane B2 and tumor necrosis factor α. FASEB J. 2007, 21. 560.9; Abstract 404. [Google Scholar]
  33. Frenkel, J.; Aldulescu, M.; Hall, M.; Powell, J.L.; Glaser, K.B.; Mayer, A.M.S. Effect of the marine Vibrio vulnificus lipopolysaccharide on rat brain microglia cytokine and chemokine release. Toxicologist 2009, 108, 12, Abstract 64. [Google Scholar]
  34. Ottenhoff, L.D.; Patel, N.; Hall, M.L.; Glaser, K.B.; Jacobson, P.; Rowley, D.; De Castro, C.; Molinaro, A.; Mayer, A.M.S. Effect of Vibrio vulnificus lipopolysaccharide (LPS) on rat brain microglia: Cytokine and chemokine expression profiling by antibody array technology. Toxicologist 2011, 120, 148, Abstract 688. [Google Scholar]
  35. Colton, C.A.; Wilcock, D.M. Assessing activation states in microglia. CNS Neurol. Disord. Drug Targets 2010, 9, 174–191. [Google Scholar] [CrossRef]
  36. Block, M.L.; Zecca, L.; Hong, J.S. Microglia-mediated neurotoxicity: Uncovering the molecular mechanisms. Nat. Rev. Neurosci. 2007, 8, 57–69. [Google Scholar] [CrossRef]
  37. Colton, C.A.; Gilbert, D.L. Production of superoxide anions by a CNS macrophage, the microglia. FEBS Lett. 1987, 223, 284–288. [Google Scholar] [CrossRef]
  38. Mayer, A.M.; Clifford, J.A.; Aldulescu, M.; Frenkel, J.A.; Holland, M.A.; Hall, M.L.; Glaser, K.B.; Berry, J. Cyanobacterial Microcystis aeruginosa lipopolysaccharide elicits release of superoxide anion, thromboxane B, cytokines, chemokines, and matrix metalloproteinase-9 by rat microglia. Toxicol. Sci. 2011, 121, 63–72. [Google Scholar] [CrossRef]
  39. Morgenstern, S.; Flor, R.; Kessler, G.; Klein, B. Automated determination of NAD-coupled enzymes. Determination of lactic dehydrogenase. Anal. Biochem. 1966, 13, 149–161. [Google Scholar] [CrossRef]
  40. Minghetti, L.; Levi, G. Induction of prostanoid biosynthesis by bacterial lipopolysaccharide and isoproterenol in rat microglial cultures. J. Neurochem. 1995, 65, 2690–2698. [Google Scholar] [CrossRef]
  41. Vanlaere, I.; Libert, C. Matrix metalloproteinases as drug targets in infections caused by gram-negative bacteria and in septic shock. Clin. Microbiol. Rev. 2009, 22, 224–239. [Google Scholar] [CrossRef]
  42. Candelario-Jalil, E.; Yang, Y.; Rosenberg, G.A. Diverse roles of matrix metalloproteinases and tissue inhibitors of metalloproteinases in neuroinflammation and cerebral ischemia. Neuroscience 2009, 158, 983–994. [Google Scholar] [CrossRef]
  43. Gottschall, P.E.; Yu, X.; Bing, B. Increased production of gelatinase B (matrix metalloproteinase-9) and interleukin-6 by activated rat microglia in culture. J. Neurosci. Res. 1995, 42, 335–342. [Google Scholar] [CrossRef]
  44. Nishimoto, N. Interleukin-6 as a therapeutic target in candidate inflammatory diseases. Clin. Pharmacol. Ther. 2010, 87, 483–487. [Google Scholar] [CrossRef]
  45. Maccioni, R.B.; Rojo, L.E.; Fernandez, J.A.; Kuljis, R.O. The role of neuroimmunomodulation in Alzheimer’s disease. Ann. N. Y. Acad. Sci. 2009, 1153, 240–246. [Google Scholar]
  46. Lee, S.C.; Liu, W.; Dickson, D.W.; Brosnan, C.F.; Berman, J.W. Cytokine production by human fetal microglia and astrocytes. Differential induction by lipopolysaccharide and IL-1 beta. J. Immunol. 1993, 150, 2659–2667. [Google Scholar]
  47. Hausler, K.G.; Prinz, M.; Nolte, C.; Weber, J.R.; Schumann, R.R.; Kettenmann, H.; Hanisch, U.K. Interferon-gamma differentially modulates the release of cytokines and chemokines in lipopolysaccharide- and pneumococcal cell wall-stimulated mouse microglia and macrophages. Eur. J. Neurosci. 2002, 16, 2113–2122. [Google Scholar] [CrossRef]
  48. Horvath, R.J.; Nutile-McMenemy, N.; Alkaitis, M.S.; Deleo, J.A. Differential migration, LPS-induced cytokine, chemokine, and NO expression in immortalized BV-2 and HAPI cell lines and primary microglial cultures. J. Neurochem. 2008, 107, 557–569. [Google Scholar] [CrossRef]
  49. McCoy, M.K.; Tansey, M.G. TNF signaling inhibition in the CNS: Implications for normal brain function and neurodegenerative disease. J. Neuroinflamm. 2008, 5, 5–45. [Google Scholar] [CrossRef]
  50. Hayashi, M.; Luo, Y.; Laning, J.; Strieter, R.M.; Dorf, M.E. Production and function of monocyte chemoattractant protein-1 and other beta-chemokines in murine glial cells. J. Neuroimmunol. 1995, 60, 143–150. [Google Scholar] [CrossRef]
  51. Simi, A.; Tsakiri, N.; Wang, P.; Rothwell, N.J. Interleukin-1 and inflammatory neurodegeneration. Biochem. Soc. Trans. 2007, 35, 1122–1126. [Google Scholar] [CrossRef]
  52. Allan, S.M.; Tyrrell, P.J.; Rothwell, N.J. Interleukin-1 and neuronal injury. Nat. Rev. Immunol. 2005, 5, 629–640. [Google Scholar] [CrossRef]
  53. Giulian, D.; Baker, T.J.; Shih, L.C.; Lachman, L.B. Interleukin 1 of the central nervous system is produced by ameboid microglia. J. Exp. Med. 1986, 164, 594–604. [Google Scholar] [CrossRef]
  54. Ubogu, E.E.; Cossoy, M.B.; Ransohoff, R.M. The expression and function of chemokines involved in CNS inflammation. Trends Pharmacol. Sci. 2006, 27, 48–55. [Google Scholar] [CrossRef]
  55. Esen, N.; Kielian, T. Effects of low dose GM-CSF on microglial inflammatory profiles to diverse pathogen-associated molecular patterns (PAMPs). J. Neuroinflamm. 2007, 4, 10. [Google Scholar] [CrossRef]
  56. Lafrance, V.; Inoue, W.; Kan, B.; Luheshi, G.N. Leptin modulates cell morphology and cytokine release in microglia. Brain Behav. Immun. 2010, 24, 358–365. [Google Scholar] [CrossRef]
  57. Szczucinski, A.; Losy, J. Chemokines and chemokine receptors in multiple sclerosis. Potential targets for new therapies. Acta Neurol. Scand. 2007, 115, 137–146. [Google Scholar] [CrossRef]
  58. Sun, D.; Hu, X.; Liu, X.; Whitaker, J.N.; Walker, W.S. Expression of chemokine genes in rat glial cells: The effect of myelin basic protein-reactive encephalitogenic T cells. J. Neurosci. Res. 1997, 48, 192–200. [Google Scholar] [CrossRef]
  59. Peterson, P.K.; Hu, S.; Salak-Johnson, J.; Molitor, T.W.; Chao, C.C. Differential production of and migratory response to beta chemokines by human microglia and astrocytes. J. Infect. Dis. 1997, 175, 478–481. [Google Scholar] [CrossRef]
  60. Bruyere, C.; Mijatovic, T.; Lonez, C.; Spiegl-Kreinecker, S.; Berger, W.; Kast, R.E.; Ruysschaert, J.M.; Kiss, R.; Lefranc, F. Temozolomide-induced modification of the CXC chemokine network in experimental gliomas. Int. J. Oncol. 2011, 38, 1453–1464. [Google Scholar]
  61. Janabi, N.; Hau, I.; Tardieu, M. Negative feedback between prostaglandin and alpha- and beta-chemokine synthesis in human microglial cells and astrocytes. J. Immunol. 1999, 162, 1701–1706. [Google Scholar]
  62. Qian, L.; Wei, S.J.; Zhang, D.; Hu, X.; Xu, Z.; Wilson, B.; El-Benna, J.; Hong, J.S.; Flood, P.M. Potent anti-inflammatory and neuroprotective effects of TGF-beta1 are mediated through the inhibition of ERK and p47phox-Ser345 phosphorylation and translocation in microglia. J. Immunol. 2008, 181, 660–668. [Google Scholar]
  63. Polazzi, E.; Altamira, L.E.; Eleuteri, S.; Barbaro, R.; Casadio, C.; Contestabile, A.; Monti, B. Neuroprotection of microglial conditioned medium on 6-hydroxydopamine-induced neuronal death: Role of transforming growth factor beta-2. J. Neurochem. 2009, 110, 545–556. [Google Scholar] [CrossRef]
  64. Walker, D.G.; Kim, S.U.; McGeer, P.L. Complement and cytokine gene expression in cultured microglial derived from postmortem human brains. J. Neurosci. Res. 1995, 40, 478–493. [Google Scholar] [CrossRef]
  65. Chao, C.C.; Hu, S.; Sheng, W.S.; Tsang, M.; Peterson, P.K. Tumor necrosis factor-alpha mediates the release of bioactive transforming growth factor-beta in murine microglial cell cultures. Clin. Immunol. Immunopathol. 1995, 77, 358–365. [Google Scholar] [CrossRef]
  66. De Castro, C.; Parrilli, M.; Holst, O.; Molinaro, A. Microbe-associated molecular patterns in innate immunity: Extraction and chemical analysis of gram-negative bacterial lipopolysaccharides. Methods Enzymol. 2010, 480, 89–115. [Google Scholar] [CrossRef]
  67. Ransohoff, R.M.; Perry, V.H. Microglial physiology: Unique stimuli, specialized responses. Annu. Rev. Immunol. 2009, 27, 119–145. [Google Scholar] [CrossRef]
  68. Holst, O.; Ulmer, A.J.; Brade, H.; Flad, H.D.; Rietschel, E.T. Biochemistry and cell biology of bacterial endotoxins. FEMS Immunol. Med. Microbiol. 1996, 16, 83–104. [Google Scholar] [CrossRef]
  69. Slepko, N.; Minghetti, L.; Polazzi, E.; Nicolini, A.; Levi, G. Reorientation of prostanoid production accompanies “activation” of adult microglial cells in culture. J. Neurosci. Res. 1997, 49, 292–300. [Google Scholar] [CrossRef]
  70. Mayer, A.M.S.; Hall, M.L.; Walker, D.L. Inhibition of LPS-primed human brain microglia superoxide and thromboxane B2 generation by the marine Manzamines. Inflamm. Res. 2004, 53, 217. [Google Scholar] [CrossRef]
  71. Powell, J.L.; Strauss, K.A.; Wiley, C.; Zhan, M.; Morris, J.G., Jr. Inflammatory cytokine response to Vibrio vulnificus elicited by peripheral blood mononuclear cells from chronic alcohol users is associated with biomarkers of cellular oxidative stress. Infect. Immun. 2003, 71, 4212–4216. [Google Scholar] [CrossRef]
  72. Sharma, S.K. Endotoxin detection and elimination in biotechnology. Biotechnol. Appl. Biochem. 1986, 8, 5–22. [Google Scholar]
  73. Galanos, C.; Luderitz, O.; Westphal, O. A new method for the extraction of R lipopolysaccharides. Eur. J. Biochem. 1969, 9, 245–249. [Google Scholar] [CrossRef]

