Metabolic Discrimination of Select List Agents by Monitoring Cellular Responses in a Multianalyte Microphysiometer

Abstract
:1. Introduction
2. Results and Discussion
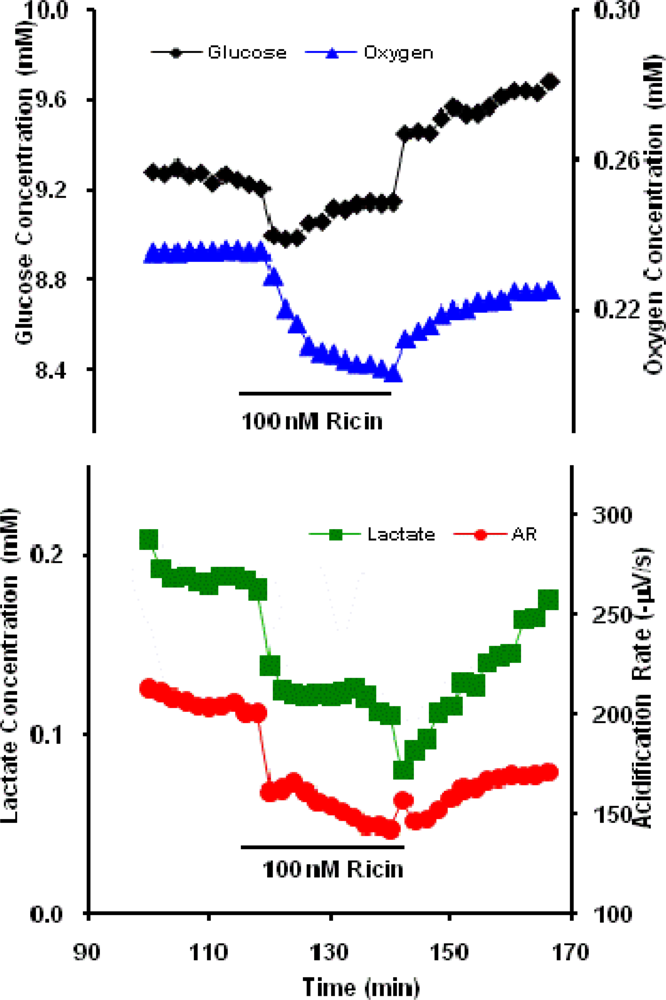
2.1 Ricin Toxin (RT)
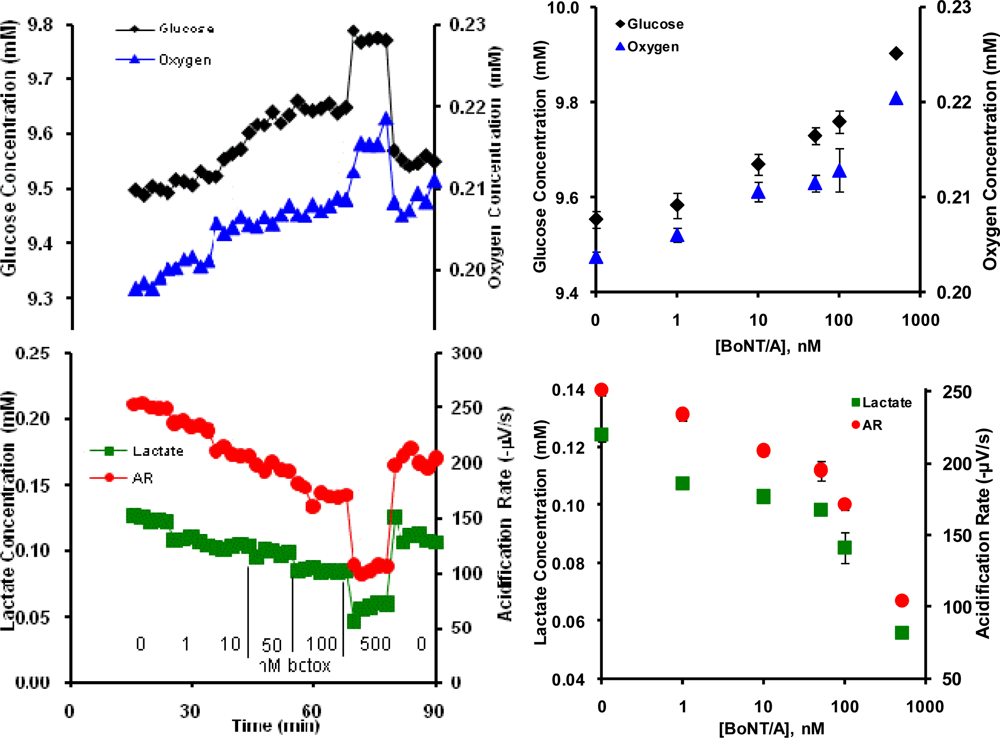
2.2. Botulinum Neurotoxin A (BoNT/A)
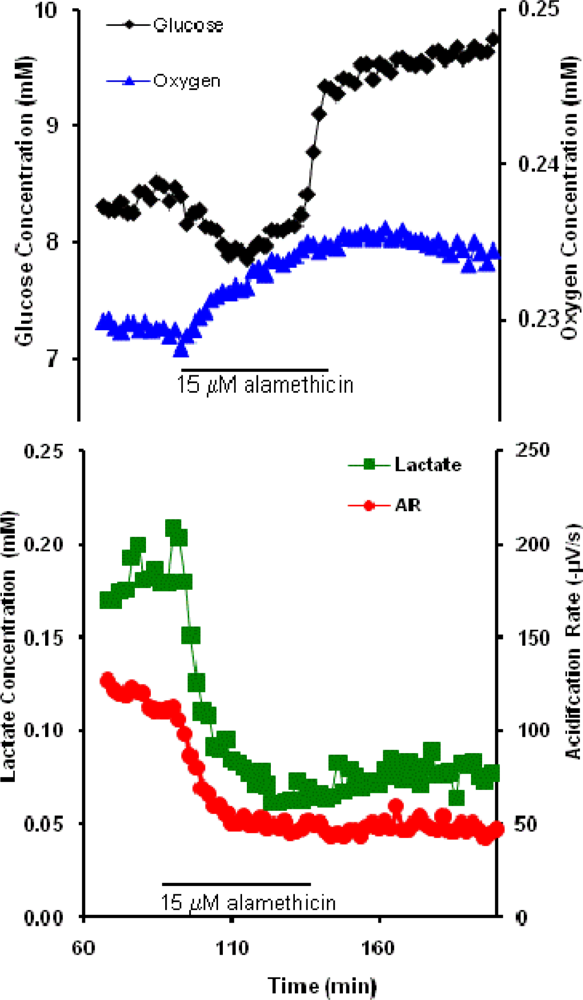
2.3. Alamethicin
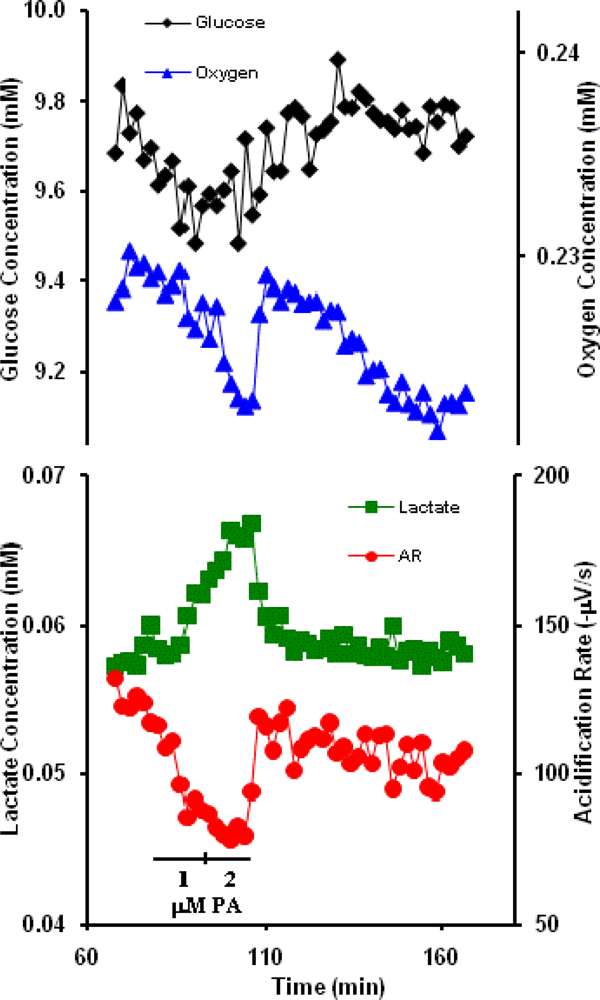
2.4 Anthrax Protective Antigen (PA)
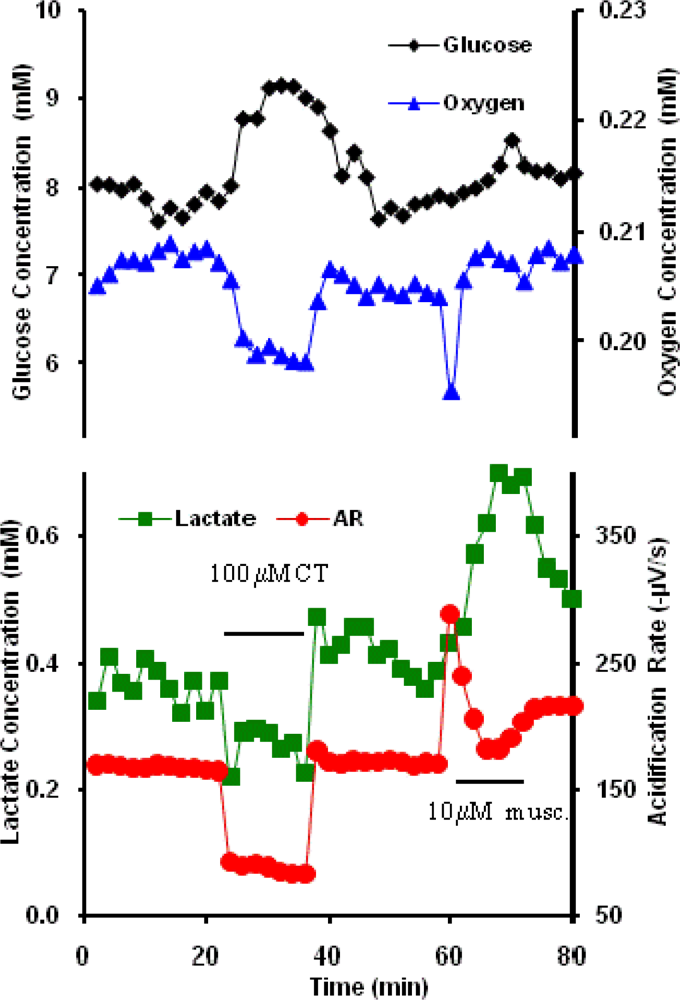
2.5. Cholera toxin and Muscarine
2.6 Discussion and Interpretation
3. Experimental Section
Materials and Reagents
Sensor Head Construction
Enzyme Solutions
Electrode Film Preparations
Electrochemical Measurements
Apparatus Operation
Data Interpretation
4. Conclusions
Acknowledgments
References and Notes
- Butcher, E.C. Innovation: Can cell systems biology rescue drug discovery? Nature Rev. Drug Discov 2005, 4, 461–467. [Google Scholar]
- Moore, K.; Rees, S. Cell-Based Versus Isolated Target Screening: How Lucky Do You Feel? J. Biomol. Screen 2001, 6, 69–74. [Google Scholar]
- Hodgson, J. ADMET - turning chemicals into drugs. Nat. Biotechnol 2001, 19, 722–726. [Google Scholar]
- Lesney, M.S. Assaying ADMET. Mod. Drug Discovery 2004, 7. [Google Scholar]
- McConnell, H.M.; Owicki, J.C.; Parce, J.W.; Miller, D.L.; Baxter, G.T.; Wada, H.G.; Pitchford, S. The Cytosensor Microphysiometer: biological applications of silicon technology. Science 1992, 257, 1906–1912. [Google Scholar]
- Owicki, J.C.; Bousse, L.J.; Hafeman, D.G.; Kirk, G.L.; Olson, J.D.; Wada, H.G.; Parce, J.W. The light-addressable potentiometric sensor: principles and biological applications. Annu. Rev. Biophys. Biomol. Struct 1994, 23, 87–113. [Google Scholar]
- Hafner, F. Cytosensor Microphysiometer: technology and recent applications. Biosens. Bioelectron 2000, 15, 149–158. [Google Scholar]
- Smart, D.; Coppell, A.; Rossant, C.; Hall, M.; McKnight, A.T. Characterization using microphysiometry of CRF receptor pharmacology. Eur. J. Pharmacol 1999, 379, 229–235. [Google Scholar]
- Coldwell, M.C.; Boyfield, I.; Brown, A.M.; Stemp, G.; Middlemiss, D.N. Pharmacological characterization of extracellular acidification rate responses in human D2(long), D3 and D4.4 receptors expressed in Chinese hamster ovary cells. Br. J. Pharmacol 1999, 127, 1135–1144. [Google Scholar]
- Landwojtowicz, E.; Nervi, P.; Seelig, A. Real-Time Monitoring of P-Glycoprotein Activation in Living Cells. Biochemistry 2002, 41, 8050–8057. [Google Scholar]
- Cao, C.J.; Mioduszewski, R.J.; Menking, D.E.; Valdes, J.J.; Cortes, V.I.; Eldefrawi, M.E.; Eldefrawi, A.T. Validation of the cytosensor for in vitro cytotoxicity studies. Toxicol. in Vitro 1997, 11, 285–293. [Google Scholar]
- Parak, W.J.; Dannohl, S.; George, M.; Schuler, M.K.; Schaumburger, J.; Gaub, H.E.; Muller, O.; Aicher, W.K. Metabolic activation stimulates acid production in synovial fibroblasts. J. Rheumatol 2000, 27, 2312–2322. [Google Scholar]
- Khare, S.; Gokulan, K.; Linthicum, D.S. Cellular responses of NG108-15 and SK-N-MC lines to sweet and bitter tastants as measured by extracellular acidification rates. J. Neurosci. Res 2001, 63, 64–71. [Google Scholar]
- May, L.T.; Lin, Y.; Sexton, P.M.; Christopoulos, A. Regulation of M2 muscarinic acetylcholine receptor expression and signaling by prolonged exposure to allosteric modulators. J. Pharmacol. Exp. Ther 2005, 312, 382–390. [Google Scholar]
- Mioduszewski, R.J.; Menking, D.E.; Valdes, J.J.; Cao, C.J.; Eldefrawi, M. E.; Eldefrawi, A.T. Cytotoxicity of organophosphate anticholinesterases to human liver and nerve cells. Proceedings of the ERDEC Scientific Conference on Chemical and Biological Defense Research, Aberdeen Proving Ground, MD, USA, Nov. 18–21, 1997; Berg, D.A., Ed.; National Technical Information Service: Springfield, VA; Aberdeen Proving Ground: MD, USA, 1997; pp. 77–83. [Google Scholar]
- Eklund, S.E.; Cliffel, D.E.; Kozlov, E.; Prokop, A.; Wikswo, J.; Baudenbacher, F. Modification of the Cytosensor microphysiometer to simultaneously measure extracellular acidification and oxygen consumption rates. Anal. Chim. Acta 2003, 496, 93–101. [Google Scholar]
- Eklund, S.E.; Taylor, D.E.; Kozlov, E.; Prokop, A.; Cliffel, D.E. A microphysiometer for simultaneous measurement of changes in extracellular glucose, lactate, oxygen, and acidification rate. Anal. Chem 2004, 76, 519–527. [Google Scholar]
- Endo, Y. Mechanism of action of ricin and related toxins on the inactivation of eukaryotic ribosomes. Cancer Treat. Res 1988, 37, 75–89. [Google Scholar]
- Lord, J.M.; Wales, R.; Pitcher, C.; Roberts, L.M. Cell surface and intracellular functions for galactose binding in ricin cytotoxicity. Biochem. Soc. Trans 1992, 20, 734–738. [Google Scholar]
- Keller, J.E.; Cai, F.; Neale, E.A. Uptake of botulinum neurotoxin into cultured neurons. Biochemistry 2004, 43, 526–532. [Google Scholar]
- Purkiss, J.R.; Friis, L.M.; Doward, S.; Quinn, C.P. Clostridium botulinum neurotoxins act with a wide range of potencies on SH-SY5Y human neuroblastoma cells. NeuroToxicology 2001, 22, 447–453. [Google Scholar]
- Rossetto, O.; Deloyle, F.; Poulain, B.; Pellizzari, R.; Schiavo, G.; Montecucco, C. The metallo-proteinase activity of tetanus and botulism neurotoxins. J. Physiol. (Paris) 1995, 89(1), 43–50. [Google Scholar]
- Blasi, J.; Chapman, E.; Link, E.; Binz, T.; Yamasaki, S.; De Camilli, P.; Sudhof, T.C.; Niemann, H.; Jahn, R. Botulinum neurotoxin A selectively cleaves the synaptic protein SNAP-25. Nature 1993, 365, 160–163. [Google Scholar]
- Tieleman, D.P.; Hess, B.; Sansom, M.S.P. Analysis and evaluation of channel models: simulations of alamethicin. Biophys. J 2002, 83, 2393–2407. [Google Scholar]
- Ritov, V.B.; Tverdislova, I.L.; Avakyan, T.Y.; Menshikova, V.; Leikin, Y.N.; Bratkovskaya, L.B.; Shimon, R.G. Alamethicin-induced pore formation in biological membranes. Gen. Physiol. Biophys 1992, 11, 49–58. [Google Scholar]
- Bradley, K.A.; Mogridge, J.; Mourez, M.; Collier, R.J.; Young, J.A.T. Identifcation of the cellular receptor for anthrax toxin. Nature 2001, 414, 225–229. [Google Scholar]
- Merritt, E.A.; Sarfaty, S.; Van Den Akker, F.; L’hoir, C.; Martial, J.A.; G.J. Hol, W. Crystal structure of cholera toxin B-pentamer bound to receptor GMl pentasaccharide. Protein Sci 1994, 3, 166–175. [Google Scholar]
- Cassel, D.; Pfeuffer, T. Mechanism of cholera toxin action: covalent modification of the guanyl nucleotide-binding protein of the adenylate cyclase system. Proc. Natl. Acad. Sci. USA 1978, 75, 2669–2673. [Google Scholar]
- Moss, J.; Vaughan, M. Activation of adenylate cyclase by choleragen. Annu. Rev. Biochem 1979, 48, 581–600. [Google Scholar]
- Gill, D.M.; Meren, R. ADP-robosylation of membraneproteins catalyzed by cholera toxin: basis of the activation of adenylate cyclase. Proc. Natl. Acad. Sci. USA 1978, 75, 3050–3054. [Google Scholar]
- Hansen, G.H.; Dalskov, S.-M.; Rasmussen, C.R.; Immerdal, L.; Niels-Christiansen, L.-L.; Danielsen, E.M. Cholera toxin entry into pig enterocytes occurs via a lipid raft- and clathrin-dependent mechanism. Biochemistry 2005, 44, 873–882. [Google Scholar]
- Prapong, T.; Uemura, E.; Hsu, W.H. G Protein and cAMP-Dependent Protein Kinase Mediate Amyloid b-Peptide Inhibition of Neuronal Glucose Uptake. Exp. Neurol 2001, 167, 59–64. [Google Scholar]
- McMahon, R.J.; Frost, S.C. Glycogen: a carbohydrate source for GLUT-1 glycosylation during glucose deprivation of 3T3-L1 adipocytes. Am. J. Physiol 1996, 270, E640–E645. [Google Scholar]
- Granger, D.N.; Kvietys, P.R.; Perry, M.A.; Taylor, A.E. Relationship between intestinal volume secretion and oxygen uptake. Dig. Dis. Sci 1982, 27, 42–48. [Google Scholar]
- Peterson, J.W.; Jackson, C.A.; Reitmeyer, J.C. Synthesis of prostaglandins in cholera toxin-treated CHO cells. Microb. Pathog 1990, 9, 345–353. [Google Scholar]
- Guerrant, R.L.; Fang, G.D.; Thielman, N.M.; Fonteles, M.C. Role of Platelet Activating Factor in the intestinal epithelial secretory and chinese hamster ovary cell cytoskeletal responses to cholera toxin. Proc. Natl. Acad. Sci. USA 1994, 91, 9655–9658. [Google Scholar]
- Hsie, A.W.; Jones, C.; Puck, T.T. Further changes in differentiation state accompanying the conversion of chinese hamster cells to fibroblastic form by dibutyryl adenosine cyclic 3’:5’-monophosphate and hormones. Proc. Natl. Acad. Sci. USA 1971, 68, 1648–1652. [Google Scholar]
- Bymaster, F.P.; Calligaro, D.O.; Falcone, J.F. Arachidonic acid release in cell lines transfected with muscarinic receptors: a simple functional assay to determine response of agonists. Cellular Signalling 1999, 11, 405–413. [Google Scholar]
- Cao, C.J. Cytotoxicity of organophosphate anticholinesterases. In Vitro Cell. Dev. Biol. -Animal 1999, 35, 493–500. [Google Scholar]
- Eklund, S.E.; Snider, R.M.; Wikswo, J.P.; Baudenbacher, F.J.; Prokop, A.; Cliffel, D.E. Multianalyte Microphysiometry as a tool in metabolomics and systems biology. J. Electroanal. Chem 2006, 587, 333–339. [Google Scholar]
- Eklund, S.E.; Kozlov, E.; Taylor, D.E.; Baudenbacher, F.; Cliffel, D.E. Real-time cell dynamics with a multianalyte physiometer. Methods Mol. Biol 2005, 303, (NanoBiotechnology Protocols),. 209–223. [Google Scholar]
- Jin, L.T.; Jin, P.; Ye, J.N.; Fang, Y.Z. Determination of dissolved oxygen by catalytic reduction on Nafion-methyl viologen chemically modified electrode. Talanta 1992, 39, 145–147. [Google Scholar]
- Walder, B.; Lauber, R.; Zbinden, A.M. Accuracy and cross-sensitivity of 10 different anesthetic gas monitors. J. Clin. Monit 1993, 9, 364–373. [Google Scholar]


© 2009 by the authors; licensee MDPI, Basel, Switzerland This article is an open-access article distributed under the terms and conditions of the Creative Commons Attribution license (http://creativecommons.org/licenses/by/3.0/).
Share and Cite
Eklund, S.E.; Thompson, R.G.; Snider, R.M.; Carney, C.K.; Wright, D.W.; Wikswo, J.; Cliffel, D.E. Metabolic Discrimination of Select List Agents by Monitoring Cellular Responses in a Multianalyte Microphysiometer. Sensors 2009, 9, 2117-2133. https://doi.org/10.3390/s90302117
Eklund SE, Thompson RG, Snider RM, Carney CK, Wright DW, Wikswo J, Cliffel DE. Metabolic Discrimination of Select List Agents by Monitoring Cellular Responses in a Multianalyte Microphysiometer. Sensors. 2009; 9(3):2117-2133. https://doi.org/10.3390/s90302117
Chicago/Turabian StyleEklund, Sven E., Roy G. Thompson, Rachel M. Snider, Clare K. Carney, David W. Wright, John Wikswo, and David E. Cliffel. 2009. "Metabolic Discrimination of Select List Agents by Monitoring Cellular Responses in a Multianalyte Microphysiometer" Sensors 9, no. 3: 2117-2133. https://doi.org/10.3390/s90302117