Article

Determination of DPPH Radical Oxidation Caused by Methanolic Extracts of Some Microalgal Species by Linear Regression Analysis of Spectrophotometric Measurements

1
Forschungs- und Technologiezentrum Westküste der Universität Kiel, Hafentörn 1, 25761 Büsum, Germany
2
BlueBioTech GmbH, Hafentörn 1, 25761 Büsum, Germany
3
Zentrum für Biochemie und Molekularbiologie der Universität Kiel, Leibnizstraße 11, 24098 Kiel, Germany
*
Author to whom correspondence should be addressed.
Sensors 2007, 7(10), 2080-2095; https://doi.org/10.3390/s7102080
Submission received: 20 June 2007 / Accepted: 1 October 2007 / Published: 3 October 2007
(This article belongs to the Special Issue Physiological Sensing)

Abstract

:
The demonstrated modified spectrophotometric method makes use of the 2,2-diphenyl-1-picrylhydrazyl (DPPH) radical and its specific absorbance properties. The absorbance decreases when the radical is reduced by antioxidants. In contrast to other investigations, the absorbance was measured at a wavelength of 550 nm. This wavelength enabled the measurements of the stable free DPPH radical without interference from microalgal pigments. This approach was applied to methanolic microalgae extracts for two different DPPH concentrations. The changes in absorbance measured vs. the concentration of the methanolic extract resulted in curves with a linear decrease ending in a saturation region. Linear regression analysis of the linear part of DPPH reduction versus extract concentration enabled the determination of the microalgae's methanolic extracts antioxidative potentials which was independent to the employed DPPH concentrations. The resulting slopes showed significant differences (6 - 34 μmol DPPH g−1 extract concentration) between the single different species of microalgae (Anabaena sp., Isochrysis galbana, Phaeodactylum tricornutum, Porphyridium purpureum, Synechocystis sp. PCC6803) in their ability to reduce the DPPH radical. The independency of the signal on the DPPH concentration is a valuable advantage over the determination of the EC50 value.

1. Introduction

In oxygen involving metabolisms like photorespiration and photosynthesis, reactive oxygen species (ROS) are natural byproducts (He and Häder 2002, Apel and Hirt 2004) in phototrophic microorganisms. Typical ROS are e.g. superoxide, hydroxyl, peroxyl, and alkoxy radicals. Under non-stressed conditions, production and scavenging of ROS in these microorganisms is in equilibrium (Apel and Hirt 2004).
Different environmental stress factors like pollution, drought, temperature, excessive light intensities, and nutritional limitation are able to increase the production of ROS ( Ehling-Schulz and Scherer 1999, Rijstenbil 2002, Arora et al. 2002). Oxidative stress is closely associated to these unstable but very reactive radicals ( Fang et al. 2002). Their highly reactive potential is discussed to be responsible for some human diseases e.g. cancer and cardiovascular diseases and is able to cause oxidative damages to proteins, DNA, and lipids (Jacobi and Burri, 1996) in both humans and microorganisms.
Microalgae have to counteract these negative effects by diverse effective enzymatic and nonenzymatic mechanisms (Apel and Hirt, 2004). Several enzymes like superoxide dismutase, catalase peroxidase are able to scavenge ROS (Blokhina et al. 2003). Carotenoids and fatty acids are two examples for non-enzymatic classes of substances which are able to protect the organism from oxidative damage ( Sies and Stahl, 1995). Tocopherol, flavonoids, and alkaloids are other examples for substances belonging to this group of non-enzymatic substances.
Two major but different mechanisms are known ( Prior et al. 2005): Both mechanisms lead to a reduction of the radicals but differ in kinetics and propensity for side reactions ( Prior et al. 2005). For hydrogen atom transfer, the antioxidants quench the free radicals by donating a hydrogen whereas for single electron transfer the antioxidants transfer one electron to the radical.
For estimating the antioxidative potential of chemical components, different experimental approaches were used ( Prior et al. 2005). Most of them require a spectrophotometric measurement and a certain reaction time in order to obtain reproducible results ( Kulisic et al. 2004).
For example, the β-carotene bleaching test (BCB) is based on the decolorization of β-carotene by its reaction with radicals. This effect is measured at a wavelength of 470 nm after a reaction time of nearly 120 min. Other methods like the 2,2-diphenyl-1-picrylhydrazyl (DPPH) radical scavenging method or the thiobarbituric acids reactive species (TBARS) assay work similar to the BCB test.
The TBARS assay uses the production of a pink pigment produced by the reaction of thiobarbituric acid (TBA) with malondialdehyd (MDA) and other secondary lipid peroxidation products ( Kulisic et al. 2004). Absorbance measurements at 532 nm serve as an indicator of the extent of lipid degradation.
The use of DPPH for a radical scavenging measuring method is described e.g. by Yen and Duh (1994), Yordanov and Christova (1997), Masuda et al. (1999), Anderson and Padhye (2004), and Iwashima et al. (2005). DPPH is a stable free radical in a methanolic solution. In its oxidized form, the DPPH radical has an absorbance maximum centered at about 520 nm (Molyneux, 2004). The DPPH method is described as a simple, rapid and convenient method independent of sample polarity for screening of many samples for radical scavenging activity (Koleva et al. 2001). These advantages make the DPPH method interesting for testing microalgae as a natural source to scavenge radicals and to find out promising candidates for a commercial sense.
Usually, the DPPH absorbance is measured at a wavelength of 515 - 520 nm (Bandoniene et al. 2002, Pavlov et al. 2002, Gazi et al. 2004). But here, demonstrated in Figure 1, an applied modification of this DPPH-method is described enabling the measurement of the antioxidative potential of the microalgae's specific methanolic extracts.
The use of methanol as extract solvent restrict the cellular compounds responsible for scavenge the DPPH radical. Only methanolic soluble substances (like e.g. carotenoids, fatty acids) are involved in this scavenging process. Carotenoids and fatty acids are known to posses antioxidative properties ( Di Mascio et al. 1991, Kobayashi et al. 1997, Fang et al. 2002).
For example methanolic soluble β-carotene one of the best studied carotenoids is able to quench singlet oxygen (1O2*) via electron energy transfer. The carotenoid itself changes from the ground state to a triplet state. After electron exchange the carotenoid triplet state (3CAR*) can return to the ground state by dissipating the energy as heat. This quenching reaction is the principal mechanism of carotenoid photoprotection against 1O2* (Krinsky 1994, Edge et al. 1997) and used as subject for many research activities (Bendich and Olson 1989, Sies and Stahl 1995, Miller et al. 1996, Paiva and Russell 1999, Naguib 2000, Pinchuk and Lichtenberg 2002).
These properties make microalgae and their intracellular substances interesting for business applications (Margalith 1999, Eonseon et al. 2003, Pulz and Gross 2004, Spolaore et al. 2006). The demonstrated modified DPPH-method enables therefore the screening of microalgae as promising candidates in a commercial sense. Furthermore, the modified method can be used, e.g. if the aim of future investigations is the detection of the antioxidative potential of some microalgae influenced by different environmental parameters.

2. Materials and methods

2.1. Microalgae and cultivation conditions

Two cyanophyceae (Synechocystis sp. PCC6803, Anabaena sp.), one rodophyceae (Porphyridium purpureum) and haptophyceae (Isochrysis galbana) and bacillariophyceae (Phaeodactylum tricornutum) were tested. Isochrysis galbana, Porphyridium purpureum, Phaeodactylum tricornutum were grown in artificial seawater (Tropic Marin, TAGIS, Germany) enriched with F/2 medium nutrients ( Guillard and Ryther 1962) at 24 °C with a constant pH-value of the cultures at 8.3. Anabaena sp. and Synechocystis sp. PCC6803 were grown at 26 °C in BG-11 medium (Rippka et al. 1979) with a constant pH-value of 8.0. Each culture was grown at a constant light regime of 120 μmol photons m−2 s−1. The pH-values were kept constant by automatic addition of pure CO2. At the end of the cultivation, the cultures were centrifuged, freeze-dried and stored at -20 °C.

2.2 Preparation of the methanolic extract

The protocol of Bandoniene et al. (2002) with minor modifications was used for the preparation of the methanolic extracts. Samples of the freeze-dried microalgae were portioned in aliquots of 0.025 - 1 g. Each of these aliquots was homogenized in 5 mL of 100 % methanol (instead of 80 % methanol) for 30 s on ice with an ULTRA-TURRAX T25 (IKA-Labortechnik, Staufen, Germany). Afterwards, the homogenates were injected through 0.2 μm PTFE-filter (instead of paper filter) into test tubes. The extracts with different biomass concentrations were used for the determination of the antioxidant properties.

2.3 Spectrophotometric measurements
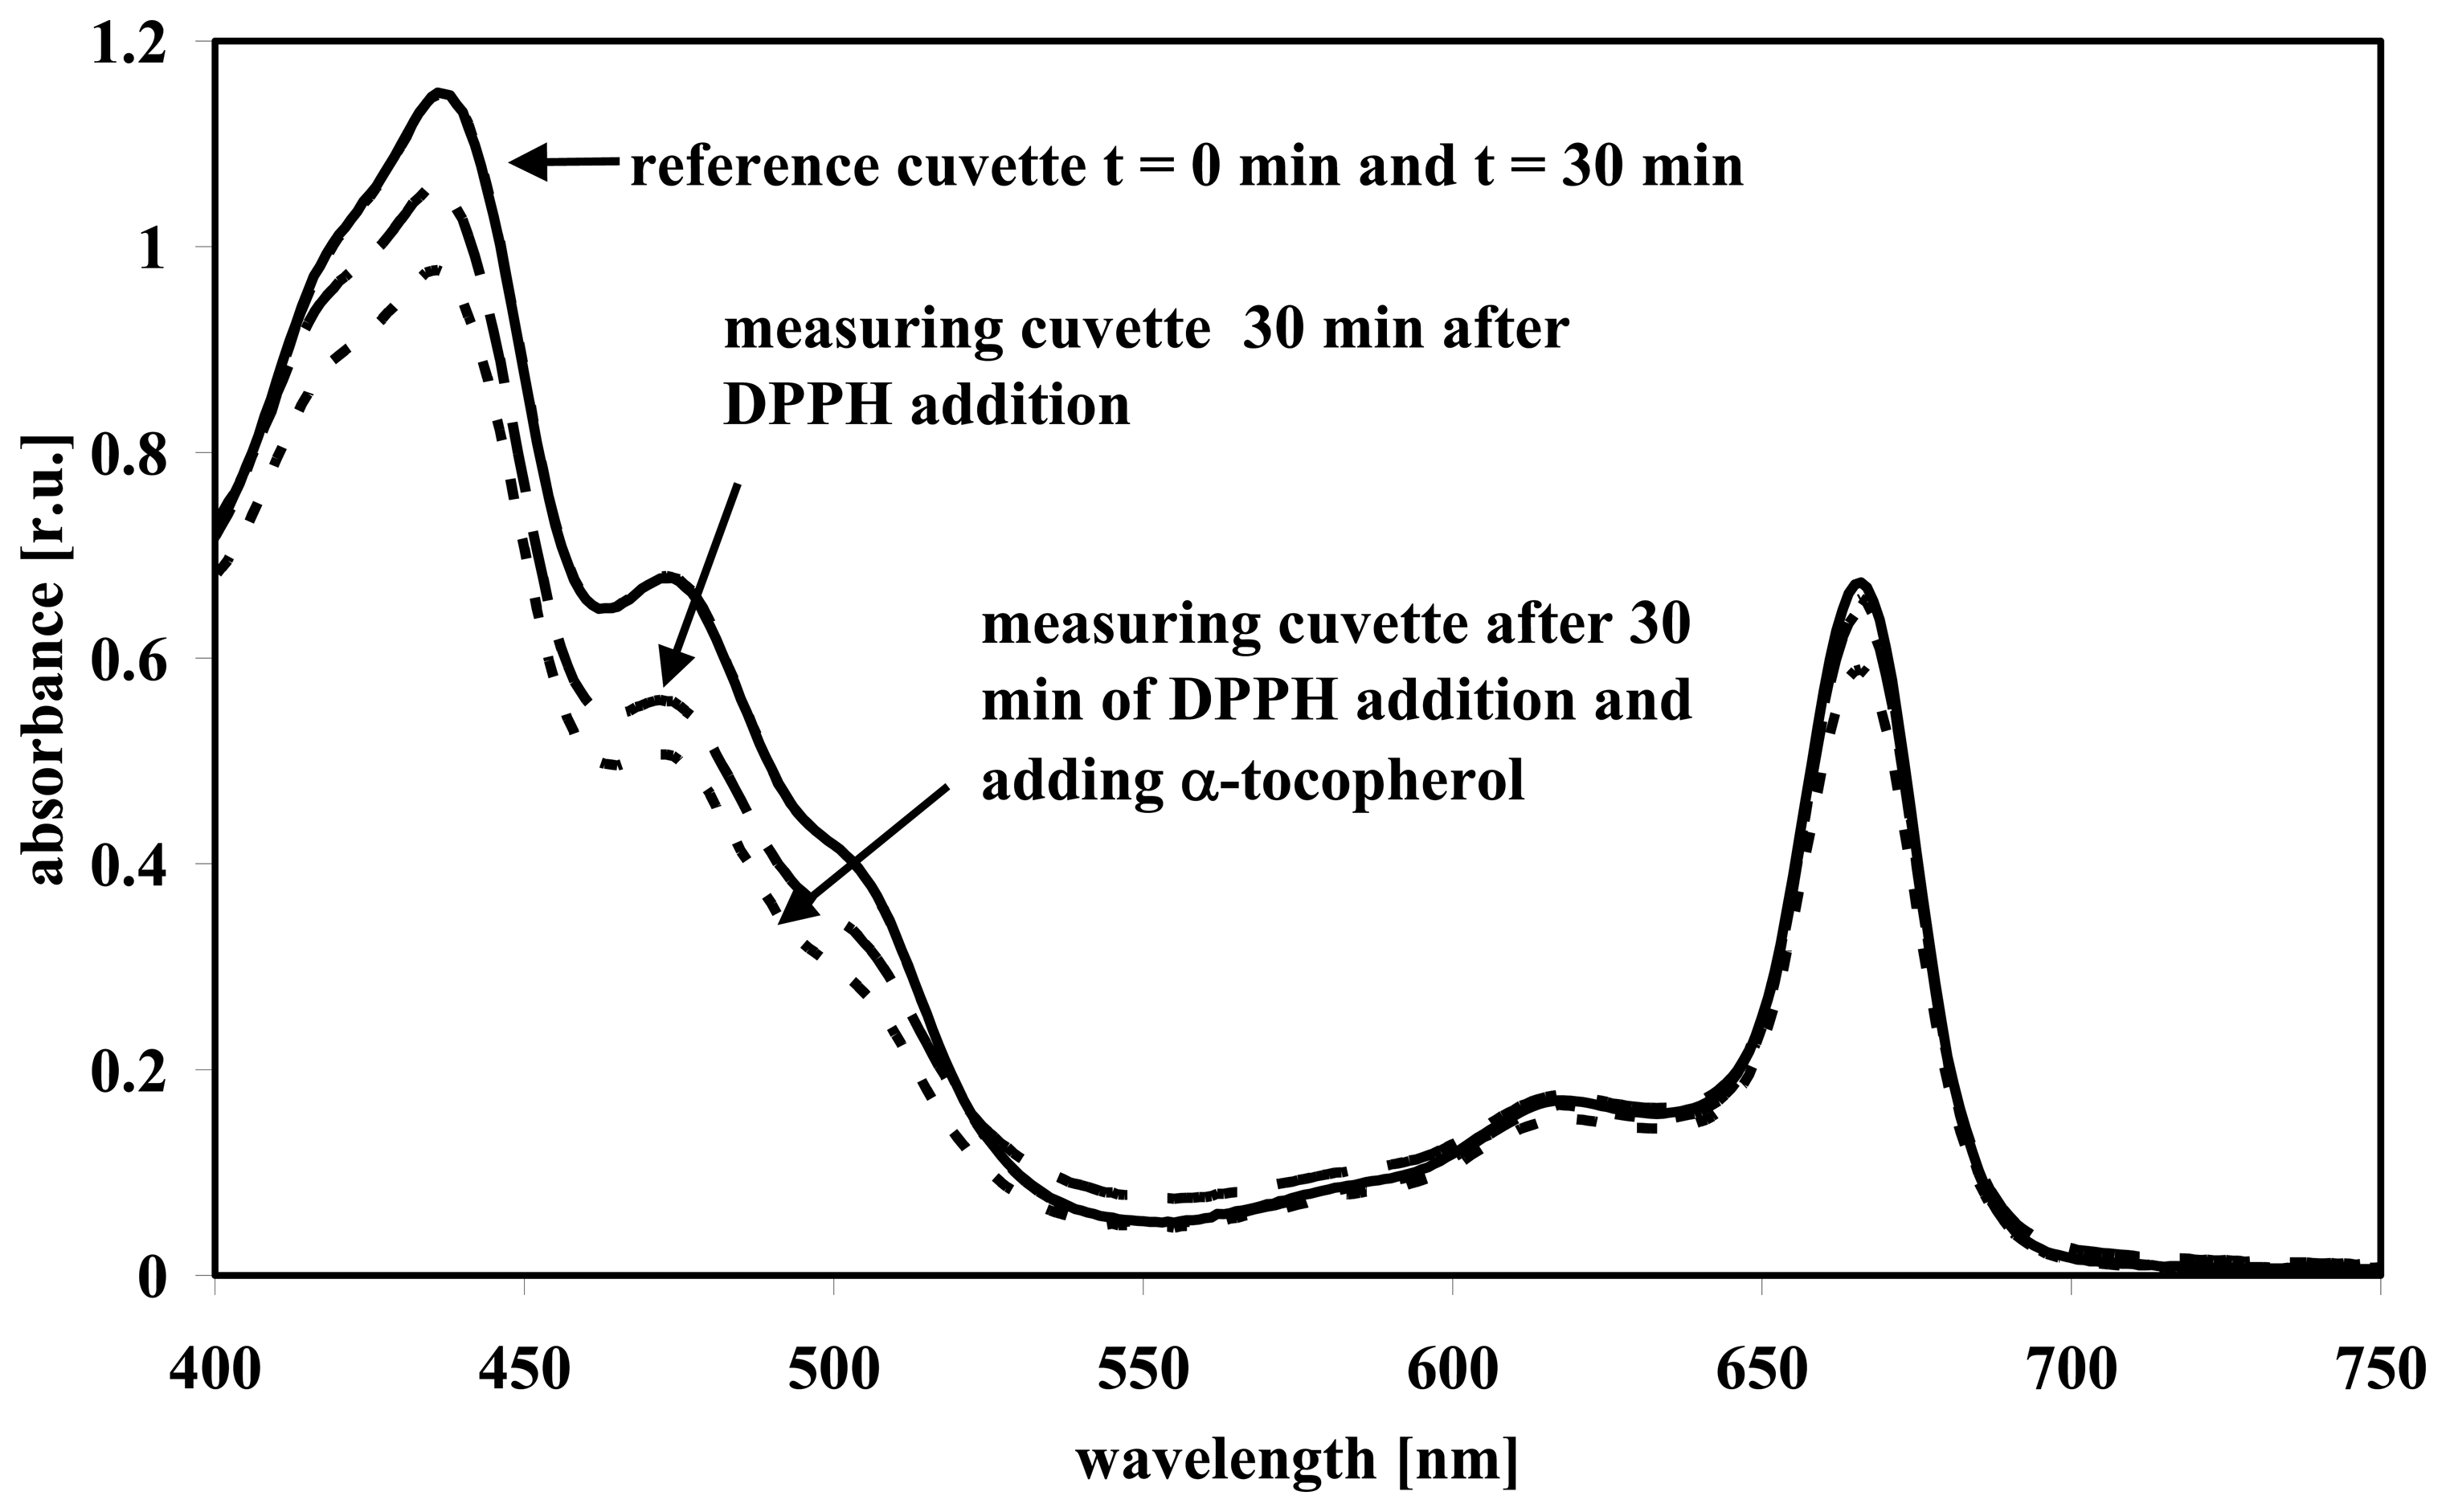
Wavelength scans from 400 to 750 nm and the decrease in absorbance at 550 nm were measured with a dual-beam UV-VIS spectrophotometer (Uvikon XL, Bio-Tek Instruments, Bad Friedrichshall, Germany). A550 as used in Equation (1) below was obtained by switching the spectrophotometer modus from a wavelength scan to a fixed wavelength modus.
DPPH radical. DPPH was obtained from Fluka (Buchs, Switzerland). 2.5 mg DPPH were solved in 5 mL methanol (≈ 1.27 mmol L−1). This stock solution was daily prepared, used for the measurements, and kept in the dark at ambient temperature when not used. Using this stock solution enables the measurement of a calibration curve at 550 nm for calculating the DPPH concentration as follows
c DPPH [ μ mol L 1 ] = 143.06 A 550
with a correlation coefficient (R2) of 0.999.

2.4 α-Tocopherol

α-Tocopherol was obtained from Fluka (Buchs, Switzerland). α-Tocopherol is an effective antioxidant ( Vaya and Aviram 2001). 25 mg α-tocopherol was solved in 100 mL methanol (≈ 0.58 mmol L−1). The solution was used for a calibration curve of DPPH reduction and as a chemical reference in comparison to the antioxidant capacities of the microalgae extracts.

2.5 Preparation of reference and measuring cuvette

2.25 mL methanol, 0.1 mL extract and 0.15 mL DPPH stock solution (resulting in a DPPH concentration of 76 μmol L−1) were mixed in one measuring cuvette. Furthermore, the extracts were measured with a second measuring cuvette containing 2.325 mL methanol, 0.1 mL extract and 0.075 mL DPPH stock solution (resulting in a DPPH concentration of 38 μmol L−1) for verification of the data obtained with the higher DPPH concentration. Additionally a reference cuvette filled with 2.4 mL methanol and 0.1 mL extract was used.

2.6 Experimental protocol
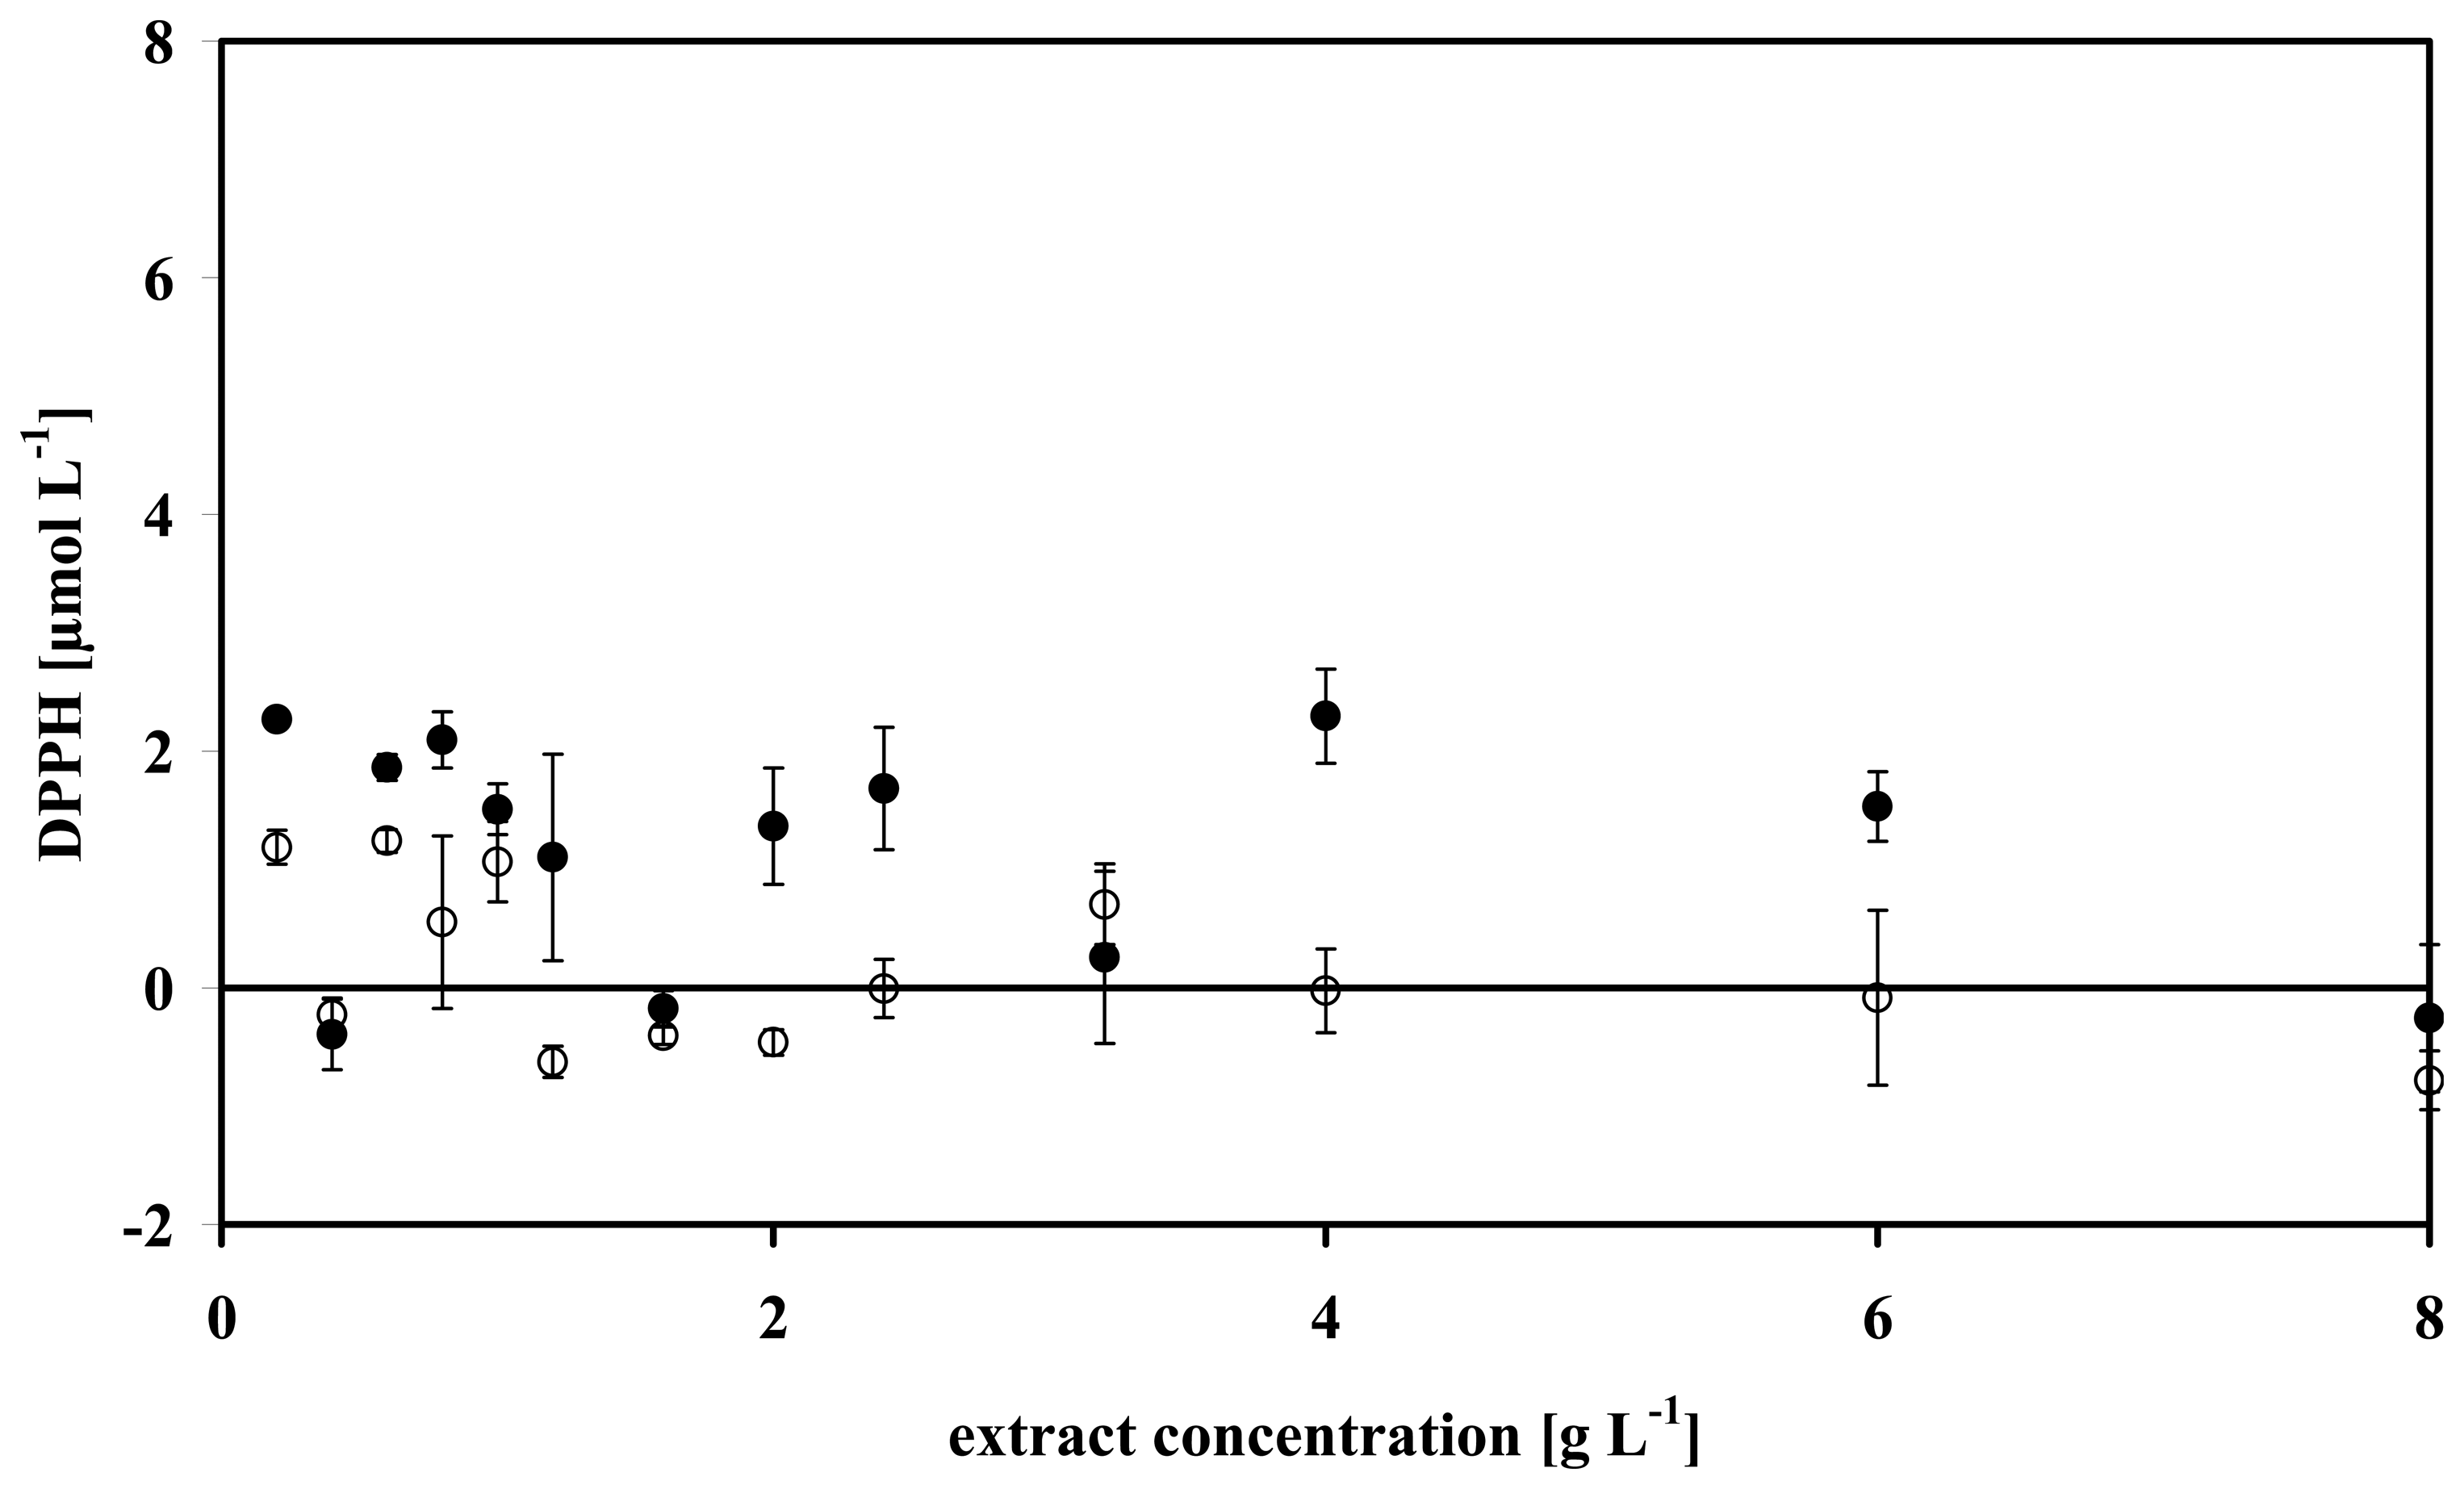
For a proper measurement of the antioxidative potential of the tested microalgae using the DPPH radical, the following procedure was successfully executed. For choosing the suitable wavelength, wavelength scans from 440 to 750 nm were done for both measuring and reference cuvette. The scans were run against pure methanol. Measurements in the measuring cuvette were performed 30 min after addition of DPPH in order to give enough time for the reaction of the cellular antioxidants with DPPH. During this 30 min, reference and measuring cuvette were kept in the dark at ambient temperature. Additionally, the reference cuvette was measured before and after the reaction in the measuring cuvette had taken place for verification that no changes of the absorptive properties of the microalgae extract had occurred in the absence of DPPH.
After wavelength scans were done (3 min) 0.3 mL of the α-tocopherol solution was added to both measuring and reference cuvette in order to achieve full reduction of the DPPH radicals. Then, the wavelength scans were repeated. This served to select an adequate wavelength which is influenced only by the DPPH radical (here 550 nm).
The absorbance decrease was then measured by using measuring and reference cuvette prepared and treated in the same way described above. But here the absorbance of the measuring cuvette was measured at 550 nm against the reference cuvette for elimination of the absorptive properties of the microalgae extract.
All measurements were performed in triplicate. Here, averages and standard deviations are presented.

2.7 Data analysis

The linear range of the absorbance decrease (see Figure 2, below) was evaluated by means of a simple linear regression
c DPPH = c DPPH , 0 + a 1 c E
with cDPPH obtained from Equation (1), cDPPH,0 is the concentration added to the cuvette, cE the concentration of the microalgae extract. The slope a1 is determined by linear regression of graphs like those in Figure 2, below. The slope is used as a parameter for estimating the antioxidative potential of the investigated microalgae.

2.8 Determination of the effective concentration (EC50)

The EC50 value expresses the amount of microalgae extract necessary to decrease the absorbance of DPPH by 50 % (Antolovich et al. 2002). The value can be determined graphically by plotting the absorbance against the used extract concentration or calculated by using the slope of the linear regression (Equation (2)).

3. Results and discussion

3.1 Wavelength scans

Wavelength scans from all extracts were measured. In Figure 1 wavelength scans of reference and measuring cuvette of methanolic extracts of Synechocystis sp. PCC6803 are shown. Whereas the signal from the reference cuvette remained constant in the time between the two measurements at 0 and 30 min (coincident curves in Figure 1) the measuring cuvette showed an absorbance decrease below 530 nm after 30 min of DPPH addition. After adding α-tocopherol to this cuvette, the decrease continued. In contrast to results below 530 nm, the absorbance measured at 550 nm obtained the same value in the measuring cuvette after adding α-tocopherol (Figure 1) as the absorbance measured in the reference cuvette. Furthermore, the absorbance had a minimum at this wavelength. The absorbance decrease below 530 nm in the measuring cuvette in the presence of α-tocopherol was not representative for all extracts but showed possible interference of antioxidants and DPPH radical. Nevertheless, for all tested extracts a minimum occurred near 550 nm, and same values were obtained in the measuring and in the reference cuvette at 550 nm after adding α-tocopherol (data not shown). Therefore, 550 nm was selected as the most adequate wavelength for testing all microalgae extracts. By means of the experiments present in Figure 1, the most suitable wavelength was determined (here 550 nm). According to the results presented there, absorbance changes at this wavelength reflect the chemical state of the DPPH radicals (oxidized or reduced state). Therefore this wavelength enables a straight-forward analysis and interpretation of the measured absorbance decrease.
For its function as a measure of antioxidant potential, absorbance at the selected wavelength should be mainly influenced by the DPPH radical and not by interference as caused by antioxidants (Bondet et al. 1997), e.g. carotenoids and polyunsaturated fatty acids (PUFAs). This problem is illustrated in Figure 1. Wavelength signals below 530 nm are strongly influenced by carotenoids ( Britton 1995). This could lead to a misinterpretation of the measured absorbance decrease when a wavelength is chosen which is influenced by both DPPH radical and the absorptive properties of the extract (as by carotenoids).
A major part of this kind of interference can be eliminated by running the absorbance measurement against a reference cuvette filled with the same extract concentration as in the measuring cuvette.

3.2 Absorbance measurements

The absorbance measurements for all five microalgae were done by the same protocol. Below, in Figures 2, 3, 4 and 5, representative records for two microalgae are shown. The good signal-noise ratio for all measurements enables a straight-forward interpretation of the data.
Absorbance measurements were done at two concentrations of DPPH. In Figure 2, both curves obtained from Synechocystis sp. PCC6803 start with linear, parallel decreases at low extract concentration and end up in horizontal lines. The lower curve approaches values close to zero at approximately 3 g L−1 extract concentration. The upper curve saturates at 20 μmol L−1 DPPH concentration.
Adding α-tocopherol after the DPPH measurements indicate that the remaining DPPH radicals are responsible for the remaining absorbance in Figure 2. Figure 3 displays the effect of α-tocopherol on the absorbance measurements at 550 nm for Synechocystis sp. PCC6803. The addition of the vitamin causes a nearly complete decrease of the absorbance to values close to zero. Since this occurs for all extract concentrations it becomes evident that the remaining signal in the absorbance decrease in Figure 2 is due to DPPH radicals not reduced by the extract concentrations of Synechocystis sp. PCC6803.
Figure 4 and Figure 5 present results obtained from Isochrysis galbana. Similar to the measurements of Synechocystis sp. PCC 6803, the measurements at low and high DPPH concentrations in Figure 4 show also a linear, parallel decrease at low extract concentrations. Again, the curves obtained at both DPPH concentrations saturate at higher extract concentrations. However, in contrast to the upper curve in Figure 2, the upper curve in Figure 4 reaches values near zero. Again, adding α-tocopherol shows that the remaining absorbance in Figure 4 is due to unreduced DPPH radicals, as it decreases the absorbance to values close to zero (Figure 5).
Employing extraction by methanol imposes some caveats with respect to extract concentration and kind of antioxidants. Figures 2 and 4 shows saturation of the absorbance decrease when plotted vs. extract concentration. This saturation can be explained by the limited capacity of methanol to extract the antioxidants from the aliquots of the freeze-dried microalgae. With both DPPH concentrations, the similar amounts of DPPH were oxidised in dependence of biomass concentration. The same decrease in the saturating region indicated that only the amount of antioxidants which were extracted (and not what was in the aliquots) were measured by this procedure. This effect leads to the assumption that the used volume of methanol is not able to extract the complete content of carotenoids and PUFAs from the investigated microalgae samples. This explanation is supported by the effect of α-tocopherol on the absorbance measurements.
Figure 3 and Figure 5 show that the remaining absorbance in Figures 2 and 4 is due to remaining DPPH radicals, because they all can be converted to their reduced form by adding α-tocopherol. This is indicated by the fact that absorbance at 550 nm reaches values close to zero.
In the first place, the results of Figures 2 and 4 demonstrate a valuable benefit of the method: The slope in Figures 2 and 4 is a direct measure of the antioxidative potential of the investigated sample of microalgae. Thus, this slope yields a useful tool for the direct comparison of different extracts with respect to their antioxidant potential. The determination of the slope is independent from the selected wavelength. The slope can also be calculated when a different wavelength is employed, which may be more suitable for other microalgae or chemicals. The slope offers the possibility for direct comparison of microalgal antioxidative potential. A further very important result of Figures 2 and 4 is the independence of the slope on DPPH concentration. This provides an important advantage over the interpretation of the antioxidative capacity based on the EC50 value (Table 1).
On the other hand, the non-linearity as caused by limited methanol capacity imposes the caveat that the biomass concentration should not be too high, i.e., not exceeding the linear part in Figures 2 and 4. In order to make sure that the linear part is not exceeded the experiment should be repeated with different biomass concentrations. Then the linear part can be evaluated by linear regression.
The other caveat arises from the feature that methanolic extraction excludes the detection of the antioxidative potential of water soluble antioxidative substances, e.g. ascorbat, gluthathion, phycocyanin ( Romay et al. 1998). Because of the freeze-dried status of the microalgal samples and the use of methanol as extracting agent mainly the carotenoids and fatty acids are the most likely candidates causing the decrease of DPPH absorbance (Figures 2 and 4, containing the linear regressions by using Equation (2)). Methanolic soluble microalgal compounds like carotenoids and PUFAs as well as some proteins are known to exhibit antioxidative potential ( Fang et al. 2002). Nevertheless, due to the non-specifity of the methanolic extract for one of the two compound classes (carotenoids and PUFAs) it is not possible to find out which substances of each microalgae are responsible for the absorbance decrease of the DPPH solution. This requires further investigations.

3.3 Theoretical background

Describing the reaction of DPPH with the antioxidant as a bimolecular reaction leads to
[ DPPH ] OX + [ A ] RED k 1 k 1 [ DPPH ] RED + [ A ] Ox
with [DPPH] OX is the amount of used DPPH radicals still in an oxidized state, AOX is the amount of antioxidants oxidized by DPPH, [A] RED is the remaining amount of reduced antioxidants in the extracts, DPPHRED is the amount of reduced DPPH radicals, and k1 and k-1 are rate constants. With
A RED + A OX = A SOL and DPPH RED + DPPH OX = DPPH T
where ASOL is the amount of antioxidants initially extracted from the algae and DPPHT is the total amount of added DPPH radicals, the following steady state concentrations can be calculated.
[ DPPH ] RED [ DPPH ] T [ DPPH ] RED = k 1 ( [ A ] SOL [ A ] OX ) k 1 [ A ] OX
For [DPPH] T values being high
lim [ DPPH ] T [ A ] OX = [ A ] SOL [ DPPH ] RED
In Figure 2, where [DPPH] OX comes close to zero, this can only hold if k1/k-1 is very high, i.e., if DPPH reduction is quite irreversible. Under this condition, the maximum decrease in the absorbance signal is independent of the amount of added [DPPH] T. The amount of reduced DPPH radicals is proportional to the amount of oxidized antioxidants. These consequences verify the results of Figures 2 and 4.
Saturation enters the graphs in Figures 2 and 4 via the methanolic extraction of antioxidants from the microalgae samples. It can be described as follows
A US + nS F k 2 k 1 A SOL
A US S F n = k 2 k 1 A SOL
with AUS is the amount of undissolved antioxidant [mol], ASOL is the amount of antioxidants initially extracted from the algae [mol], SF is the amount of free solvent [mol], n is the number of mols necessary for binding one mol antioxidants, and k1 and k2 are rate constants. As the system is not open, the mass of law conservation holds:
A T = A US + A SOL S T = S F + n A SOL
with AT is the total amount of antioxidant [mol] and ST is the total amount of solvent [mol]. Inserting Equation (9) into Equation (8) and using
K = k 2 k 1
leads to
( A T A SOL ) ( S T n A SOL ) n = K A SOL
Transforming Equation (11) results in the following equation
( S T n A SOL ) n K A SOL A T A SOL = 0
With AT being very high Equation (12) simplifies to
( S T n A SOL ) n = 0
Equation (13) is correct only when
lim A T A SOL = S T n
Equation (14) still works when AT ≫ (K • ASOL). This result explains the saturation effect of the solvent with increasing AT in Figures 2 and 4. The dissolved amount of antioxidants is limited by the used amount of the solvent.

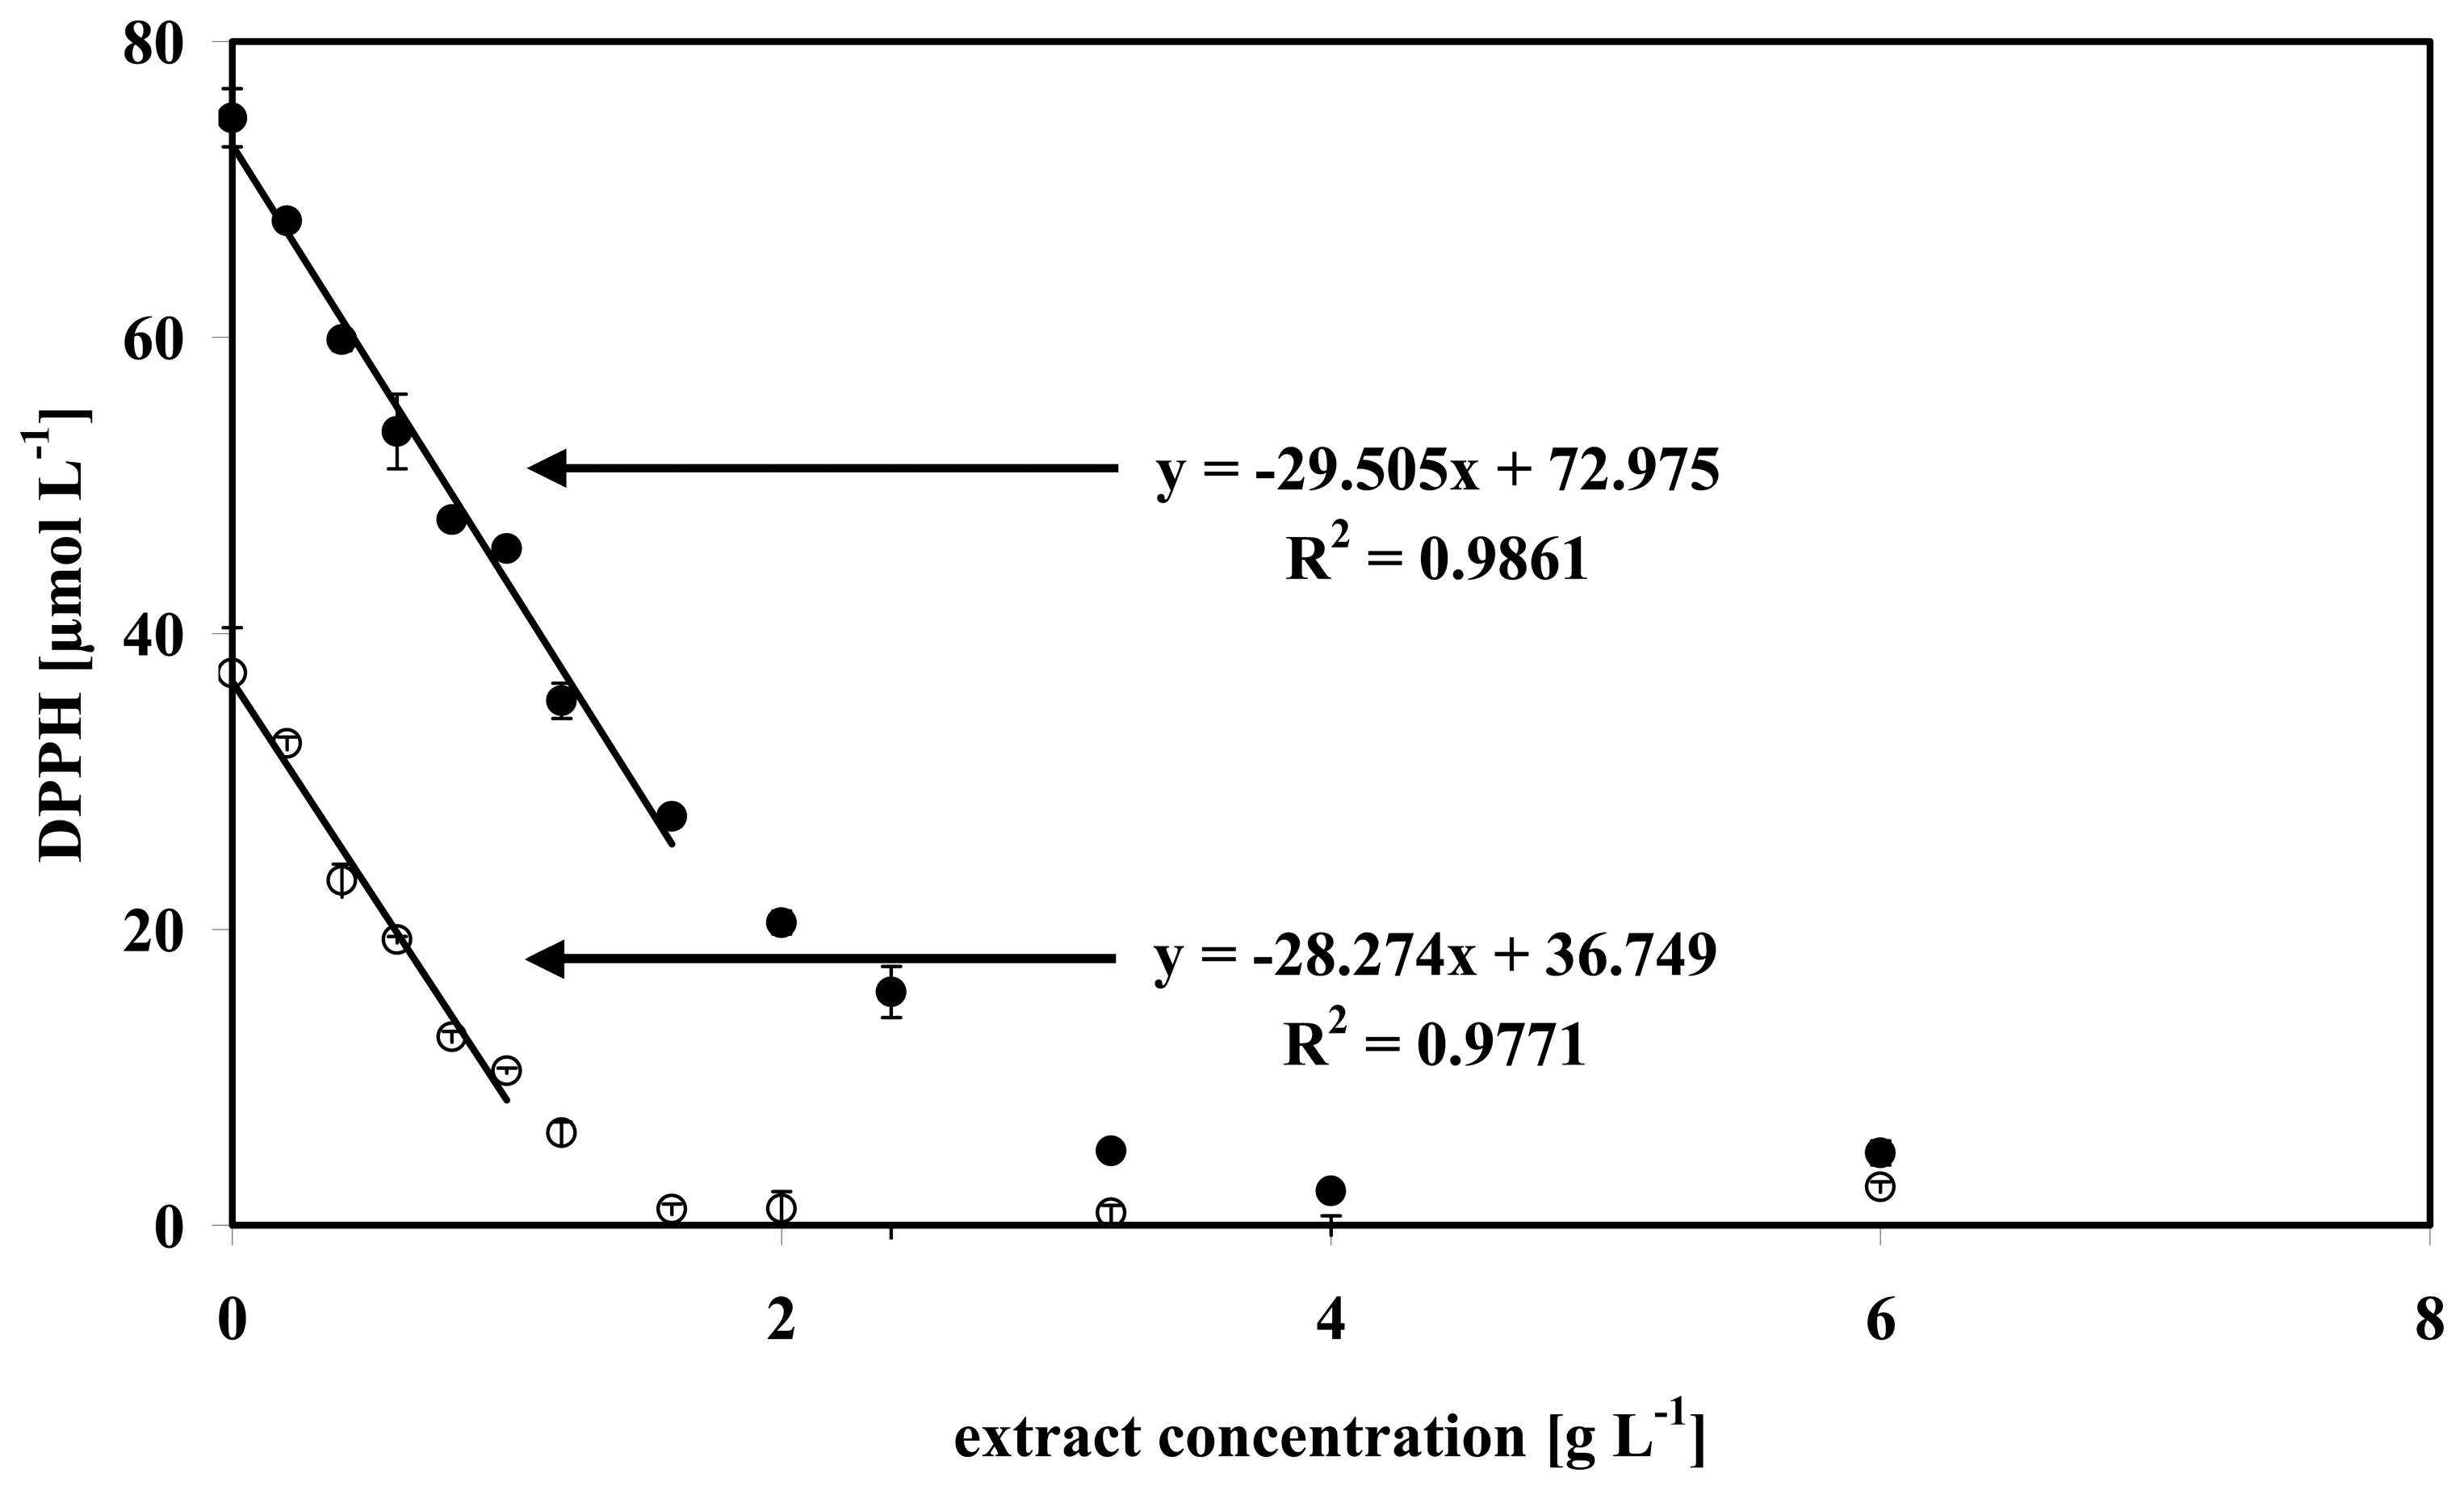
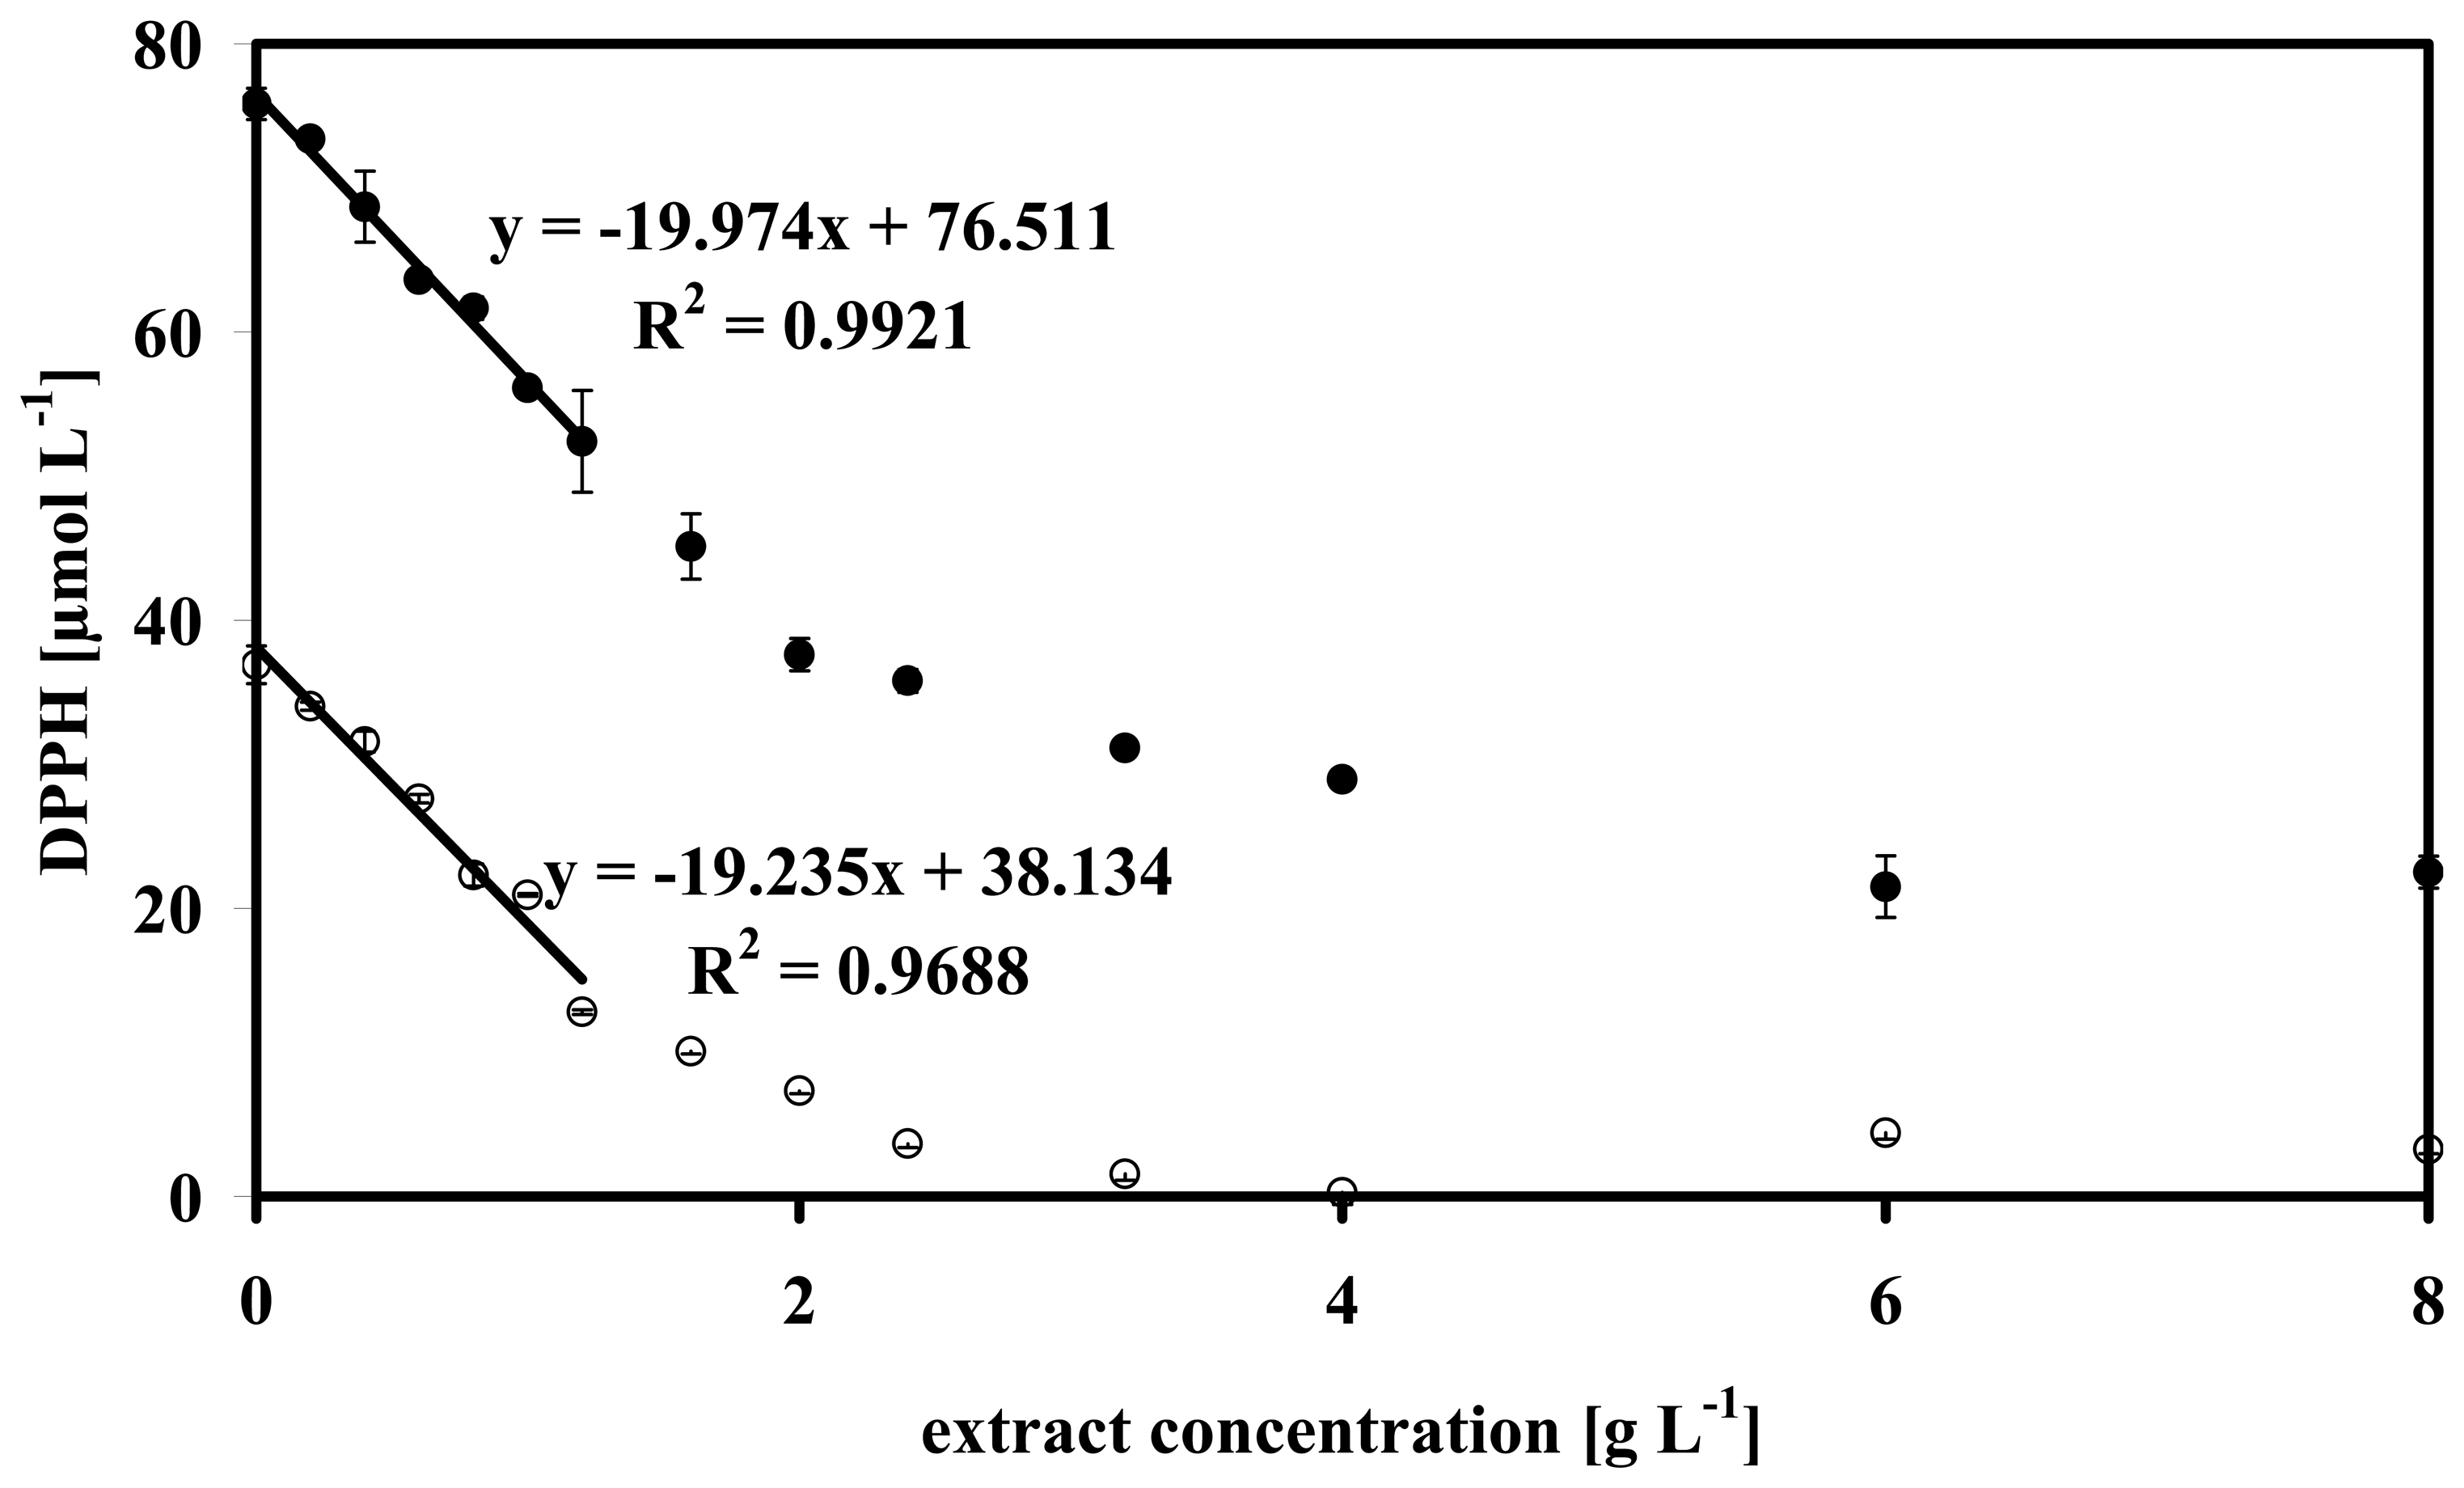
3.4 Data analysis of some microalgae

The analysis of the absorbance measurements at low concentrations of five different microalgae extract's (see Table 1) reveals different slopes by using Equation (2) for each extract. The values for both high and low DPPH concentration are presented in Table 1.
The highest slope is determined for Anabaena sp. (34.45 μmol DPPH g−1 extract for a measurement starting with the high DPPH concentration and 31.74 μmol DPPH g−1 extract for a measurement starting with the low DPPH concentration) followed by Isochrysis galbana (29.51 μmol DPPH g−1 extract and 28.27 μmol DPPH g−1 extract). The difference of the slopes between Synechocystis sp. PCC6803 (19.97 μmol DPPH g−1 extract and 19.24 μmol DPPH g−1 extract) and Phaeodactylum tricornutum (20.58 μmol DPPH g−1 extract and 18.71 μmol DPPH g−1 extract) is low. A minimum slope is obtained from Porphyridium purpureum (7.26 μmol DPPH g−1 extract and 5.97 μmol DPPH g−1 extract).
The calculated effective concentrations (EC50) obtained from experiments like those in Figures 2, 3 and 4 are shown in Table 1. EC50 of Anabaena sp. is 1.103 g extract in the absorbance measurement starting with the high DPPH concentration and 0.599 g extract in the measurement starting with the low DPPH concentration. Isochrysis galbana reaches values of 1.288 g extract and 0.672 g extract, respectively. The EC50 values of Synechocystis sp. PCC6803 (1.902 g extract and 0.988 g extract) and Phaeodactylum tricornutum (1.847 g extract and 1.016 g extract) are in the same range. Porphyridium purpureum (5.234 g extract and 3.182 g extract) reaches the highest EC50 values.
Comparing the data analysed by both DPPH concentrations in Table 1, it becomes clear that the benefits of the here demonstrated method give better results because the values results from averaged data points compared to EC50.
The problem for a proper interpretation of the results is the high variety and a possible influence of the individual composition of carotenoids and fatty acids in each microalgae sample (Wada and Murata 1990, Yongmanitchai and Ward 1991, Allakhverdiev et al. 1999, Kosakowska et al. 2004). For a direct comparison of the antioxidative potential of microalgae environmental conditions, e.g. temperature, light intensity, and pH-value must be controlled during the cultivations. This requires a high instrumented photobioreactor system which enables the cultivation of the microalgae under strictly defined conditions ( Marxen et al. 2005) and is therefore suitable to investigate the influence of these cultivation parameters on the antioxidative potential of microalgae.

Acknowledgments

We thank Petra Rettmann and Gero Bojens for excellent technical support.

References and Notes

  1. Allakhverdiev, S.I.; Nishiyama, Y.; Suzuki, I.; Tasaka, Y.; Murata, N. Genetic engineering of the unsaturation of fatty acids in membrane lipids alters the tolerance of Synechocystis to salt stress. Proc. Natl. Acad. Sci. 1999, 96, 5862–5867. [Google Scholar]
  2. Anderson, J.A.; Padhye, S.R. Protein aggregation, radical scavenging capacity, and stability of hydrogen peroxide defense systems in heat-stressed vinca and sweet pea leaves. J. Am. Soc. Hortic Sci. 2004, 129, 54–59. [Google Scholar]
  3. Antolovic, M.; Prenzler, P.D.; Patsalides, E.; McDonald, S.; Robards, K. Methods for testing antioxidant activity. Analyst. 2002, 127, 183–198. [Google Scholar]
  4. Apel, K.; Hirt, H. Reactive oxygen species: metabolism, oxidative stress and signal transduction. Annu. Rev. Plant Biol. 2004, 55, 373–399. [Google Scholar]
  5. Arora, A.; Sairam, R.K.; Srivastave, G.C. Oxidative stress and antioxidative systems in plants. Curr. Sci. 2002, 82, 1227–1238. [Google Scholar]
  6. Bandoniene, D.; Murkovic, M.; Pfannhauser, W.; Venskutonis, P.R.; Gruzdiene, D. Detection and activity evaluation of radical scavenging compounds by using DPPH free radical and on-line HPLC-DPPH methods. Eur. Food Res. Technol. 2002, 214, 143–147. [Google Scholar]
  7. Bendich, A.; Olson, J.A. Biological actions of carotenoids. FASEB J. 1989, 3, 1927–1932. [Google Scholar]
  8. Blokhina, O.; Virolainen, E.; Fagerstedt, K.V. Antioxidants, oxidative damage and oxygen deprivation stress: a review. Ann. Bot. 2003, 91, 179–194. [Google Scholar]
  9. Bondet, V.; Brand-Williams, W.; Berset, C. Kinetics and mechanisms of antioxidant activity using the DPPH free radical method. Lebensm. Wiss. Technol. 1997, 30, 609–615. [Google Scholar]
  10. Britton, G. Structure and properties of carotenoids in relation of function. FASEB J. 1995, 9, 1551–1558. [Google Scholar]
  11. Di Mascio, P.; Murphy, M.E.; Sies, H. Antioxidant defense systems: the role of carotenoids, tocopherols, and thiols. Am. J. Clin. Nutr. 1991, 53, 194–200. [Google Scholar]
  12. Edge, R.; McGarvey, D.J.; Truscott, T.G. The carotenoids as anti-oxidants – a review. J. Photoch. Photobio. B. 1997, 41, 189–200. [Google Scholar]
  13. Ehling-Schulz, M.; Scherer, S. UV protection in cyanobacteria. Eur. J. Phycol. 1999, 34, 329–338. [Google Scholar]
  14. Eonseon, J.; Polle, J.E.W.; Lee, H.K.; Hyun, S.M.; Chang, M. Xanthophylls in microalgae: From Biosynthesis to biotechnological mass production and application. J. Microbiol. Biotechnol. 2003, 13, 165–174. [Google Scholar]
  15. Fang, Y.Z.; Yang, S.; Wu, G. Free radicals, antioxidants, and nutrition. Nutrition 2002, 18, 872–879. [Google Scholar]
  16. Gazi, M.R.; Kanda, K.; Yasuda, M.; Kato, F. Optimisation of cultural conditions and some properties of radical scavenging substances from sporobolomyces salmonicolor. Pak. J. Biol. Sci. 2004, 7, 1365–1370. [Google Scholar]
  17. Guillard, R.R.L.; Ryther, J.H. Studies of marine planktonic diatoms I. Cyclotella nana Hustedt and Detonula confervacea Cleve. Can. J. Microbiol 1962, 8, 229–239. [Google Scholar]
  18. He, Y.Y.; Häder, D.P. Reactive oxygen species and UV-B: effect on Cyanobacteria. Photochem. Photobiol. Sci. 2002, 1, 729–736. [Google Scholar]
  19. Iwashima, M.; Mori, J.; Ting, X.; Matsunaga, T.; Hayashi, K.; Shinoda, D.; Saito, H.; Sankawa, U.; Hayashi, T. Antioxidant and antiviral activities of plastoquinones from the brown alga Sargassum micracanthum, and a new chromene derivative converted from the plastoquinones. Biol. Pharm. Bull. 2005, 28, 374–377. [Google Scholar]
  20. Jacob, R.A.; Burri, B.J. Oxidative damage and defense. Am. J. Clin. Nutr. 1996, 63, 985–990. [Google Scholar]
  21. Krinsky, N.I. The biological properties of carotenoids. Pure & Appl. Chem. 1994, 66, 1003–1010. [Google Scholar]
  22. Kobayashi, M.; Kakizono, T.; Nishio, N.; Nagai, S.; Kurimura, Y.; Tsuji, Y. Antioxidant role of astaxanthin in the green alga Haematococcus pluvialis. Appl. Microbiol. Biotechnol. 1997, 48, 351–356. [Google Scholar]
  23. Koleva, I.I.; van Beek, T.A.; Linssen, J.P.H.; de Groot, A.; Evstatieva, L.N. Screening of plant extracts for antioxidant activity: a comparative study on three testing methods. Phytochem. Analysis 2001, 13, 8–17. [Google Scholar]
  24. Kosakowska, A.; Lewandowska, J.; Ston, J.; Burkiewicz, K. Qualitative and quantitative composition of Phaedactylum tricornutum (Bacillariophyceae) stressed by iron. J. Biometals 2004, 17, 45–52. [Google Scholar]
  25. Kulisic, T.; Radonic, A.; Katalinic, V.; Milos, M. Use of different methods for testing antioxidative activity of oregano essential oil. Food Chem. 2004, 85, 633–640. [Google Scholar]
  26. Margalith, P.Z. Production of ketocarotenoids by microalgae. Appl. Micorbiolol. Biotechnol. 1999, 51, 431–438. [Google Scholar]
  27. Marxen, K.; Vanselow, K.H.; Lippemeier, S.; Hintze, R.; Ruser, A.; Hansen, U.P. A photobioreactor system for computer controlled cultivation of microalgae. J. Appl. Phycol. 2005, 17, 535–549. [Google Scholar]
  28. Masuda, T.; Yonemori, S.; Oyama, Y.; Takeda, Y.; Tanaka, T.; Andoh, T.; Shinohara, A.; Nakata, M. Evaluation of the antioxidant of environmental plants: activity of the leaf extracts from seashore plants. J. Agric. Food Chem. 1999, 47, 1749–1754. [Google Scholar]
  29. Miller, N.J.; Sampson, J.; Candeias, L.P.; Bramley, P.M.; Rice-Evans, C.A. Antioxidant activities of carotenes and xanthophylls. FEBS Letters 1996, 384, 240–242. [Google Scholar]
  30. Molyneux, P. The use of the stable free radical diphenylpicryl-hydrazyl (DPPH) for estimating antioxidant activity. Songklanakarin J. Sci. Technol. 2004, 26, 211–219. [Google Scholar]
  31. Naguib, Y.M.A. Antioxidant activities of astaxanthin and related carotenoids. J. Agri. Food Chem. 2000, 48, 1150–1154. [Google Scholar]
  32. Paiva, S.A.R.; Russell, R.M. β-carotene and other carotenoids as antioxidants. J. Am. Coll. Nutr. 1999, 18, 426–433. [Google Scholar]
  33. Pavlov, A.; Kovatcheva, P.; Georgiev, V.; Koleva, I.; Ilieva, M. Biosynthesis and radical scavenging activity of betalains during the cultivation of red beet (Beta vulgaris) hairy root cultures. Z. Naturforsch. 2002, 57c, 640–644. [Google Scholar]
  34. Pinchuk, I.; Lichtenberg, D. The mechanism of action of antioxidants against lipoprotein peroxidation, evaluation based on kinetic experiments. Prog. Lipid Res. 2002, 41, 279–314. [Google Scholar]
  35. Prior, R.L.; Wu, X.; Schaich, K. Standardized methods for the determination of antioxidant capacity and phenolics in foods and dietary supplements. J. Agric. Food Chem. 2005, 53, 4290–4303. [Google Scholar]
  36. Pulz, O.; Gross, W. Valuable products from biotechnology of microalgae. Appl. Microbiol. Biotechnol. 2004, 65, 635–648. [Google Scholar]
  37. Rippka, R.; Deruelles, J.; Waterbury, J.; Herdman, M.; Stanier, R. Generic assignments, strain histories and properties of pure cultures of cyanobacteria. J. Gen. Microbiol. 1979, 111, 1–61. [Google Scholar]
  38. Rijstenbil, J.W. Assessment of oxidative stress in the planktonic diatom Thalassiosira pseudonana in response to UVA and UVB radiation. J. Plankton Res. 2002, 24, 1277–1288. [Google Scholar]
  39. Romay, C.; Armesto, J.; Remirez, D.; González, R.; Ledon, N.; García, I. Antioxidant and anti-inflammatory properties of C-phycocyanin from blue-green algae. Inflamm. Res. 1998, 47, 36–41. [Google Scholar]
  40. Sies, H.; Stahl, W. Vitamins E and C, β-carotene, and other carotenoids as antioxidants. Am. J. Clin. Nutr. 1995, 62 suppl, 1315–1321. [Google Scholar]
  41. Spolaore, P.; Joannis-Cassan, C.; Duran, E.; Isambert, A. Commercial application of microalgae. J. Biosci. Bioeng. 2006, 101, 87–96. [Google Scholar]
  42. Vaya, J.; Aviram, M. Nutritional antioxidants: mechanism of action, analyses of activities and medical applications. Curr. Med. Chem.–Imm., Endoc. & Metab. Agents 2001, 1, 99–117. [Google Scholar]
  43. Wada, H.; Murata, N. Temperature-induced changes in the fatty acid composition of the cyanobacterium, Synechocystis PCC6803. Plant Physiol. 1990, 92, 1062–1069. [Google Scholar]
  44. Yen, G.C.; Duh, P.D. Scavenging effect of methanolic extracts of peanut hulls on free-radical and active-oxygen species. J. Agric. Food Chem. 1994, 42, 629–632. [Google Scholar]
  45. Yongmanitchai, W.; Ward, O.P. Growth of and omega-3 fatty acid production by Phaeodactylum tricornutum under different culture conditions. J. Appl. Environm. Microb. 1991, 57, 419–425. [Google Scholar]
  46. Yordabov, N.D.; Christova, A.G. Quantitative spectrophotometric and EPR-determination of 1,1-diphenyl-2-picryl-hydrazyl (DPPH). Fresen. J. Anal. Chem. 1997, 358, 610–613. [Google Scholar]
Figure 1. Wavelength scans of Synechocystis sp. PCC6803. Both measuring and reference cuvette are measured against pure methanol. DPPH concentration of the measuring cuvette was 76 μmol L−1.
Sensors 07 02080f1
Figure 2. Absorbance decrease of the DPPH radical measured at 550 nm for Synechocystis sp. PCC6803. The reference cuvette is filled with the same extract concentration as in the measuring cuvette, but without DPPH radicals. Open circles represent the data for using the low DPPH concentration (38 μmol L−1). Closed circles represent the data for using the high DPPH concentration (76 μmol L−1). The negative algebraic signs represent the reducing of the DPPH radical by the microalgae extract. Linear regressions calculated according to Equation (2).
Sensors 07 02080f2
Figure 3. Absorbance decrease of the DPPH radical measured at 550 nm after adding α-tocopherol for Synechocystis sp. PCC6803. The reference cuvette is filled with the same extract concentration as in the measuring cuvette. Open circles represent the data obtained from low DPPH concentration (38 μmol L−1). Closed circles represent the data obtained from high DPPH concentration (76 μmol L−1).
Sensors 07 02080f3
Figure 4. Absorbance decrease of the DPPH radical measured at 550 nm for Isochrysis galbana. The reference cuvette is filled with the same extract concentration as the measuring cuvette. Open circles represent the data for using the low DPPH concentration (38 μmol L−1). Closed circles represent the data for using the high DPPH concentration (76 μmol L−1). The negative algebraic signs represent the reducing of the DPPH radical by the microalgae extract. Linear regressions calculated according to Equation (2).
Sensors 07 02080f4
Figure 5. Absorbance decrease of the DPPH radical measured at 550 nm after adding α-tocopherol to extracts of Isochrysis galbana. The reference cuvette is filled with the same extract concentration as in the measuring cuvette. Open circles represent the data for using the low DPPH concentration (38 μmol L−1). Closed circles represent the data for using the high DPPH concentration (76 μmol L−1).
Sensors 07 02080f5
Table 1. Comparison of the slopes of the absorbance measurements, correlation coefficients and calculated EC50 values of the different microalgae samples.
High DPPH concentration (76 μMLow DPPH concentration (38 μM)

MicroalgaeSlope [μmol DPPH g−1extract]REC50 [g extract]Slope [μmol D]R2EC50 [g extract]
Anabaena sp.34.450.9941.10331.740.9980.599
Isochrysis galbana29.510.9861.28828.270.9770.672
Synechocystis sp. PCC680319.970.9921.90219.240.9690.988
Phaeodactylum triconutum20.580.9681.84718.710.9961.016
Porphyridium purpureum7.260.9785.2345.970.9923.182
α Tocopherol3300.30.9990.0115

