Review

Volatile Organic Compound Optical Fiber Sensors: A Review

Departamento de Ingeniería Eléctrica y Electrónica, Universidad Pública de Navarra, Campus de Arrosadia s/n, 31006 Pamplona, Spain
*
Author to whom correspondence should be addressed.
Sensors 2006, 6(11), 1440-1465; https://doi.org/10.3390/s6111440
Submission received: 7 October 2006 / Revised: 31 October 2006 / Accepted: 31 October 2006 / Published: 1 November 2006
(This article belongs to the Special Issue Gas Sensors)

Abstract

:
Volatile organic compound (VOC) detection is a topic of growing interest with applications in diverse fields, ranging from environmental uses to the food or chemical industries. Optical fiber VOC sensors offering new and interesting properties which overcame some of the inconveniences found on traditional gas sensors appeared over two decades ago. Thanks to its minimum invasive nature and the advantages that optical fiber offers such as light weight, passive nature, low attenuation and the possibility of multiplexing, among others, these sensors are a real alternative to electronic ones in electrically noisy environments where electronic sensors cannot operate correctly. In the present work, a classification of these devices has been made according to the sensing mechanism and taking also into account the sensing materials or the different methods of fabrication. In addition, some solutions already implemented for the detection of VOCs using optical fiber sensors will be described with detail.

1. Introduction

The origin of optical fiber sensor technology is directly related to the development of the modern lasers achieved in the 60s. Additionally, in 1963, it was demonstrated that optical signals could be transmitted along glass with extremely low losses [1]. It was thought that this new kind of sensors could replace the electronic ones, and that the optical fiber technology would make copper cable data networks obsolete, but electronic sensors had one advantage that optical fiber ones did not have – their technology was much more established. Besides, there were other types of competing sensors, such as mechanical ones, which had shown promising new developments, even though they were based on even more mature technologies [2]. Optical fiber sensors experienced a great development with the advances in telecommunication technology [3], and found application niches where the advantages that optical fiber offers make them an option to be taken into account with respect to other technologies [4]. Some of these advantages are electromagnetic immunity, remote sensing, multiplexation capacity, passive nature, on line monitoring, distributed sensing or low weight and size, just to mention a few. One of the fields where these properties make optical fiber sensor technology a great competitor is for the detection of Volatile Organic Compounds (VOCs).
The sensing of VOCs has many applications, and hence, there is an increasing interest focused on their detection, monitoring and analysis (Figure 1). VOCs are commonly used as ingredients in household products or in industrial processes where they normally get vaporized at room temperature and can be breathed, and unfortunately, many VOCs can cause adverse health effects [5]. Other synthetic products as paints, wax or fuels can release toxic vapors when they are stored; even some foods, such as beverages, fish and meat products, emit organic vapors [6]. VOCs are also present in some workplaces, especially in the chemical industries; in these cases, it is important to monitor the concentration of the vapors to safeguard the health of the workers, and also to keep atmospheric emissions under control in order to avoid environmental hazards. Finally, other non organic gases such as hydrogen or oxygen also need to be monitored because of the high risk of explosions if their concentrations surpass safe levels.
Organic vapors can be explosive above certain concentrations, while on the other hand, due to their passive nature, optical fiber sensors do not need electric power to work, which make them a good choice in environments where the inflammability risk is high, for example, when handling fuel or heating gases. The electric industry is another place where optical fiber sensors can be used due their immunity to electromagnetic interferences [7]. In addition, the possibility of multiplexation of the optical fiber sensors permits coupling of the interrogating and the response signal in the same fiber, which simplifies notably the final sensor system and also makes possible the implementation of a multi-point sensor network (Figure 2). Moreover, even distributed sensors, also known as “nerve systems”, can be implemented [8]. These properties are all very attractive when is important to control gas concentrations in large spaces or in pollutant control applications. In fact, commercial systems exist which allow one to know the exact concentration at one specific location with a spatial resolution of centimeters using for example, optical time domain reflectometry (OTDR) [9]. Optical fiber sensors can be also used in non invasive applications, from food control to the measurement of gases dissolved in liquids, or in blood [10]. Another important feature is the possibility of monitoring gases on-line, which is very interesting in most of the applications mentioned above.
The detection of organic vapors using optical fiber sensors began over 25 years ago [11], and great efforts have gone into to improving this technology. In this work, a general view of this field will be given. First, the main architectures employed so far are described, paying special attention to the different methods of fabrication. Some applications will be commented in the last section.

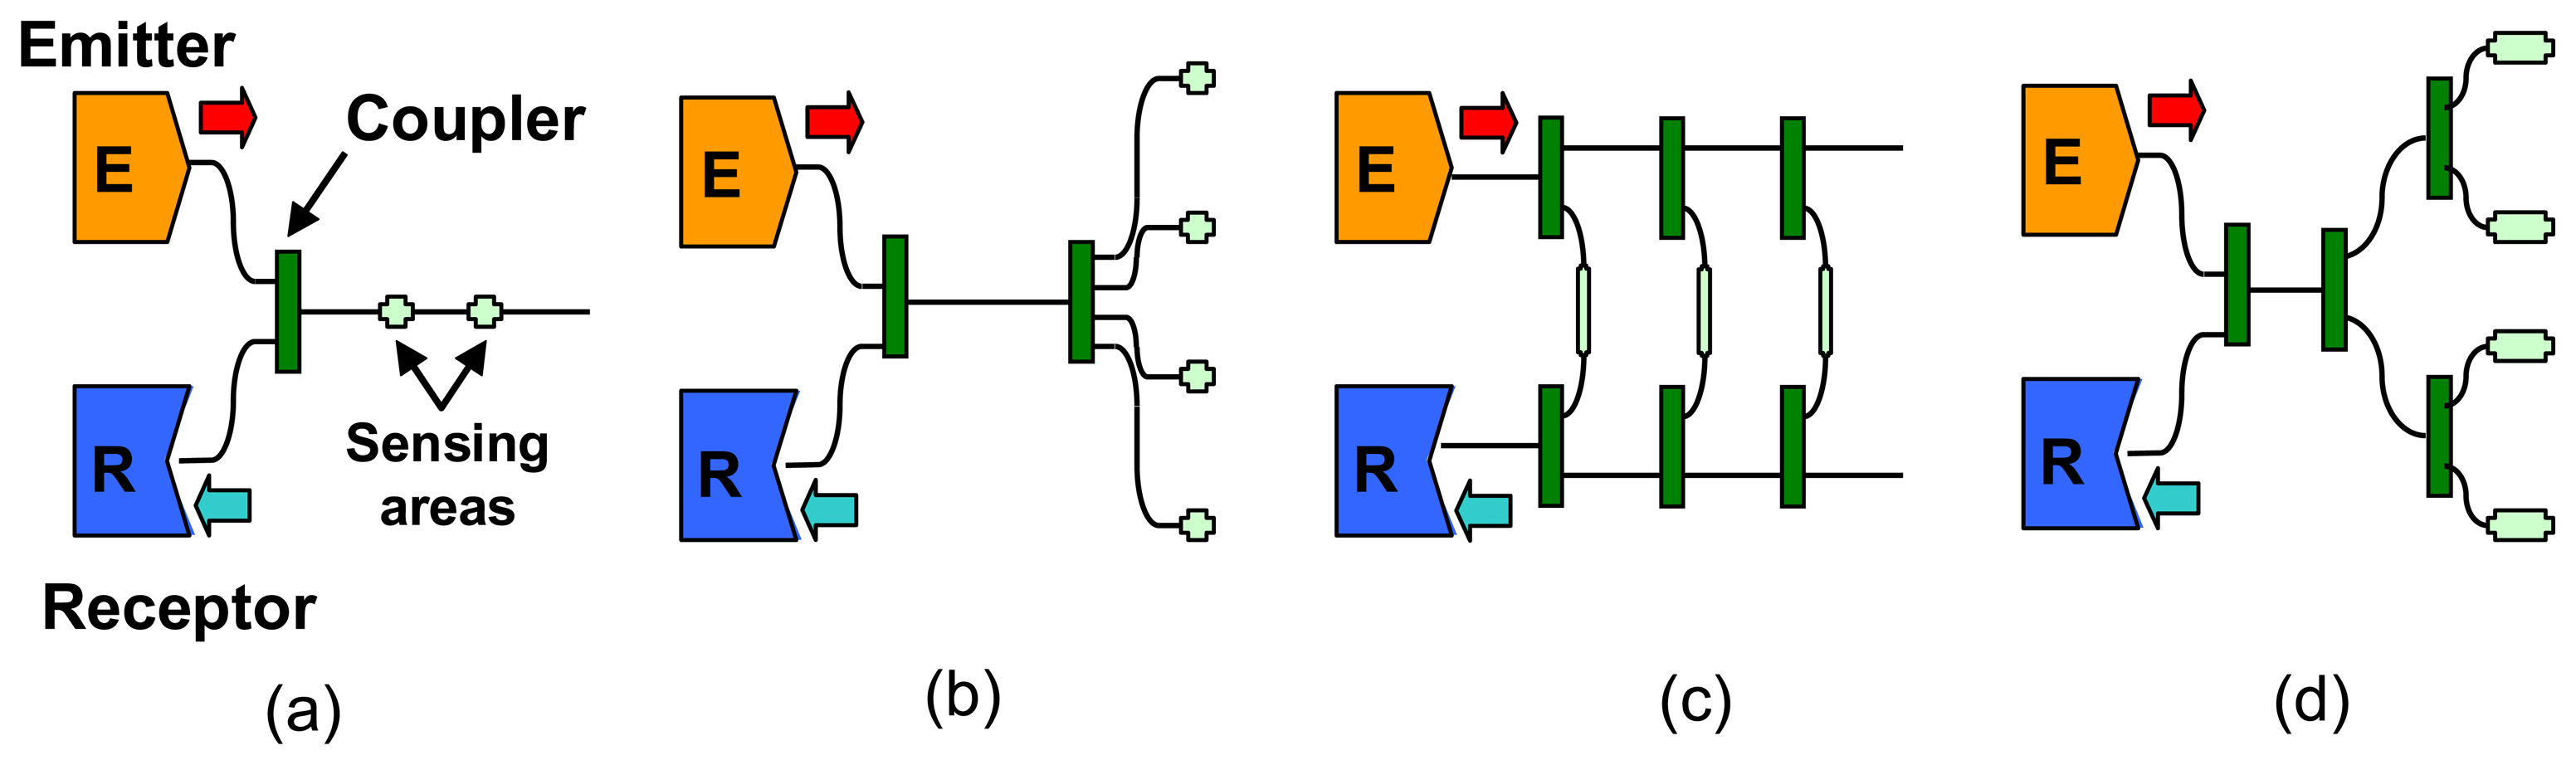
2. Sensing Architectures

A number of different approaches have been used in the categorization of optical fiber sensors [1, 12-13]. Fiber optic sensors are most commonly subdivided into intrinsic and extrinsic, depending on where the transduction between light and measurand takes place, in the fiber or outside it [14-15] (Figure 3). Within this subgroup, a more thorough division can be done depending on the sensing architecture – transmissive or reflexive – and more subdivisions are possible, as can be seen in [1, 12].

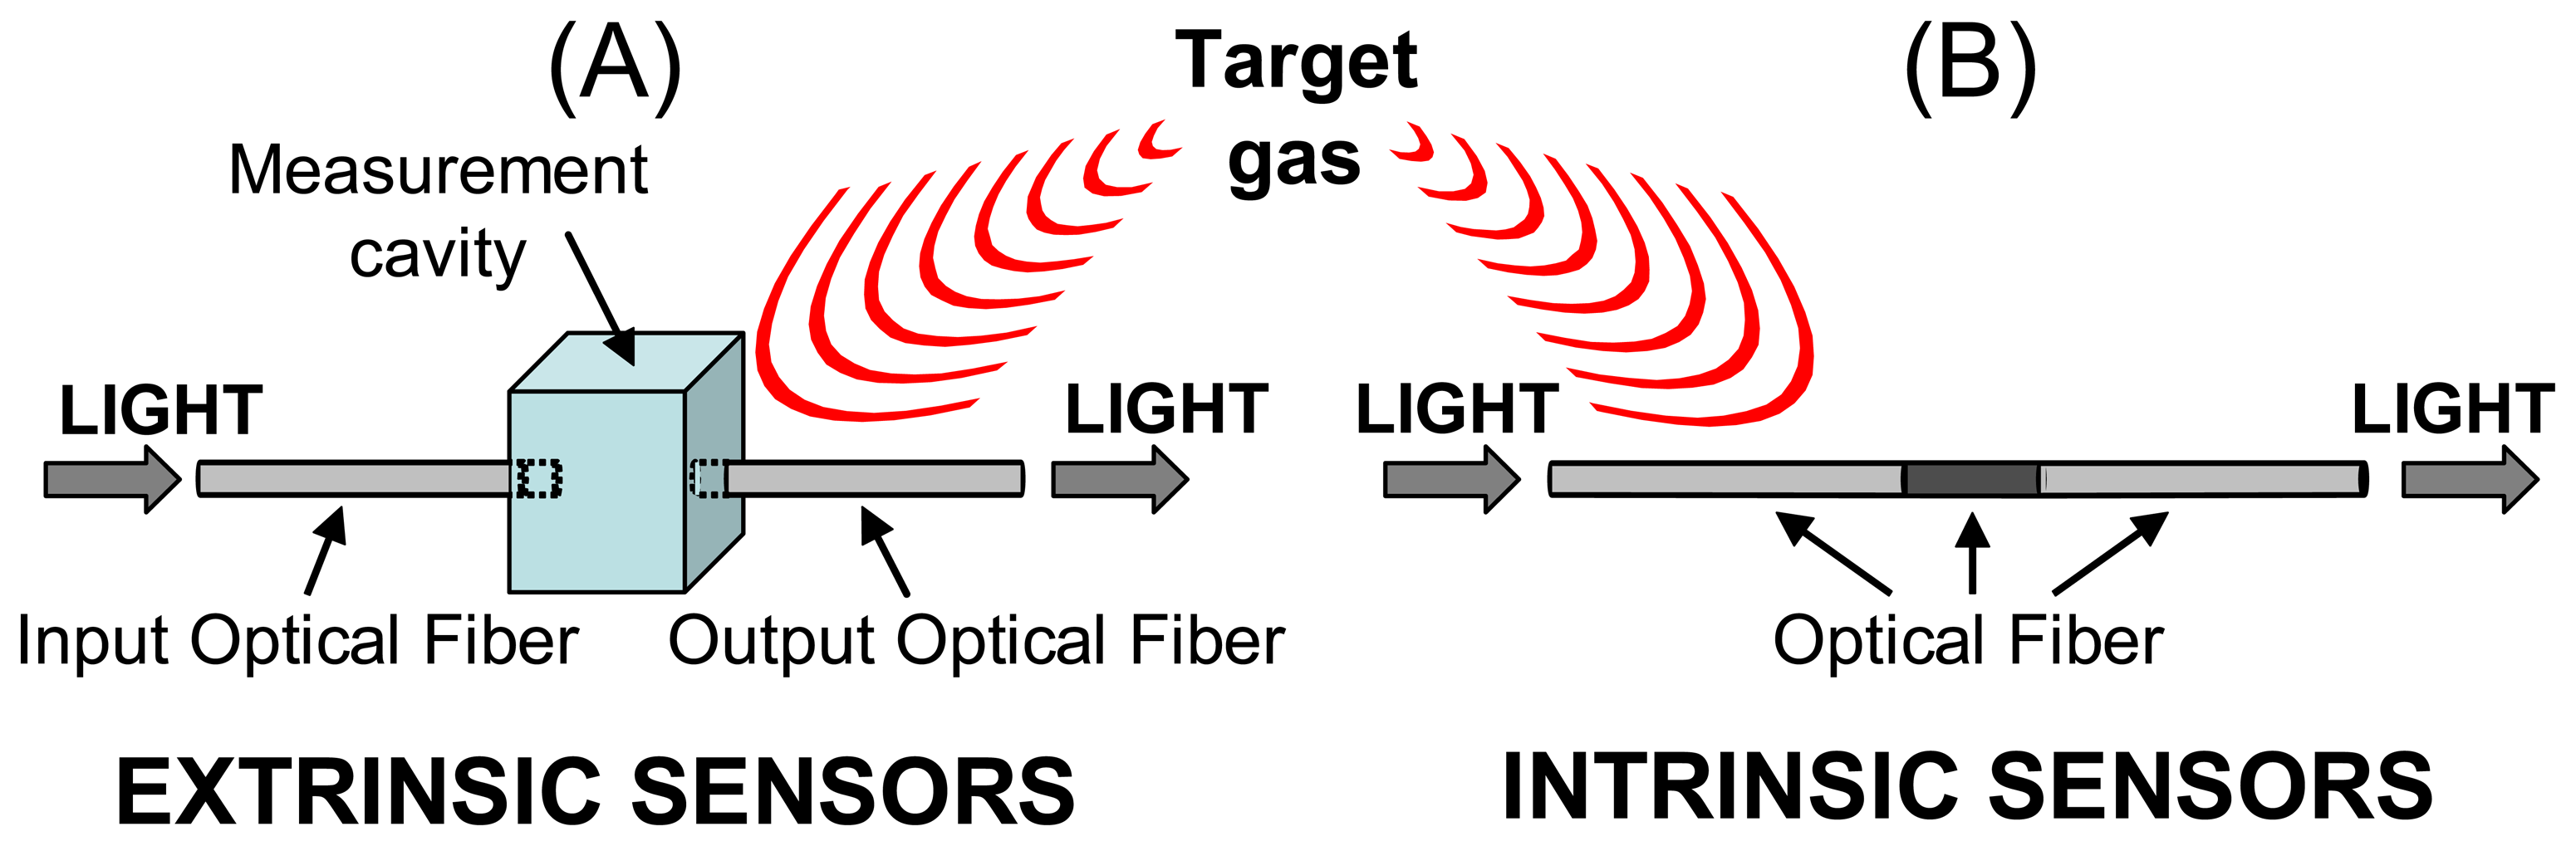
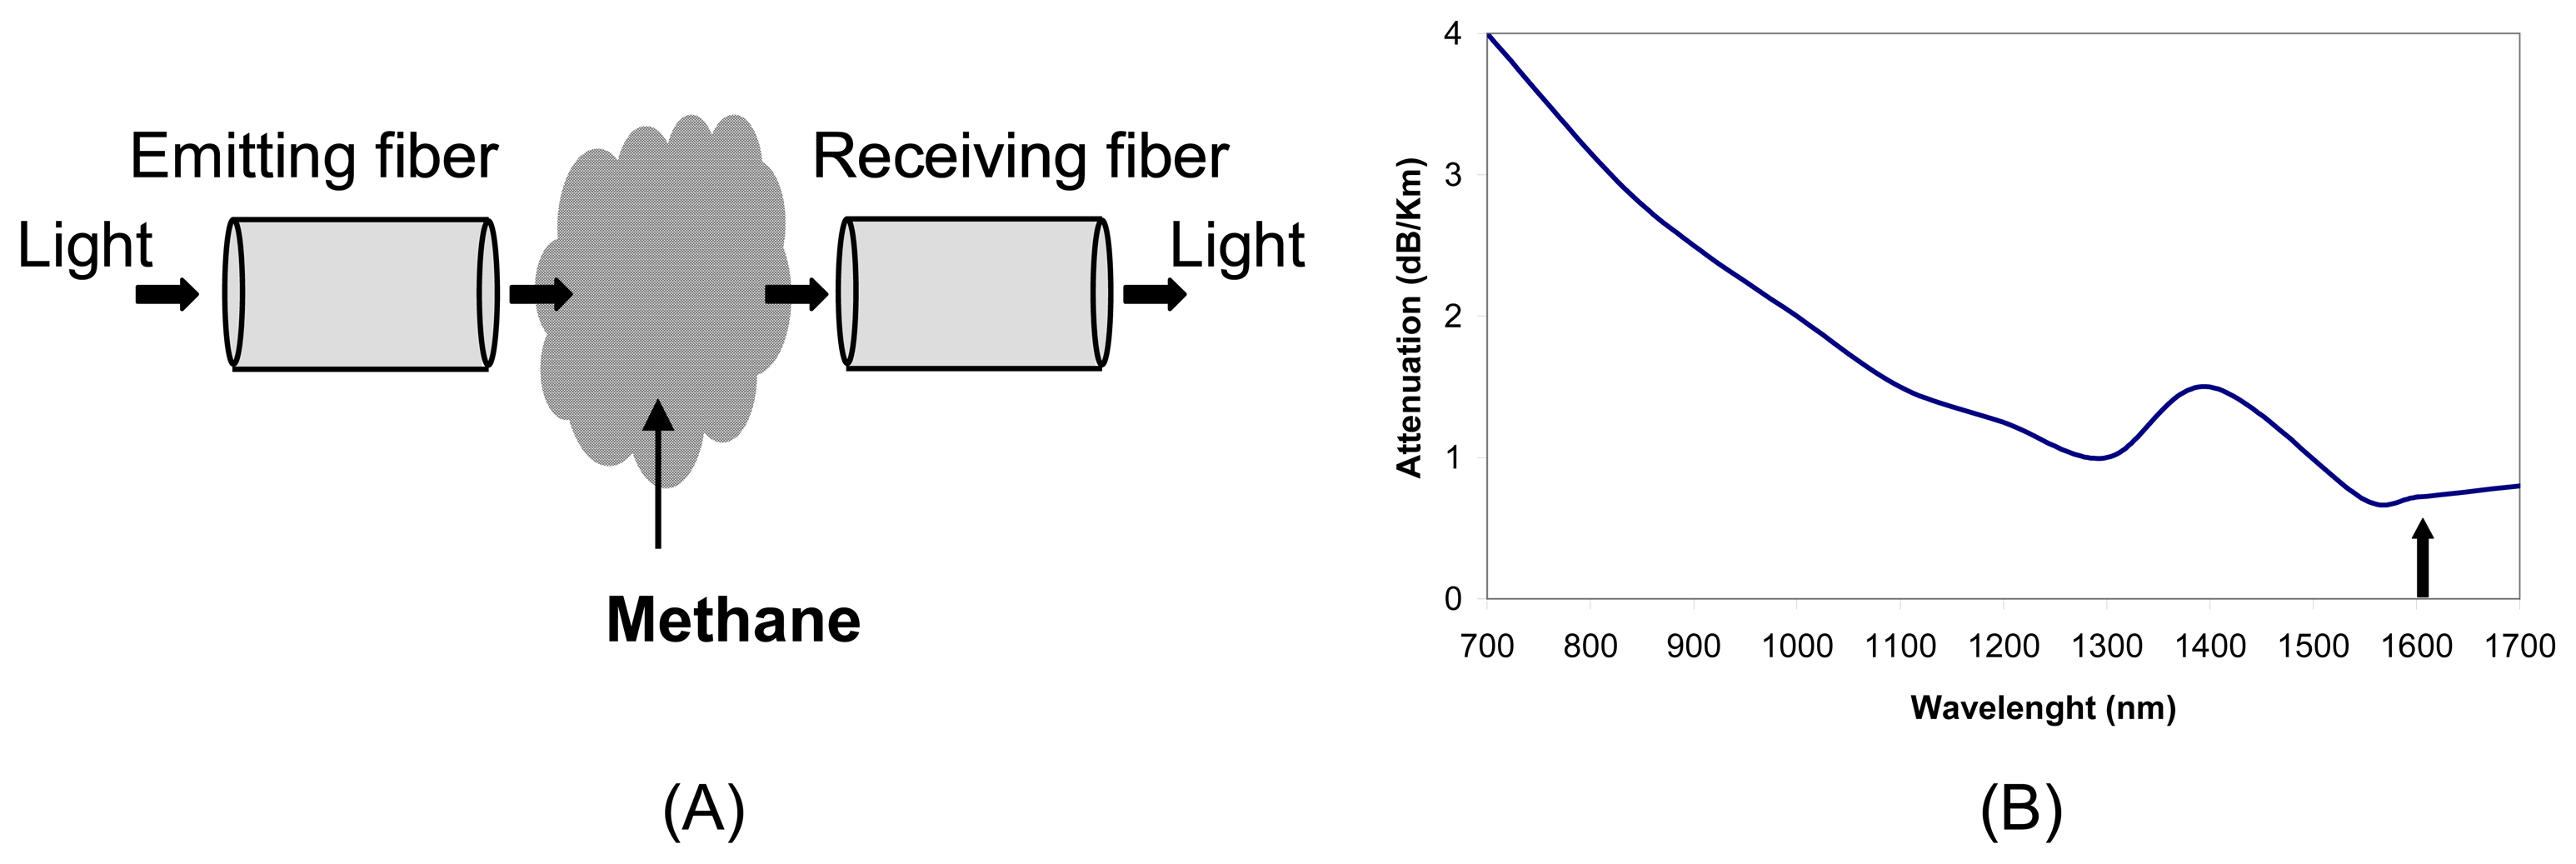
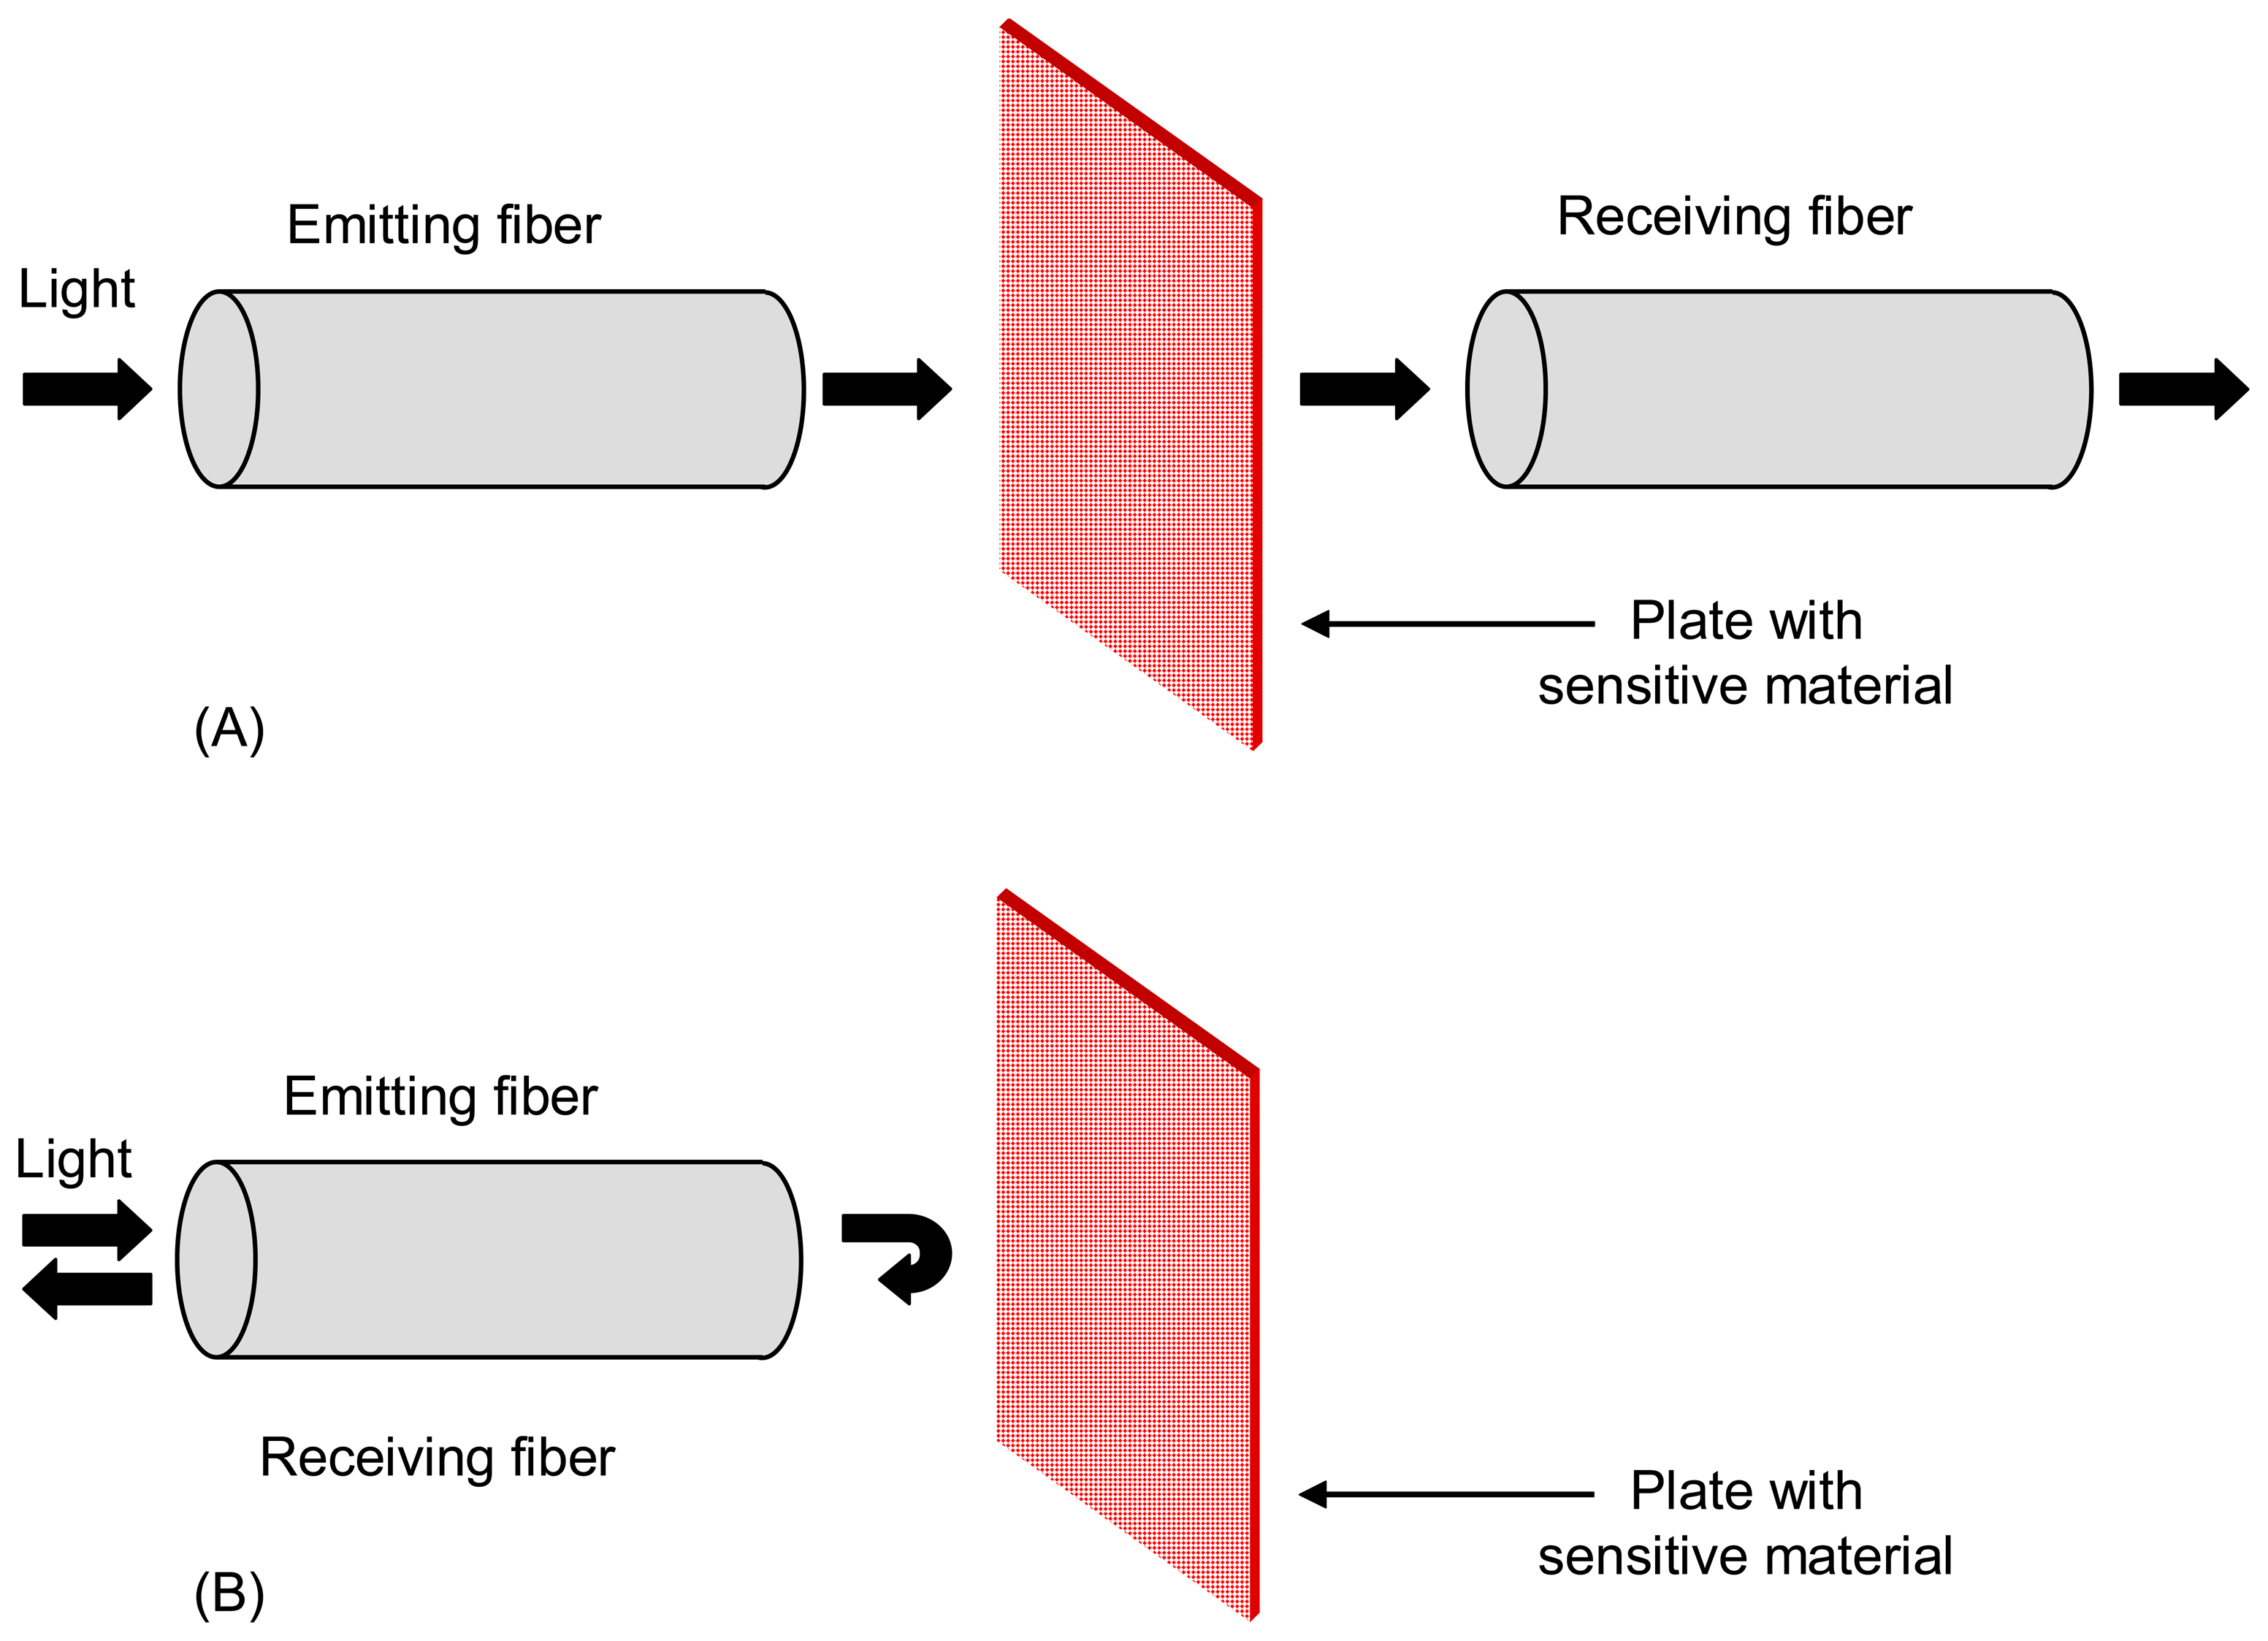
2.1 Extrinsic sensors

In this type of sensors the fiber acts only as a data transmission line. Extrinsic sensors have successfully been used in real applications, and some working networks for monitoring organic gases based on extrinsic optical fiber sensors are actually in use [16]. Within the extrinsic sensors category, two subgroups can be distinguished, depending on the chemical agent that interacts with light, either the target gas to be detected directly or using as a transducer a chemical agent through which the gas has to pass.
Extrinsic sensors in which the light interacts directly with the gas have been successfully used in real applications, and there are some theoretical studies trying to improve their features [17]. An optical fiber brings the light to a micro cell, where it interacts with a sample from the surrounding environment. Both the input and the output fibers must be accurately aligned and the output signal guided into a photodetector or to a spectrometer. This provides selective gas detection by matching the input interrogating wavelength and the spectral absorption line of the specific gas. In real applications, other interfering gases will be present, which translates into background noise. Other more robust modulations than the one based on intensity are employed in these configurations [18-19].
If it is possible to tune the wavelength of the light source to optical frequencies where other volatile compounds have spectral absorption lines, then several vapors can be detected using the same setup. This sensing method is known as Wave Spectral Modulation (WSM) [20], and recently different types of modulations are been developed based on this one [21]. These techniques are used with gases whose spectral absorption lines range from the visible to near infrared wavelengths, where optical fiber technology works properly; out of this spectral range, optical fiber is almost opaque. Methane, for example, is a gas that can be monitored using this method because its spectral absorption line is at 1660 nm, close to the third fiber optic telecommunication window (1550 nm) (Figure 4). This is an example of a niche application where optical fiber sensors are been successfully employed. An alternative to WSM sensors are the sensors based on Fabry–Perot interferometric cavities which have been used to measure changes in the refractive index of gases [22].
Finally, the change of the properties of the light can be accomplished by a chemical agent, and not directly by the organic vapor to be detected. This provides two possible configurations (Figure 5). The first is a transmission one, in which the light passes through a chemical sensing dye whose properties change in presence of the gas or vapors to be detected, modulating the light passing through [23-24]; in the second one, the light coupled into the fiber illuminates the chemical dye and couples back into a photodetector or a spectrometer [24]; the sensing dye is deposited onto a mirrored surface in order to get a maximum reflected signal [25].

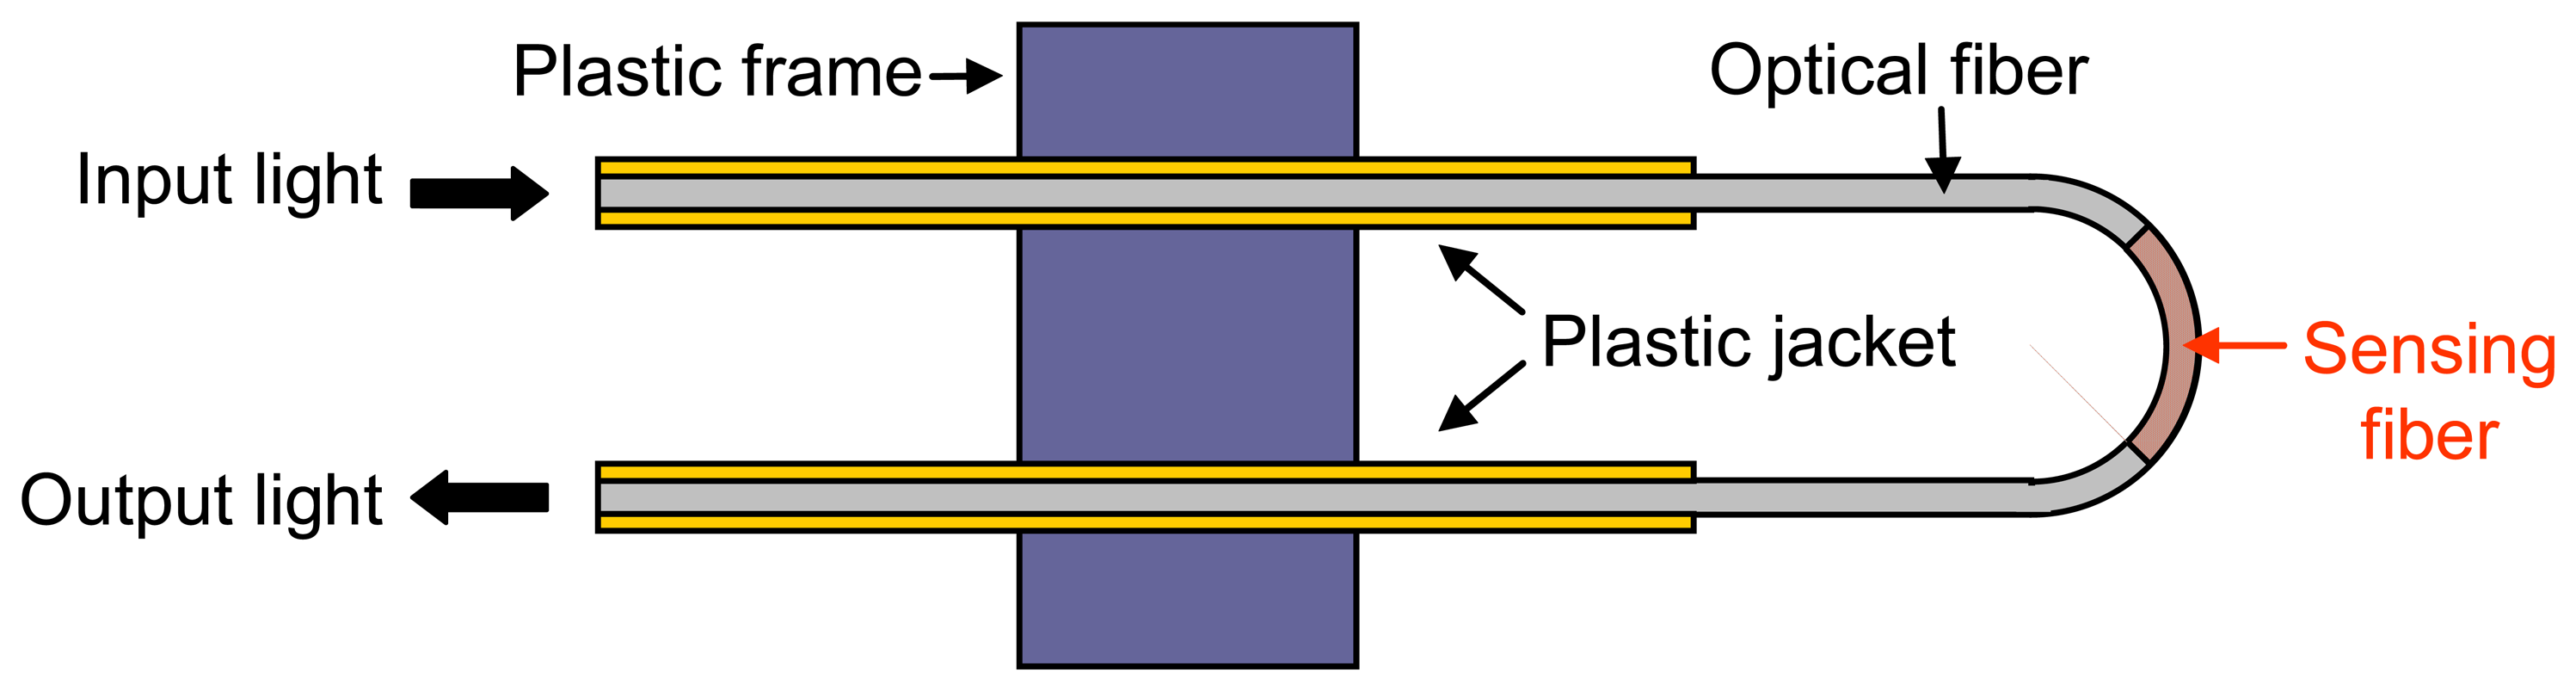
2.2 Intrinsic sensors

Most optical fiber sensors for organic vapors detection are intrinsic. Within this category, other sub classes can be distinguished, depending on the modulation of the optical signal guided through the fiber. In almost all intrinsic sensors, a chemical dye is required to act as an interface between the target vapors and the optical fiber, although there are some specific cases where it is not used.

2.2.1 Evanescent wave intrinsic sensors

This is probably the most studied and developed intrinsic sensor subfamily [26]. In most of them, there is a segment of the fiber that acts as the sensing area, so there is no open path between the light source and the detector. The passive cladding of the optical fiber is replaced, using different schemes, along a small section by a sensitive material; so any change in the optical or structural characteristic of the chemical dye due to the presence of the vapors, provokes a change in the effective index of the optical fiber, changing its transmission properties [27]. The sensitivity of these sensors depends on the optical power transferred into the evanescent field and also by the penetration depth of these waves into the sensing cladding, which can be calculated by Beer-Lambert law [28]. Evanescent wave sensors can be explained in detail with field propagation equations, although in this case ray theory will be used just to provide a general and intuitive explanation.
If the modified cladding has a lower refractive index than the core, then the total reflection condition is met. In this case, the sensor response is governed by the intensity modulation caused by light absorption of the evanescent wave which is guided through the cladding; this interaction results in the attenuation of the guided light in the fiber core [29]. On the other hand, if the modified cladding has a higher refractive index than the core, part of the optical power is refracted into the cladding, and another part is reflected back into the core [27]. Both the optical power reflected in the core and the light passing through the cladding depend on the optical properties of the cladding, which change in presence of the organic vapors to be detected. The total optical power loss is characterized mainly by the light absorption of the chemical dye that replaces the cladding, the number of interactions between the core and the cladding, the diameter of the core, and the numeric aperture of the fiber, among other parameters. There is a trade-off between these parameters. A very detailed theoretical study on evanescent wave sensors can be found, for example, in [30].
There are particular schemes for evanescent wave sensors in which no chemical dye is used. For example, the cladding can be manufactured to be sensitive to specific organic vapors [31]; another alternative consists of tapering the fiber, yielding a more fragile but more sensitive sensor [32-34]; even an optical fiber without cladding can be used, making the organic vapors themselves act as a cladding [35].
Evanescent wave sensors usually work in transmissive setups (Figure 6), in which the sensor is connected between the interrogating signal source and the detector, the sensing signal being based on the intensity modulation of the light.
Finally, there are other different practical implementations of evanescent wave sensors using standard optical fibers. These have a cladding made of silica, which is difficult to remove or modify. A possible solution is to polish the fiber, eliminating the cladding or at least a part of it [36-38], or to use a chemical attack known as etching. This last solution is probably the most employed, and consists of soaking the optical fiber in a hydrofluoric acid solution [9, 27, 39]. Handling this acid is very dangerous, and polished fibers are fragile to handle and difficult to replicate. A possible alternative are plastic cladding fibers (PCS) [40-43]; the cladding of these fibers can be removed easily either mechanically or with non hazardous solvents such as acetone, allowing more reproducible sensors.
Once the cladding, or a part of it, is removed or modified in such a way that it is possible to reach the evanescent field, the sensing material has to be fixed onto the fiber core surface. To achieve this, one can dissolve the analyte in a chemical solution, in which the fiber is dipped several times. This technique is known as dip coating. Depending on the number of times the fiber is dipped and other parameters such as immersion speed, dye, or deposition techniques, the new claddings will have different thickness' and surfaces. A simpler variation of this technique consists of just soaking the fiber for a certain time in the mixture where the analyte is added [19, 44]. The final deposition has to be mechanically resistant, and it is also desirable that its properties remain temporally invariable. Some authors dilute the sensing material in PVC [41] solutions, resulting on very resistant depositions, but with high transmission losses due to the opacity of PVC towards light transmission. To overcome this problem, sol-gel solutions can be employed instead. These mixtures are made of silica, the same material as optical fiber, so then the transmission losses are minimized; the sensing material is added to the sol-gel solution while it is still in liquid phase, and then the fiber is dipped into the mixture. After drying the deposition, an optically uniform porous matrix doped with the analyte fixed onto the fiber is achieved. Recently, efforts have focused on controlling the size of the porous once the sol-gel is deposited, which can give an additional sensing mechanism based on discrimination between organic vapor molecules depending on their molecular size. Sol-gel solutions deposited with dip coating technique are a typical combination used in recent years to implement evanescent wave sensors [9, 31, 45-51].
Other deposition procedures are available, although they work better with other substrates and geometries; this is the case of Langmuir-Blodgett technique, which is based on the deposition of layers with hydrophobic and hydrophilic behavior, yielding a homogeneous structure formed by bilayers [52-53]. Special equipment is required to accomplish this deposition technique, in which the bilayer to deposited onto the sensor is spread onto ultrapure water, forming a nanometric surface; when the substrate, in this case the optical fiber, is introduced in the solution, a new layer get deposited onto the surface [54] (Figure 7).
After the deposition process, the sensor can be subjected to a curing process in order to enhance the properties of the sensing deposition, or to force the vaporization of solvents that could interfere with the response of the sensor. The curing process usually consists of heating the sensor to a certain temperature for a short time; sometimes it is accomplished under inert atmospheres or even under vacuum. The temperature is an important factor, especially when the sensing material might suffer thermal degradation; in these cases, the curing process should be done at room temperature. There are many possible implementations of evanescent wave sensors. Some of them will be discussed next.

2.2.1.1 Bended evanescent wave sensors

The optical power transferred into the evanescent field is usually weak, and hence the penetration depth in the sensing area is low. This translates into a limitation of the sensitivity of the sensor. To improve the sensitivity, the fiber can be bent in order to couple more optical power in the evanescent field (Figure 8). The increment in the optical power coupled to the evanescent wave depends mainly on the bend radius, as has been demonstrated empirically [55-56]. There are practical examples involving bending the fiber into a U-Shape probe [26, 57-58]. The fibers employed in these cases have core diameters of up to 1 mm just to avoid fiber crushing. The bending process is usually done by heating the fiber using a flame. After this, the chemical dye is mixed onto the fiber using any of the deposition techniques mentioned above.
It is also possible to coil a few meters of an optical fiber with modified cladding [44, 59]. This configuration is useful in applications where distributed sensing is needed.

2.2.1.2 Evanescent wave sensors based on special fibers

Another possibility for increasing the amount of optical power coupled in the evanescent field, is by using new types of fibers that appeared a few years ago. Among then, one can mention hollow core fibers. The simpler type of hollow core fibers, consist basically of tubular fibers where the optical signal is guided mainly by the cladding, and hence, it is easy to reach the evanescent fields [60]. If a hollow core fiber is connected between two silica core ones, the optical power is coupled from the core to the cladding in the first transition, and then, from the cladding to the core in the second transition [61] (Figure 9). Although this approach may seem to be innovative, an optical fiber sensor for ammonia vapors based on this idea was implemented almost 25 years ago [11].
Holey fibers (HFs), also known as microstructure fibers (MFs) or photonic crystal fibers (PCFs), are a new type of fibers in which air holes are incorporated within the silica cladding region; these cavities enhance the interaction between the evanescent field and the gas to be analyzed. Parameters such as the size and placement of the air holes provide an extra degree of freedom in controlling light propagation and also the way the optical evanescent signal is affected by the gas [62]. This kind of microstructure fibers have been employed to measure the diffusion constant of acetylene vapors [63], and to detect the presence of CO and CO2 [64], just to mention a couple of examples.
There are also hybrid solutions which combine Hollow Core and Holey fibers. In any case, the use of these fibers in future applications is very promising [65-66].

2.2.1.3 Bragg grating intrinsic sensors

Optical sensors for detection of gases can also be implemented taking advantage of well known fiber Bragg gratings (FBGs). In a few words, Bragg gratings are optical filters which allow the transmission of some wavelengths and reflect others; this is achieved by introducing a variation in the refractive index of the core of the fiber periodically along a certain length. The change in refractive index is repeated with a spatial pitch of nanometers, and determines the wavelength that will be reflected back:
λ B = 2 n eff Λ
where λ B is the wavelength filtered, neff is the effective refractive which light travels through the optical device, and Λ is the grating pitch (shorter than lower than the working wavelength). More detailed information about these devices can be found in [67]. In the field of gas detection, the sensing transduction consists of producing a detectable alteration of the filtering characteristics of the device. The presence of a certain gas can induce a change in the length or the pitch of the grating [68].
One of the main disadvantages of using FBG based sensors is that these devices are normally focused on telecommunications networks and for detecting gases, and are not very sensitive. Anyway, there is other type of Bragg gratings in which the pitch of the refractive variation is much longer, around hundreds of micrometers. These devices are known as long period gratings (LPG) [69]. A LPG is also a wavelength filter, but in this case the filtered wavelengths are not propagated back but rather coupled in evanescent fields through the cladding [70]:
λ B = ( n c o n c l m ) Λ
where λB is the wavelength peak that is coupled into the cladding modes, nco is the refractive index of the core, and n c l m is the effective refractive index of the mth cladding order mode in which the guided light is coupled (Figure 10).
Different vapors and concentrations will produce different change in the spectral response of the LPG based sensors by either modifying the effective index of the cladding or the grating pitch of the core [71-72] (Figure 11).

2.2.2 Active fiber core intrinsic sensors

As the majority of the optical power is guided through the core of the fiber, a possible alternative is use the core itself as the transducer between the organic vapors and the light that travels through it (Figure 12). As mentioned previously, when a sol gel gets dried, its refractive index is similar to that of the fiber, so a segment of optical fiber can be synthesized, and doped with the sensing material which interacts with the gas to detect or monitorized [73]. The main drawback of these sensors is the effect of sol gel aging, which is in this case more critical than in evanescent wave sensors.

2.2.3 Reflection intrinsic sensors

These sensors usually consist of an end-cut optical pigtail, onto which a chemical dye is deposited. This architecture can be interpreted as a particular case of an active core sensor with one extreme not fused with other optical fiber section. As can be seen in Figure 13, the light is coupled from the source and is guided until the sensor head, where the light interacts with the sensing deposition (Figure 14); some transduction process can take place, but the fact is that in all of them, the signal reflected from the chemical deposition is guided back into the optical detector. To achieve this, an optical splitter is necessary to drive the response signal to the detection system. The sensor head employed in this configuration can be used in the same way as chemical electrodes, and so, reflection optical sensors are also named optrodes [74-75], although such optrodes are used mainly to measure concentrations of chemical species.
If an optical property of the sensing dye, such as the refractive index, changes, then a variation in the reflected signal will be registered [76]. The transduction takes place in the light that travels through the core of the fiber, and not in the evanescent field, so the sensing area used is limited to the core surface of the fiber.
A sensitive material has to be fixed onto the end of the optical fiber. As in the case of evanescent wave sensors, one solution commonly used is the dip coating technique of the optical fiber into a sol- gel solution previously doped with the sensing material [51, 53, 77-80].
Plastic matrixes can be also used to fix the sensing material, but they can introduce important optical losses. The main drawback of this solution is the reproducibility, because the dip coating technique generates uniform dyes in a longitudinal way, as in the case of evanescent wave sensors, but in reflective sensors the surface is considerably smaller. Furthermore, the optical fiber is introduced vertically into the sol-gel solution. In many cases, this is traduced in a dye with a non uniform surface, which makes more difficult the interaction between the vapors to detect and the sensing dye (Figure 15). Anyway, practical implementations using for example as Langmuir-Blodgett have been successfully demonstrated [53].
Similar to the Langmuir-Blodgett technique, other techniques exist which permit deposition of layers on a nanometer scale onto a cut-ended fiber, yielding a homogeneous and uniform final structure, such as for example, the Electrostatic Self-Assembly method [81]. This technique is based on the building up of a nanometric structure by opposite charged polymers chains, assembled by electrostatic attraction. The fiber tip is immersed alternately into polycationic and polyanionic solutions. Each time this procedure is carried out an optically homogenous bilayer is deposited (Figure 16). As the final deposition consists of n bilayers of homogeneous refractive index, it can be considered as a nanofilm, that is, a nanocavity, instead of a grating. The gas sensing material has to be added into one or both of the polymeric solutions. The size of each monolayer can be controlled by chemical parameters such as pH, concentration, etc. [82].
When used on optical fiber tips, Fabry-Perot nanocavities with lengths below a micrometer can be built up (Figure 17). These types of interferometric nanocavities have been already used as sensing mechanisms in some optical fiber sensors, changing for example their length or refractive index as a function of the target gas [83-84].
Optical fiber gas sensor based on gratings can also be implemented with the ESA method. Employing a reflection set up, a grating can be constructed onto the cut end of the fiber [72]. The ESA method can be combined with several sensing materials [85-86] sensitive to different gases; The initial requirement for the sensing complexes is that they have to be polar in order be assembled with the charged chains of the polymeric solution where they are added; recently, there has been work trying to overcome this obstacle, and apolar materials have been successfully deposited with the ESA method [83-84].

2.2.4 Hybrid intrinsic sensors

This configuration results from the combination of the ones described before. One possibility consists of an evanescent wave sensor incorporated into a reflection set up: this can be accomplished by modifying the cladding of an optical mirror-ended pigtail (Figure 18). This configuration guarantees that the optical power is modulated twice, first when the light passes through the sensing area to the mirrored end, and secondly, when the signal travels back from the mirror at the end of the fiber to the detector, passing again through the modified cladding region [87]. It is also possible to use a bent evanescent wave mirror-ended sensor.
Another option for hybrid sensors is the combination of an active core fiber with a reflection scheme; as in both cases the modulated light is the one that travels through the fiber, the effect of the active core region is duplicated and that of the deposition onto the cut-end fiber is added to it.
A hybrid sensor can also combine a sensing signal and an architecture not typically used with it. For example, there are some experimental transmissive configurations using the fluorescence produced by a chemical dye replacing the cladding [42].

2.2.5 Fluorescence sensors

This kind of intrinsic sensors can be used either in reflection and transmission schemes, although the most employed is the first one, and its detection principle is different from others such as absorption, transmittance, reflection, etc. described above when explaining the different sensing architectures. These sensors are based on the spontaneous light emission of a fluorophore when it is excited with light at a wavelength (excitation wavelength) located in the absorption spectral region of such fluorophore. The difference in wavelength between both emission (usually higher wavelength) and excitation wavelengths (lower wavelength, thus higher photon energy) is called Stokes shift. In this way, different schemes have been proposed. Among them the most popular are fluorescence intensity sensors, fluorescence lifetime sensors and fluorescence phase-modulation sensors [88]. If the sensing dye interacts with the vapors to be detected, a change in the emission of the dye will be used as the sensing response. The reflection configuration is more suitable in this case because the emission from the dye is coupled to the fiber as if the deposition was a light source [75, 89-90]. Looking ahead to maximize the emitted light coupled to the fiber, some special terminations are built onto the cut-end pigtails, usually tapers [46, 91] (Figure 19). Fluorescence sensors are widely used to detect oxygen, whose presence produces a continuous reversible decreasing change in the fluorescence emission known as quenching [92]. Alternatives to intensity modulation, for example phase modulation, are frequently employed in fluorescence sensors in order to avoid the jittering in the fluorescence and also changes in fluorescence produced by movements of the own fiber [46].

3. More relevant applications and future challenges

There is a wide range of applications where optical fiber sensors can be used. The different sensor configurations mentioned above need to meet some common specifications to be commercialized [93] (Figure 20).
When thinking about more specific requirements in gas sensing, an important requirement is the capability of the sensor to discriminate a specific gas among others, which is known as selectivity. The selectivity of extrinsic optical fiber sensors is mainly governed by the light source wavelength, as described before (WSM); in case of intrinsic sensors, the sensing material together with the chemical and physical properties of the matrix, will determinate the selectivity of the sensor.
Another important parameter is response time (Figure 21). It depends mainly on the sensing chemical dye, primarily in terms of its thickness and physical structure. The organic vapors to detect have to get diffused into the sensitive film. Because of that it is convenient to get a thin and uniform film. Another important parameter is the recovery time. In online monitoring applications, the response and recovery time should be as low as possible, meanwhile in other typical applications, like for example in the determination of the maturing process of fruit, this is not so critical [94].
Sensors with high selectivity are normally used in applications where is necessary to monitor the concentration of a certain gas or organic vapor accurately and in real time (Figure 22). This is very important in areas with highly explosive gases such as methane [20] or hydrogen [43], and in case of toxic gases such as NO2 [77], chloroform vapors [76] or dichloromethane ones [72]. In these cases, special modulation techniques are used to enhance the selectivity of the sensors and hence avoid the effect of other gases. The monitoring of a wide area is frequently suitable in these applications, so these sensors are usually implemented into a network [28], taking advantage of the multiplexation capability that optical fiber offers. When implementing this kind of networks, evanescent wave sensors and extrinsic sensors based on WSM are usually used, performing a multi-point sensing network. There are also examples in which the gas detection is made in a distributed way, with an important spatial resolution [9].
On the other hand, there are sensors with low selectivity, that is, they respond to some vapors, but in different ways. This feature is used in applications where gas mixtures have to be analyzed. For example, many foods or beverages emit several organic vapors during their maturing or fermentation process; these emissions can be analyzed in order to check whether or not the process is been accomplished properly. The idea behind sensor arrays is to mimic the olfactory system present in most animals: this is composed by hundreds of detectors with overlapped selectivities to different gasses, whose whole response results in a unique patron or fingerprint for each gas mixture (Figure 23). Thus, in applications where a complex analysis is required, or in case that a given organic vapor mixture has to be identified, an association of non selective optical fiber sensors can be used, which is commonly known as a sensor array. In these systems, the response of the sensors is mathematically treated in order to identify a given sample, for example, employing Principal Components Analysis (PCA) [95-97] analysis; other possibility is to use Artificial Neural Networks (ANN) [98-99], which are able to identify samples after a learning process. This last approach is used in systems such as electronic noses [94, 100-101]. In the case of wine, a sensor sensitive to alcohols and acetic acid could help to determine whether or not the product is fermenting in the right way [80, 83]. The sensing architecture most employed in sensor arrays is the reflexive one, as in the case of animal noses. Currently, important efforts are focused on the development of optoelectronic noses as an alternative to the artificial noses based on electronic sensors.
Another approach based on sensor arrays that appeared around 10 years ago, are the optical imaging fibers [102]. These sensors are used in a reflection mode, placing hundreds of little sensing beads onto the cut ended optical fiber; around four different kinds of beads are used, each type having a different selectivity and response to the same organic vapors, and then, dozens of copies of the each kind of bead are placed randomly onto the sensor head, forming a color image that is captured by a CCD camera (figure 24). In presence of organic vapors mixtures, the image recorded changes, and using these data as input of an artificial neural network, devices as artificial noses can be implemented [28, 103].

4. Conclusions

An overview of optical fiber sensor technology in the field of volatile organic vapors and gases has been presented. The main sensing mechanisms and architectures have been described paying attention to the different methods of fabrication. In addition, some examples of real applications have been described. Optical fiber sensor technology is still focused on niche markets and the detection of volatile organic compounds could be one application of high interest in environments where the classic electronics sensors cannot operate.

Acknowledgments

This work was supported by Spanish Ministerio de Ciencia y Tecnología and FEDER Research Grants CICYT-TIC 2003-000909 and CICYT-TEC 2004-05936-C02-01/MIC.

References

  1. Lee, B. Review of the present status of optical fiber sensors. Opt. Fiber Technol. 2003, 9, 57–79. [Google Scholar]
  2. Kovacs, G.T. Micromachined Transducers Sourcebook; McGraw-Hill: New York, 1998. [Google Scholar]
  3. Culshaw, B. Research to reality: bringing fibre optic sensors into applications. P. SPIE 2005, 5952, 595201. [Google Scholar]
  4. Culshaw, B. Optical Fiber Sensor Technologies: Opportunities and-Perhaps-Pitfalls. IEEE J. Lightwav. Technol. 2004, 22, 39–50. [Google Scholar]
  5. Spadavecchia, J.; Ciccarella, G.; Rella, R.; Capone, S.; Siciliano, P. Metallophthalocyanines thin films in array configuration for electronic optical nose applications. Sensor. Actuat. B-Chem. 2003, 96, 489–497. [Google Scholar]
  6. Semmelroch, P.; Grosh, W. Studies on Character Impact Odorants of Coffee Brews. J. Agr. Food Chem. 1996, 44, 537–543. [Google Scholar]
  7. Bohnert, K.; Gabus, P.; Kostovic, J.; Brämdle, H. Optical fiber sensors for the electric power industry. Opt. Laser. Eng. 2005, 43, 511–526. [Google Scholar]
  8. Hotate, K. Fiber Sensor Technology Today. Jpn. J. Appl. Phys. 2006, 45, 6616–6625. [Google Scholar]
  9. Sumdia, S.; Okazaki, S.; Asakura, S.; Nakagawa, H.; Murayama, H.; Hasegawa, T. Distributed hydrogen determination with fiber-optic sensor. Sensor. Actuat. B-Chem 2005, 108, 508–514. [Google Scholar]
  10. McKinley, B.A.; Parmley, C.L. Clinical Trial an Ex vivo Arterial Blood Gas Monitor. J. Crit. Care 1998, 13, 190–197. [Google Scholar]
  11. Giuliani, J.F.; Wohltjen, H.; Jarvis, N.L. Reversible optical waveguide sensor for ammonia vapors. Opt. Lett. 1983, 8, 54–56. [Google Scholar]
  12. Matias, I.R.; Arregui, F.J.; Claus, R.O. Optical Fiber Sensors. In Encyclopedia of Sensors; Grimes, C.A., Dickey, E.C., Pishko, M.V., Eds.; American Scientific Publishers: Stevenson Ranch, CA, USA, 2006; Vol. 9, pp. 1–19. [Google Scholar]
  13. Culshaw, B. Fiber optics in sensing and measurement. IEEE J. Sel. Top. Quant. 2000, 6, 1014–1021. [Google Scholar]
  14. Udd, E. Fiber Optic Sensors; Wiley: USA, 1992. [Google Scholar]
  15. Spooncer, R.C. Handbook of Measurement Science; Wiley: Chichester, UK, 1992. [Google Scholar]
  16. Culshaw, B.; Stewart, G.; Dong, F.; Tandy, C.; Moodie, D. Fibre optic techniques for remote spectroscopic methane detection-from concept to system realisation. Sensor. Actuat. B-Chem. 1998, 51, 25–37. [Google Scholar]
  17. Chambers, P.; Austin, E. A. D.; Dakin, J.P. Theoretical analysis of methane gas detection system, using the complementary source modulation method of correlation spectroscopy. Meas. Sci. Tech. 2004, 15, 1629–1636. [Google Scholar]
  18. Stewart, G.; Tandy, C.; Moodie, D.; Morante, M.A.; Dong, F. Design of a fibre optic multi-point sensor for gas detection. Sensor. Actuat. B-Chem 1998, 51, 227–232. [Google Scholar]
  19. Ho, H.L.; Jin, W.; Yu, H.B.; Chan, K.C.; Chan, C.C.; Demokan, M.S. Experimental demonstration of a Fiber-Optic Gas Sensor Network Addressed by FMCW. IEEE Photon. Tech. Lett. 2000, 12, 1546–1548. [Google Scholar]
  20. Whitenett, G.; Stewart, G.; Atherton, K.; Culshaw, B.; Johnstone, W. Optical fibre instrumentation for environmental monitoring applications. J. Opt. A-Pure Appl. Opt. 2003, 5, S140–S145. [Google Scholar]
  21. Cheung, A.; Johnstone, W.; Moodie, D. Gas detection based on optical correlation spectroscopy using a single light source. Meas. Sci. Tech. 2006, 17, 1107–1112. [Google Scholar]
  22. Xiao, G.Z.; Adnet, A.; Zhang, Z.; Sun, F.G.; Grover, C.P. Monitoring changes in the refractive index of gases by means of a fiber optic Fabry-Perot interferometer sensor. Sensor. Actuat. A-Phys. 2005, 118, 177–182. [Google Scholar]
  23. Christie, S.; Scorsone, E.; Persaud, K.; Kvasnik, F. Remote detection of gaseous ammonia using near infrared transmission properties of polyaniline. Sensor. Actuat. B-Chem. 2003, 90, 163–169. [Google Scholar]
  24. Kondratowicz, B.; Narayanaswamy, R.; Persaud, K.C. An investigation into the use of electrochromic polymers in optical fibre gas sensors. Sensor. Actuat. B-Chem. 2001, 74, 138–144. [Google Scholar]
  25. Akarajas, A.U.; Mat, Salleh M.; Yahaya, M. Enriching the selectivity of metalloporphyrins chemical sensors by means of optical technique. Sensor. Actuat. B-Chem. 2002, 85, 191–196. [Google Scholar]
  26. Khijwania, S.K.; Gupta, B.D. Fiber optic evanescent field absorption sensor with high sensitivity and linear dynamic range. Opt. Commun. 1998, 152, 259–262. [Google Scholar]
  27. Khalil, S.; Bansal, L.; El-Sherif, M. Intrinsic fiber optic chemical sensor for the detection of dimethyl methylphosphonate. Opt. Eng. 2004, 43, 2683–2688. [Google Scholar]
  28. Dickinson, T.A.; Michael, K.L.; Kauer, J.S.; Walt, D.R. Convergent, Self-Encoded Bead Sensor Arrays in the design of an Artificial Nose. Anal. Chem. 1999, 71, 2192–2198. [Google Scholar]
  29. Yuan, J.; El-Sherif, A. Fiber-Optic Chemical Sensor Using Polyaniline as Modified Cladding Material. IEEE Sensor. J. 2003, 3, 5–12. [Google Scholar]
  30. Messica, A.; Greenstein, A.; Katzir, A. Theory of fiber-optic, evanescent-wave spectroscopy and sensors. Appl. Opt. 1996, 35, 2274–2284. [Google Scholar]
  31. Schwotzer, G.; Latka, I.; Lehmann, H.; Willsch, R. Optical sensing of hydrocarbons in air or in water using UV absorption in the evanescent field of fibers. Sensor. Actuat. B-Chem. 1997, 38-39, 150–153. [Google Scholar]
  32. Shadaram, M.; Espada, L.; Garcoa, F. Modeling and performance evaluation of ferrocene-based polymer clad tapered optical fiber gas sensors. Opt. Eng. 1998, 37, 1124–1129. [Google Scholar]
  33. Barmenkov, Y.O. Time-domain fiber laser hydrogen sensor. Opt. Lett. 2004, 29, 2461–2463. [Google Scholar]
  34. Lacroix, S.; Bourbonnais, R.; Gonthier, F.; Bures, J. Tapered monomode optical fibers: understanding large power transfer. Appl. Opt. 1986, 25, 4421–4425. [Google Scholar]
  35. Willer, U.; Scheel, D.; Kostjucenko, I.; Bohling, C.; Schade, W.; Faber, E. Fiber-optic evanescent-field laser sensor for in-situ gas diagnostics. Spectrochim. Acta A 2002, 58, 2427–2432. [Google Scholar]
  36. Senosiain, J.; Díaz, I.; Gastón, A.; Sevilla, J. High Sensitivity Temperature Sensor Based on Side-Polished Optical Fiber. IEEE Trans. Instrum. Meas. 2001, 50, 1656–1660. [Google Scholar]
  37. Gastón, A.; Pérez, F.; Sevilla, J. Optical fiber relative-humidity sensor with polyvinyl alcohol film. Appl. Opt. 2004, 43, 4127–4132. [Google Scholar]
  38. Gastón, A.; Lozano, I.; Pérez, F.; Auza, F.; Sevilla, J. Evanescent Wave Optical-Fiber Sensing (Temperature, Relative Humidity and pH Sensors). IEEE Sensor. J. 2003, 3, 806–811. [Google Scholar]
  39. Segawa, H.; Ohnishi, E.; Arai, Y.; Yoshida, K. Sensitivity of fiber-optic carbon dioxide sensors utilizing indicator dye. Sensor. Actuat. B-Chem. 2003, 94, 276–281. [Google Scholar]
  40. Cherif, K.; Mrazek, J.; Hleli, S.; Matejec, V.; Abdelghani, A.; Chomat, M.; Jaffrezic-Renault, N.; Kasik, I. Detection of aromatic hydrocarbons in air and water by using xerogel layers coated on PCS fibers excited by an inclined collimated beam. Sensor. Actuat. B-Chem. 2003, 95, 97–106. [Google Scholar]
  41. Malis, C.; Landl, M.; Simon, P.; MacCraith, B.D. Fiber optic ammonia sensing employing novel near infrared dyes. Sensor. Actuat. B-Chem. 1998, 51, 359–367. [Google Scholar]
  42. Potyrailo, R.A.; Hieftje, G.M. Oxygen detection by fluorescence quenching of tetraphenylporphyrin immobilized in the original cladding of an optical fiber. Anal. Chim. Acta 1998, 370, 1–8. [Google Scholar]
  43. Okazaki, S.; Nakagawa, H.; Asakura, S.; Tomiuchi, Y.; Tsuji, N.; Murayama, H.; Washiya, M. Sensing Characteristics of an optical fiber sensor for hydrogen leak. Sensor. Actuat. B-Chem. 2003, 93, 142–147. [Google Scholar]
  44. Scorsone, E.; Christie, S.; Persaud, K.C.; Simon, P.; Kvasnik, F. Fibre-optic evanescent sensing of gaseous ammonia with two forms of a new near-infrared dye in comparison to phenol red. Sensor. Actuat. B-Chem. 2003, 90, 37–45. [Google Scholar]
  45. Sekimoto, S.; Nakagawa, H.; Okazaki, S.; Fukuda, K.; Asakura, S.; Shigemori, T.; Takahashi, S. A Fiber-optic evanescent-wave hydrogen gas sensor using palladium-supported tungsten oxide. Sensor. Actuat. B-Chem. 2000, 66, 142–145. [Google Scholar]
  46. Jorge, P.A.S.; Caldas, P.; Rosa, C.C.; Oliva, A.G.; Santos, J.L. Optical fiber probes for fluorescente based oxygen sensing. Sensor. Actuat. B-Chem. 2004, 130, 290–299. [Google Scholar]
  47. Grant, S.A.; Satcher, J.H., Jr.; Bettencourt, K. Development of sol-gel-based fiber nitrogen dioxide gas sensors. Sensor. Actuat. B-Chem. 2000, 69, 132–137. [Google Scholar]
  48. Abdelghani, A.; Chovelon, J.M.; Jaffrezic-Renault, N.; Lacroix, M.; Gagnaire, H.; Veillas, C.; Berkova, B.; Chomat, M.; Matejec, V. Optical fibre sensor coated with porous silica layers for gas and chemical vapour detection. Sensor. Actuat. B-Chem. 1997, 44, 495–498. [Google Scholar]
  49. Abdelmalek, F.; Chovelon, J.M.; Lacroix, M.; Jaffrezic-Renault, N.; Matajec, V. Optical fibre sensors sensitized by phenyl-modified porous silica prepared by sol-gel. Sensor. Actuat. B-Chem. 1999, 56, 234–242. [Google Scholar]
  50. Bariain, C.; Matias, I.R.; Romeo, I.; Garrido, J.; Laguna, M. Detection of volatile organic compund vapors by using a vapochromic material on a tapered optical fiber. Appl. Phys. Lett. 2000, 77, 2274–2276. [Google Scholar]
  51. Bariain, C.; Matias, I.R.; Romeo, I.; Garrido, J.; Laguna, M. Behavioral experimental studies of a novel vapochromic material towards development of optical fiber organic compounds sensor. Sensor. Actuat. B-Chem. 2001, 76, 25–31. [Google Scholar]
  52. Hu, W.; Liu, Y.; Xu, Y.; Liu, S.; Zhou, S.; Zeng, P.; Zhu, D.B. The gas sensitivity of Langmuir-Blodgett films of a new asymmetrically substituted phthalocyanine. Sensor. Actuat. B-Chem. 1999, 56, 228–233. [Google Scholar]
  53. Bariain, C.; Matias, I.R.; Fernandez-Valdivielso, C.; Arregui, F.J.; Rodríguez-Méndez, M.L.; De Saja, J.A. Optical fiber sensor based on lutetium bisphthalocyanine for the detection of gases using standard telecommunication wavelengths. Sensor. Actuat. B-Chem. 2003, 93, 153–158. [Google Scholar]
  54. Gutierrez, N.; Rodríguez-Méndez, M.L.; De Saja, J.A. Array of sensors based on lanthanide bisphthalocyanine Langmuir-Blodgett films for the detection of olive oil aroma. Sensor. Actuat. B-Chem. 2001, 77, 437–442. [Google Scholar]
  55. Khijwania, S.K.; Gupta, B.D. Maximum achievable sensitivity of the fiber optic evanescent field absorption sensor based on the U-shaped probe. Opt. Comm. 2000, 175, 135–137. [Google Scholar]
  56. Khijwania, S.K.; Gupta, B.D. Fiber optic evanescent field absorption sensor: Effect of fiber parameters and geometry of the probe. Opt. Quant. Electron. 1999, 31, 625–636. [Google Scholar]
  57. Otsuki, S.; Adachi, K.; Taguchi, T. A novel fiber-optic gas-sensing configuration using extremely curved optical fibers and an attempt for optical humidity detection. Sensor. Actuat. B-Chem. 1998, 53, 91–96. [Google Scholar]
  58. Tao, S.; Xu, L.; Fanguy, J.C. Optical fiber ammonia sensing probes using reagent immobilized porous silica coating as transducers. Sensor. Actuat. B-Chem. 2006, 115, 158–163. [Google Scholar]
  59. Scorsone, E.; Christie, S.; Persaud, K.C.; Kvasnik, F. Evanescent sensing of alkaline and acidic vapours using a plastic clad silica fibre doped with poly(o-methoxyaniline). Sensor. Actuat. B-Chem. 2004, 97, 174–181. [Google Scholar]
  60. Peng, W.; Pickrell, G.R.; Shen, F.; Wang, A. Experimental Investigation of Optical Waveguide-Based Multigas Sensing. IEEE Photon. Tech. Lett. 2004, 16, 2317–2319. [Google Scholar]
  61. Matias, I.R.; Bravo, J.; Arregui, F.J.; Corres, J.M. Nanofilms onto a hollow core fiber. Opt. Eng. Lett. 2006, 45, 050503-1–3. [Google Scholar]
  62. Hoo, Y.L.; Jin, W.; Wang, D.N. Evanescent-wave gas sensing microstructure fiber. Opt. Eng. 2002, 41, 8–9. [Google Scholar]
  63. Hoo, Y.L.; Jin, W.; Ho, H.L.; Wang, D.N. Measurement of Gas Diffusion Coefficient Using Photonic Crystal Fiber. IEEE Photon. Tech. Lett. 2003, 15, 1434–1436. [Google Scholar]
  64. Charlton, C.; Temelkuran, B.; Dellemann, G. Midinfrared sensors meet nanotechnology: Trace gas sensing with quantum cascade laser inside photonic band-gap hollow waveguides. Appl. Phys. Lett. 2005, 86, 194102. [Google Scholar]
  65. Konorov, S.O.; Fedetov, A.B.; Zheltikov, A.M. Phase. Phase-Matched four-wave mixing and sensing of water molecules by coherent anti-stokes Raman scattering in large-core-area hollow photonic-crystal fibers. Opt. Soc. Am. 2005, 22, 2049–2053. [Google Scholar]
  66. Hoo, Y.L.; Jin, W.; Ho, H.L.; Ju, J.; Wang, D.N. Gas diffusion measurement using hollow-core photonic bandgap fiber. Sensor. Actuat. B-Chem. 2005, 105, 183–186. [Google Scholar]
  67. Arregui, F.J.; Claus, R.O.; Cooper, K.L.; Fernandez-Valdivielso, C.; Matias, I.R. Optical Fiber Gas Sensor Based on Self-Assembled Gratings. J. Lightwav. Technol. 2001, 19, 1932–1937. [Google Scholar]
  68. Shinquan, T.; Winstead, C.B.; Jindal, R.; Singh, J.P. Optical-Fiber Sensor Using Tailored Porous Sol-Gel Fiber Core. IEEE Sensor. J. 2004, 4, 322–328. [Google Scholar]
  69. Othenos, A.; Kalli, K. Fiber Bragg Gratings; Artech House: Norwood and London, 1999. [Google Scholar]
  70. Maier, R.R.J.; Barton, J.S.; Jones, J.D.C.; McCulloch, S.; Jones, B.J.S.; Burnell, G. Palladium-based hydrogen sensing for monitoring of ageing materials. Meas. Sci. Technol. 2006, 17, 1118–1123. [Google Scholar]
  71. Wu, X.; Li, S.; Zhang, G.; Zhang, Z. Optical fiber sensor monitoring fault gas based on modulated fiber grating model filter. Proc. SPIE 1998, 3538, 147–154. [Google Scholar]
  72. Luo, S.; Liu, Y.; Sucheta, A.; Evans, M.; Tassell, R. Applications to LPG fiber optical sensors for relative humidity and chemical warfare agents monitoring. Proc. SPIE 2002, 4920, 193–204. [Google Scholar]
  73. Falate, R.; Kamikawachi, R.C.; Müller, M.; Kalinowski, H.J.; Fabris, J.L. Fiber optic sensors for hydrocarbon detection. Sensor. Actuat. B-Chem. 2005, 105, 430–436. [Google Scholar]
  74. Neurauter, G.; Klimant, I.; Wolfbeis, O.S. Fiber-optic microsensor for high resolution pCO2 sensing in marine environment. Fresen. J. Anal. Chem. 2000, 366, 481–487. [Google Scholar]
  75. Wolfbeis, O.S.; Kovacs, B.; Goswami, K.; Klainer, S.M. Fiber-Optic Fluorescence Carbon Dioxide Sensor for Environmental Monitoring. Mikrochim. Acta 1998, 129, 181–188. [Google Scholar]
  76. Giordano, M.; Russo, M.; Cusano, A.; Mensitieri, G. An high sensivity optical sensor for chloroform vapours detection base don nanometric film of δ-form syndiotactic polystyrene. Sensor. Actuat. B-Chem. 2005, 107, 140–147. [Google Scholar]
  77. Mechery, S.J.; Singh, J.P. Fiber optic based gas sensor with nanoporous structure for the selective detection of NO2 in air samples. Anal. Chim. Acta 2006, 557, 123–129. [Google Scholar]
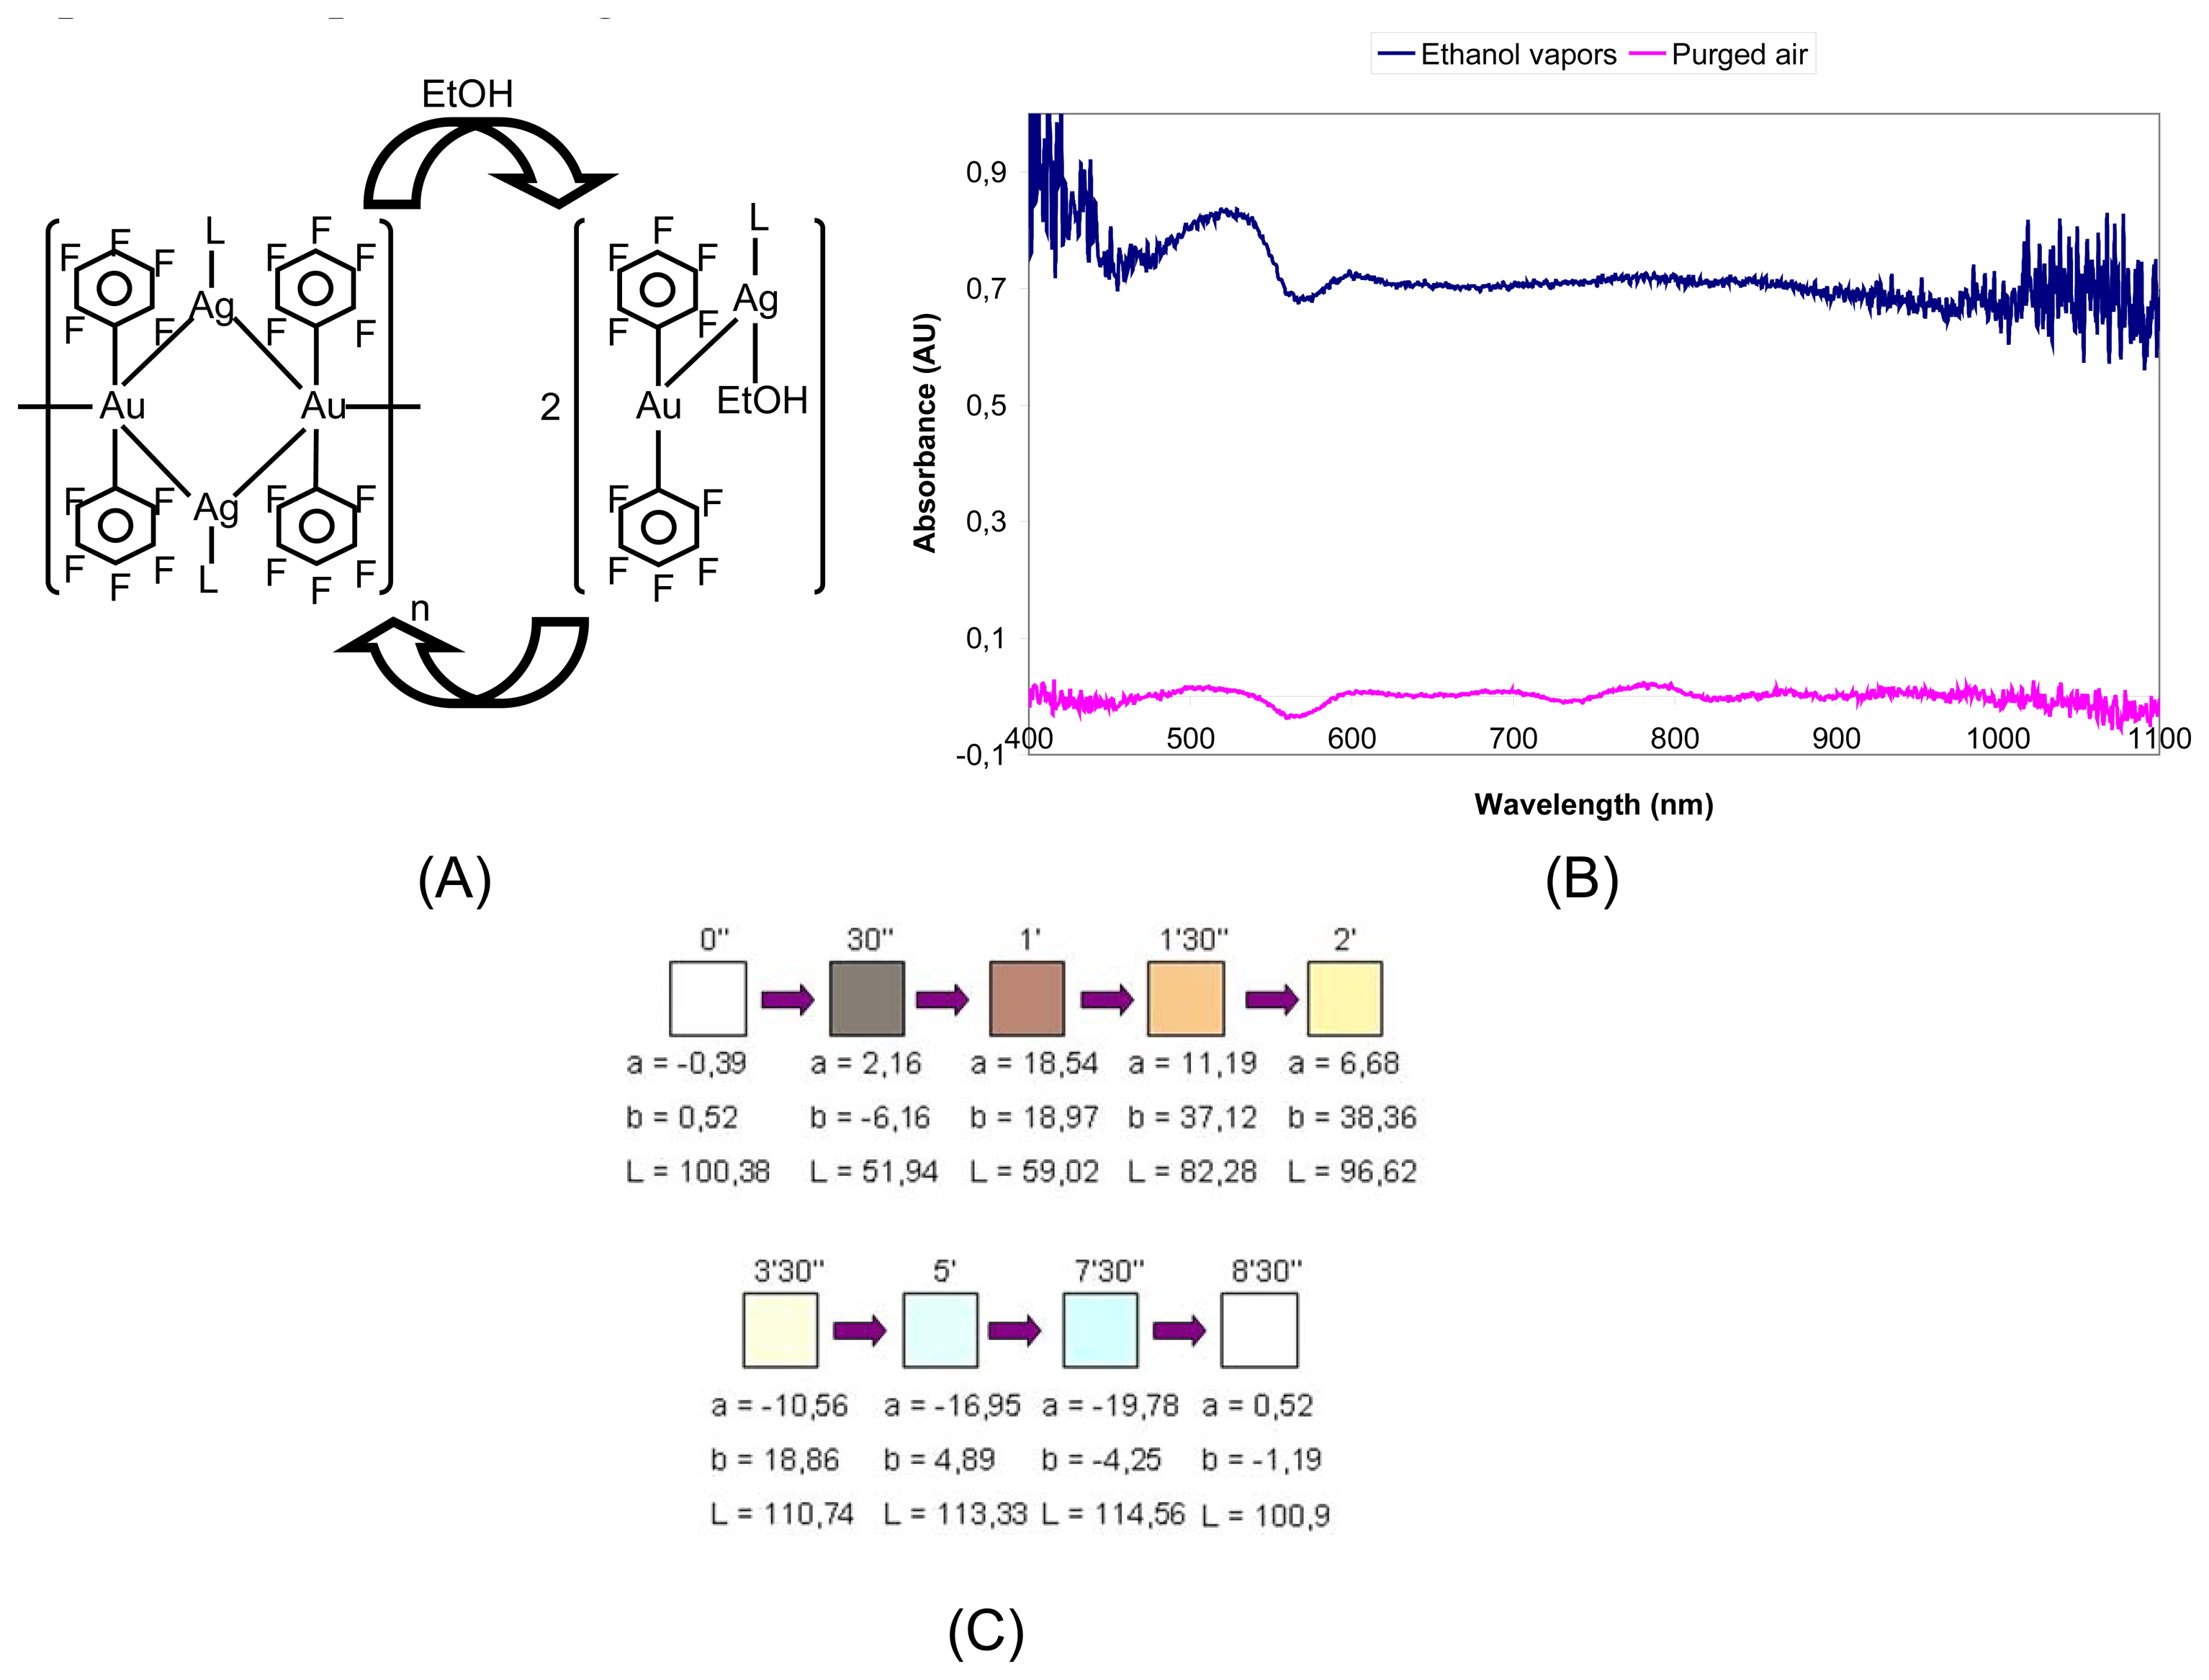
  78. Luquin, A.; Bariain, C.; Vergara, E.; Cerrada, E.; Garrido, J.; Matias, I.R.; Laguna, M. New preparation of gold-silver complexes and optical fibre environmental sensors based on vapochromic [Au2Ag2(C6F5)4(phen)2]n. Appl. Organomet. Chem. 2005, 19, 1232–1238. [Google Scholar]
  79. Bariain, C.; Matias, I.R.; Fernandez-Valdivielso, C.; Elosua, C.; Luquin, A.; Garrido, J.; Laguna, M. Optical fibre sensor base don vapochromic gold complexes for environmental applications. Sensor. Actuat. B-Chem. 2005, 108, 535–541. [Google Scholar]
  80. Casado, S.; Elosua, C.; Bariain, C.; Segura, A.; Matias, I.R.; Fernandez, A.; Luquin, A.; Garrido, J.; Laguna, M. Volatile-organic-compound optic fiber sensor using a gold-silver vapochromic complex. Opt. Eng. 2006, 45, 044401. [Google Scholar]
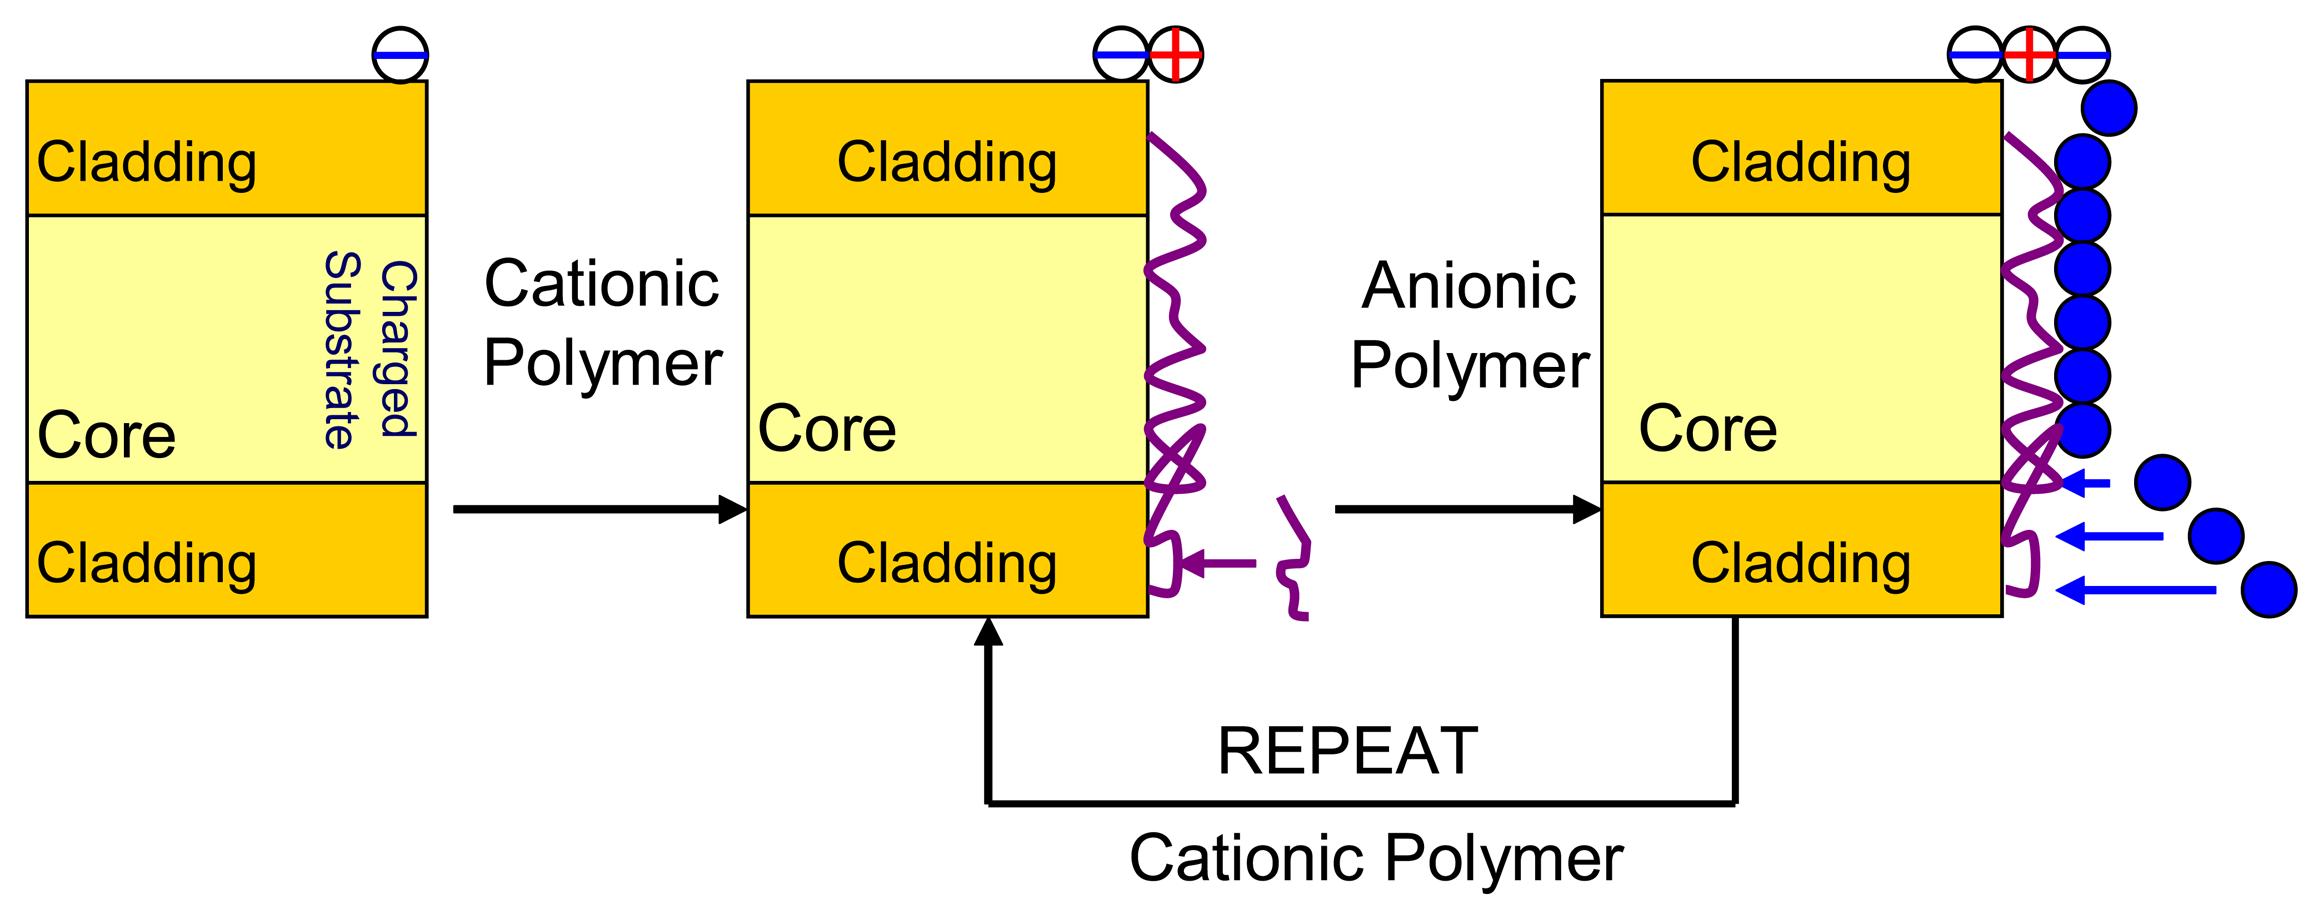
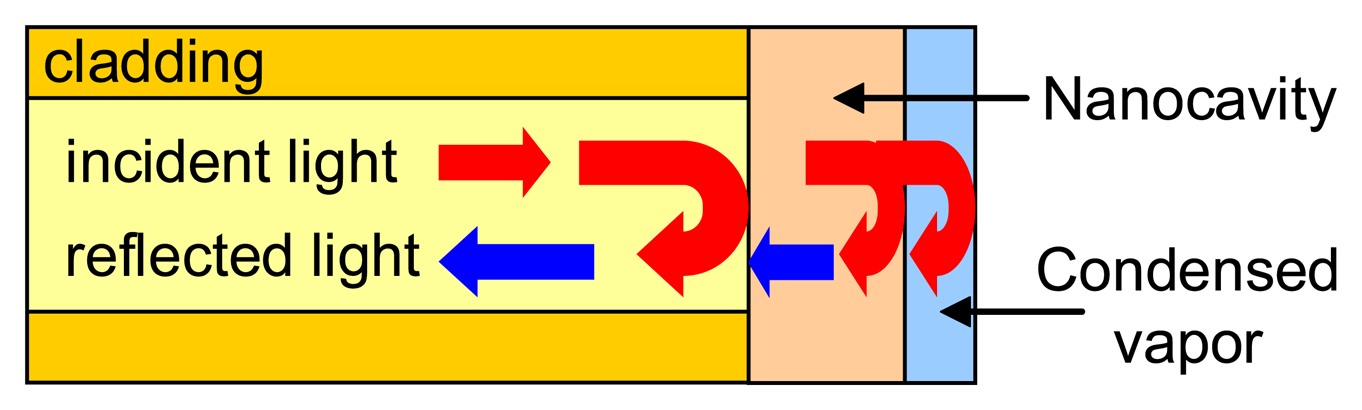
  81. Arregui, F.J.; Matias, I.R.; Liu, Y.; Lenahan, M.; Claus, R.O. Optical fiber nanometer-scale Fabry-Perot interferometer formed by the ionic self-assembly monolayer process. Opt. Lett. 1999, 24, 596–598. [Google Scholar]
  82. Choi, J.; Rubner, M.F. Influence of the degree of ionization on weak polyelectrolyte multilayer assembly. Macromolecules 2005, 38, 124–166. [Google Scholar]
  83. Elosua, C.; Bariain, C.; Matias, I.R.; Arregui, F.J.; Luquin, A.; Laguna, M. Volatile alcoholic compunds fibre optic nanosensor. Sensor. Actuat. B-Chem. 2006, 115, 444–449. [Google Scholar]
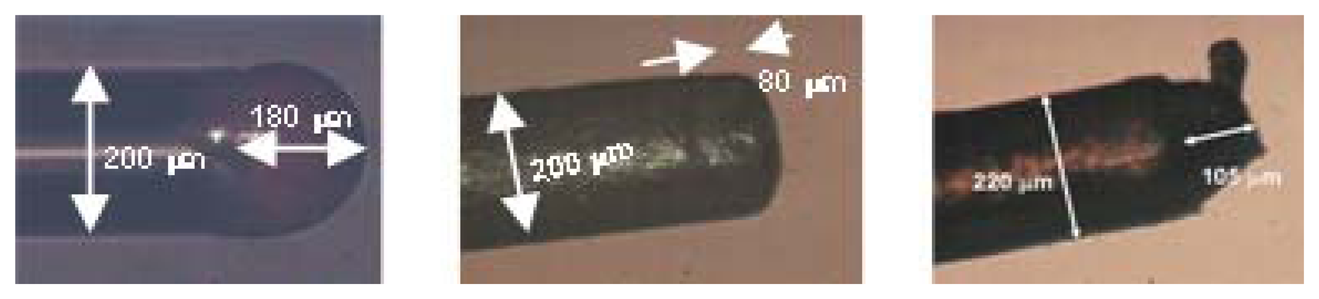
  84. Elosua, C.; Matias, I.R.; Bariain, C.; Arregui, F.J. Development of an In-Fiber Nanocavity Towards Detection of Volatile Organic Gases. Sensors 2006, 6, 578–592. [Google Scholar]
  85. Galbarra, D.; Arregui, F.J.; Matias, I.R.; Claus, R.O. Ammonia optical fiber sensor based on self-assembled zirconia thin films. Smart Mater. Struct. 2005, 14, 739–744. [Google Scholar]
  86. Arregui, F.J.; Matias, I.R.; Claus, R.O. Optical Fiber Gas Sensor Based on Hydrophobic Alumina Thin Films Formed by the Electrostatic Self-Assembly Monolayer Process. IEEE Sensor. J. 2003, 3, 56–61. [Google Scholar]
  87. Mitsubayashi, K.; Kon, T.; Hashimoto, Y. Optical bio-sniffer for ethanol using an oxygen-sensitive optical fiber. Biosens. Bioelectron. 2003, 19, 193–198. [Google Scholar]
  88. Mitsubayashi, K.; Minamide, T.; Otsuka, K.; Kudo, H.; Saito, H. Optical bio-sniffer for methyl mercaptan in halitosis. Anal. Chim. Acta 2006, 573-573, 75–80. [Google Scholar]
  89. Kim, Y.C.; Peng, W.; Banerji, S.; Booksh, K.S. Tapered fiber optic surface plasmon resonance sensor for analyses of vapor and liquid phases. Opt. Lett. 2005, 30, 2218–2220. [Google Scholar]
  90. O'Neal, P.D.; Meledeo, A.; Davis, J.R.; Ibey, B.L.; Gant, V.A.; Pishko, M.V.; Cote, G.L. Oxygen Sensor Based on the Fluorescence Quenching of a Ruthenium Complex Immobilized in a Biocompatible Poly(Ethylene Glycol) Hydrogel. IEEE Sensor. J. 2004, 4, 728–734. [Google Scholar]
  91. Moreno, J.; Arregui, F.J.; Matias, I.R. Fiber optic ammonia sensing employing novel thermoplastic polyurethane membranes. Sensor. Actuat. B-Chem. 2005, 105, 419–424. [Google Scholar]
  92. Grattan, K.T.V.; Zhang, Z.Y. Fiber Optic Fluorescence Thermometry; Chapman & Hall: London, 1995. [Google Scholar]
  93. Dybko, A. Errors in Chemical Sensor Measurements. Sensors 2001, 1, 29–37. [Google Scholar]
  94. Boilot, P.; Hines, E.L.; Gongora, M.A.; Folland, R.S. Electronic noses inter-comparison, data fusion and sensor selection in discrimination of standard fruit solutions. Sensor. Actuat. B-Chem. 2003, 88, 80–88. [Google Scholar]
  95. Taurino, A.M.; Distante, C.; Siciliano, P.; Vasanelli, L. Quantitative and qualitative analysis of VOCs mixtures by means of a microsensors array and different evaluation methods. Sensor. Actuat. B-Chem. 2003, 93, 117–125. [Google Scholar]
  96. Pardo, M.; Sberveglieri, G.; Gardini, S.; Dalcanale, E. A hierarchical classification scheme for an Electronic Nose. Sensor. Actuat. B-Chem. 2000, 69, 359–365. [Google Scholar]
  97. Pardo, M.; Niederjaufner, G.; Benussi, G.; Comini, E.; Faglia, G.; Sberveglieri, G.; Holmberg, M.; Lundstrom, I. Data preprocessing enhances the classification of different brands of Espresso coffee with an electronic nose. Sensor. Actuat. B-Chem. 2000, 69, 397–403. [Google Scholar]
  98. Luo, D.; Hosseini, H.G.; Stewart, J.R. Application of an ANN with extracted parameters from an electronic nose in cigarette brand identification. Sensor. Actuat. B-Chem. 2004, 99, 253–257. [Google Scholar]
  99. Zhang, H.; Blaban, M.O.; Principe, J.C. Improving pattern recognition of electronic nose data with time-delay neural networks. Sensor. Actuat. B-Chem. 2003, 96, 385–389. [Google Scholar]
  100. Carmel, L.; Seve, N.; Lancet, D.; Harel, D. An eNose algorithm for identifying chemicals and determinig their concentration. Sensor. Actuat. B-Chem. 2003, 93, 77–83. [Google Scholar]
  101. Brudzewski, K.; Osowski, S.; Markiewicz, T. Classification of milk by means of an electronic nose and SVM neural network. Sensor. Actuat. B-Chem. 2004, 98, 291–298. [Google Scholar]
  102. Walt, D.R.; Dickinson, T.; White, J.; Kauer, J.; Stephen, J.; Engelhardt, H.; Sutter, J.; Jurs, P. Optical sensor arrays for odor recognition. Biosens. Bioelectron. 1999, 13, 697–699. [Google Scholar]
  103. Bakken, G.A.; Kauffman, G.W.; Jurs, P.C.; Albert, K.J.; Stitzel, S.S. Pattern recognition analysis of optical sensor array data to detect nitroaromatic compounds vapors. Sensor. Actuat. B-Chem. 2001, 79, 1–10. [Google Scholar]
Figure 1. Principal fields where VOC sensors have many applications, and species usually measured.
Sensors 06 01440f1
Figure 2. Examples of optical fiber sensor networks: (a) line, (b) star, (c) ladder, (d) tree.
Sensors 06 01440f2
Figure 3. Differences between extrinsic and intrinsic configurations.
Sensors 06 01440f3
Figure 4. (A) Extrinsic optical fiber sensor; (B) One of the absorption spectral lines of methane is located at a optical fiber low transmission losses wavelength range (third telecommunication window).
Sensors 06 01440f4
Figure 5. Extrinsic sensors where Light interacts with a chemical dye: in (A), the optical signal passes through the dye, while in (B) the reflected light from the plate is coupled back into the fiber.
Sensors 06 01440f5
Figure 6. Transmission set up with a tapered optical fiber based evanescent wave sensor.
Sensors 06 01440f6
Figure 7. Main construction steps of Langmuir Blodgett deposition technique. This process is very useful when fixing layers onto uniform surfaces.
Sensors 06 01440f7
Figure 8. U - Shaped evanescent wave sensor probe.
Sensors 06 01440f8
Figure 9. Hollow core fiber with microstructurated cladding, connected between two standard multimode optical fiber sections. A sensitive material can be also fixed onto the cladding.
Sensors 06 01440f9
Figure 10. Schematic working principles of (a) FBGs and (b) LPG. As in LPG light is coupled into the cladding, this device is suitable for evanescent wave sensors.
Sensors 06 01440f10
Figure 11. Dichloromethane fiber optic sensor based on a micrograting located at the end of the fiber. Spectral response of the sensor to different concentrations of dichloromethane in (a) purged air; (b) 7.18 mmol/L and (c) 19.44 mmol/L (saturated atmosphere). Notice that there is no variation at 1520 nm and this wavelength can be used as a reference signal [72].
Sensors 06 01440f11
Figure 12. Active core optical fiber sensor.
Sensors 06 01440f12
Figure 13. Reflection experimental set up.
Sensors 06 01440f13
Figure 14. Example of a sensing material: (a) the complex suffers a reversible change in its structure in presence of ethanol vapors, (b) this can be measured in terms of color change registering the absorbance spectra when illuminating it with a white light source, (c) and CIELab, L, a, b, parameters of the color of the reflected signal can be also used to probe the optical change.
Sensors 06 01440f14
Figure 15. Optical fiber tips dip coated in sol-gel. The deposition is uniform through the cladding but irregular on the cut-ended extreme.
Sensors 06 01440f15
Figure 16. ESA method schematic construction process.
Sensors 06 01440f16
Figure 17. Interferometric sensor developed with ESA method. The vapors to detect get trapped onto the surface of the nano cavity, modifying its length and hence the interferometric response.
Sensors 06 01440f17
Figure 18. This configuration, compared to the classic transmission one, enhances the sensing performance of the sensors because the incident light passes twice through the sensing zone due to the mirrored end. Also, the size of the sensor head is reduced [87].
Sensors 06 01440f18
Figure 19. (A) Reflection fluorescence sensor based on a tapered end fiber. (B) Spectral response from a sensor based on fluorescence. The reflected optical power of the excitation light and the fluorescent signal emitted by the sensing material are monitored by a spectrometer. It is desirable that the fluorescence wavelength is located as far as possible from the excitation one - this would be high Stokes shift.
Sensors 06 01440f19
Figure 20. Alcohol vapors sensor exposed to cycles of varying relative humidity at different temperatures. The response of the device shows little variation, which is usually suitable.
Sensors 06 01440f20
Figure 21. Response of two ethanol sensors. Sensor (a) shows a higher dynamic range, sensor (b) has lower dynamic range, but their response time is less than one minute.
Sensors 06 01440f21
Figure 22. Spectral response of an ammonia sensor based on nanostructurated Zirconia films [85]. A negligible variation of the reflected optical power is registered in the presence of other VOCs.
Sensors 06 01440f22
Figure 23. Characterization of a non selective sensor in terms of: (a) absorbance spectra when exposed to different organic vapors; (b) reflected optical power variation with different methanol concentrations; (c) calibration curves for some VOCs based on (b) measurements.
Sensors 06 01440f23
Figure 24. Scheme of an image array sensor.
Sensors 06 01440f24

