Mathematical Modelling of the Electrode Process of Azithromycin Using Cyclic Voltammetry at Hanging Mercury Drop Electrode

Abstract
:Introduction
Experimental
Chemical and Reagents
Instruments and Apparatus
Procedure
Theory


 is the bulk concentration of the reactant initially present, ro is the radius of the mercury drop, n is the number of electrons involved in the reaction, F is the Faraday constant, Eo is the formal reduction potential of the reactant, and E is the potential of the electrode which can be related to the scan rate, ν, as in equations (10) and (11).


 and
and  (mole/ cm2) are the saturation concentrations of the reactant and the product initially present, which cover the monolayer of the electrode surface. The terms ko and kr are constants that depend on the electrode potential.


Results and Discussion


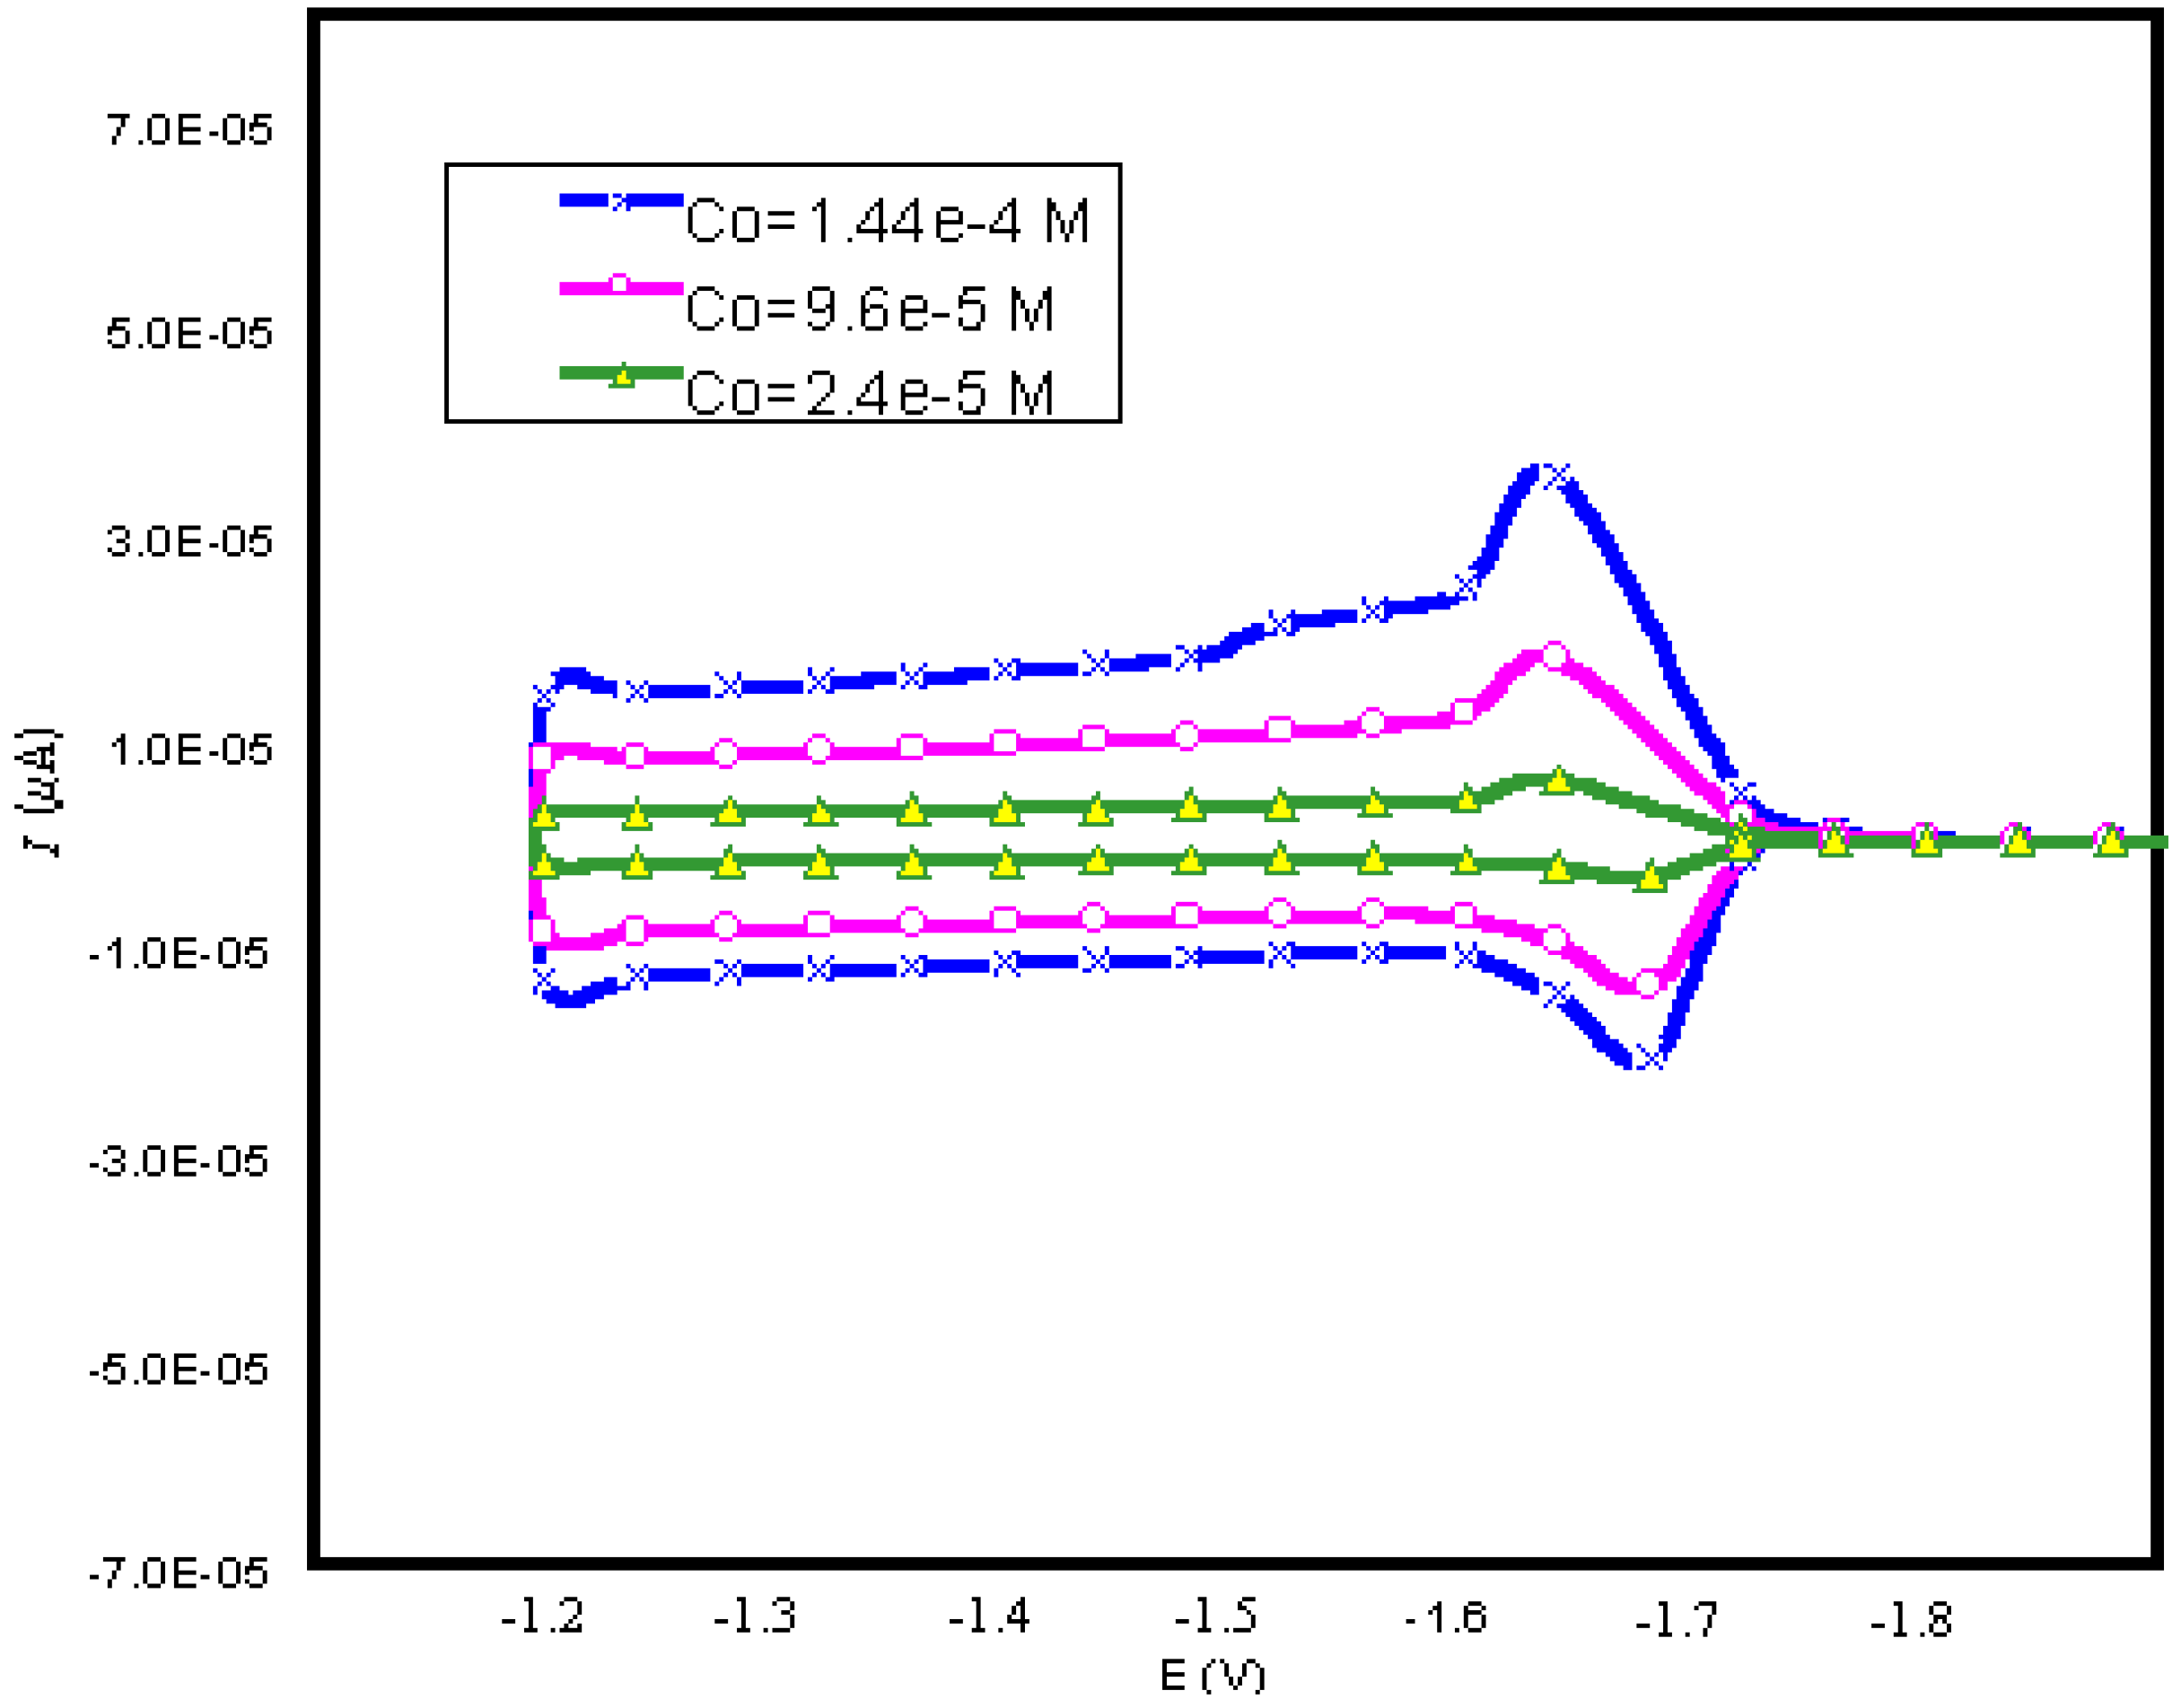
| CONCENTRATION (M) | KO | KR | qo (mol/cm2) | qR (mol/cm2) |
|---|---|---|---|---|
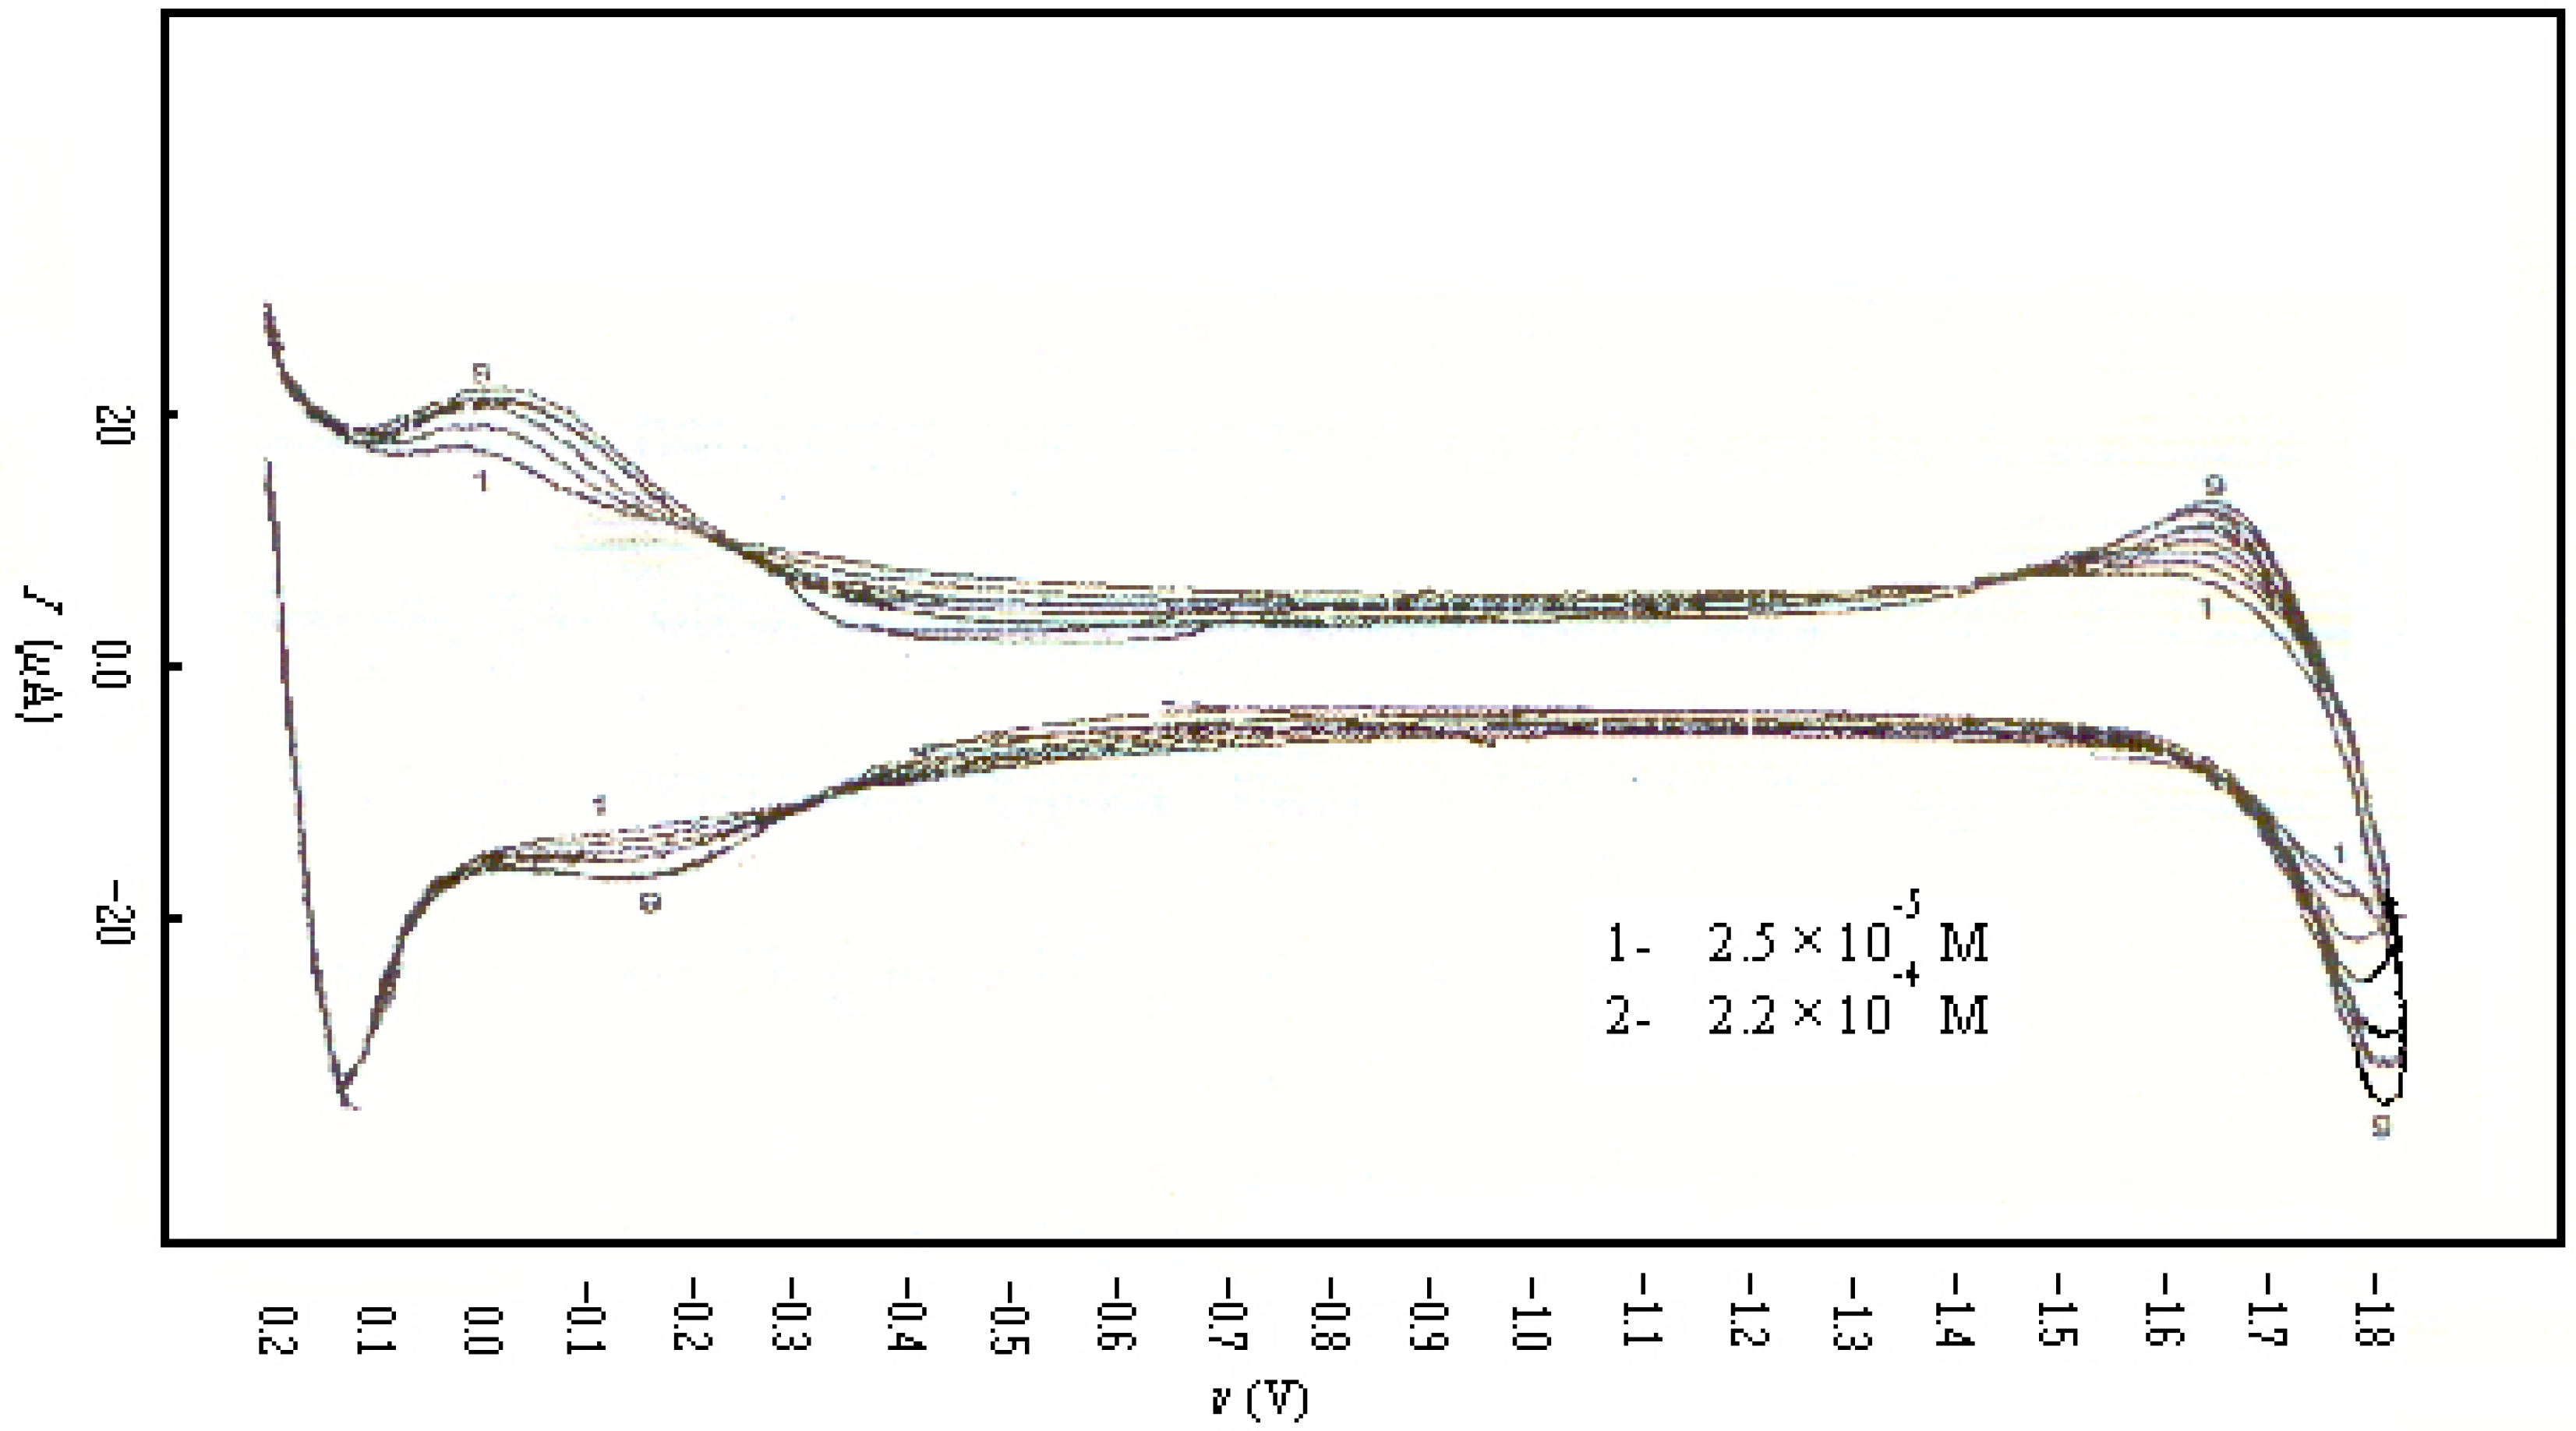
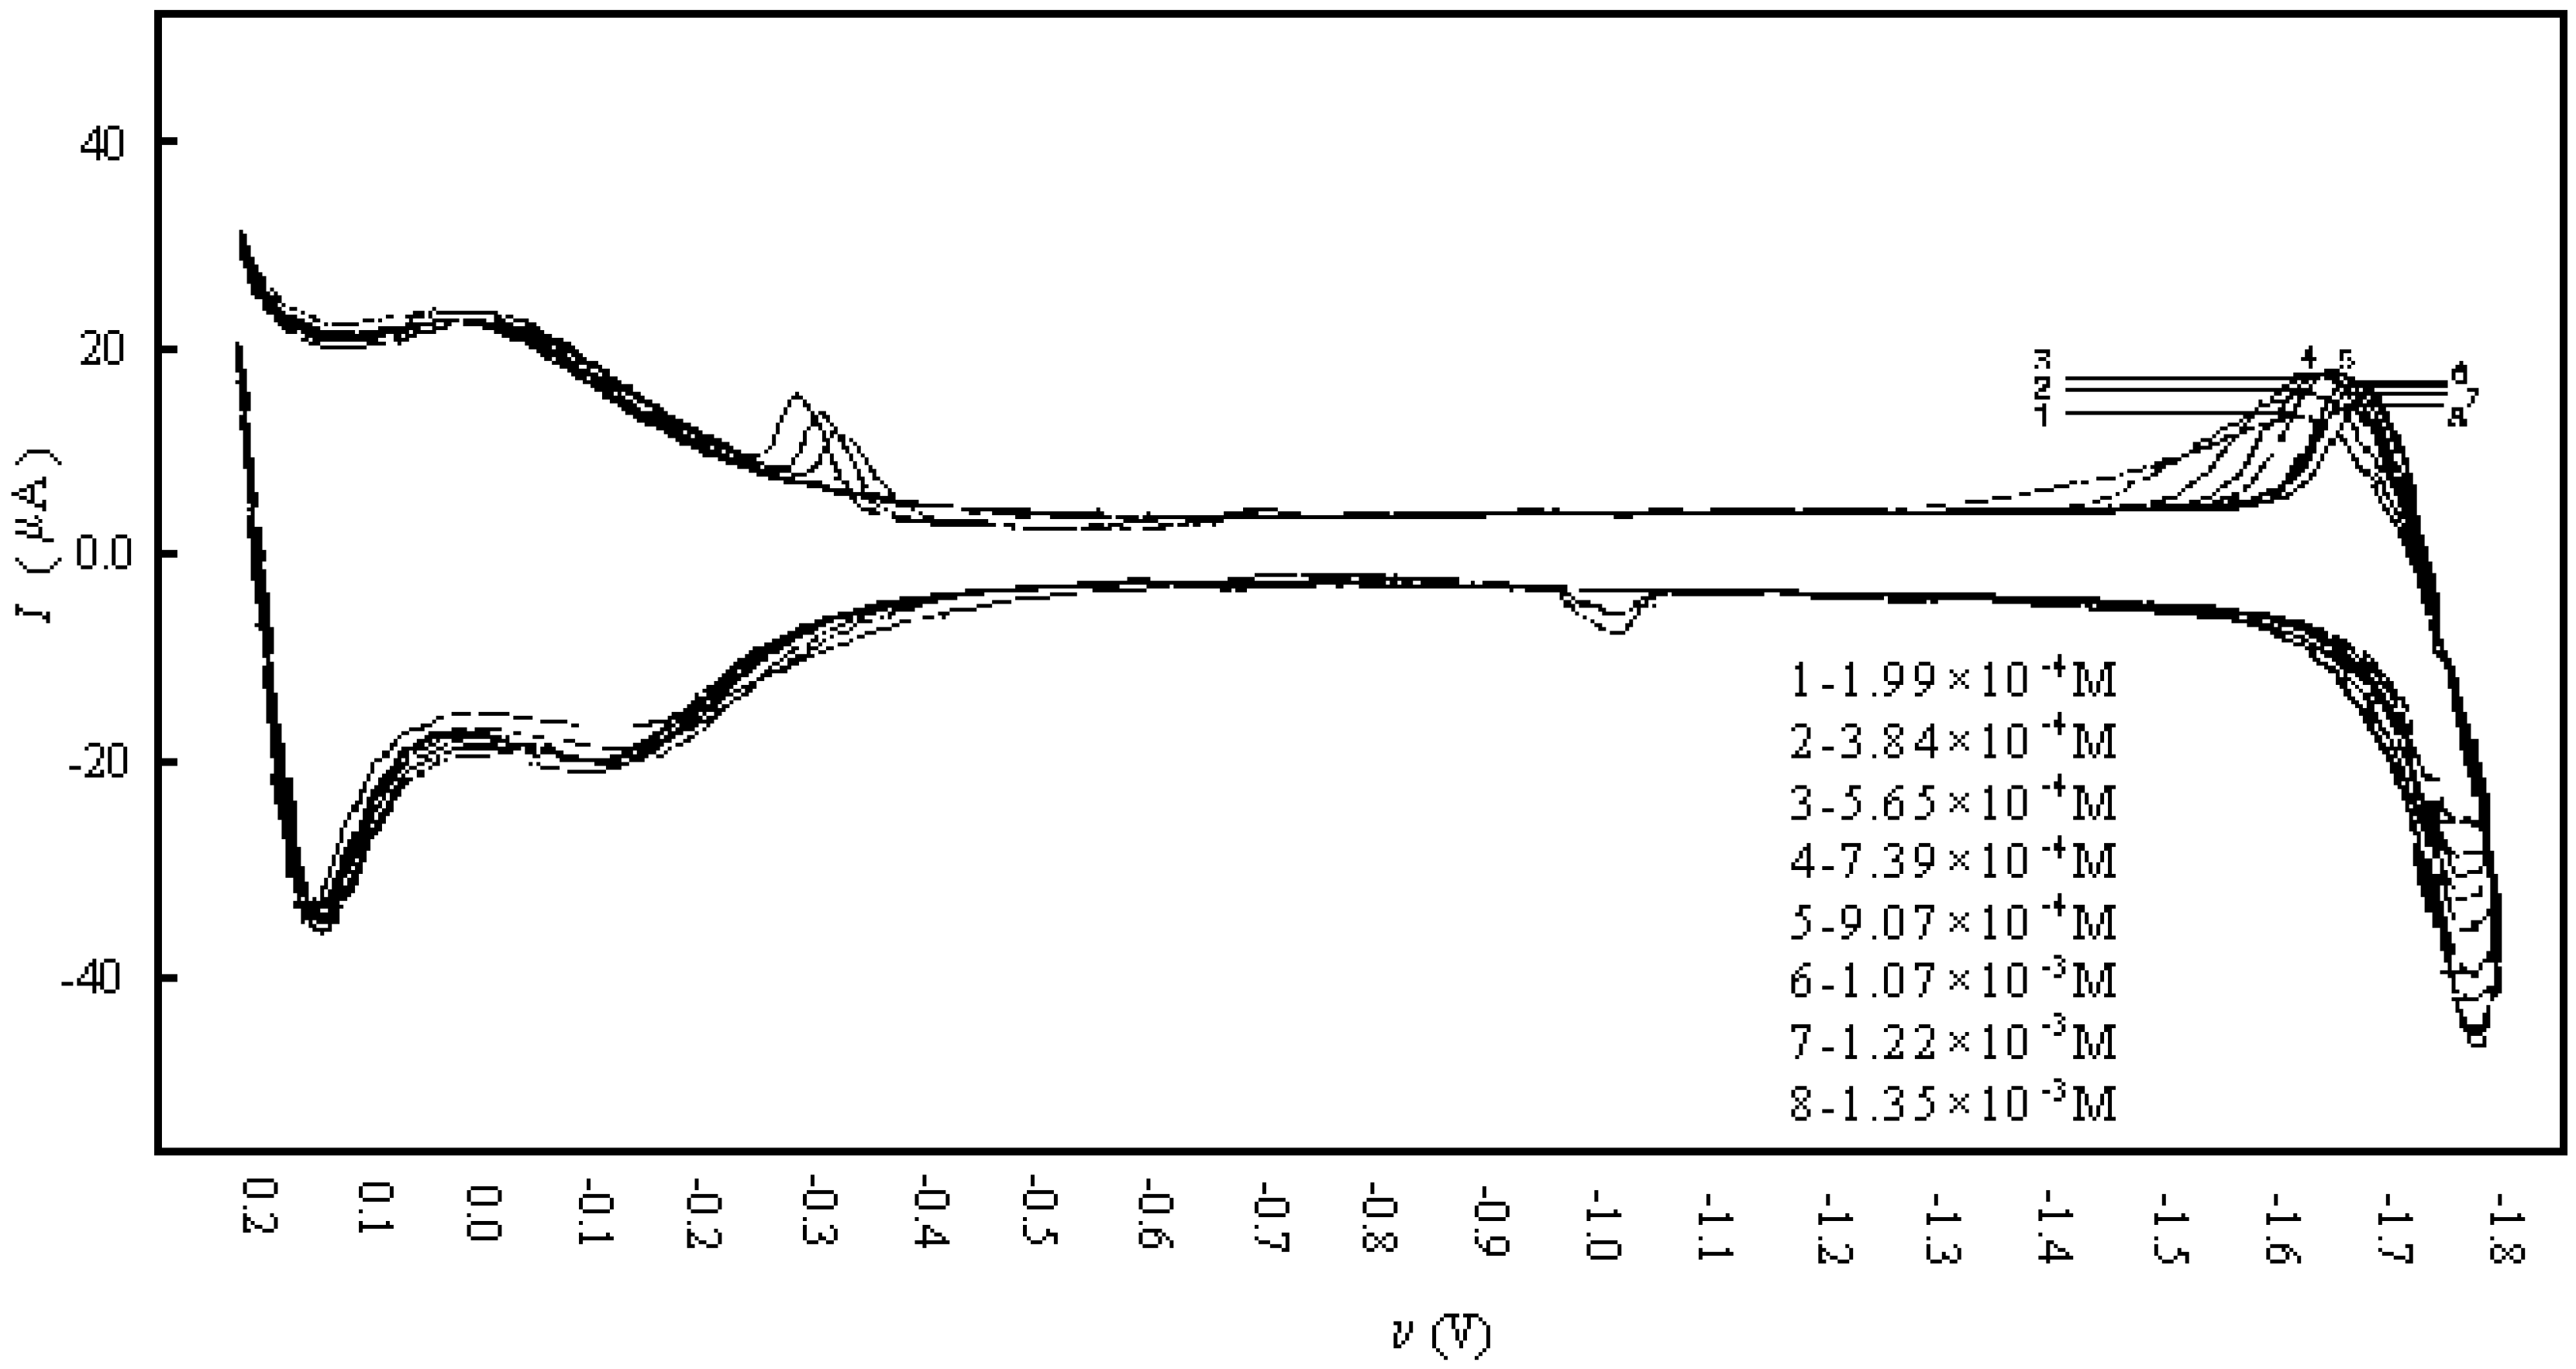
| 2.4×10⁻⁵ | 1.0 | 10 | 1.0×10⁻⁸ | 1.0×10⁻⁸ |
| 9.6×10⁻⁵ | 10 | 10 | 1.0×10⁻⁵ | 5.0×10⁻³ |
| 1.74×10⁻⁴ | 10 | 10 | 1.0×10⁻⁵ | 5.0×10⁻³ |

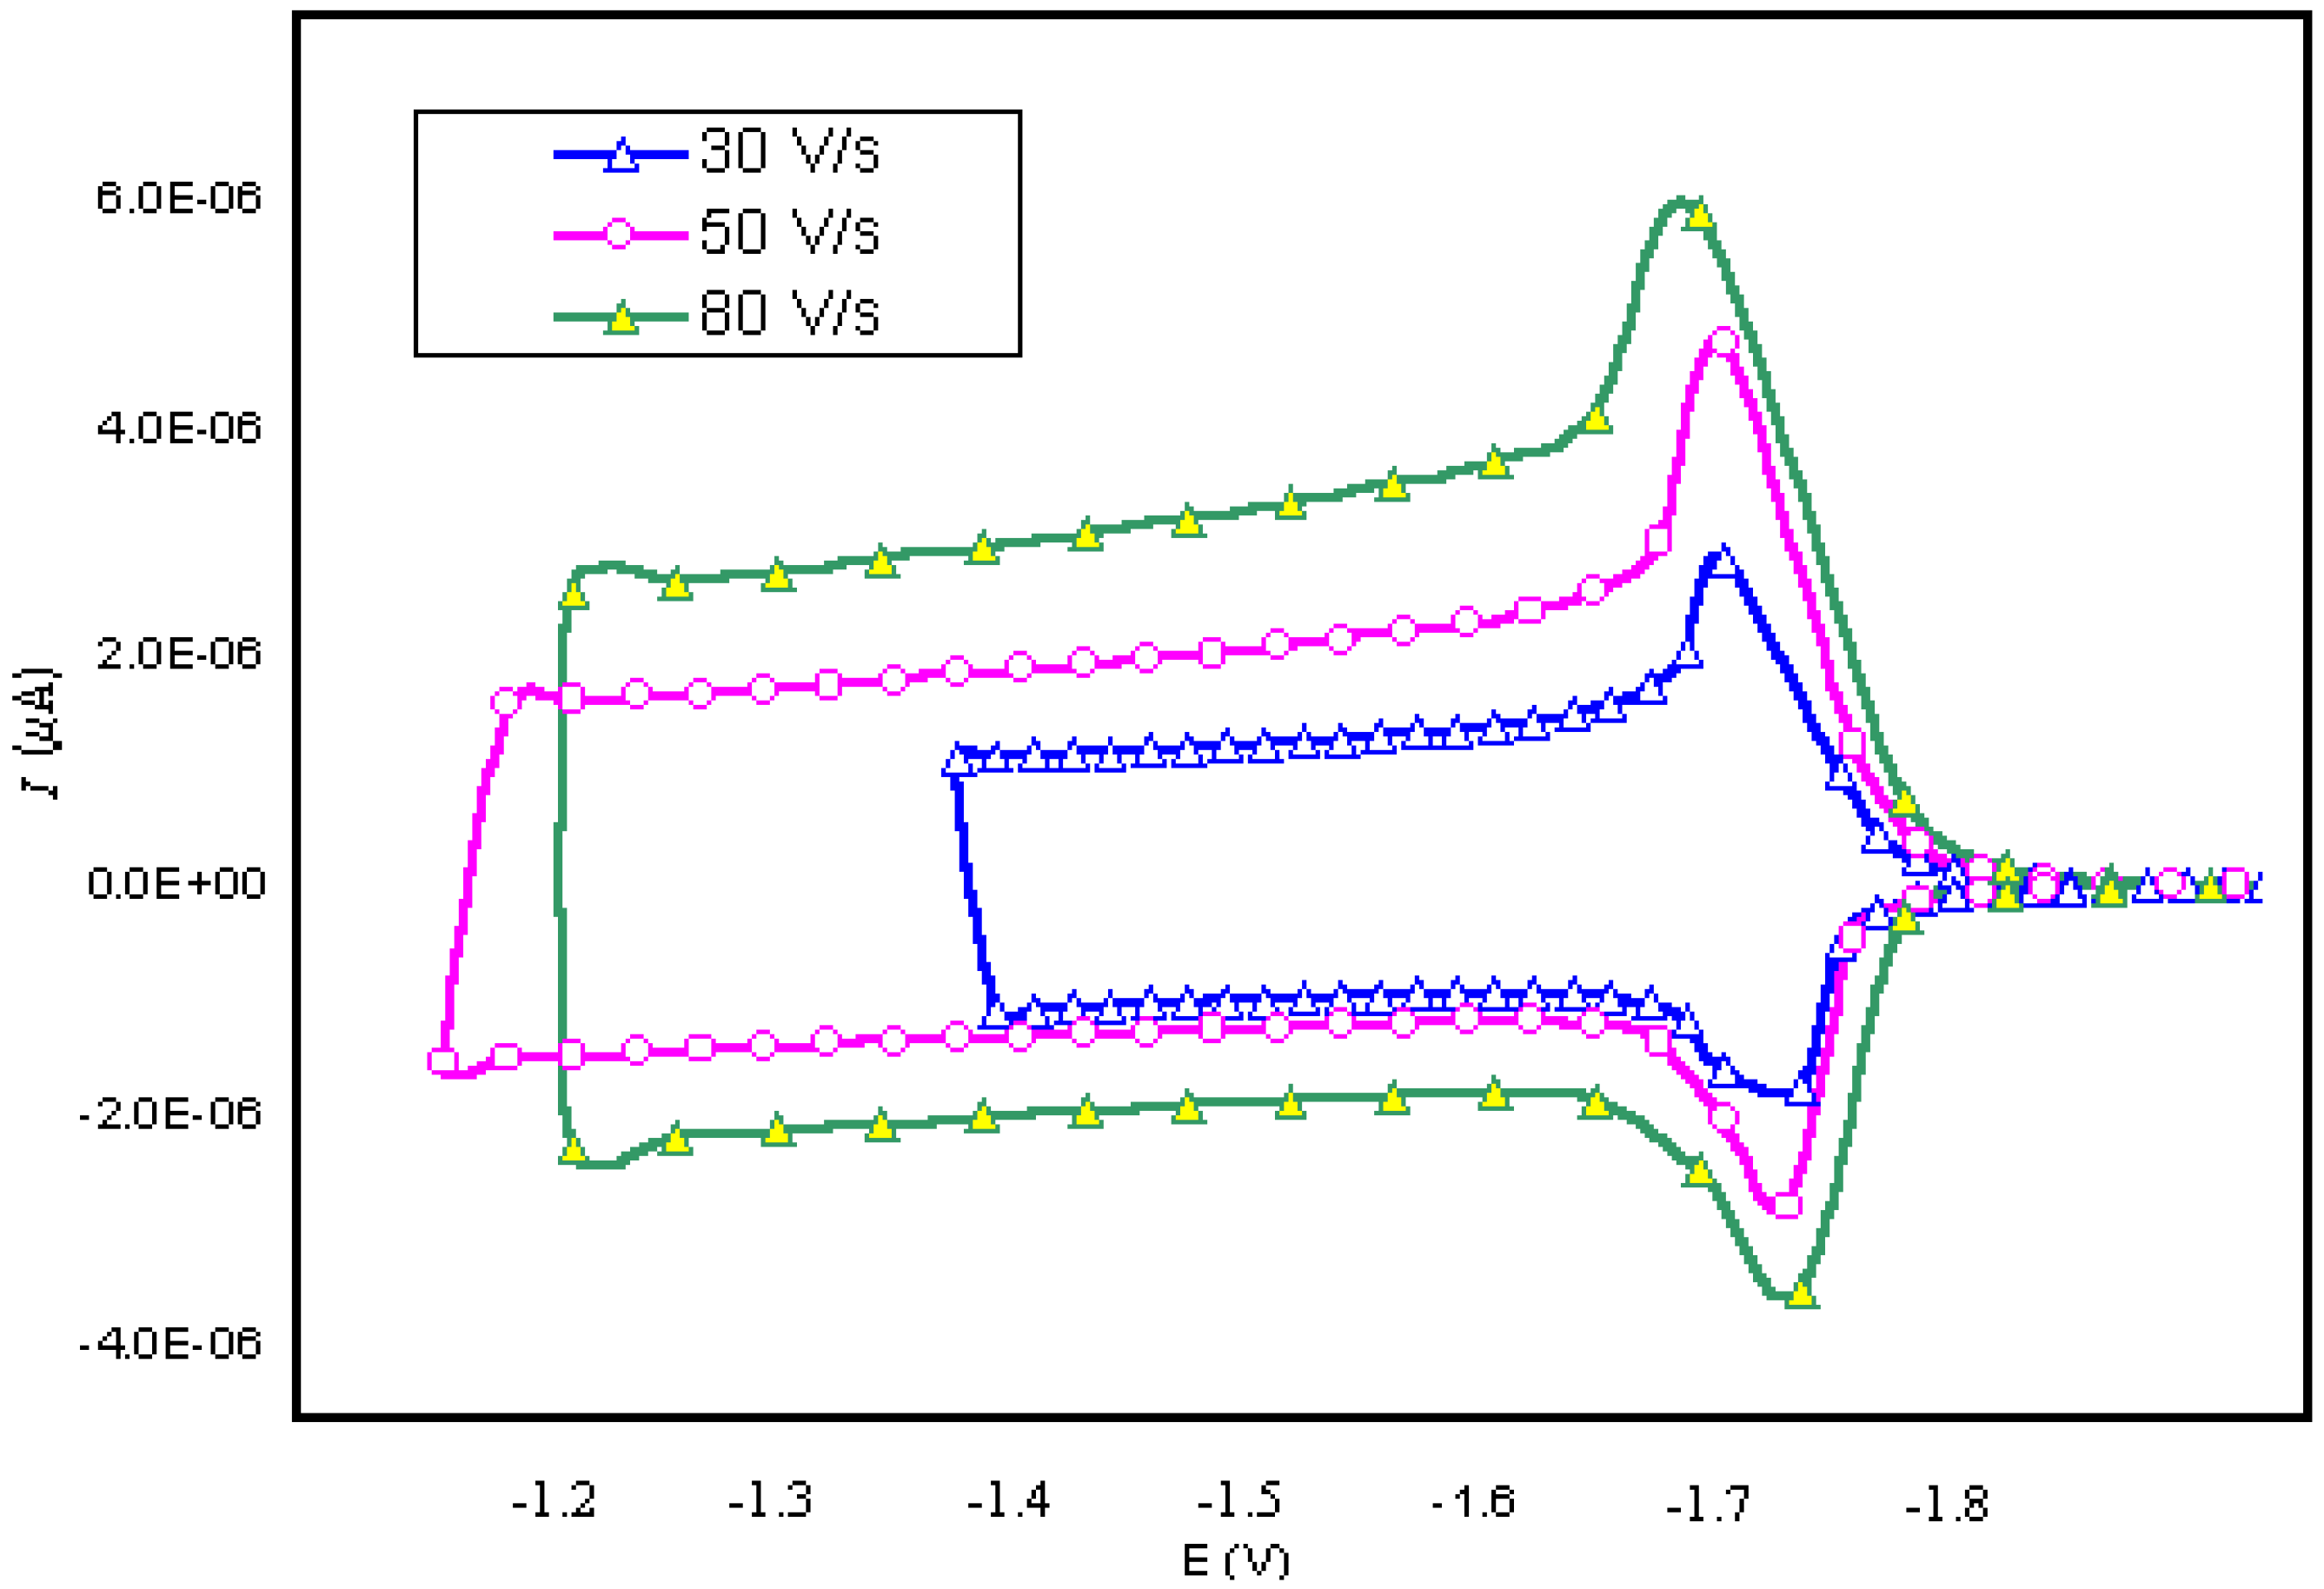
| SCAN RATE(V/ s) | KO | KR | qo (mol/cm2) | qR (mol/cm2) |
|---|---|---|---|---|
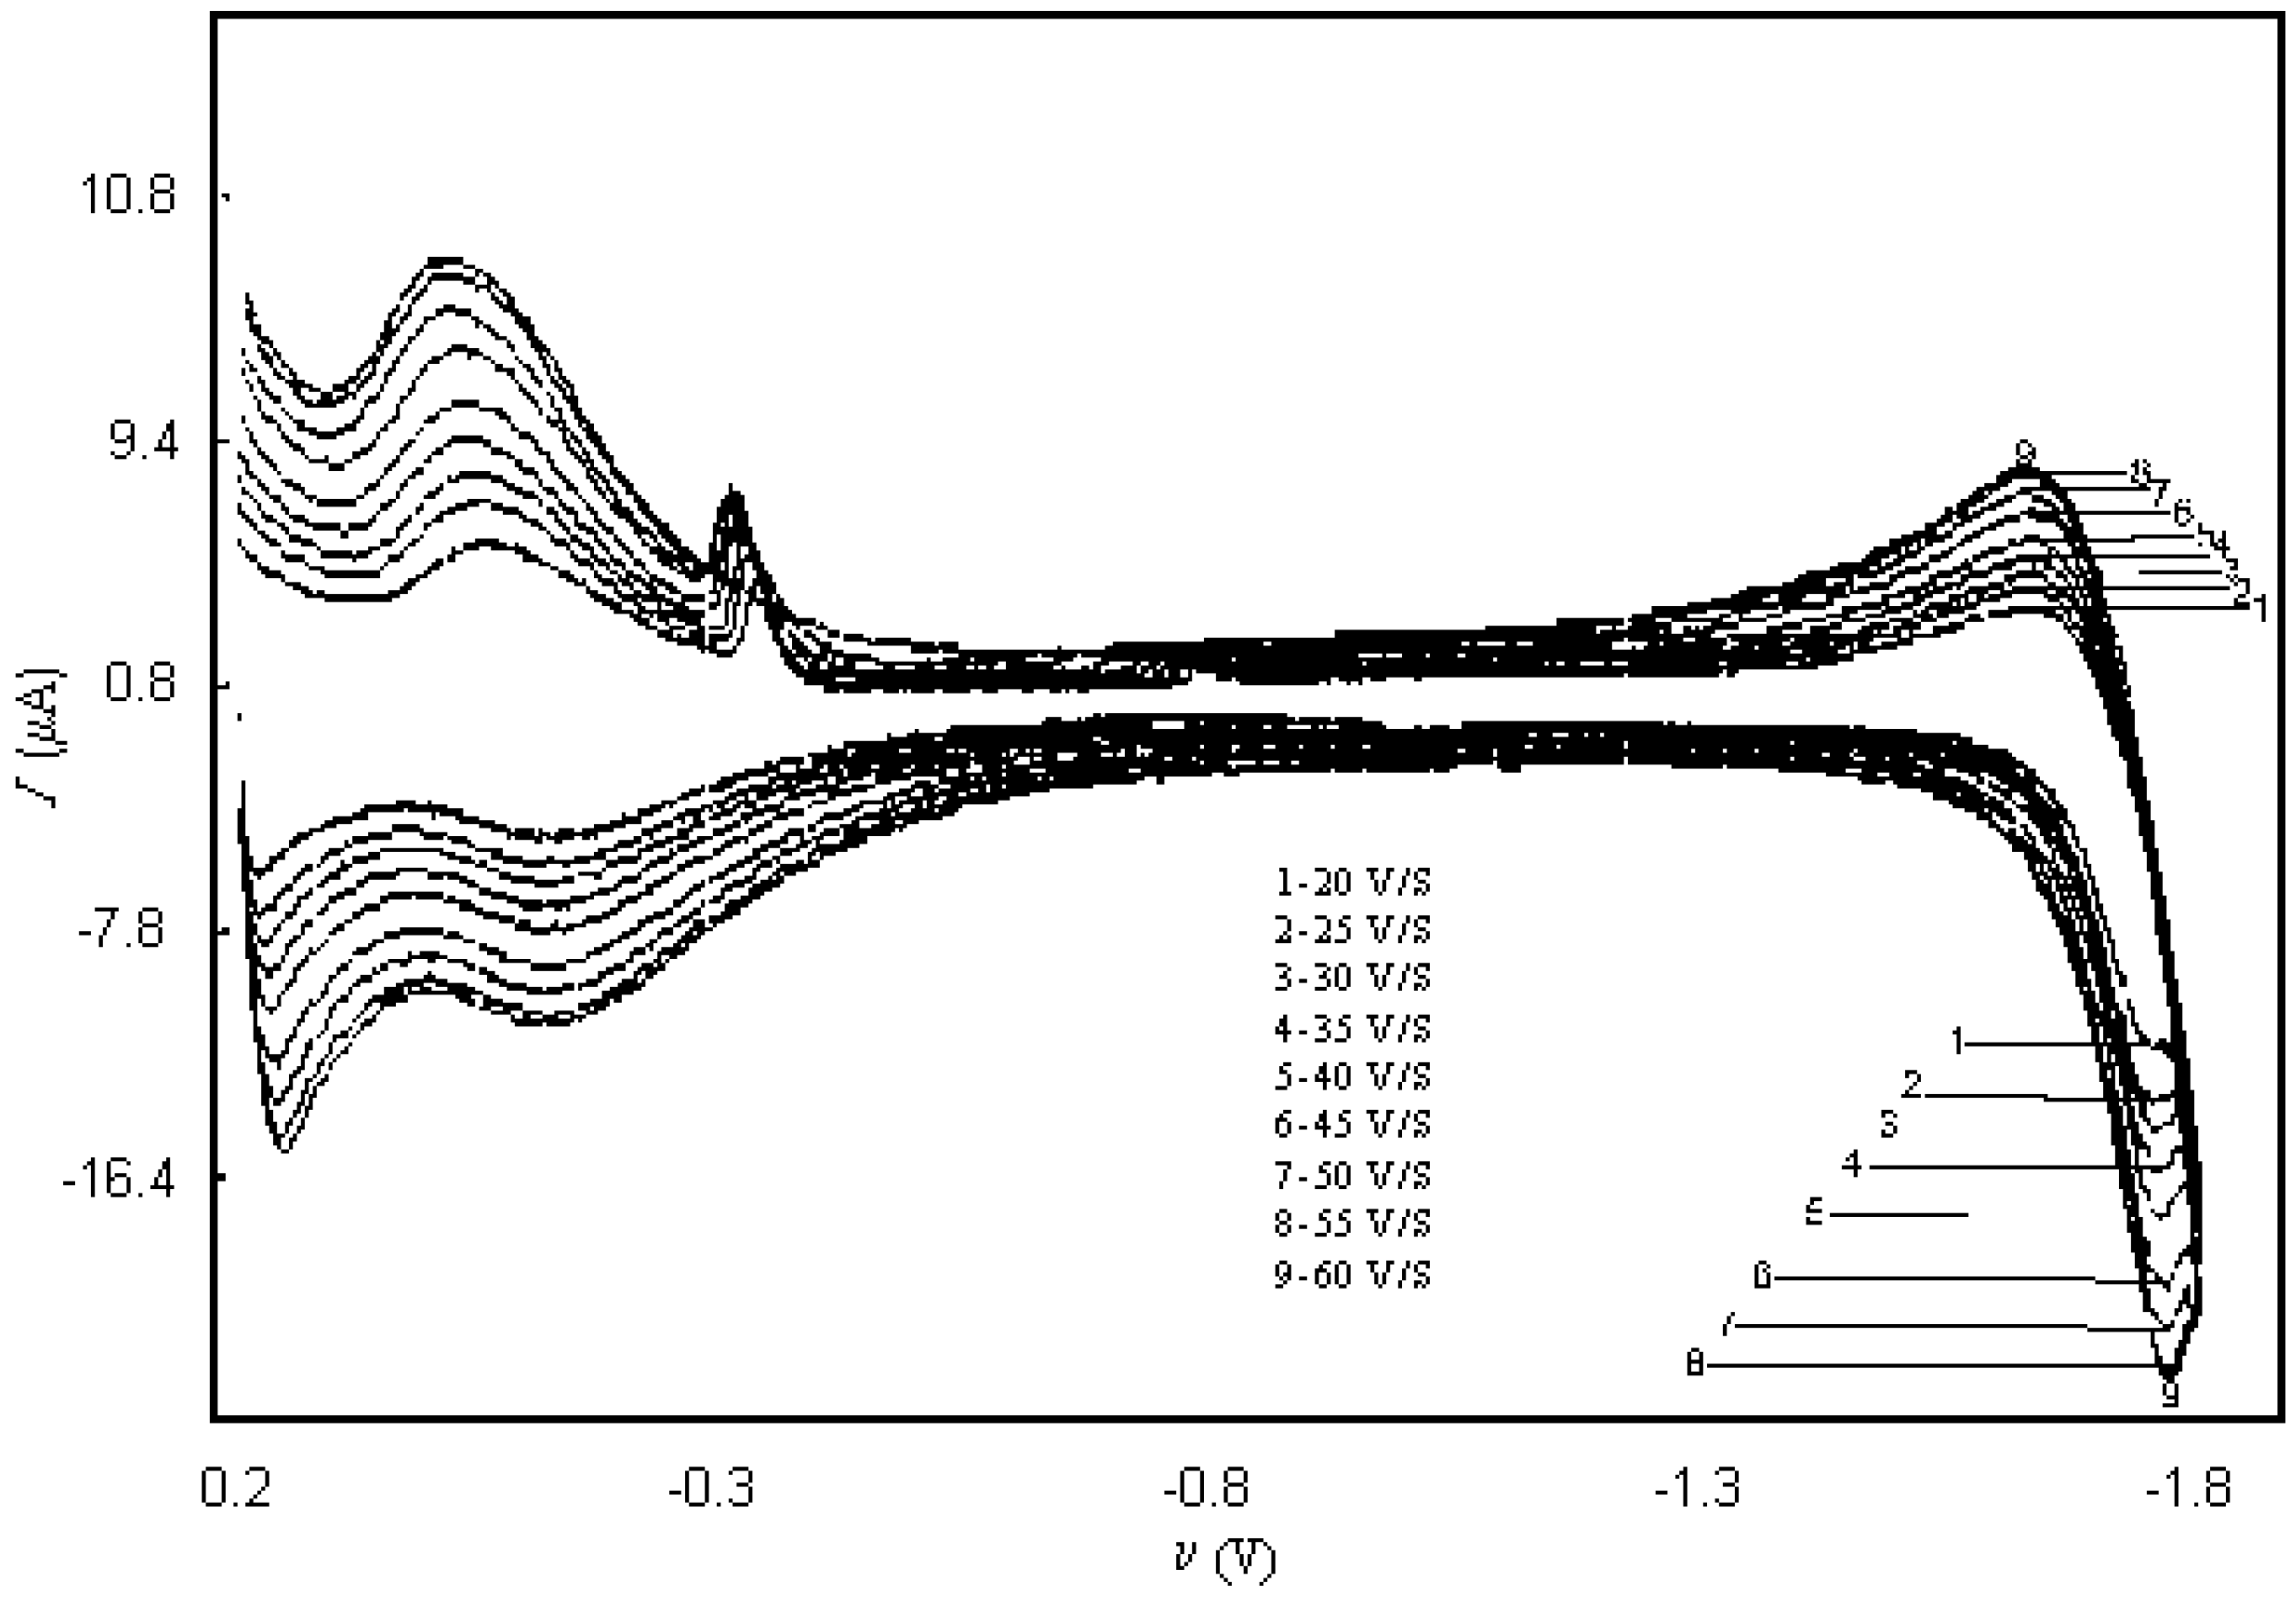
| 30 | 10 | 10 | 1.0×10⁻⁵ | 1.0×10⁻⁵ |
| 50 | 10 | 10 | 1.0×10⁻⁵ | 1.0×10⁻⁵ |
| 80 | 10 | 10 | 1.0×10⁻⁵ | 1.0×10⁻⁵ |
Notation
| A | Surface area of the mercury drop electrode. |
| | Bulk solution concentration of the reactant initially present. |
| Co(r,t) | Concentration of reactant at distance r from the center of the mercury drop at time t. |
| CR(r,t) | Concentration of the reduced species at distance r from the center of the spherical mercury drop and at time t. |
| Do | Diffusion coefficient of the reactant within the mercury drop. |
| DR | Diffusion coefficient of the reduced species within the mercury drop. |
| E | Potential of the electrode that can be related to the scan rate. |
| Ei | Initial potential of the electrode. |
| Eo | Formal reduction potential of the reactant. |
| Epa | Anodic peak potential |
| Epc | Cathodic peak potential. |
| F | Faraday constant. |
| Ip | Peak currents for the reduced species. |
| iR | Peak currents for the oxidized species. |
| n | Number of electrons involved in the reaction. |
| qo | Amount of reactant that adsorbed at the surface of the hanging mercury drop electrode. |
| | Saturation concentrations of the reactant that is initially present at the surface of the mercury drop. |
| qR | Amount of the product that adsorbed at the surface of the hanging mercury drop electrode. |
| | Saturation concentrations of the product that is initially present at the surface of the mercury drop. |
| ro | Radius of the mercury drop. |
| tR | Time when the scan is reversed to the opposite direction in the cyclic voltammetry. |
| ν | Scan rate. |
References
- Gill, C.; Abruzzo, G.; Flattery, A.; Smith, J.; Jackson, J.; Kong, L.; Wilkening, R.; Shankaran, K.; Kropp, H.; Bartizal, K. In vivo evaluation of three acid-stable azalide compounds, L-701,677, L-708,299 and L-708,365 compared to erythromycin, azithromycin and clarithromycin. The Journal of Antibiotics 1995, 48, 1141–1147. [Google Scholar] [CrossRef] [PubMed]
- Hoepelman, I.; Schneider, M. Azithromycin: the first of the tissue-selective azalids. International Journal of Antimicrobial Agents 1995, 5, 145–167. [Google Scholar] [CrossRef]
- Periti, P.; Mazzei, T.; Mini, E.; Novelli, A. Clinical pharmacokinetic properties of the macrolide antibiotics. Effects of age and various pathophysiological states (Part I). Clinical Pharmacokinetics 1989, 16, 193–214. [Google Scholar] [CrossRef] [PubMed]
- Yoshida, H.; Furuta, T. Tissue penetration properties of macrolide antibiotics--comparative tissue distribution of erythromycin-stearate, clarithromycin, roxithromycin and azithromycin in rats. The Japanese Journal of Antibiotics 1999, 52, 497–503. [Google Scholar] [PubMed]
- Turcinov, T.; Pepeljnjak, S. Azithromycin potency determination: optimal conditions for microbiological diffusion method assay. Journal of Pharmaceutical and Biomedical Analysis 1998, 17, 903–910. [Google Scholar] [CrossRef]
- Gandhi, R.; Kaul, C.; Panchagnula, R. Validated LC method for in-vitro analysis of azithromycin using electrochemical detection. Journal of Pharmaceutical and Biomedical Analysis 2001, 23, 1073–1079. [Google Scholar] [CrossRef]
- Molina, M.; Serna, C.; Lopez-Tenes, M.; Chicon, R. Derivation of a general theory for reversible multistep electrode processes in voltammetry with constant potential at spherical electrodes. Electrochemistry Communications 2000, 2, 267–271. [Google Scholar] [CrossRef]
- LaCourse, W.; Owens, G. Pulsed electrochemical detection of thiocompounds following microchromatographic separations. Analytica Chimica Acta 1995, 307, 301–319. [Google Scholar] [CrossRef]
- Meulemans, A. Electrochemical detection of nitroso-arginine as an intermediate between N-hydroxy-arginine and citrulline. An in vitro versus in vivo study using microcarbon electrodes in neuronal nitric oxide synthase and mice brain. Neuroscience Letters 2000, 294, 125–129. [Google Scholar] [CrossRef]
- Wallman, L.; Levinsson, A.; Schouenborg, J.; Holmberg, H.; Montelius, Z.; Danielsen, N.; Laurell, T. Perforated silicon nerve chips with doped registration electrodes: in vitro performance and in vivo operation. IEEE Transactions on Bio-Medical Engineering 1999, 46, 1065–1073. [Google Scholar] [CrossRef] [PubMed]
- Abo El-Maali, N. Electrochemical behaviour of the monobactam antibiotic aztreonam at different electrodes and in biological fluids. Bioelectrochemistry and Bioenergetics 1998, 45, 281–286. [Google Scholar] [CrossRef]
- Shen, D.; Huang, M.; Chow, L.; Yang, M. Kinetic profile of the adsorption and conformational change of lysozyme on self-assembled monolayers as revealed by quartz crystal resonator. Sensors and Actuators B: Chemical 2001, 77, 664–670. [Google Scholar] [CrossRef]
- Di Natale, C.; Giampaolo, C.; D’Amico, A. Study of the noise in adsorption-desorption phenomena using the Allan variance and a quartz microbalance. Sensors and Actuators B: Chemical 2000, 65(1-3), 227–231. [Google Scholar] [CrossRef]
- Apostolakis, J.; Georgiou, C.; Koupparis, M. Use of ion-selective electrodes in kinetic flow injection: determination of phenolic and hydrazino drugs with 1-fluoro-2,4-dinitrobenzene using a fluoride-selective electrode. The Analyst 1991, 116, 233–237. [Google Scholar] [CrossRef] [PubMed]
- Rong, C.; Anson, F. Unusual strong adsorption of high charged heteropolytungstate anions on mercury electrode surfaces. Analytical Chemistry 1994, 66, 3124–3130. [Google Scholar] [CrossRef]
- Wopschall, R.; Shain, I. Effect of adsorption of electroactive species in stationary electrode polarography. Analytical Chemistry 1967, 39, 1514–1527. [Google Scholar] [CrossRef]
- Hanewinkel, C.; Winkes, H.; Schumacher, D.; Otto, A. Adsorption of metal cations precisely quantified by surface resistance of thin epitaxial silver film electrodes. Electrochimica Acta 1997, 42, 3345–3349. [Google Scholar] [CrossRef]
- Sample Availability: Available from the authors.
© 2002 by MDPI (http://www.mdpi.net). Reproduction is permitted for noncommercial purposes.
Share and Cite
Shawabkeh, R.A.; Tutunji, M.F. Mathematical Modelling of the Electrode Process of Azithromycin Using Cyclic Voltammetry at Hanging Mercury Drop Electrode. Sensors 2002, 2, 436-446. https://doi.org/10.3390/s21100436
Shawabkeh RA, Tutunji MF. Mathematical Modelling of the Electrode Process of Azithromycin Using Cyclic Voltammetry at Hanging Mercury Drop Electrode. Sensors. 2002; 2(11):436-446. https://doi.org/10.3390/s21100436
Chicago/Turabian StyleShawabkeh, Reyad A., and Maha F. Tutunji. 2002. "Mathematical Modelling of the Electrode Process of Azithromycin Using Cyclic Voltammetry at Hanging Mercury Drop Electrode" Sensors 2, no. 11: 436-446. https://doi.org/10.3390/s21100436