
Data Collection for Mobile Group Consumption: An Asynchronous Distributed Approach †


Abstract
: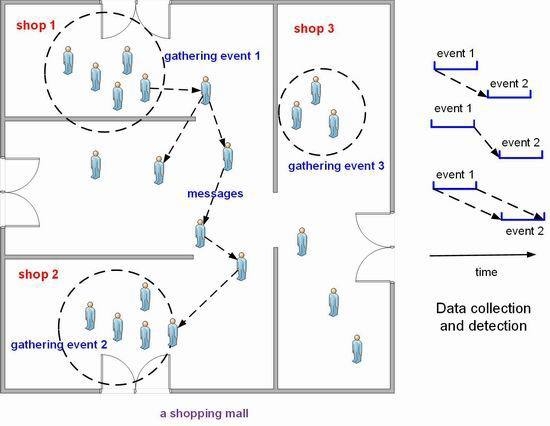
1. Introduction
- We build the system model of mobile group consumption based on asynchronous message passing, i.e., it is not based on a centralized server or synchronized clock. We also describe the simulation system developed based on this model.
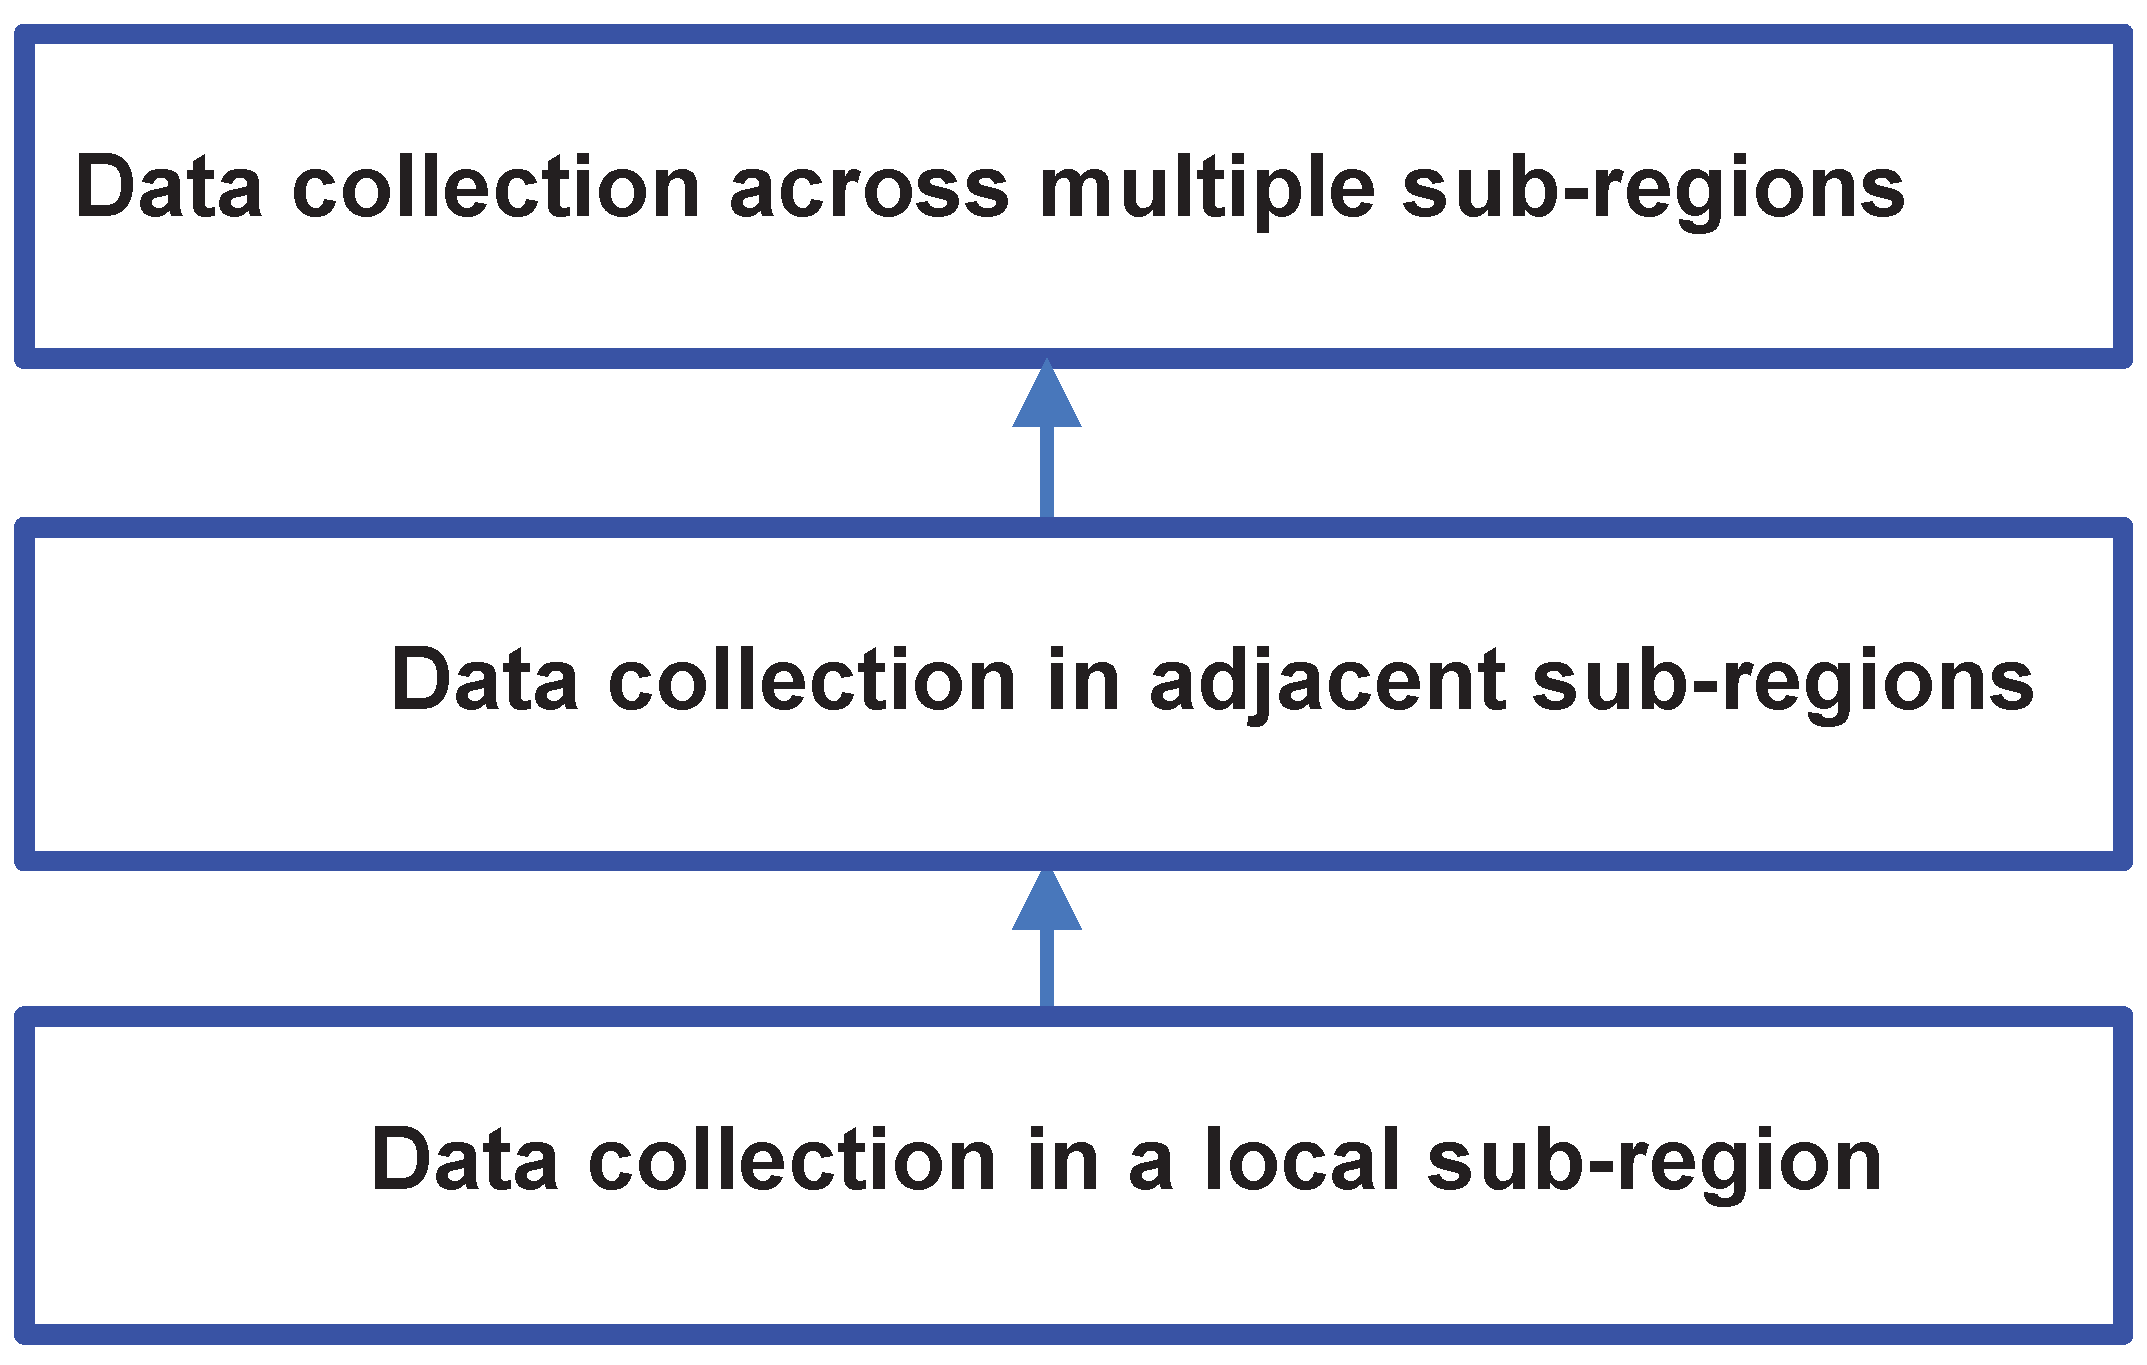
- We propose a three-layer mechanism to collect data for mobile group consumption in an asynchronous distributed way. The data collection is firstly handled locally and then coordinated in convective or more regions if the data collection spans a wide area.
- We conduct extensive simulations to validate the proposed approach. The results show that the proposed algorithm is quite effective.
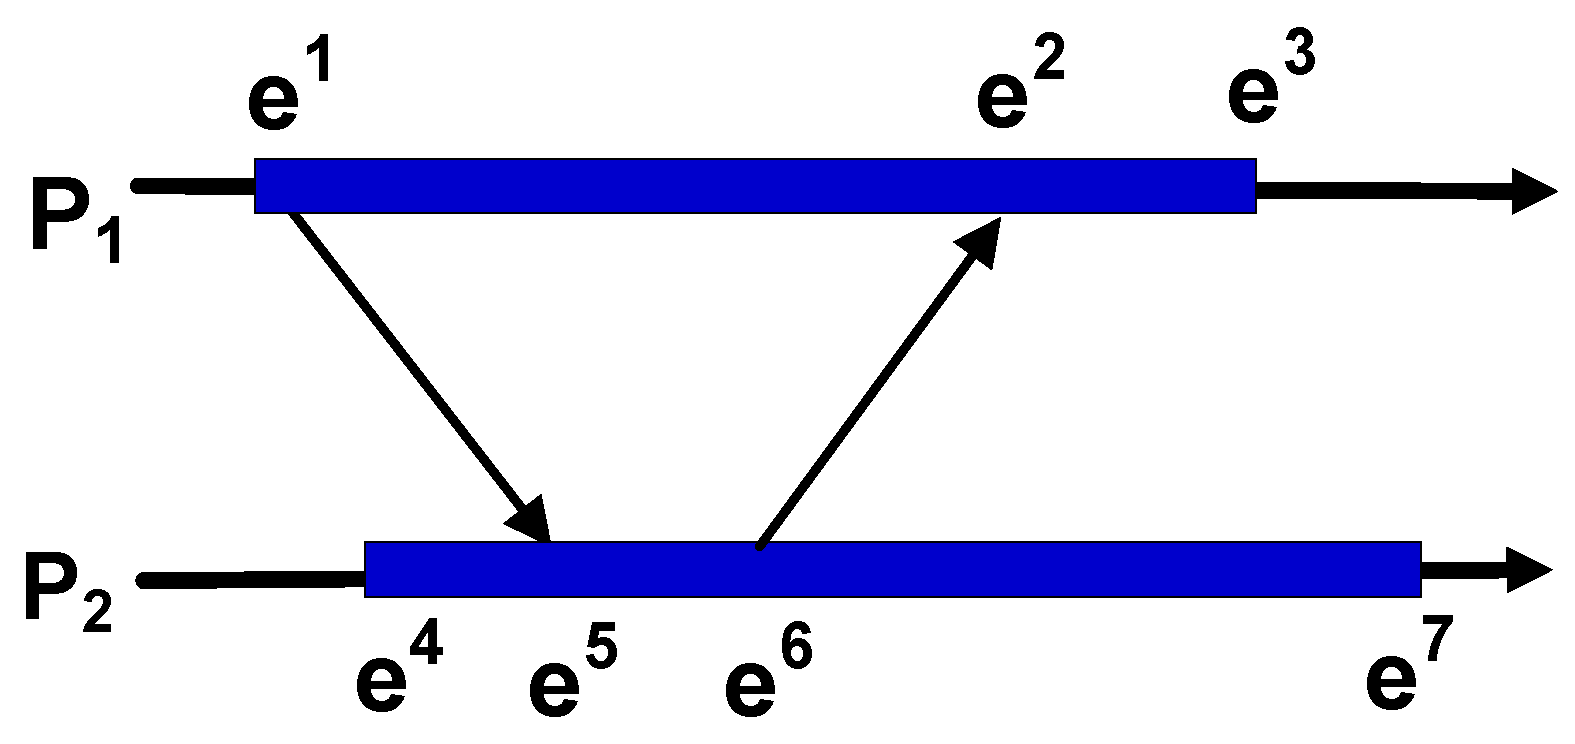
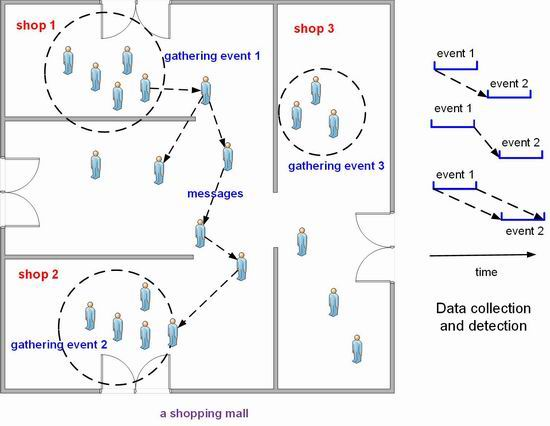
2. System Model
- (1)
- is a state before in the same device;
- (2)
- the event immediately after state sends a message and the event immediately before state receives that message;
- (3)
- there is a state , such that and [10].
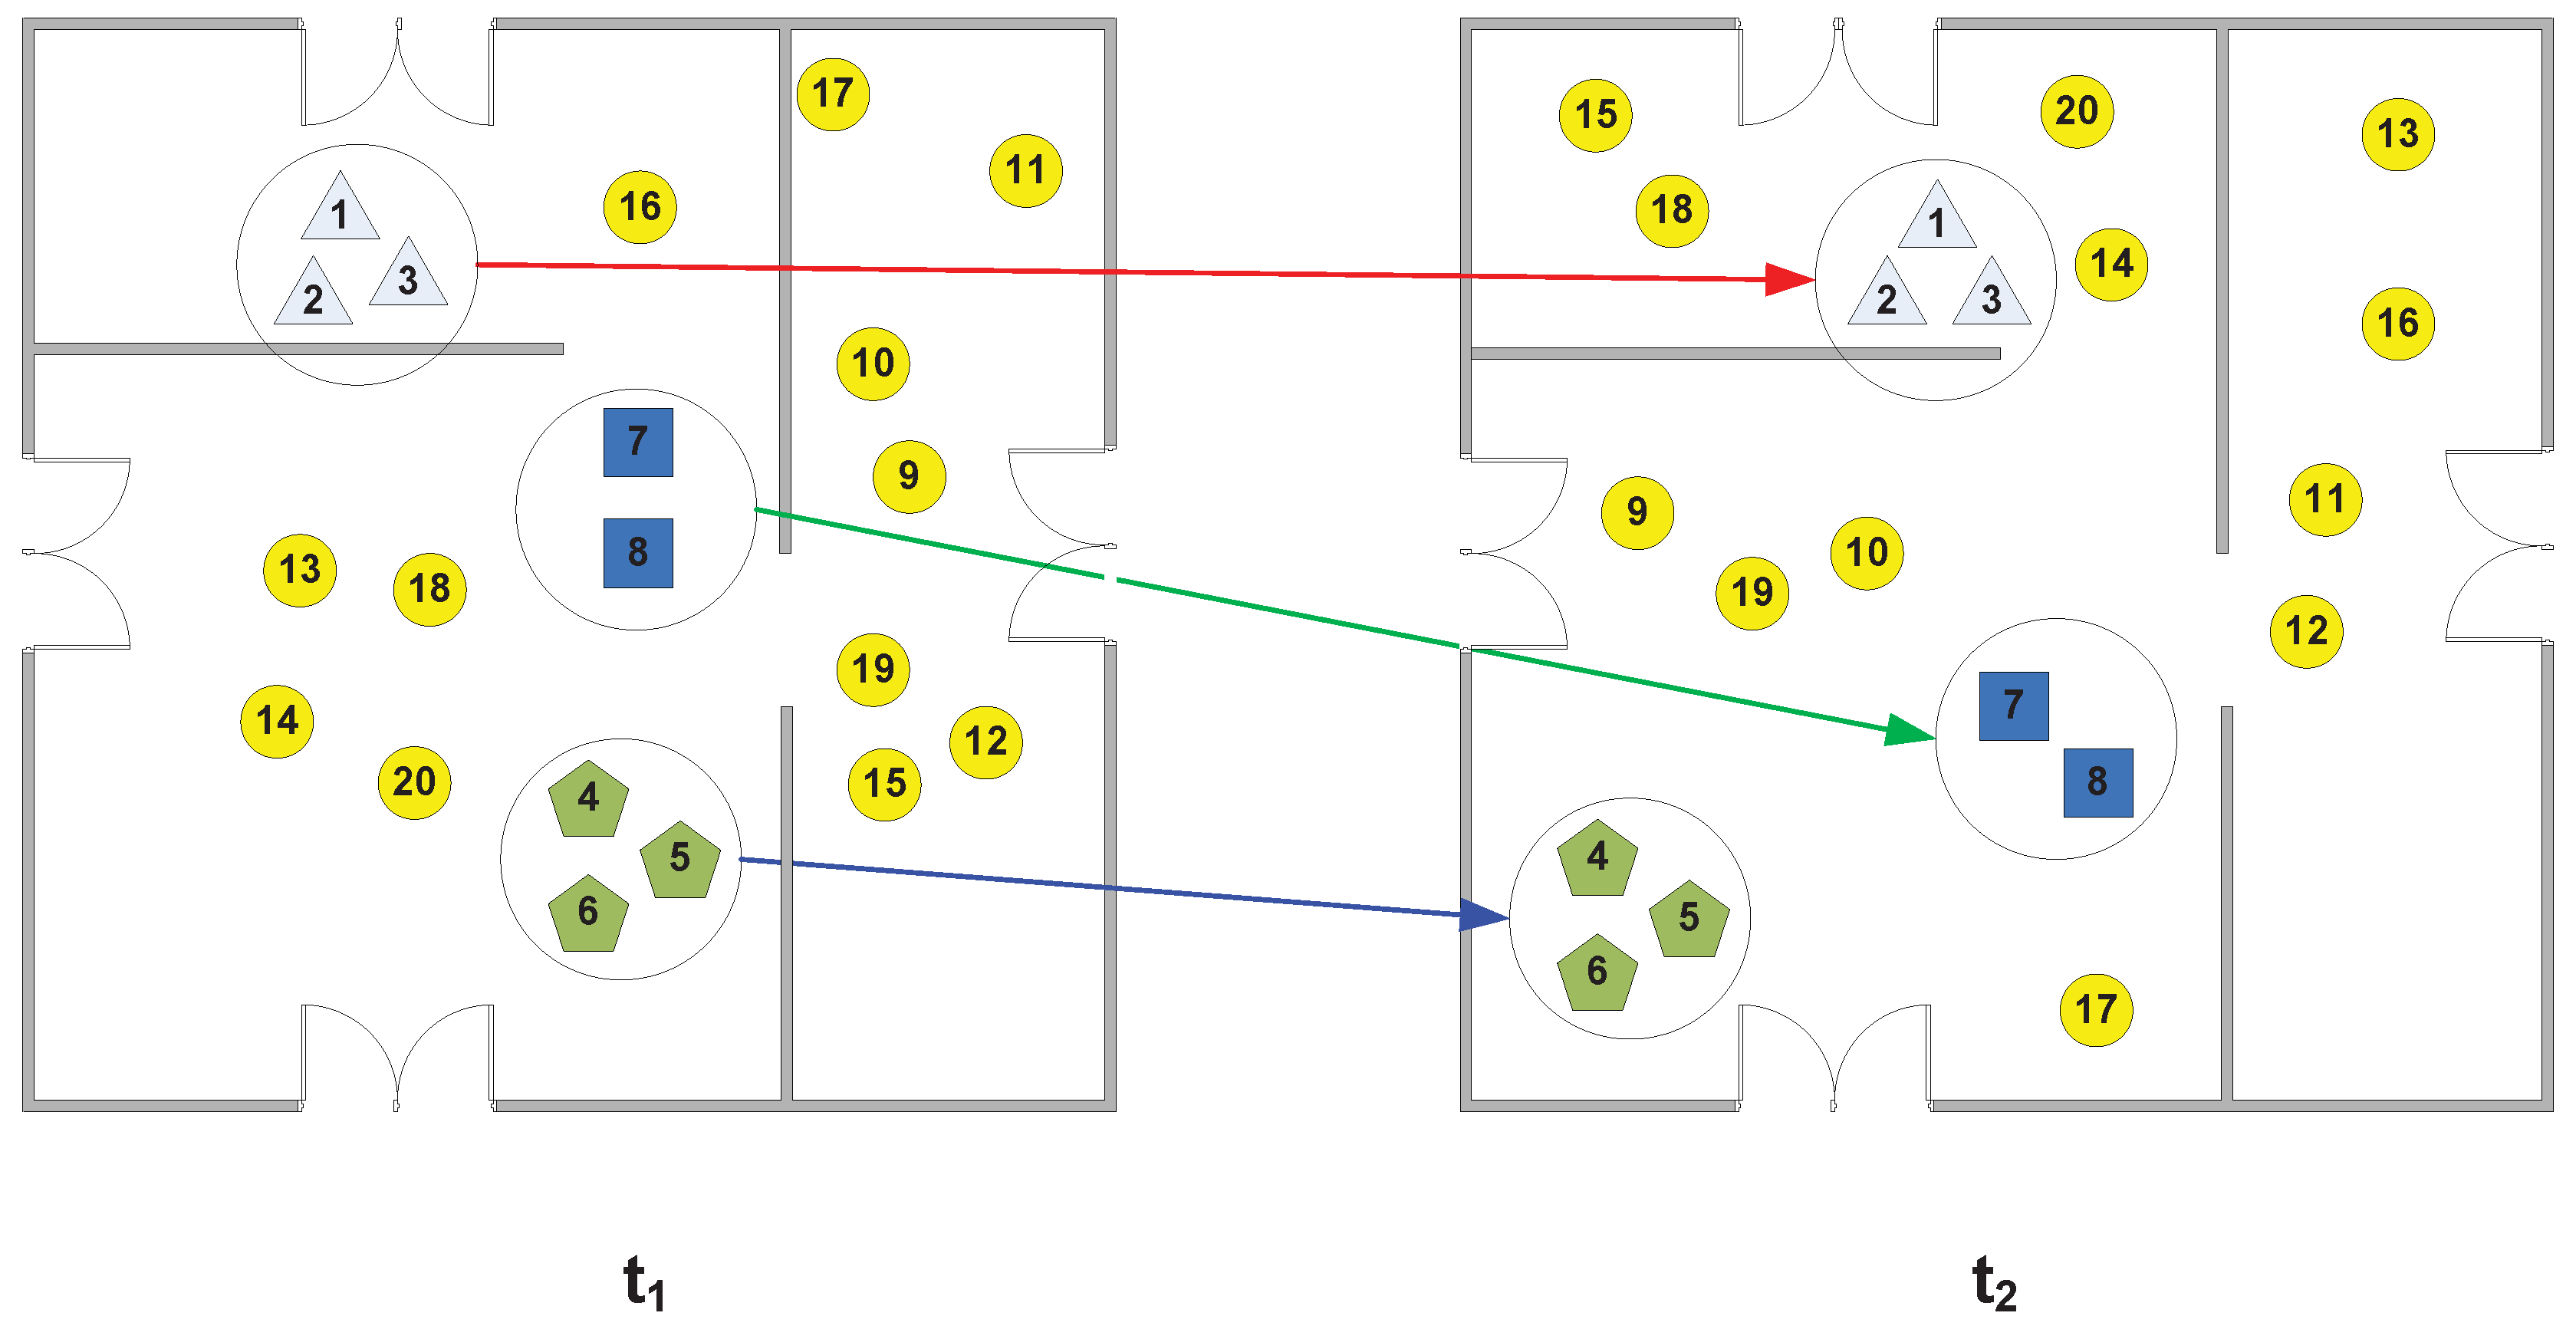
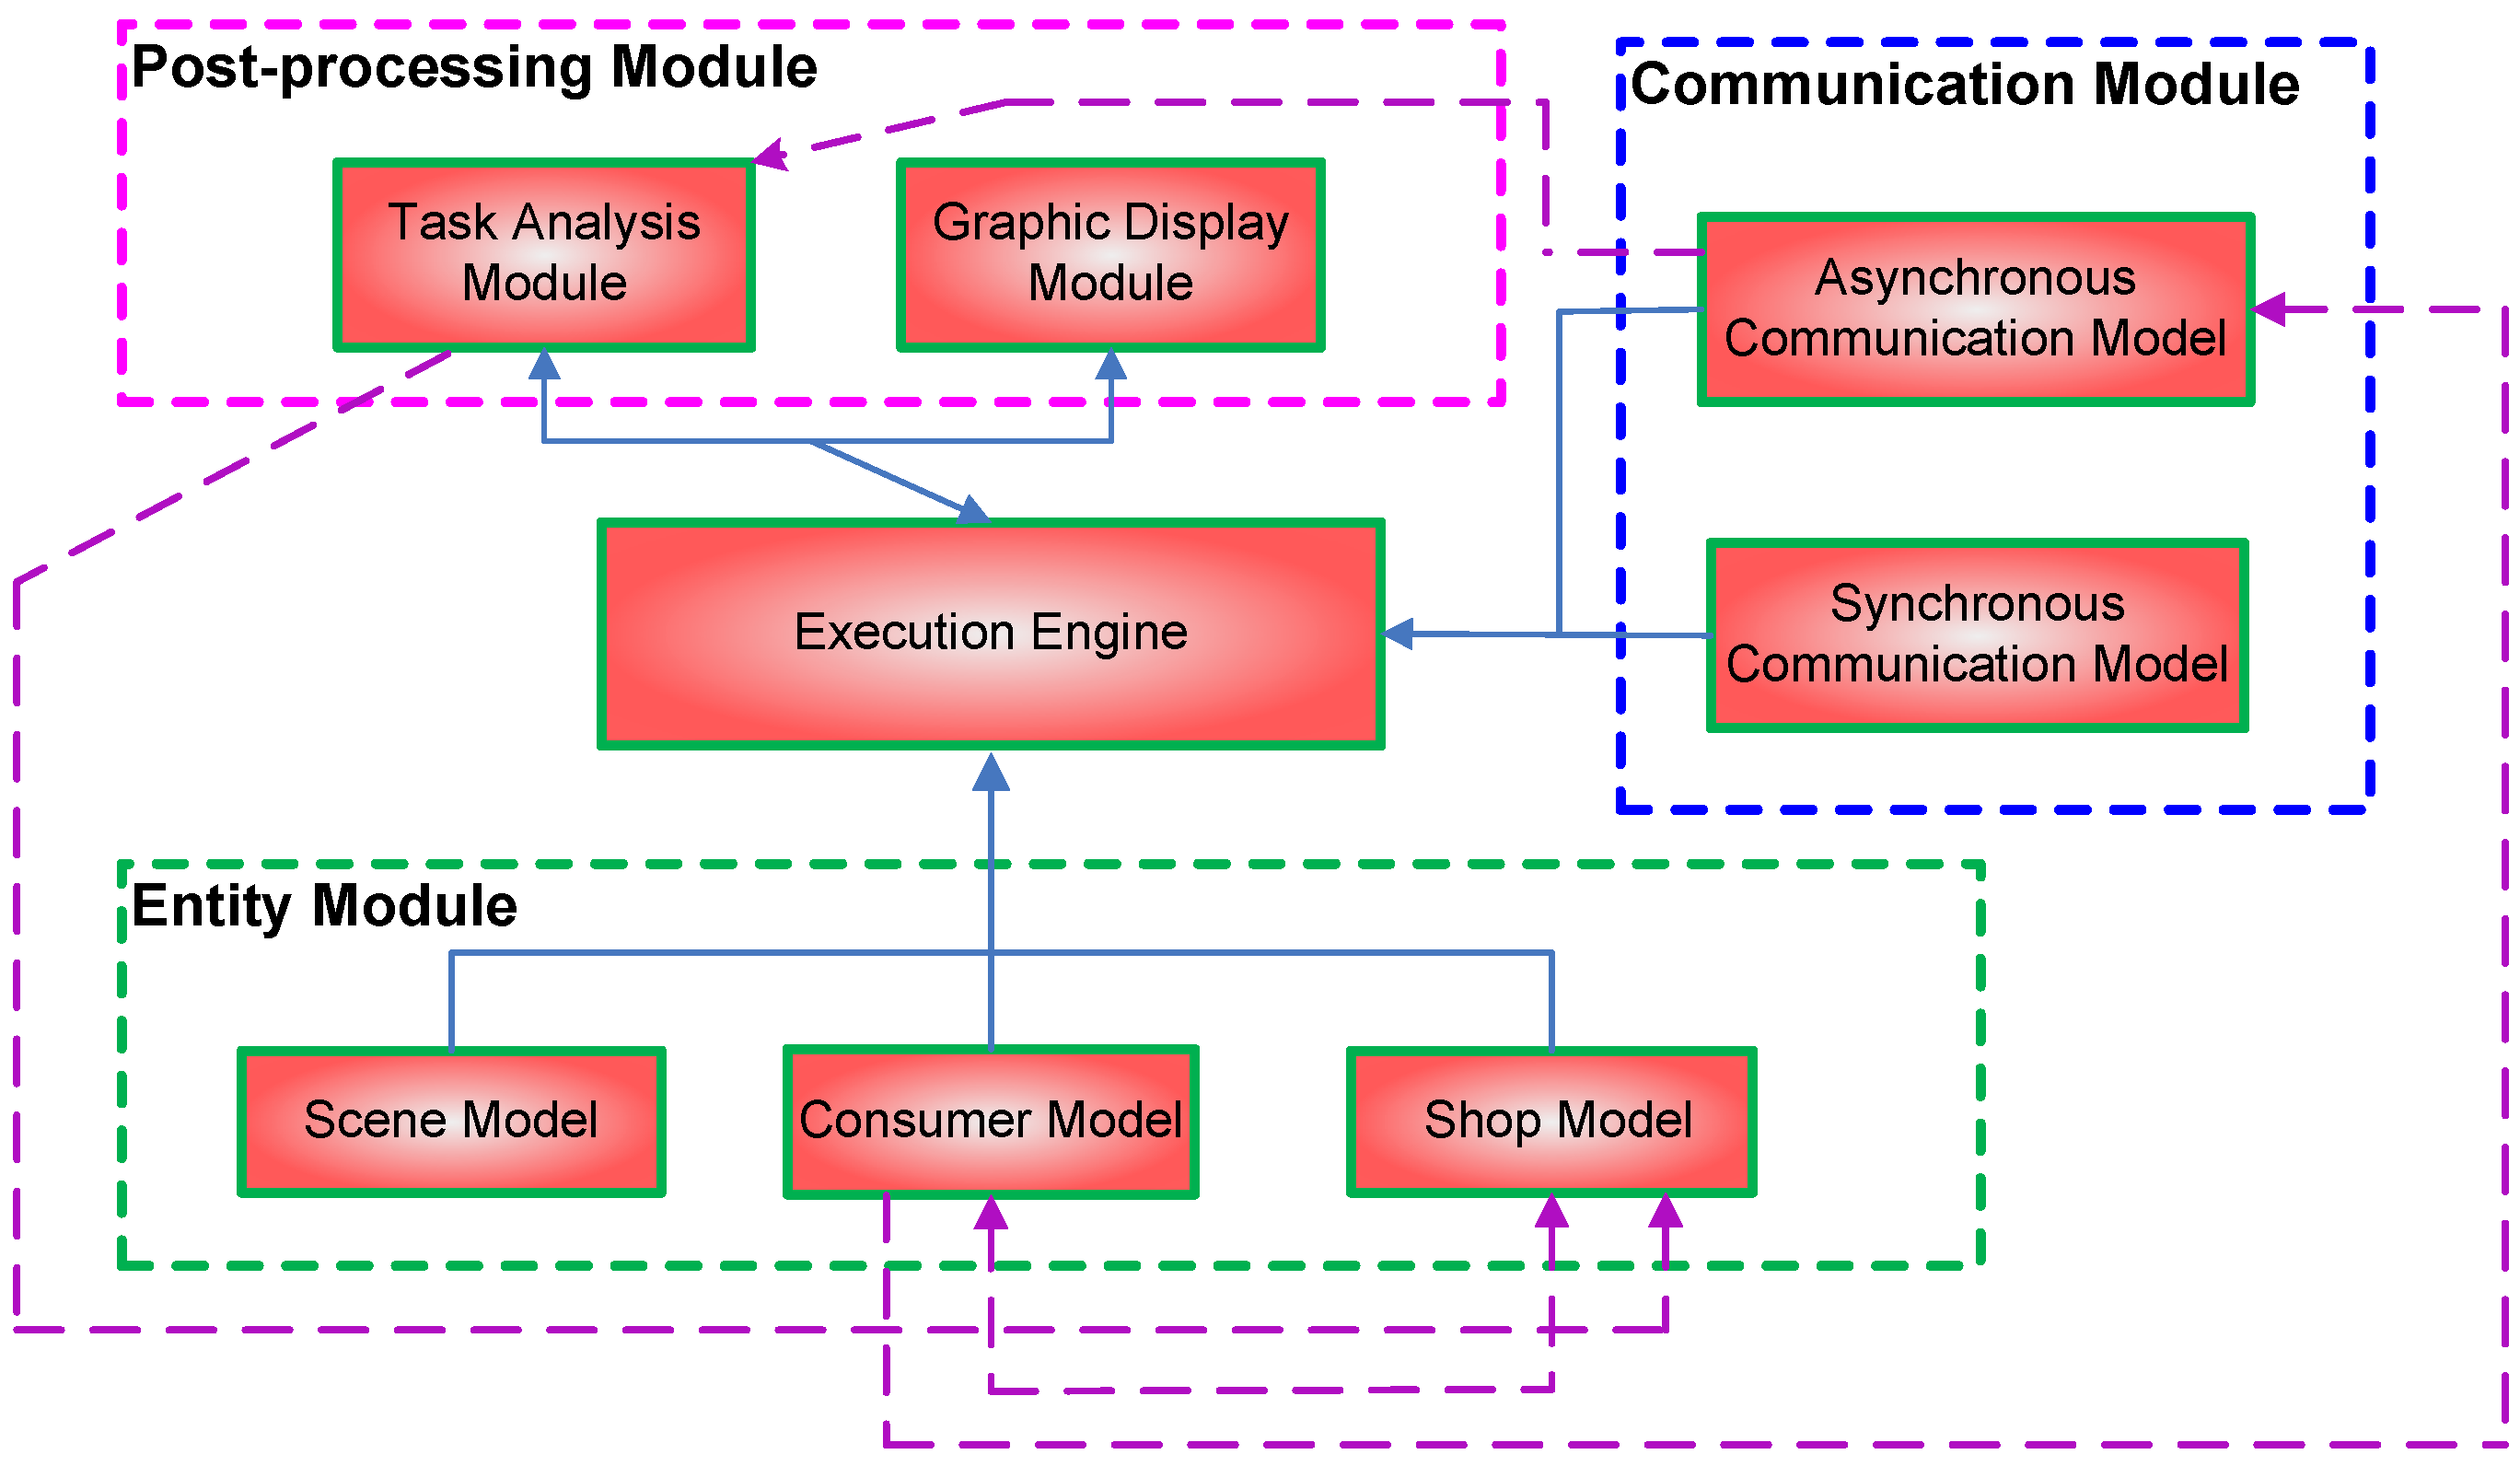
3. Simulation System
4. Data Collection Approach
4.1. Distributed Data Collection
4.2. Asynchronous Distributed Data Collection
| Algorithm 1: Asynchronous Distributed Data Collection Approach (Consumer) |
 |
| Algorithm 2: Asynchronous Distributed Data Collection Approach (Shop). |
 |
| Algorithm 3: Asynchronous Distributed Data Collection Approach (shop) (cont.). |
 |
| Algorithm 4: Multiple sub-Region Coordination Algorithm for Causality Analysis. |
 |
4.3. Complexity of the Algorithms
4.4. Discussion
5. Performance Evaluation
5.1. Simulation Setup
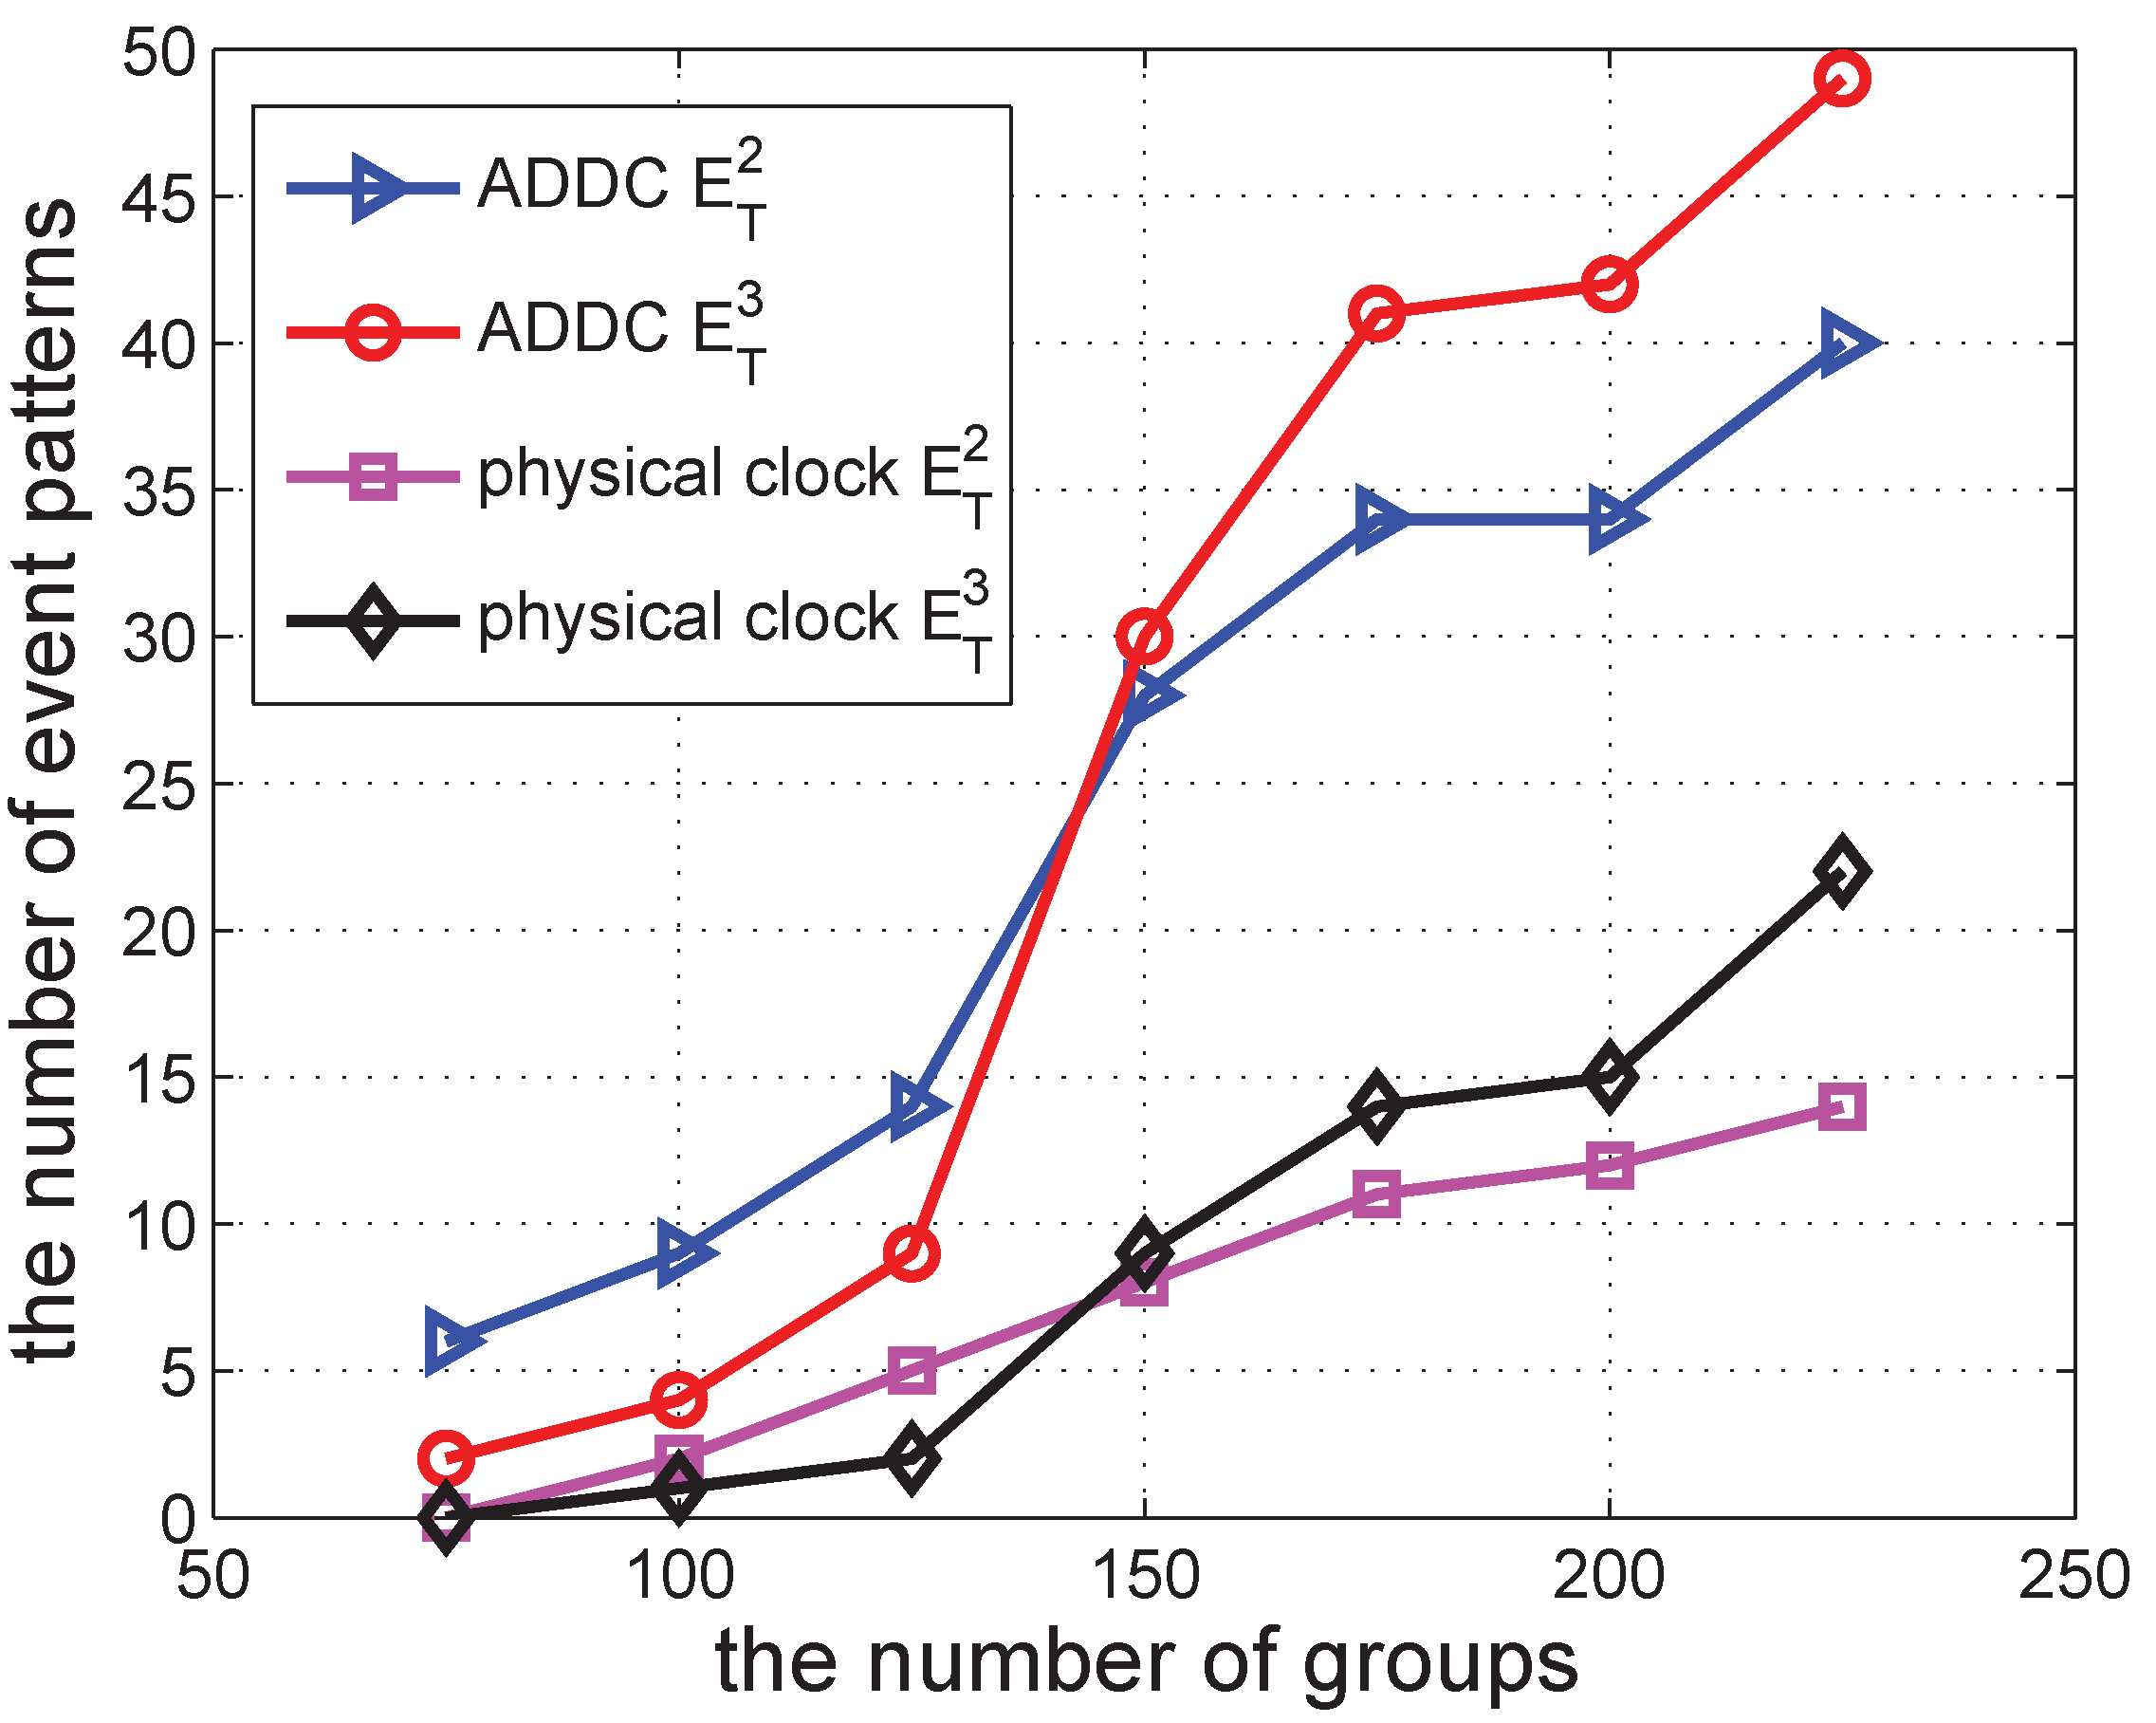
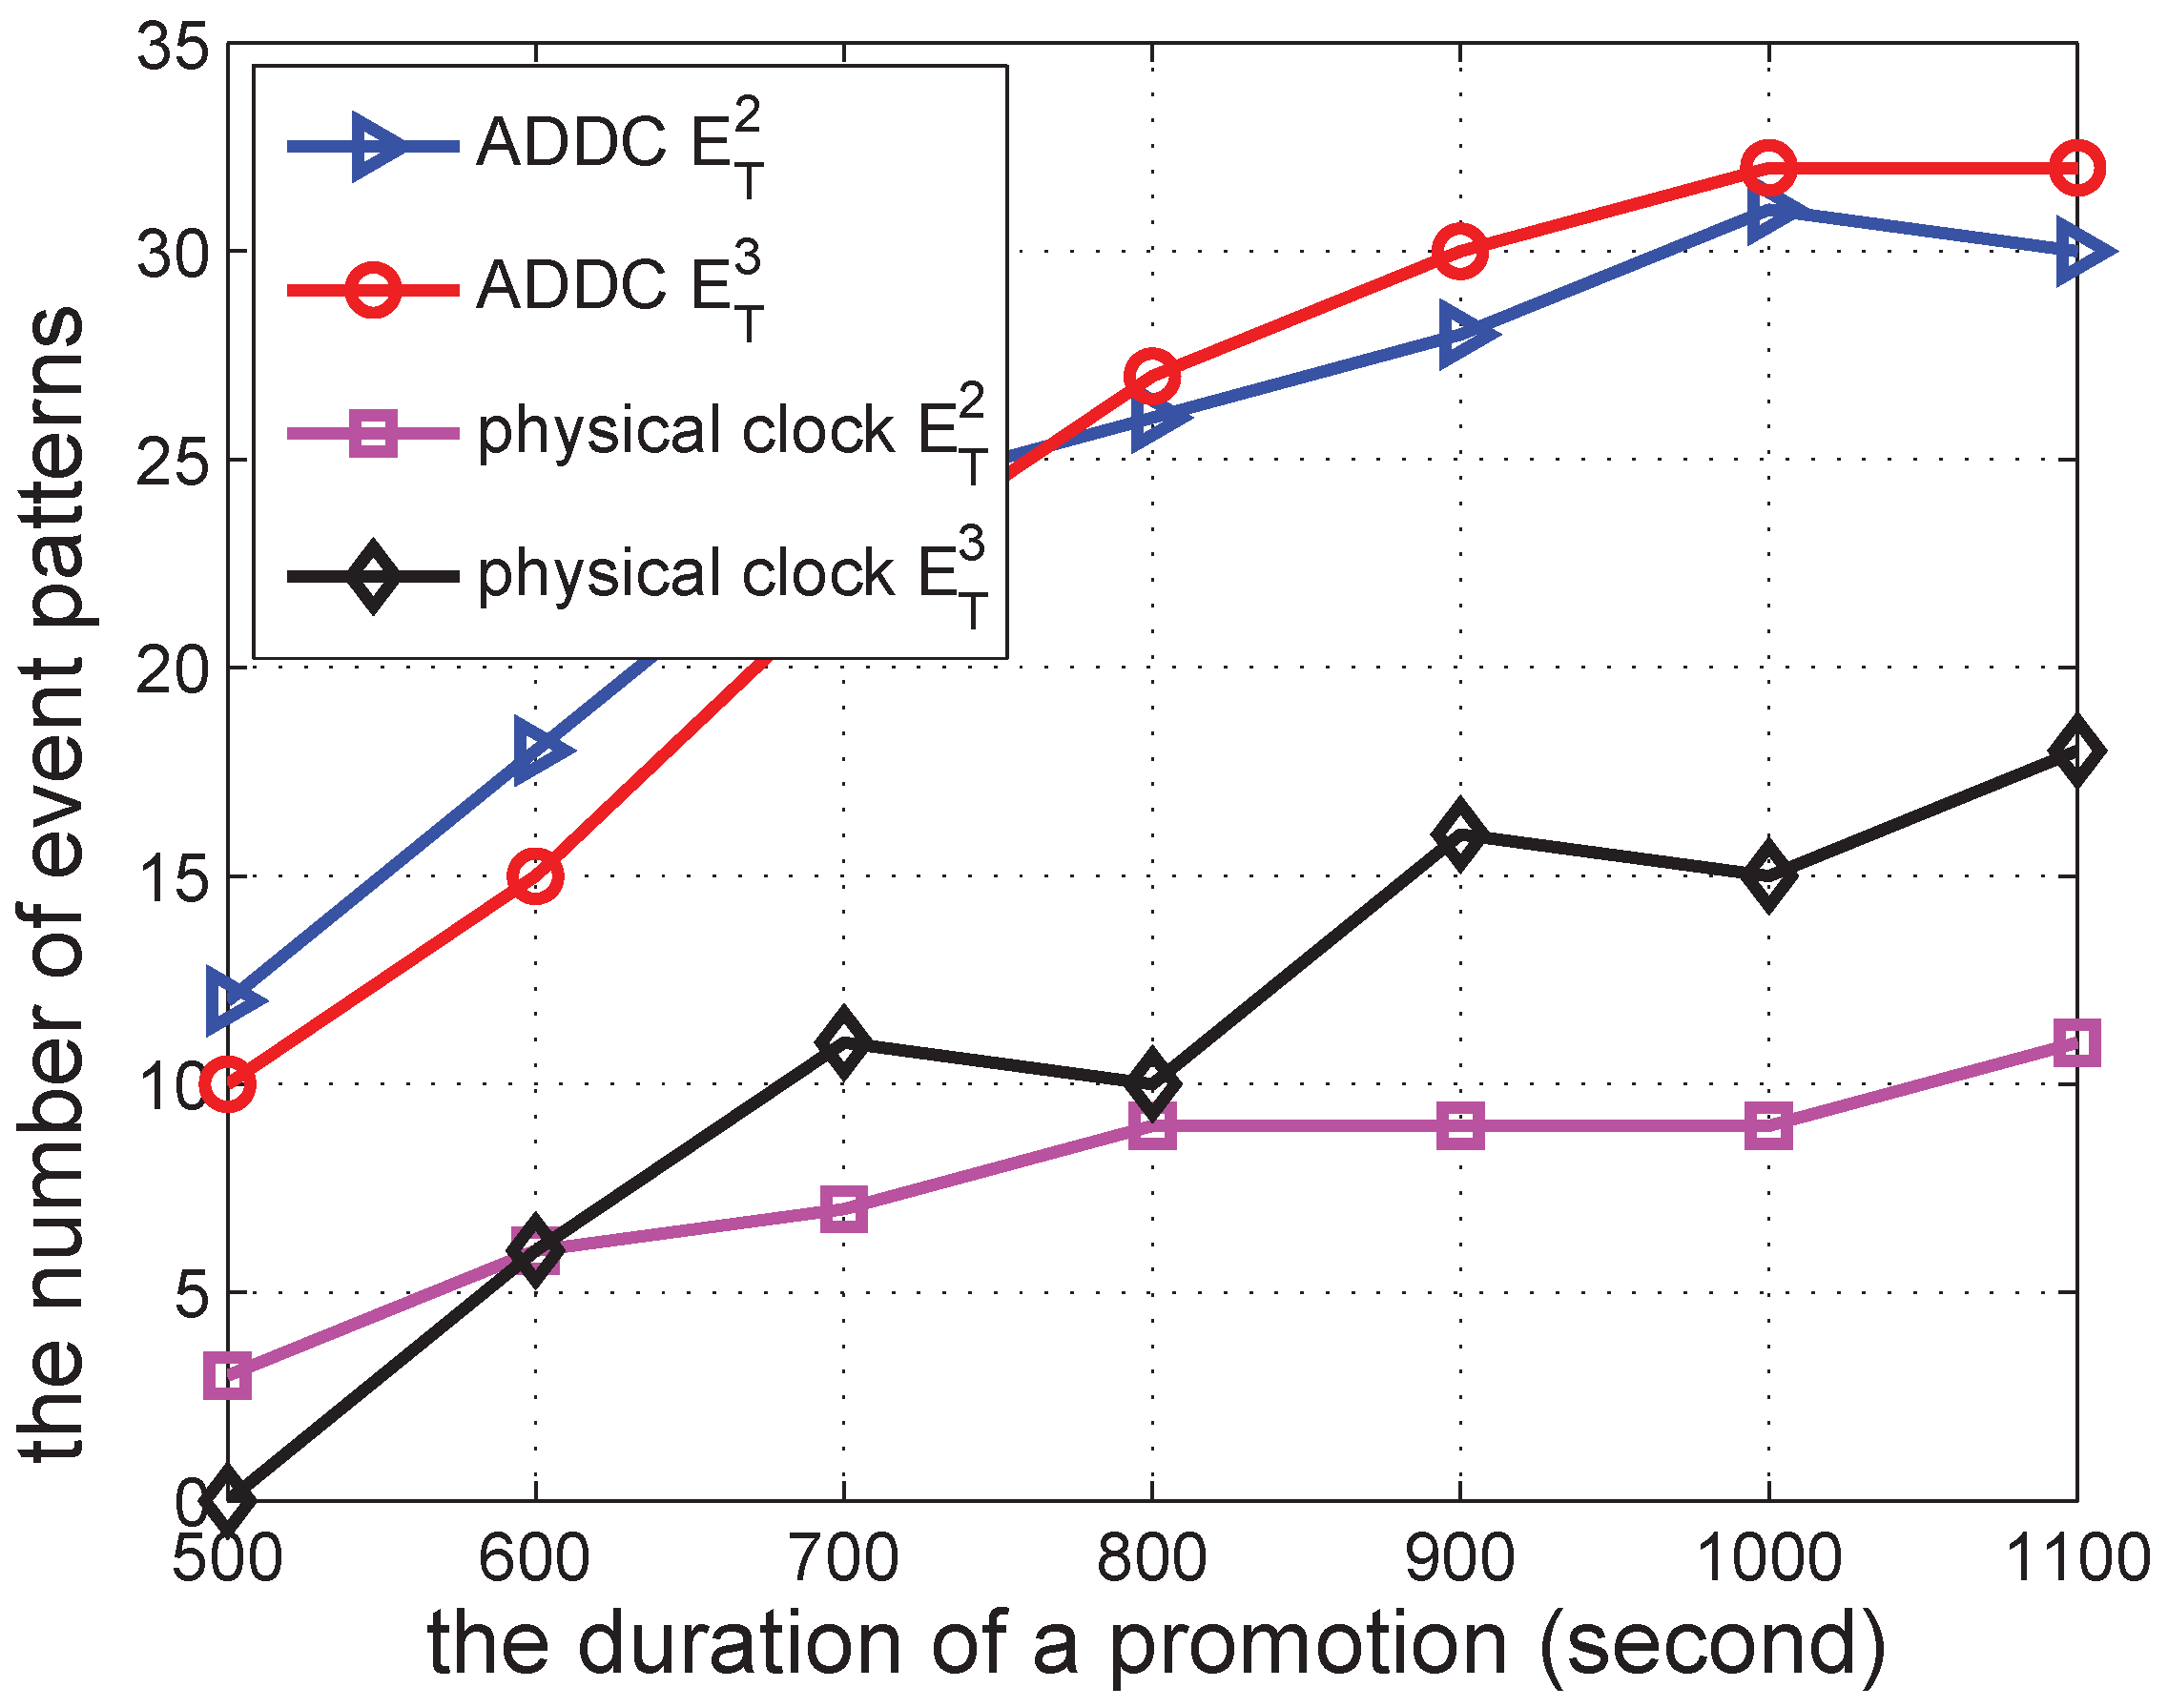
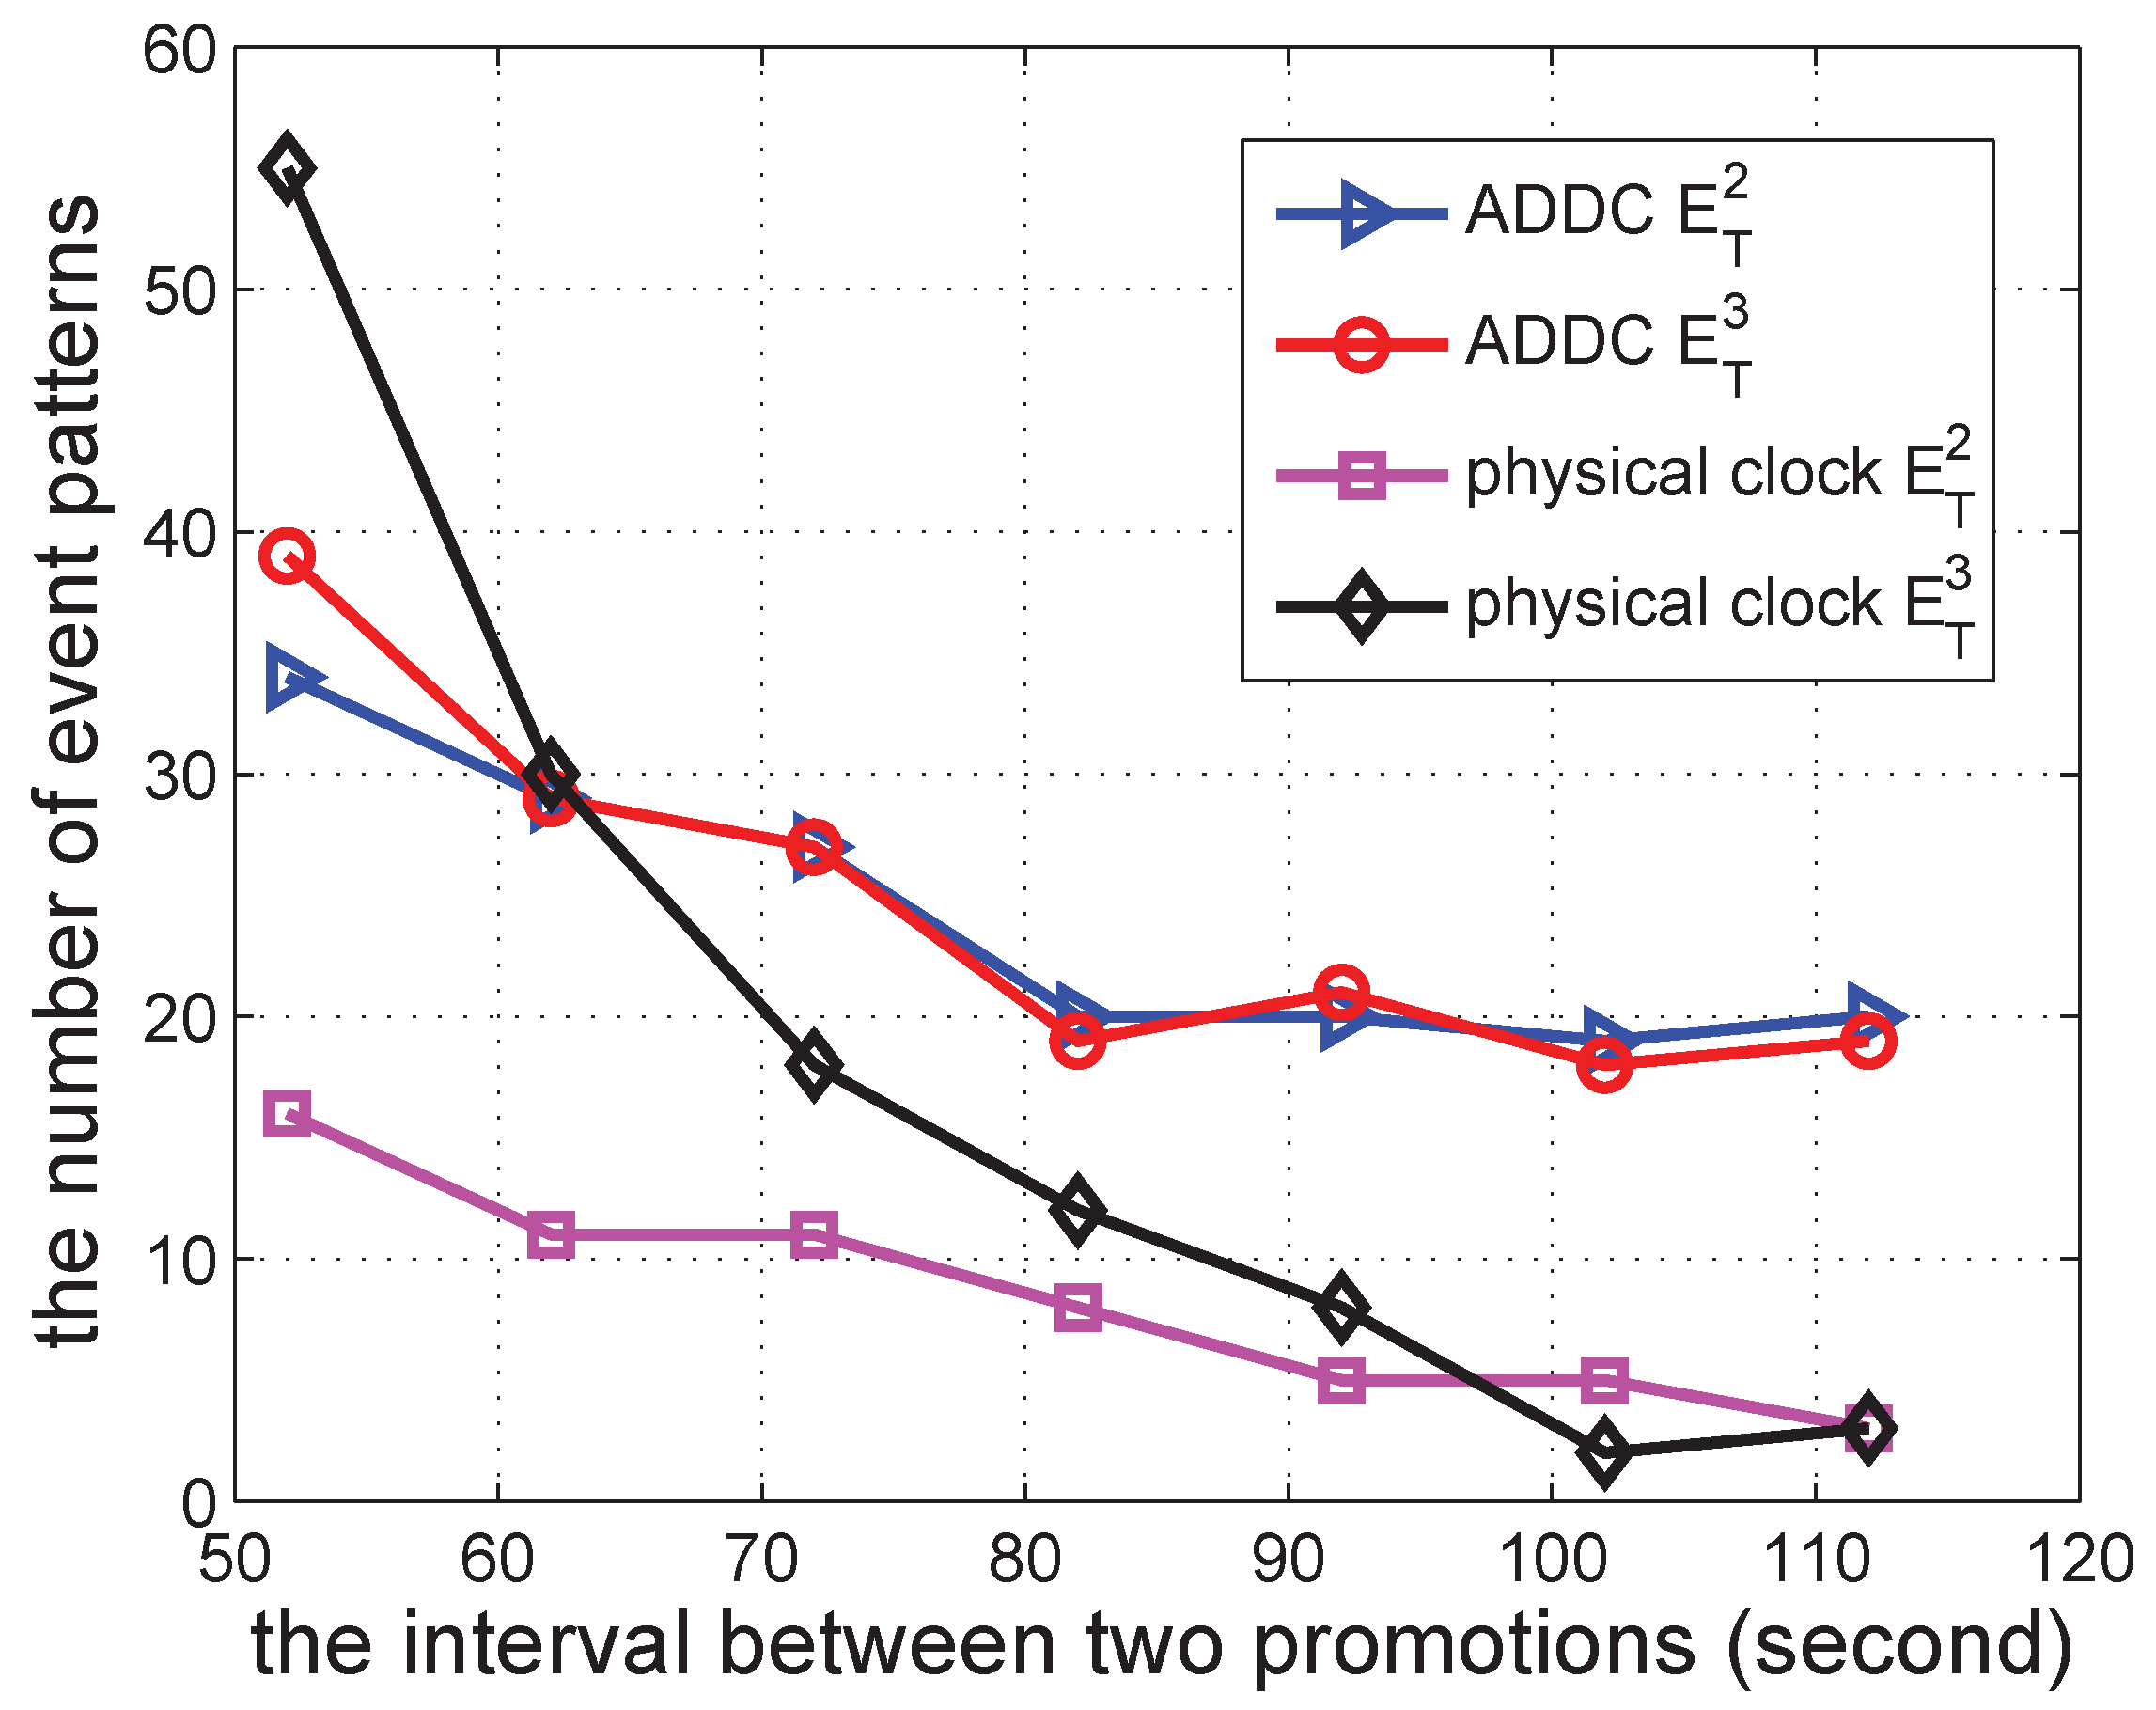
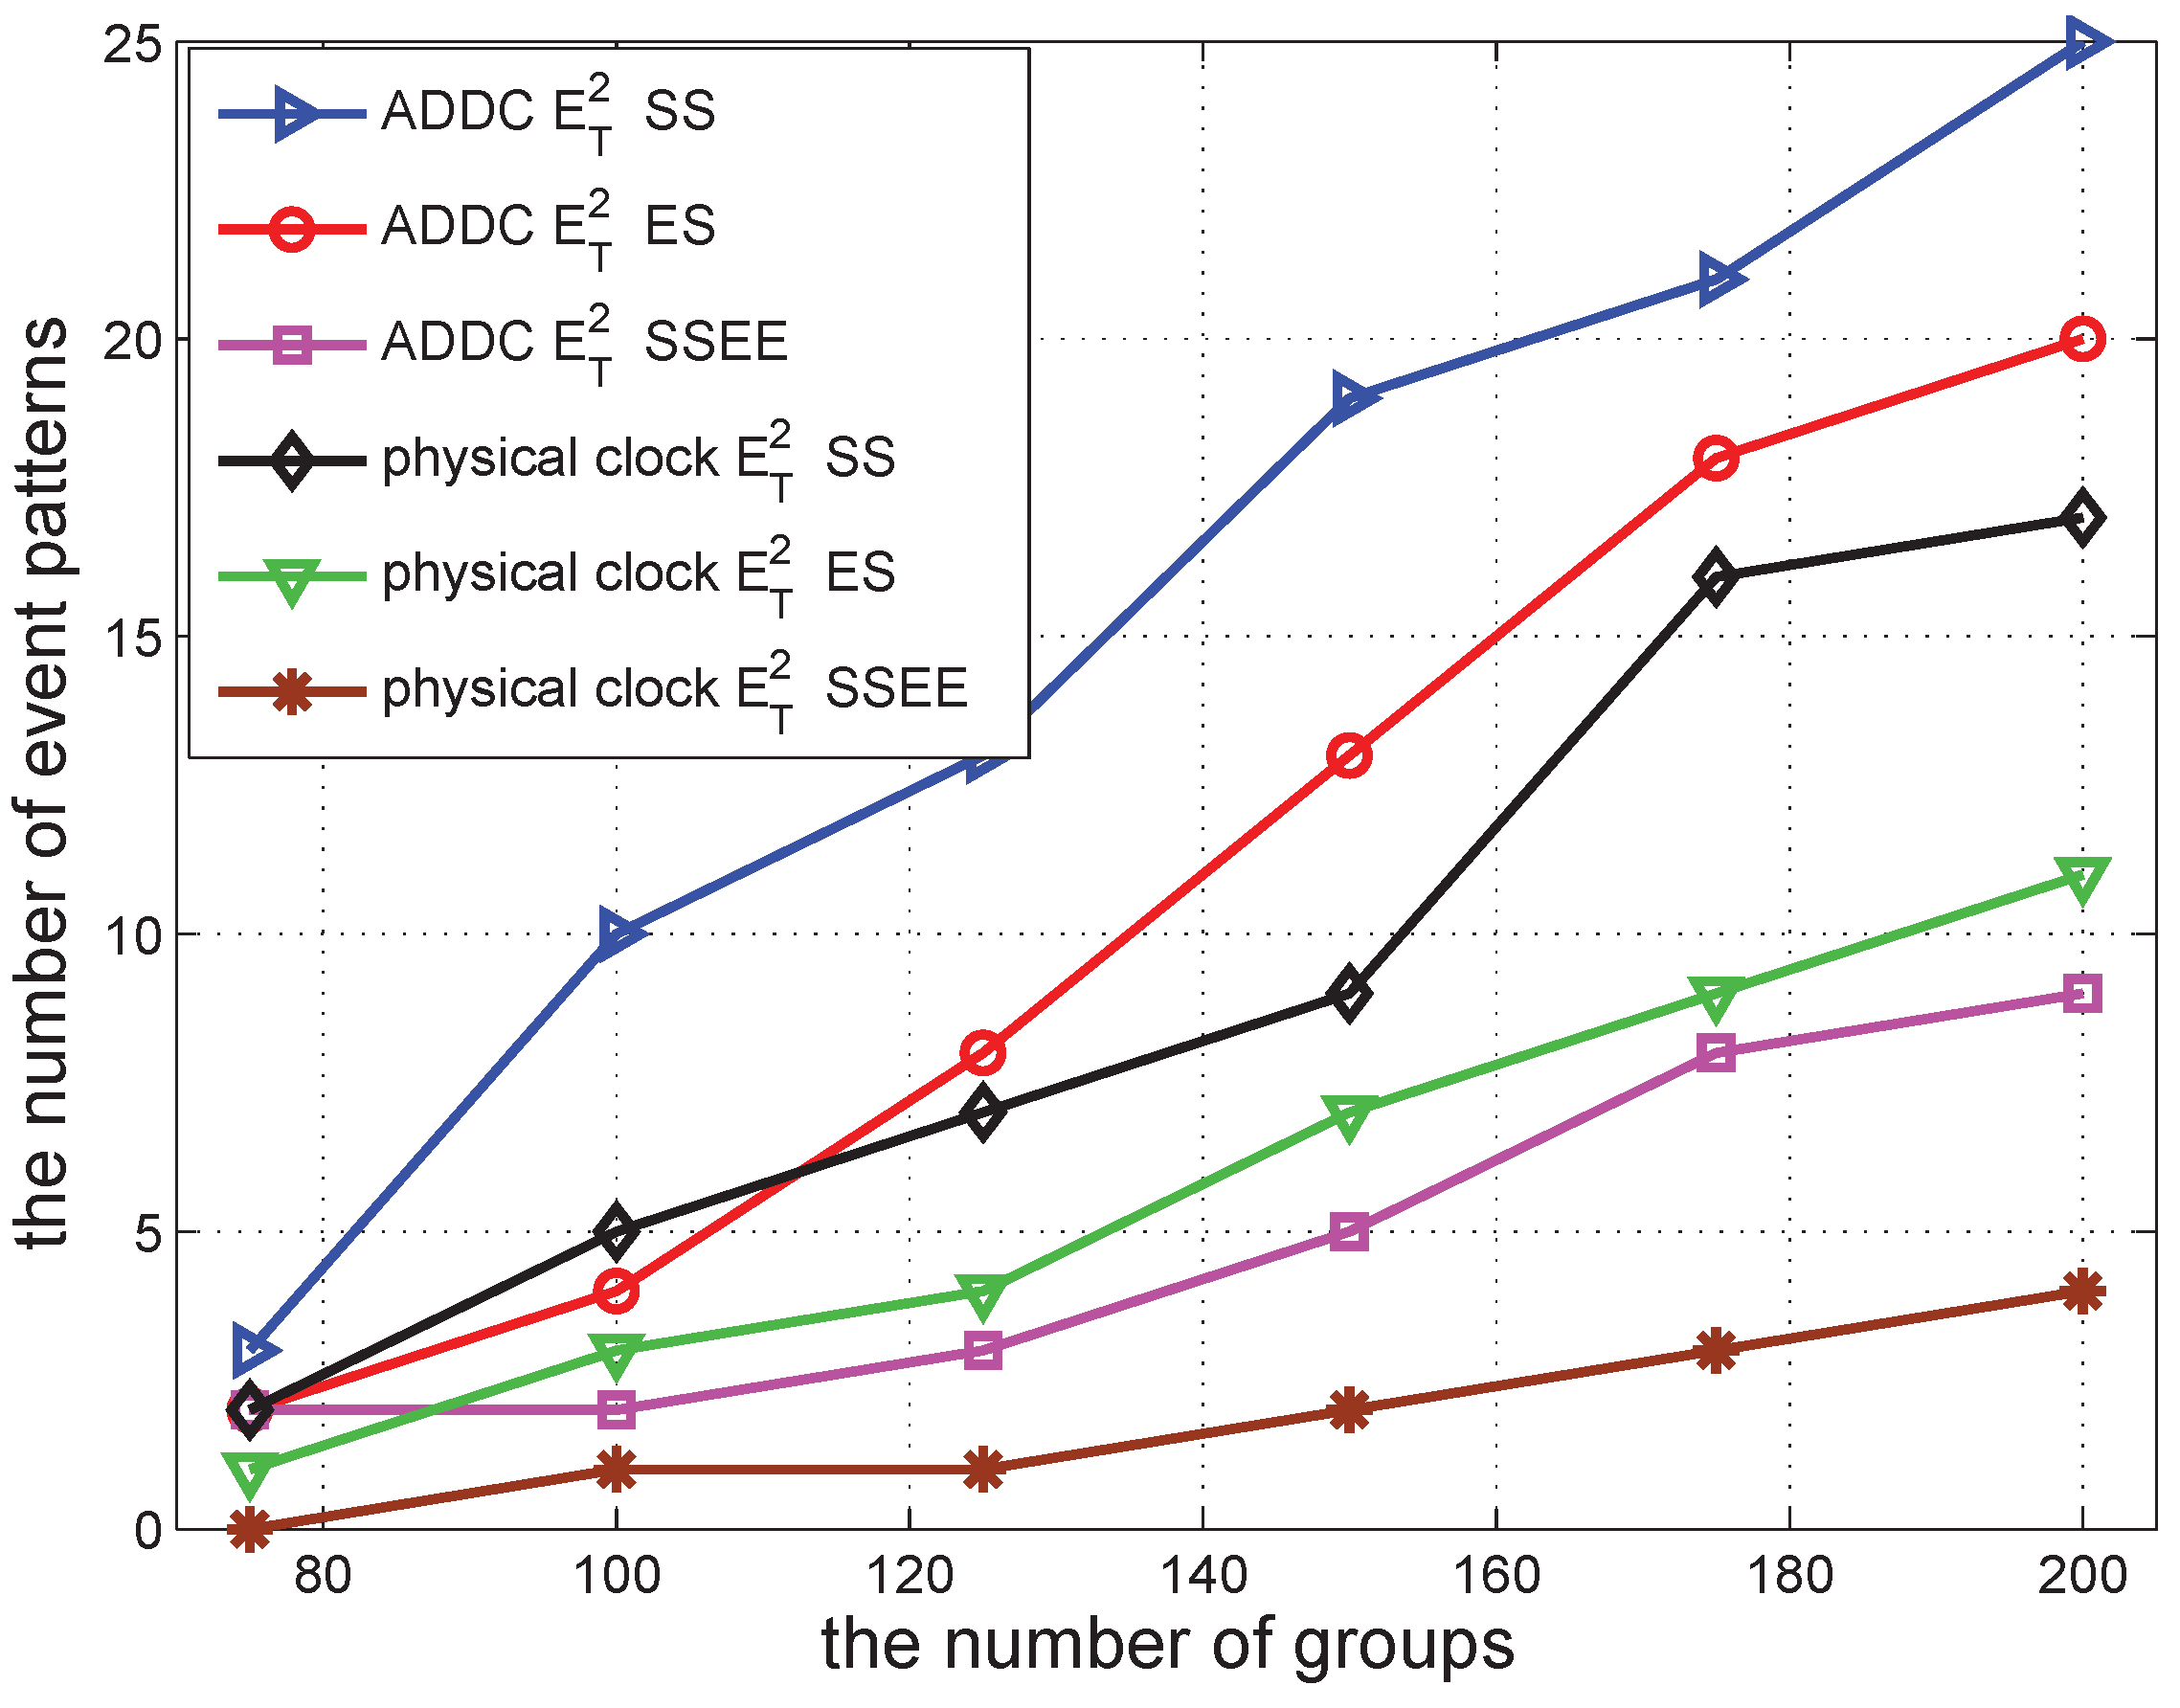
5.2. The Number of Event Patterns Detected
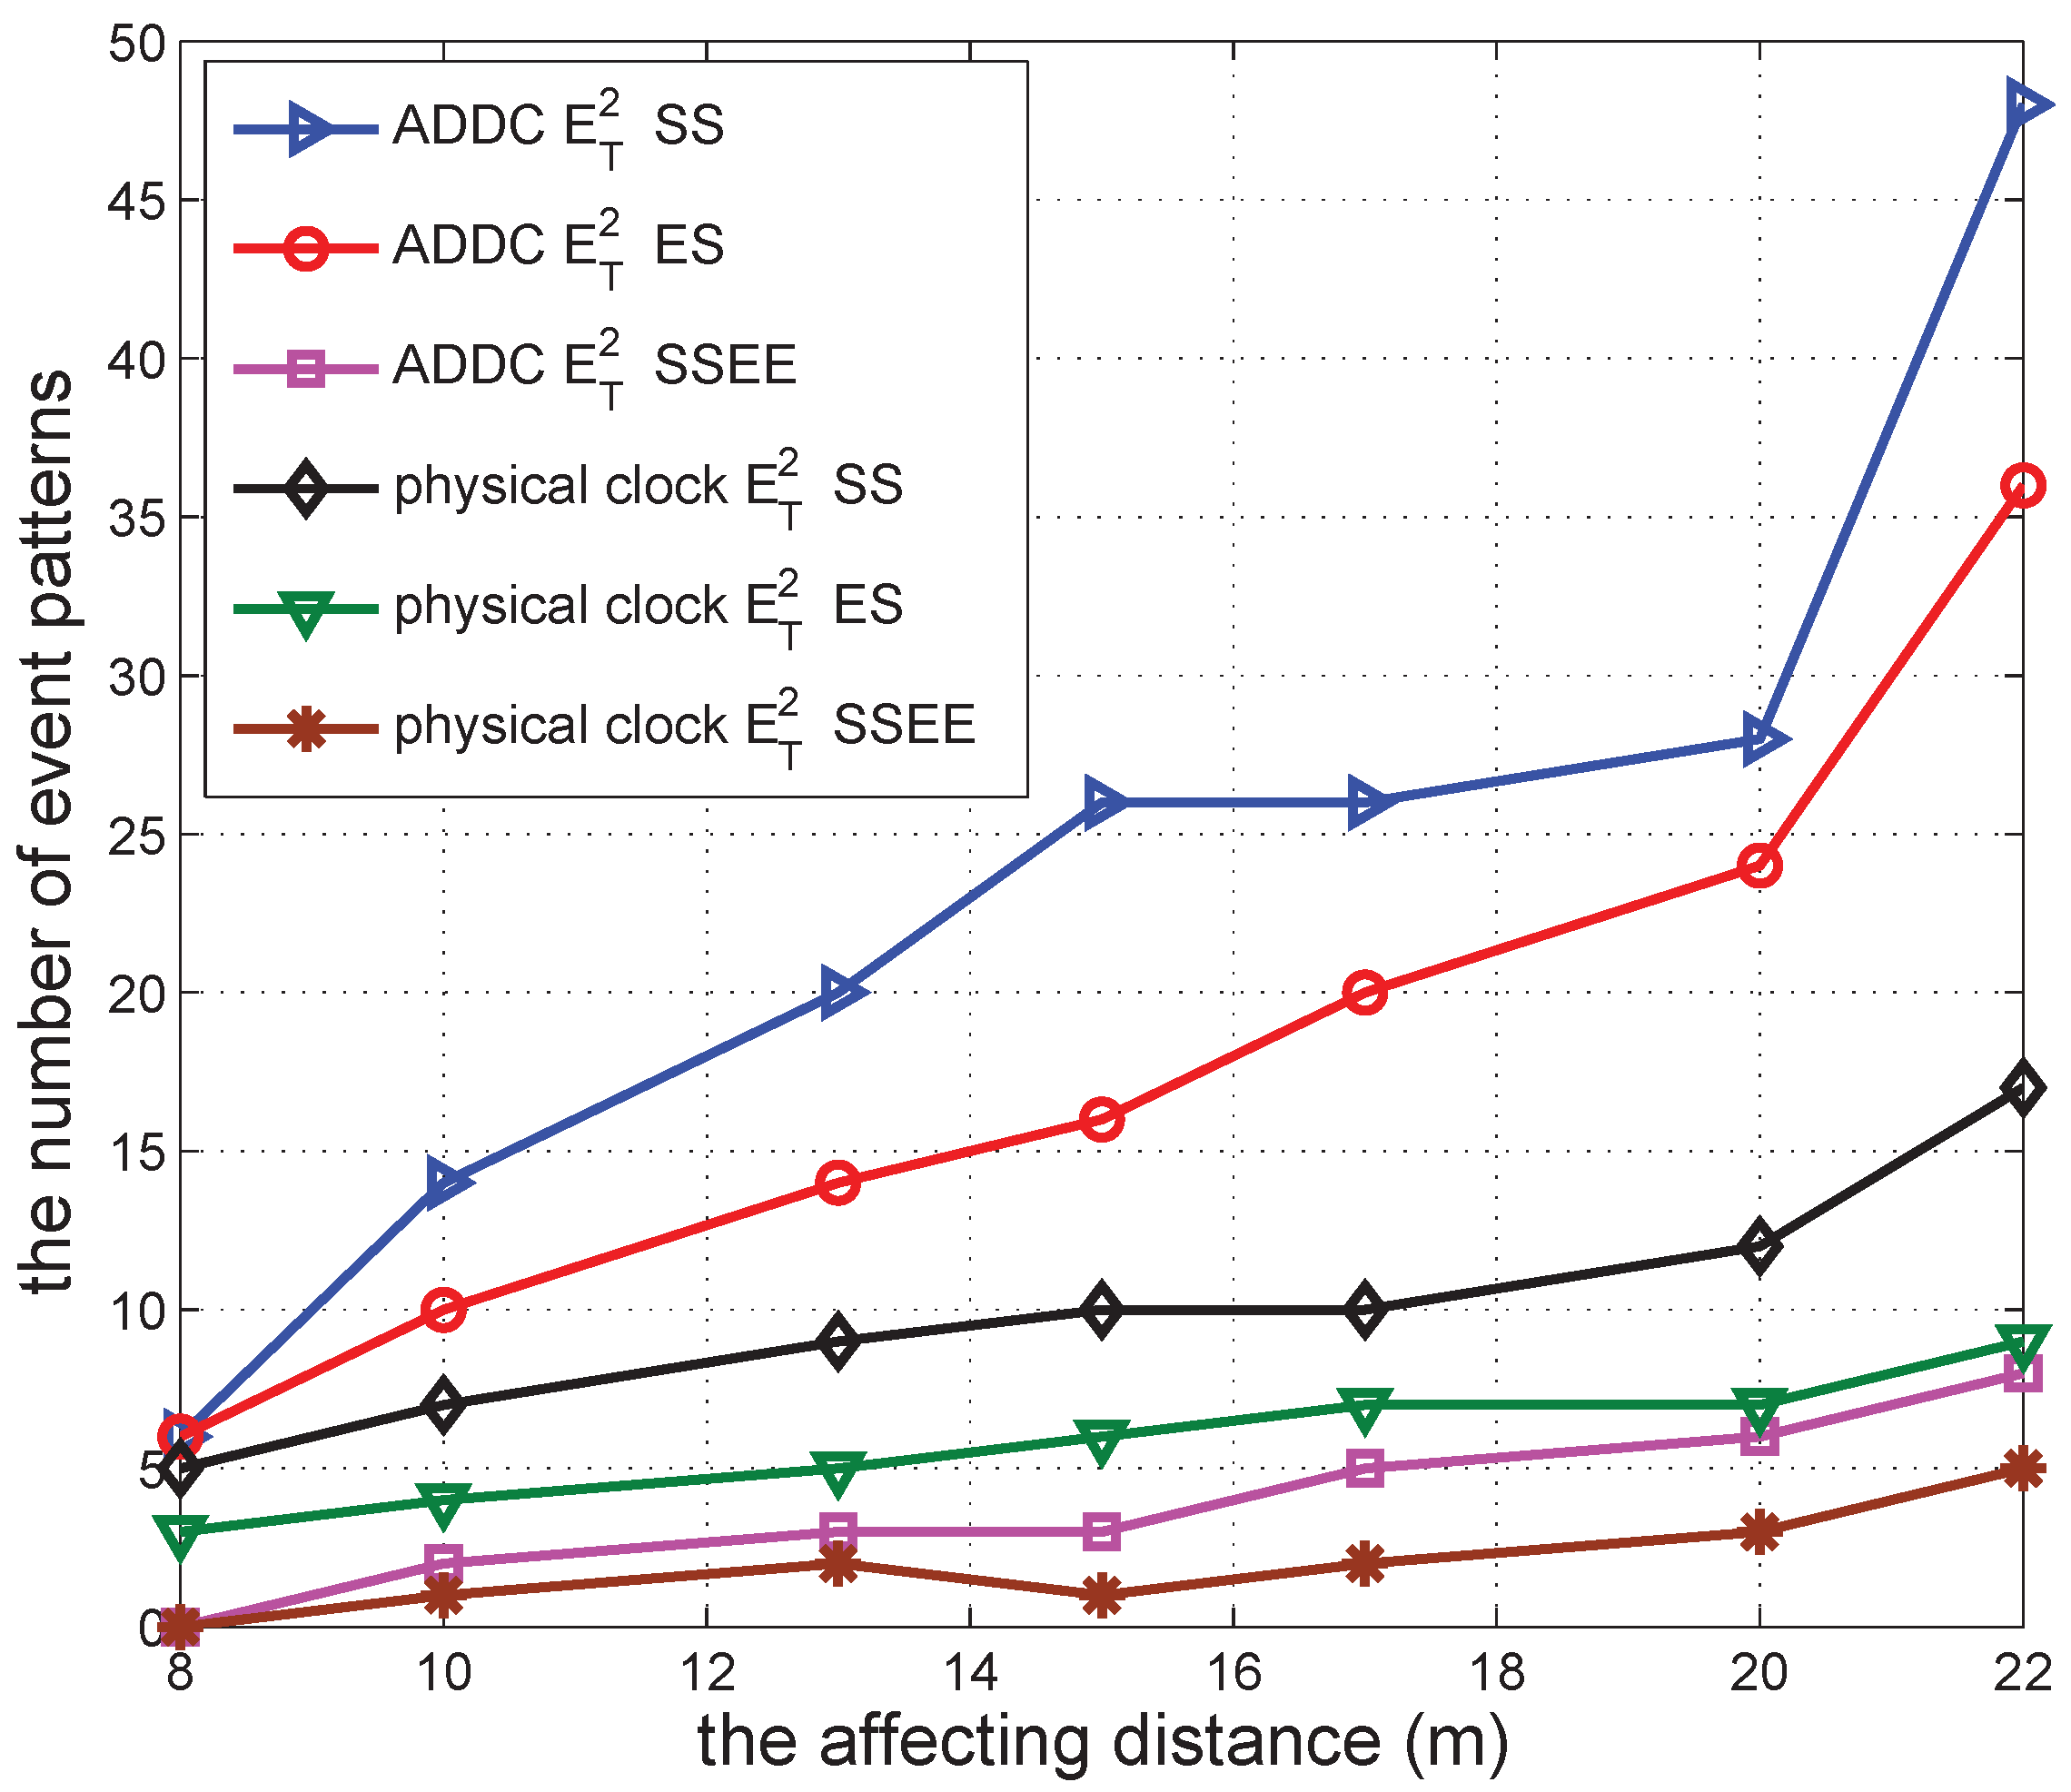
5.3. The Comparison under Different Causality Definitions
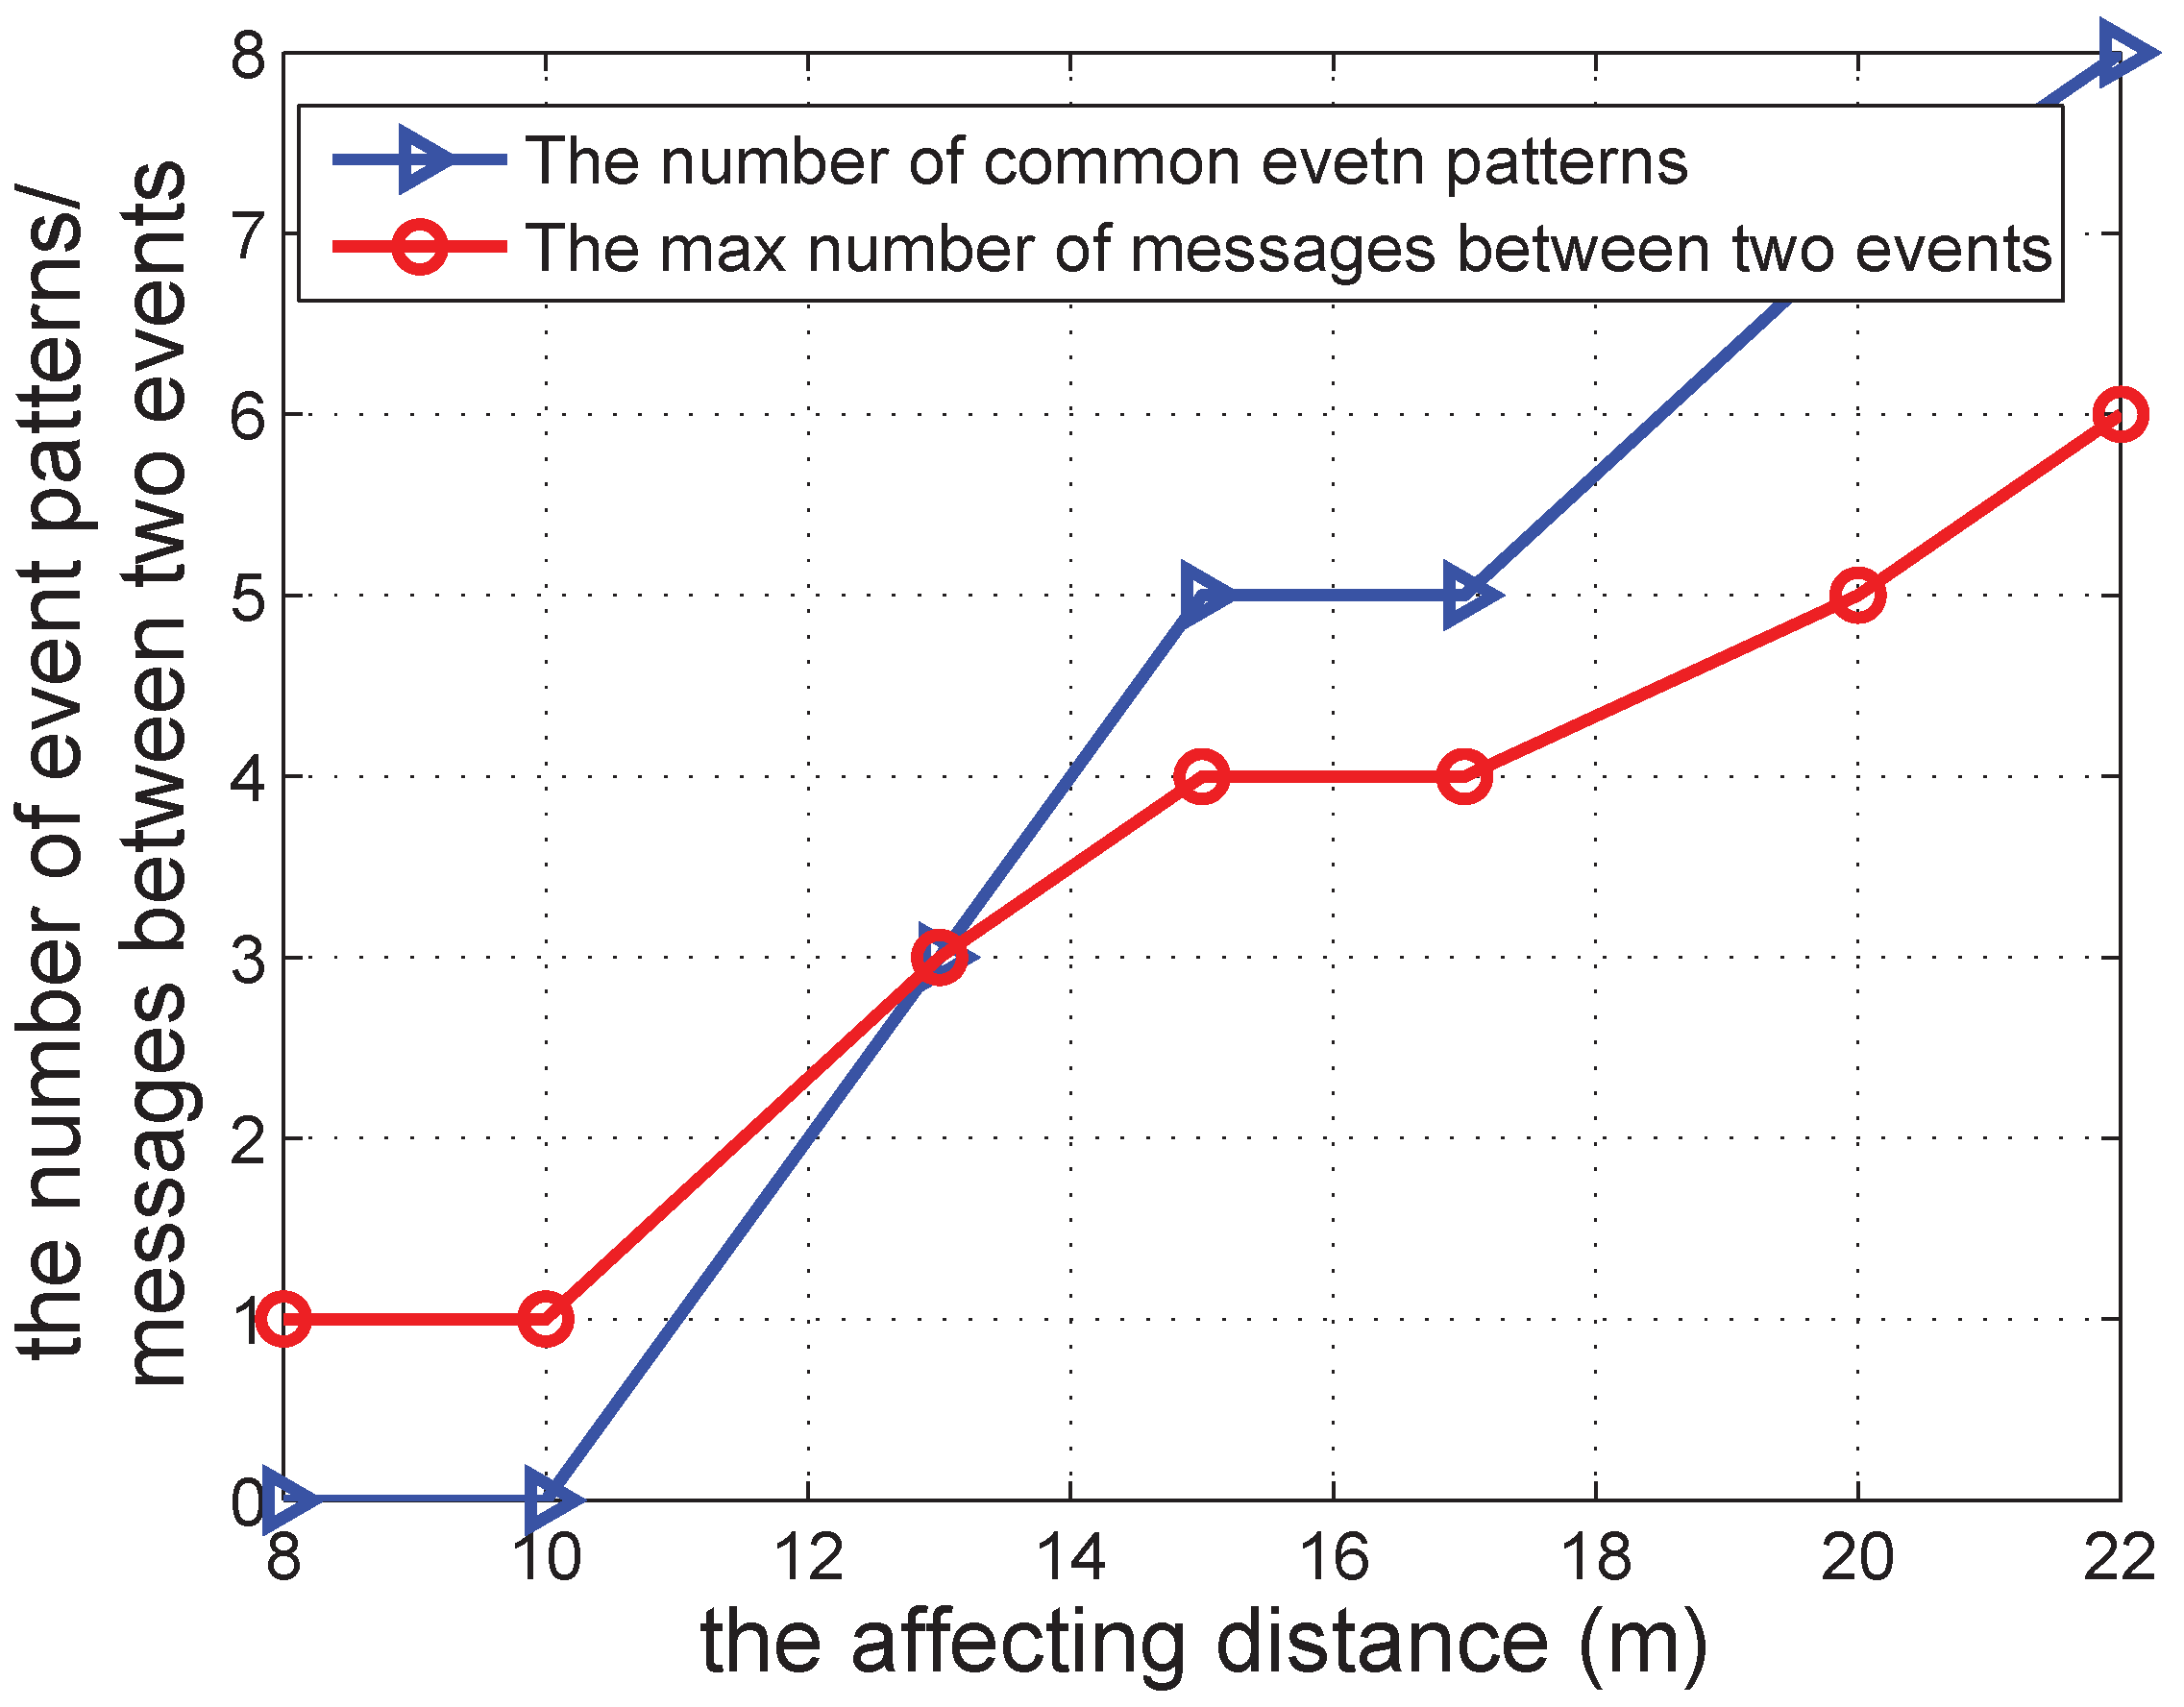
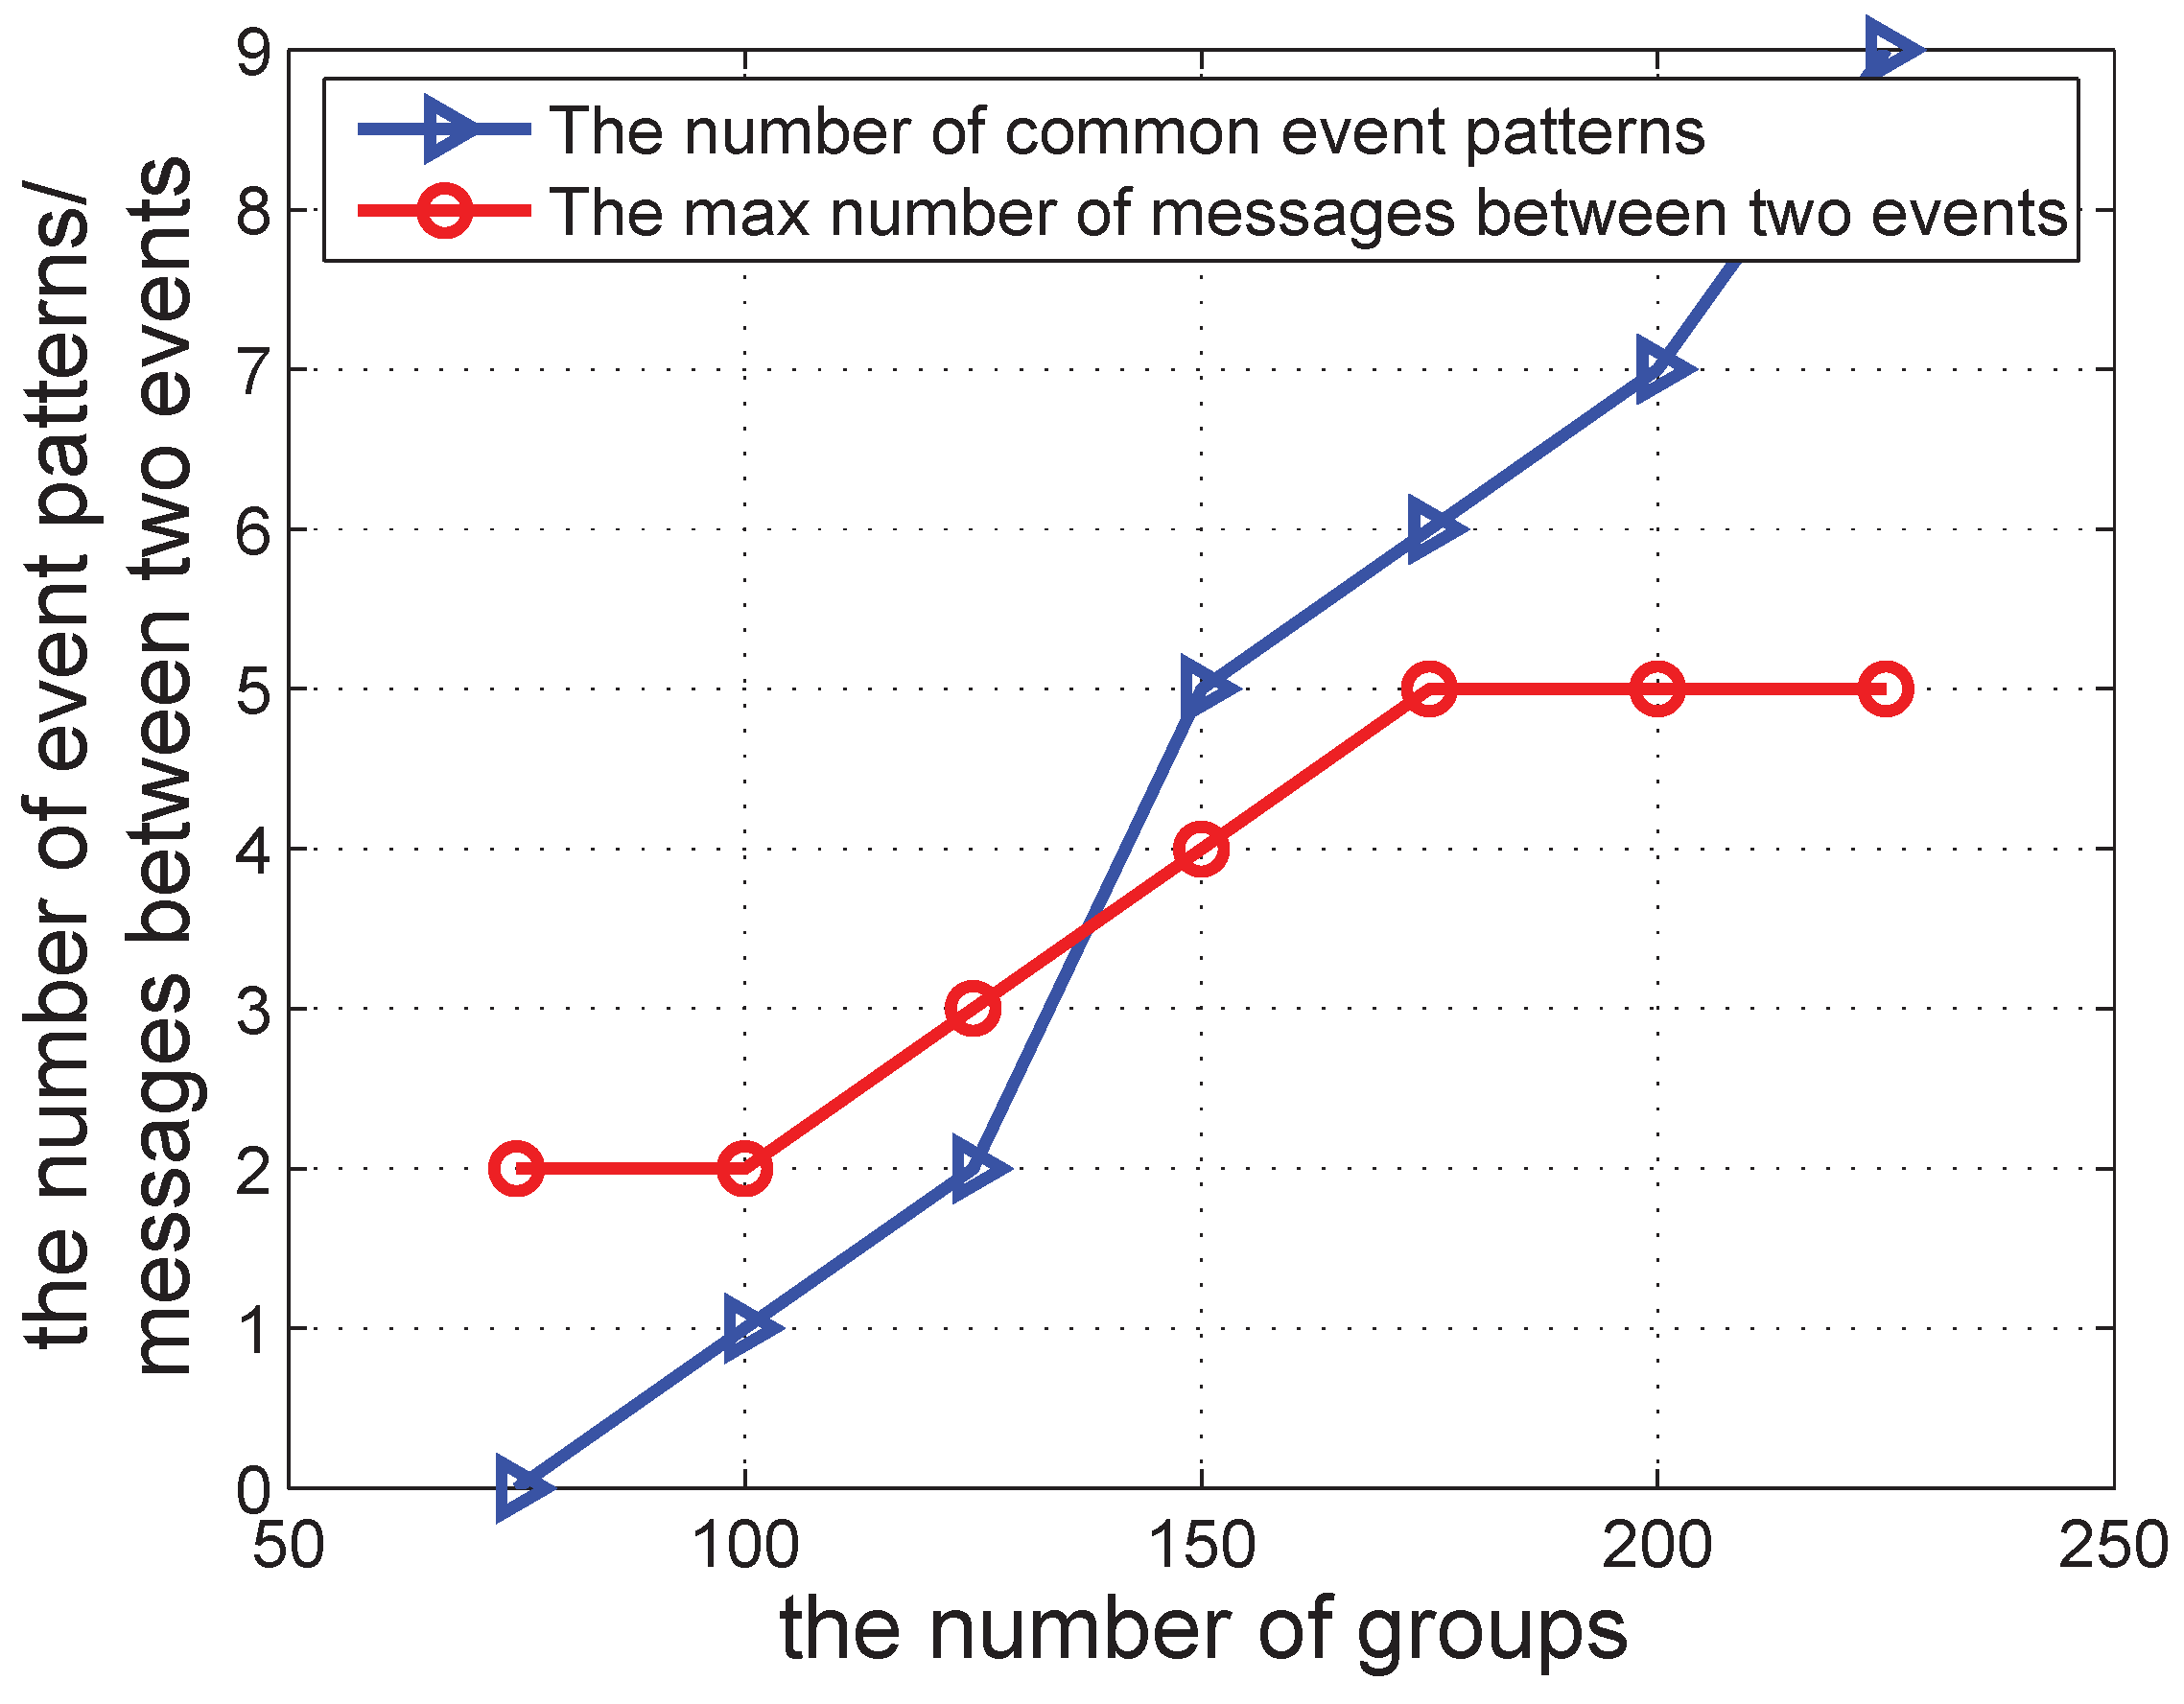
5.4. Common Event Patterns and the Number of Messages Passed
6. Related Work
7. Conclusions
Acknowledgments
Author Contributions
Conflicts of Interest
Abbreviations
| GCS | Consumption Simulation System |
| ADDC | Asynchronous Distributed Data Collection Approach |
References
- Moussaid, M.; Perozo, N.; Garnier, S.; Helbing, D.; Theraulaz, G. The Walking Behaviour of Pedestrian Social Groups and its Impact on Crowd Dynamics. PLoS ONE 2010, 5, 1–7. [Google Scholar] [CrossRef] [PubMed]
- InMobi Insights Team. Global Mobile Media Consumption. Available online: http://info.inmobi.com/rs/inmobi/images/Global_Mobile_Media_Consumption_Wave_2_Whitepaper.pdf (accessed on 25 March 2016).
- eMarketer. Mobile Ad Spend in China Hits $7 Billion this Year. Available online: http://www.emarketer.com (accessed on 25 March 2016).
- Namiot, D.; Schneps-Schneppe, M. About Location-aware Mobile Messages: Expert System Based on WiFi Spots. In Proceedings of the 2011 5th IEEE International Conference on Next Generation Mobile Applications, Services and Technologies, Cardiff, UK, 14–16 September 2011; pp. 48–53.
- Lu, E.C.; Lee, W.C.; Tseng, V. A Framework for Personal Mobile Commerce Pattern Mining and Prediction. IEEE Trans. Knowl. Data Eng. 2012, 24, 769–782. [Google Scholar] [CrossRef]
- Yang, W.S.; Cheng, H.C.; Dia, J.B. A Location-Aware Recommender System for Mobile Shopping Environments. Expert Syst. Appl. 2008, 34, 437–455. [Google Scholar] [CrossRef]
- Chen, W.; Li, Z.; Liang, Y.; Chen, J.; Zhu, W. An Asynchronous Distributed Data Collection Approach for Mobile Group Consumption. In Proceedings of the International Conference on Identification, Information & Knowledge in the Internet of Things (IIKI), Beijing, China, 22–23 October 2015; pp. 35–42.
- Kshemkalyani, A.D. A Fine-Grained Modality Classification for Global Predicates. IEEE Trans. Parallel Distrib. Syst. 2003, 14, 807–816. [Google Scholar] [CrossRef]
- Garg, V.K.; Waldecker, B. Detection of Weak Unstable Predicates in Distributed Programs. IEEE Trans. Parallel Distrib. Syst. 1994, 5, 299–307. [Google Scholar] [CrossRef]
- Lamport, L. Time, Clocks, and the Ordering of Events in a Distributed System. Commun. ACM 1978, 21, 558–565. [Google Scholar] [CrossRef]
- Fidge, C. Logical Time in Distributed Computing Systems. IEEE Comput. 1991, 24, 28–33. [Google Scholar] [CrossRef]
- Kshemkalyani, A.D. Temporal Interactions of Intervals in Distributed Systems. J. Comput. Syst. Sci. 1996, 52, 287–298. [Google Scholar] [CrossRef]
- Zhu, W.; Cao, J.; Raynal, M. Predicate Detection in Asynchronous Distributed Systems: A Probabilistic Approach. IEEE Trans. Comput. 2016, 65, 173–186. [Google Scholar] [CrossRef]
- Molitor, D.; Reichhart, P.; Spann, M.; Ghose, A. Measuring the Effectiveness of Location-Based Pull Advertising: A Randomized Field Experiment. Available online: http://papers.ssrn.com/ (accessed on 25 March 2016).
- Luo, X.; Andrews, M.; Fang, Z.; Phang, C.W. Mobile Targeting. Manag. Sci. 2013, 60, 1738–1756. [Google Scholar] [CrossRef]
- Andrews, M.; Luo, X.; Fang, Z.; Ghose, A. Mobile Ad Effectiveness: Hyper-Contextual Targeting with Crowdedness. Mark. Sci. 2014. Available online: http://ssrn.com/abstract=2439388 (accessed on 25 March 2016). [Google Scholar]
- Molitor, D.; Reichhart, P.; Spann, M. Location-Based Advertising: Measuring the Impact of Context-Specific Factors on Consumers’ Choice Behavior. Munich Sch. Manag. 2013. Available online: http://ssrn.com/abstract=2116359 (accessed on 25 March 2016). [Google Scholar]
- Harmon, R.; Unni, R. Perceived Effectiveness of Push vs. Pull Mobile Location-Based Advertising. J. Interact. Advert. 2007, 7, 28–40. [Google Scholar]
- Fisher, R.J. Group-Derived Consumption: The Role of Similarity and Attractiveness in Identification with a Favorite Sports Team. Adv. Consum. Res. 1998, 25, 283–288. [Google Scholar]
- Tseng, S.M.; Tsui, C.F. Mining Multilevel and Location-Aware Service Patterns in Mobile Web Environments. IEEE Trans. Syst. Man Cybern. Part B Cybern. 2004, 34, 2480–2485. [Google Scholar] [CrossRef]
- Tseng, V.; Lin, K. Mining Sequential Mobile Access Patterns Efficiently in Mobile Web Systems. In Proceedings of the 19th International Conference on Advanced Information Networking and Applications (AINA), Taipei, Taiwan, 28–30 March 2005; pp. 762–767.
- Yun, C.H.; Chen, M.S. Mining Mobile Sequential Patterns in a Mobile Commerce Environment. IEEE Trans. Syst. Man Cybern. Part C Appl. Rev. 2007, 37, 278–295. [Google Scholar] [CrossRef]
- Hadjiefthymiades, S.; Merakos, L. Proxies+ Path Prediction: Improving Web Service Provision in Wireless—Mobile Communications. Mob. Netw. Appl. 2003, 8, 389–399. [Google Scholar] [CrossRef]
- Akoush, S.; Sameh, A. Mobile User Movement Prediction Using Bayesian Learning for Neural Networks. In Proceedings of the International Conference on Wireless Communications and Mobile Computing (IWCMC), Honolulu, HI, USA, 12–16 August 2007; pp. 191–196.
- Anagnostopoulos, C.; Hadjiefthymiades, S. Intelligent Trajectory Classification for Improved Movement Prediction. IEEE Trans. Syst. Man Cybern. Syst. 2014, 44, 1301–1314. [Google Scholar] [CrossRef]
- Jeung, H.; Liu, Q.; Shen, H.T.; Zhou, X. A Hybrid Prediction Model for Moving Objects. In Proceedings of the IEEE 24th International Conference on Data Engineering (ICDE), Cancun, Mexico, 7–12 April 2008.
- Kanda, T.; Glas, D.F.; Shiomi, M.; Ishiguro, H.; Hagita, N. Who will be the Customer? A Social Robot that Anticipates People’s Behavior from their Ttrajectories. In Proceedings of the ACM International Joint Conference on Pervasive and Ubiquitous Computing (UbiComp), Seoul, Korea, 21–24 September 2008; pp. 380–389.
- Guo, W. Research on Mobile Commerce Based on RFID. In Proceedings of the IEEE International Conference on Service Operations and Logistics, and Informatics (SOLI), Beijing, China, 12–15 October 2008; Volume 1, pp. 853–857.
- Komninos, A.; Barrie, P.; Newman, J.; Landsburgh, S. Me-Commerce: An Infrastructure for Personal Predictive Mobile Commerce. In Proceedings of the International Conference on Mobile Business (ICMB), Copenhagen, Danmark, 26–27 June 2006.
- Zhu, W.Y.; Peng, W.C.; Hung, C.C.; Lei, P.R.; Chen, L.J. Exploring Sequential Probability Tree for Movement-Based Community Discovery. IEEE Trans. Knowl. Data Eng. 2014, 26, 2717–2730. [Google Scholar] [CrossRef]
- Anagnostopoulos, C.; Hadjiefthymiades, S.; Kolomvatsos, K. Time-Optimized User Grouping in Location Based Services. Comput. Netw. 2015, 81, 220–244. [Google Scholar] [CrossRef]
- Anagnostopoulos, C. Time-Optimized Contextual Information Forwarding in Mobile Sensor Networks. J. Parallel Distrib. Comput. 2014, 74, 2317–2332. [Google Scholar] [CrossRef]
- Cooper, R.; Marzullo, K. Consistent Detection of Global Predicates. In Proceedings of the ACM/ONR Workshop on Parallel and Distributed Debugging, Santa Cruz, CA, USA, 20–21 May 1991; pp. 163–173.
- Marzullo, K.; Neiger, G. Detection of Global State Predicates. In Proceedings of the 5th International Workshop on Distributed Algorithms (WDAG), Delphi, Greece, 7–9 October 1991; pp. 254–272.


| Variable Name | Description |
|---|---|
| shopID | ID of a shop |
| PROMOTION() | promotion information broadcast by shopID |
| accepted | the variable denoting whether a consumer accepts a promotion |
| location | current location of a consumer |
| initiator | the first shop sending the message |
| sender | the previous shop sending the message |
| eventID | ID of an event |
| depth | the depth of sender in the routing tree |
| recClock | the vector clock attached to a message |
| clock | the vector clock maintained by a consumer or a shop |
| cardinality | the number of consumers in a shop |
| persons | a collection recording detailed consumer IDs in a shop |
| personID | ID of a consumer |
| increaseID | a function to generate the ID of a new event |
| gatherThreshold | the threshold of gathered consumers to denote the occurrence of a gathering event |
| detFlag | the type of causality relation to be detected |
| eventList | a list of events received by the current shop |
| oriStart[eventID] | the initiator of eventID after it starts, as the current shop knows |
| oriEnd[eventID] | the initiator of eventID after it ends, as the current shop knows |
| SS[preID] | a flag recording the detection result of the first part of SSEE () |
| parent | the parent of the current shop in the routing tree |
| children | the children of the current shop in the routing tree |
| depth[eventID] | the parent of the current shop in the routing tree regarding eventID |
| MSG_NTER(A) | a message denoting that A enters the current shop |
| MSG_OUT(A) | a message denoting that A exits the current shop |
| START | a message denoting the start of a gathering event |
| END | a message denoting the end of a gathering event |
| SUCCESS | a message denoting a successful detection of a causality relation |
| REVERSE | a message to notify the reverse of the routing tree |
| E | the specification of an event that needs to be detected |
| coordinator[E] | denotes whether the current node is the coordinator of E |
© 2016 by the authors; licensee MDPI, Basel, Switzerland. This article is an open access article distributed under the terms and conditions of the Creative Commons by Attribution (CC-BY) license (http://creativecommons.org/licenses/by/4.0/).
Share and Cite
Zhu, W.; Chen, W.; Hu, Z.; Li, Z.; Liang, Y.; Chen, J. Data Collection for Mobile Group Consumption: An Asynchronous Distributed Approach. Sensors 2016, 16, 482. https://doi.org/10.3390/s16040482
Zhu W, Chen W, Hu Z, Li Z, Liang Y, Chen J. Data Collection for Mobile Group Consumption: An Asynchronous Distributed Approach. Sensors. 2016; 16(4):482. https://doi.org/10.3390/s16040482
Chicago/Turabian StyleZhu, Weiping, Weiran Chen, Zhejie Hu, Zuoyou Li, Yue Liang, and Jiaojiao Chen. 2016. "Data Collection for Mobile Group Consumption: An Asynchronous Distributed Approach" Sensors 16, no. 4: 482. https://doi.org/10.3390/s16040482