Article

Piezoelectric Sensor to Measure Soft and Hard Stiffness with High Sensitivity for Ultrasonic Transducers

1
Department of Mechanical Engineering, National Taiwan University, Taipei 106, Taiwan
2
Mechanical and Systems Research Laboratories, Industrial Technology Research Institute, Hsinchu 31040, Taiwan
*
Author to whom correspondence should be addressed.
Sensors 2015, 15(6), 13670-13679; https://doi.org/10.3390/s150613670
Submission received: 3 April 2015 / Revised: 5 June 2015 / Accepted: 8 June 2015 / Published: 11 June 2015
(This article belongs to the Section Physical Sensors)

Abstract

:
During dental sinus lift surgery, it is important to monitor the thickness of the remaining maxilla to avoid perforating the sinus membrane. Therefore, a sensor should be integrated into ultrasonic dental tools to prevent undesirable damage. This paper presents a piezoelectric (PZT) sensor installed in an ultrasonic transducer to measure the stiffness of high and low materials. Four design types using three PZT ring materials and a split PZT for actuator and sensor ring materials were studied. Three sensor locations were also examined. The voltage signals of the sensor and the displacement of the actuator were analyzed to distinguish the low and high stiffness. Using sensor type T1 made of the PZT-1 material and the front location A1 provided a high sensitivity of 2.47 Vm/kN. The experimental results demonstrated that our design can measure soft and hard stiffness.

1. Introduction

Recently, ultrasonic dental tools have been used extensively in scaling, micro-invasive implants, and other oral surgeries [1,2,3]. Ultrasonic dental tools have many benefits, such as good cutting precision, fine capability for teeth removal, simplicity of operation, and low pain effects. However, one danger during sinus lift surgery is perforation of the sinus membrane [4,5]. Although several types of ultrasonic measuring devices have been developed to diagnose dental health [6,7,8], these instruments cannot be operated simultaneously with the ultrasonic dental tool. Therefore, it is necessary to integrate a sensor into ultrasonic dental tools to avoid undesirable damage.
Past research [9] has examined the placement sensors on the bonding arm and the best sensor placement to produce signals that can be used to monitor vibration. Or and Feng [10,11] suggested recording mechanical vibrations by installing a piezoelectric (PZT) sensor in the horn to detect them. Significant changes were observed at the second harmonic of the vibration signal, and the bond shear strength could be predicted. Maruyama [12] published a technique for combining ultrasonic dental tools and dental health measurement instruments. They used a resonance frequency tracing system to detect the stiffness at the contact point during dental treatment. In common clinical cases, the operating contact force is usually below 10 N. At forces below 6 N, however, the sensitivity and resolution of the system are insufficiently high.
This work presents a method of measuring the stiffness with high sensitivity, especially in the case of soft materials. The method employs PZT materials as the sensor to measure soft and hard stiffness. By analyzing the output voltage of the sensor, the stiffness of oral tissue can be detected. We designed several types of PZT sensor using different PZT materials and tested them at different locations. Even with light contact, the sensor maintained a high stiffness sensitivity value of about 2.47 Vm/kN. The combination of actuator and sensor can be used simultaneously for dental treatment and stiffness sensing.

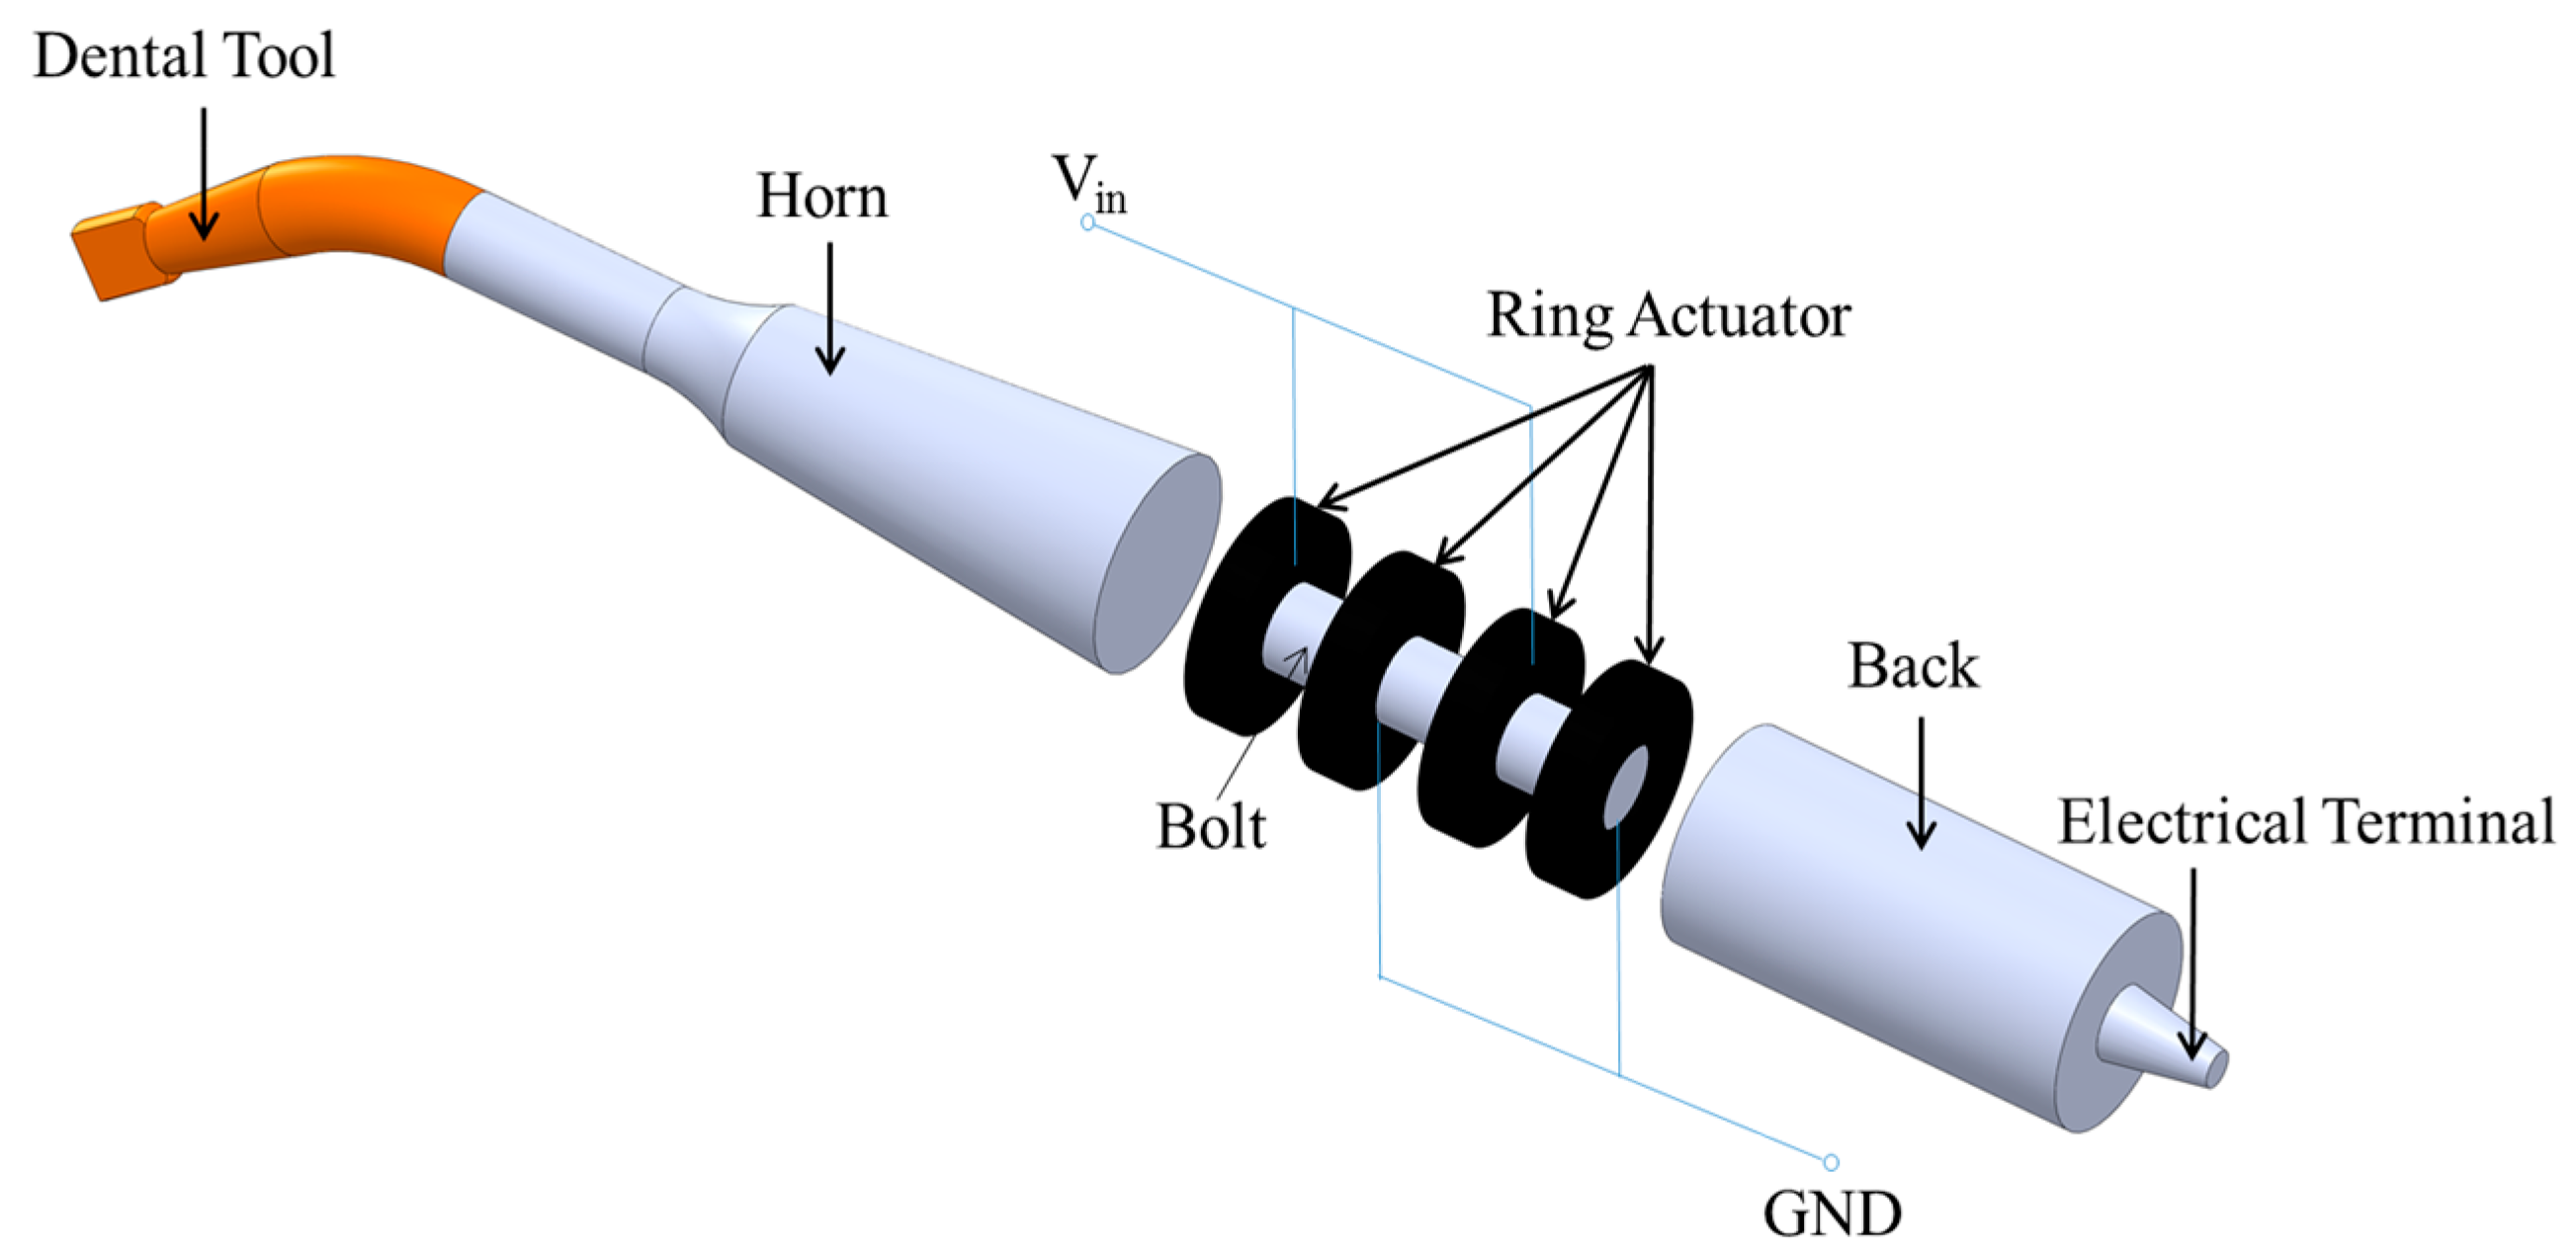
2. Design of PZT Sensor

2.1. Design Construction

A conventional ultrasonic dental handpiece tool, shown in Figure 1, consists of a dental tool and a Langevin ultrasonic transducer. The Langevin transducer includes a sandwich structure of PZT rings clamped between the horn and the back section. Longitudinal vibration is generated when the alternative voltage is applied to the PZT electrode, and the amplitude is larger at the resonant frequency. Both of the half-wavelength metal parts are configured as the displacement amplifier and are composed of four PZT rings.
A PZT ring was placed inside the transducer as a sensor, as shown in Figure 2, so that deformation of the PZT would lead to a voltage being detected. The voltage signals, having amplitudes in the ultrasonic range, and the displacement of vibration could thus be analyzed to distinguish soft and hard stiffness and thus distinguish materials of various degrees of stiffness. In this work, a PZT ring (Fuji-C213) was used as the actuator. The properties are listed in Table 1. The outer diameter, inner diameter, and thickness of the PZT ring are 10 mm, 5 mm and 2 mm, respectively.
Figure 1. Composition of the ultrasonic dental handpiece.
Sensors 15 13670 g001
Figure 2. Illustration of (a) sensor types and (b) sensor locations.
Sensors 15 13670 g002
Table 1. Material properties of Fuji C-213 piezoelectric (PZT) actuator.
PZT Charge ConstantPZT Voltage ConstantDielectric ConstantElectromechanical Coupling FactorMechanical Quality Factor
d33 (pC/N)g33 (×10−3 vm/N)ε330Kp (×10−2)QM
31023.41470582500
According to clinical findings, the ultrasonic dental handpiece is usually operated at 30 kHz, which is outside the range of human hearing, 20 to 20,000 Hz. The location and type of a sensor strongly influence the sensitivity and the displacement. These two factors will be discussed below.

2.2. Design of Sensor Types

As shown in Figure 2a, three different PZT materials, types T1, T2, T3, were studied. For type T4, the PZT ring was divided into an actuator and a sensor. The parameters of the sensor are listed in Table 2. The material of PZT-1 (Fuji C-213) was same as that of the PZT actuator. The PZT constant of PZT-2 (Fuji C-203) was higher than that of PZT-1, and the Young’s Modulus was similar in both. We also considered polyvinylidene fluoride (PVDF) as a material, owing to its extremely strong piezoelectricity and low density, which might make it useful for PZT sensor applications. In addition, a PZT ring was divided: 12.5% was used as a sensor, and the rest was used as an actuator. The ratio of 12.5% was chosen for two reasons. The first reason for using a split PZT as a sensor was the energy dissipation. We believed that the displacement would increase as the area ratio of the PZT sensor to the PZT actuator decreased. The second reason was that a diamond pen was used to manually cut the area we needed. The outside diameter of the PZT ring is 10 mm, and the inner diameter is 5 mm. The tip diameter of the diamond pen is approximately 1 mm. Therefore, it would be difficult to guarantee the cutting quality of a PZT ring if smaller ratios, such as 1:9 or 1:10, were used.
Table 2. Properties of PZT sensor materials.
TypeParameterYoung’s ModulusPZT Voltage ConstantDensityThicknessMechanical Quality FactorDesign
Y33 (GPa)g33 (×10−3 vm/N)ρ (×10−3 kg/m3)t (mm)QM
T1PZT-16623.47.801.02500Ring sensor
T2PVDF1–3150.01.770.111Ring sensor
T3PZT-26025.67.701.02000Ring sensor
T4PZT-16623.47.801.02500Split into sensor (12.5% area) and actuator (87.5% area)

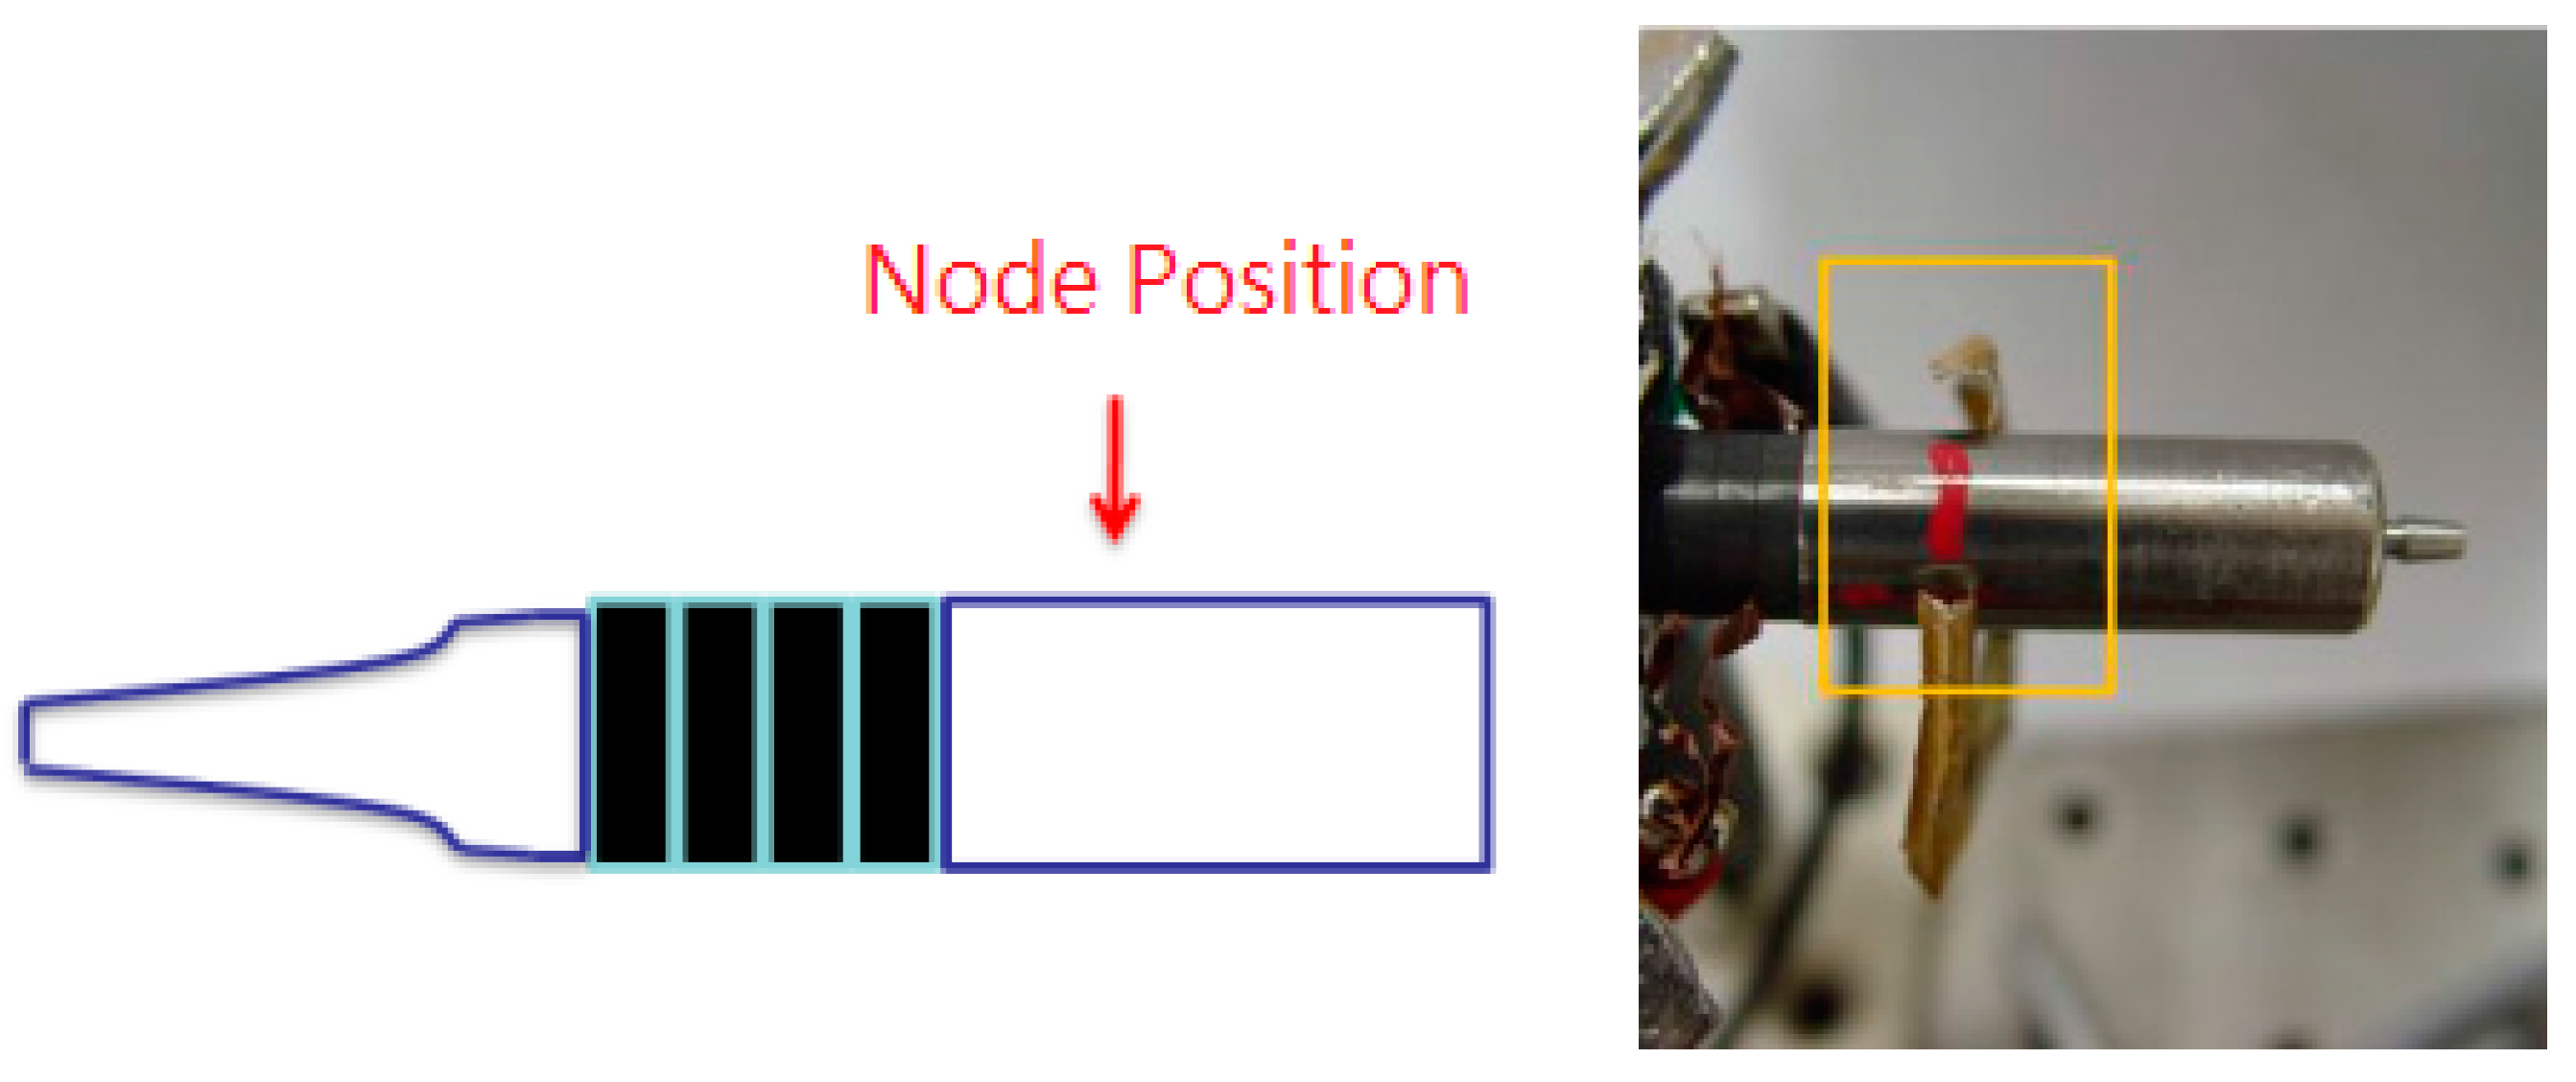
2.3. Design of Sensor Locations

Sensors at various locations generate different voltages due to the stress distribution in the transducer. The voltage of the sensor is in proportion to the force applied to the sensor. Hence, the location of a sensor will have a direct influence on its sensitivity. In this work, the sensors were placed at three different positions, i.e., A1, A2 and A3, to find the optimal location. In the study of sensor locations, we used only PZT-1 as the actuator. As shown in Figure 3, the node was located at the position marked in red. It was reasoned that the maximum sensor voltage would be obtained with the A2 set for the nearest node position. Therefore, the A1 set for the farthest node position was the opposite of A2. Finally, the A3 set was formed by considering independent adjustment of the preload of the sensor and the actuator. As shown in Figure 2b, in position A1, the sensor was inserted between the ring actuator and the horn. In Position A2, the sensor was between the ring actuator and rear segment. In position A3, the sensor was glued at the tail end of the rear segment by using the instant adhesive of Loctite 403.
Figure 3. The node position of the ultrasonic dental handpiece.
Sensors 15 13670 g003

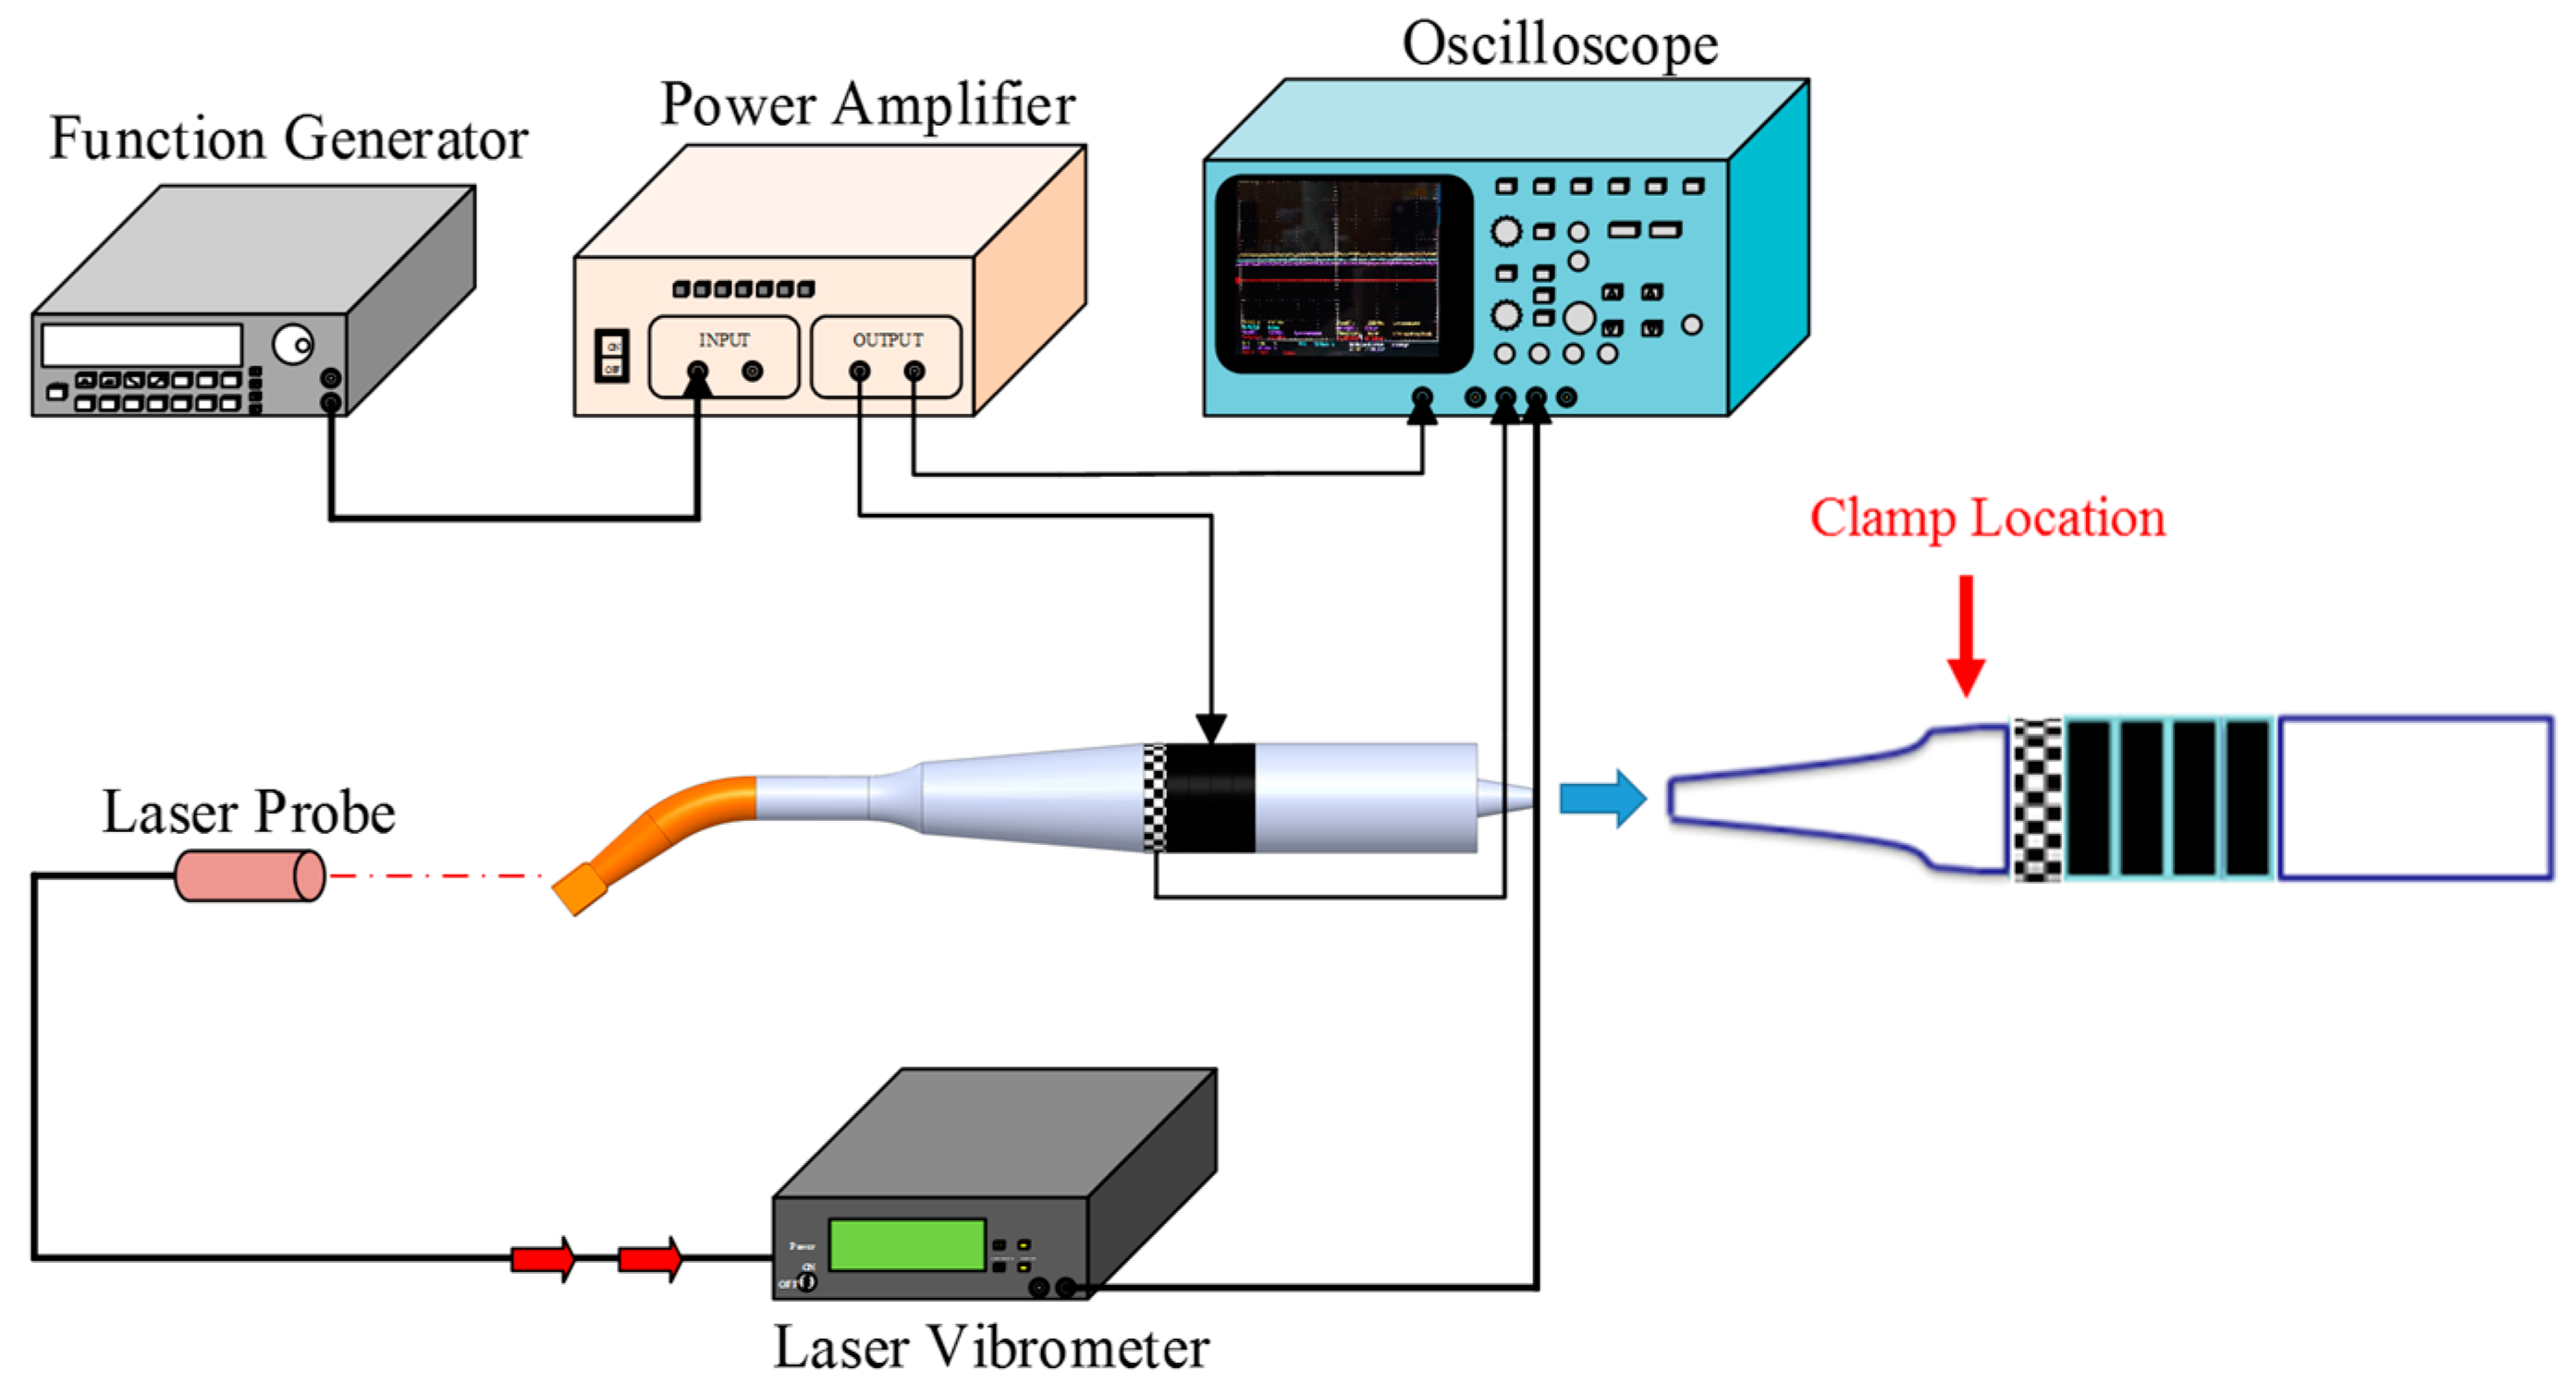
3. Experimental Measurement

This section is divided into two parts. First, the influences of the types and locations were investigated to determine the appropriate conditions for the sensor. Second, sensing capability was verified, and simply supported beams [13] with different degrees of stiffness were used as test samples.

3.1. Sensor Performance from Free Vibration

A free vibration test, using the set-up shown in Figure 4, was conducted to examine the efficacies of the different sensor designs. The ultrasonic transducer was clamped at a hexagonal location of the horn. The driving signal was provided by a power amplifier (NF 4005) connected to the function generator (Agilent 33120A). The longitudinal displacement of the actuator and the sensor voltage of the sensor were obtained with a laser vibrometer (Polytec OFV-3000) and an oscilloscope (Tektronix TDS 5054), respectively. The longitudinal displacement and sensor voltage were measured under a driving voltage of 5 V using a dynamic signal analyzer (HP 35665). The results are shown in Figure 5. A clear peak of the displacement and sensor voltage appeared at a resonant frequency of 40 kHz. The observed sensor voltage was consistent with the displacement. The results showed good correlation between the displacement and the sensor voltage and indicated that the sensor voltage was able to react to the displacement accurately.
Figure 4. Experimental set-up for measuring the longitudinal displacement of the actuator and the sensor voltage.
Sensors 15 13670 g004
Figure 5. Frequency response under a driving voltage 5 V.
Sensors 15 13670 g005

3.2. Sensor Performance in Contact with Test Sample

Human bone tissue is composed of several layers of different materials. According to Reference [14], the bone in the upper jaw contains a high proportion of cancellous bone. The properties of polymethyl methacrylate (PMMA) are very similar to those of cancellous bone, as shown in Table 3. This work used silicon layers of thicknesses ranging from 1 mm to 5 mm to simulate the sinus membrane and PMMA to simulate human bone.
Table 3. Properties of cancellous bone and polymethyl methacrylate (PMMA).
MaterialYoung’s Modulus (MPa)Poission’s RatioDensity (×10−3 kg/m3)
Cancellous Bone3450.311.0
PMMA3030.321.15–1.19
Figure 6. Experimental set-up for investigate sensor performance during contact with test sample.
Sensors 15 13670 g006
In the experiment, simply-supported beams with different equivalent stiffness were used as test samples. The experimental apparatus of the stiffness measurement is illustrated in Figure 6. Since the tip motion at the horn was in contact with the test samples, the longitudinal displacement could be measured from the movement of the rear of the tool. The ultrasonic transducer was fixed on a slider of a linear guide and contacted the center of the test sample. During dental surgery, the conventional contact force is below 10 N. A low contact force of 3 N between the transducer and test sample was controlled by the weight of the slider and the transducer.

4. Results and Discussion

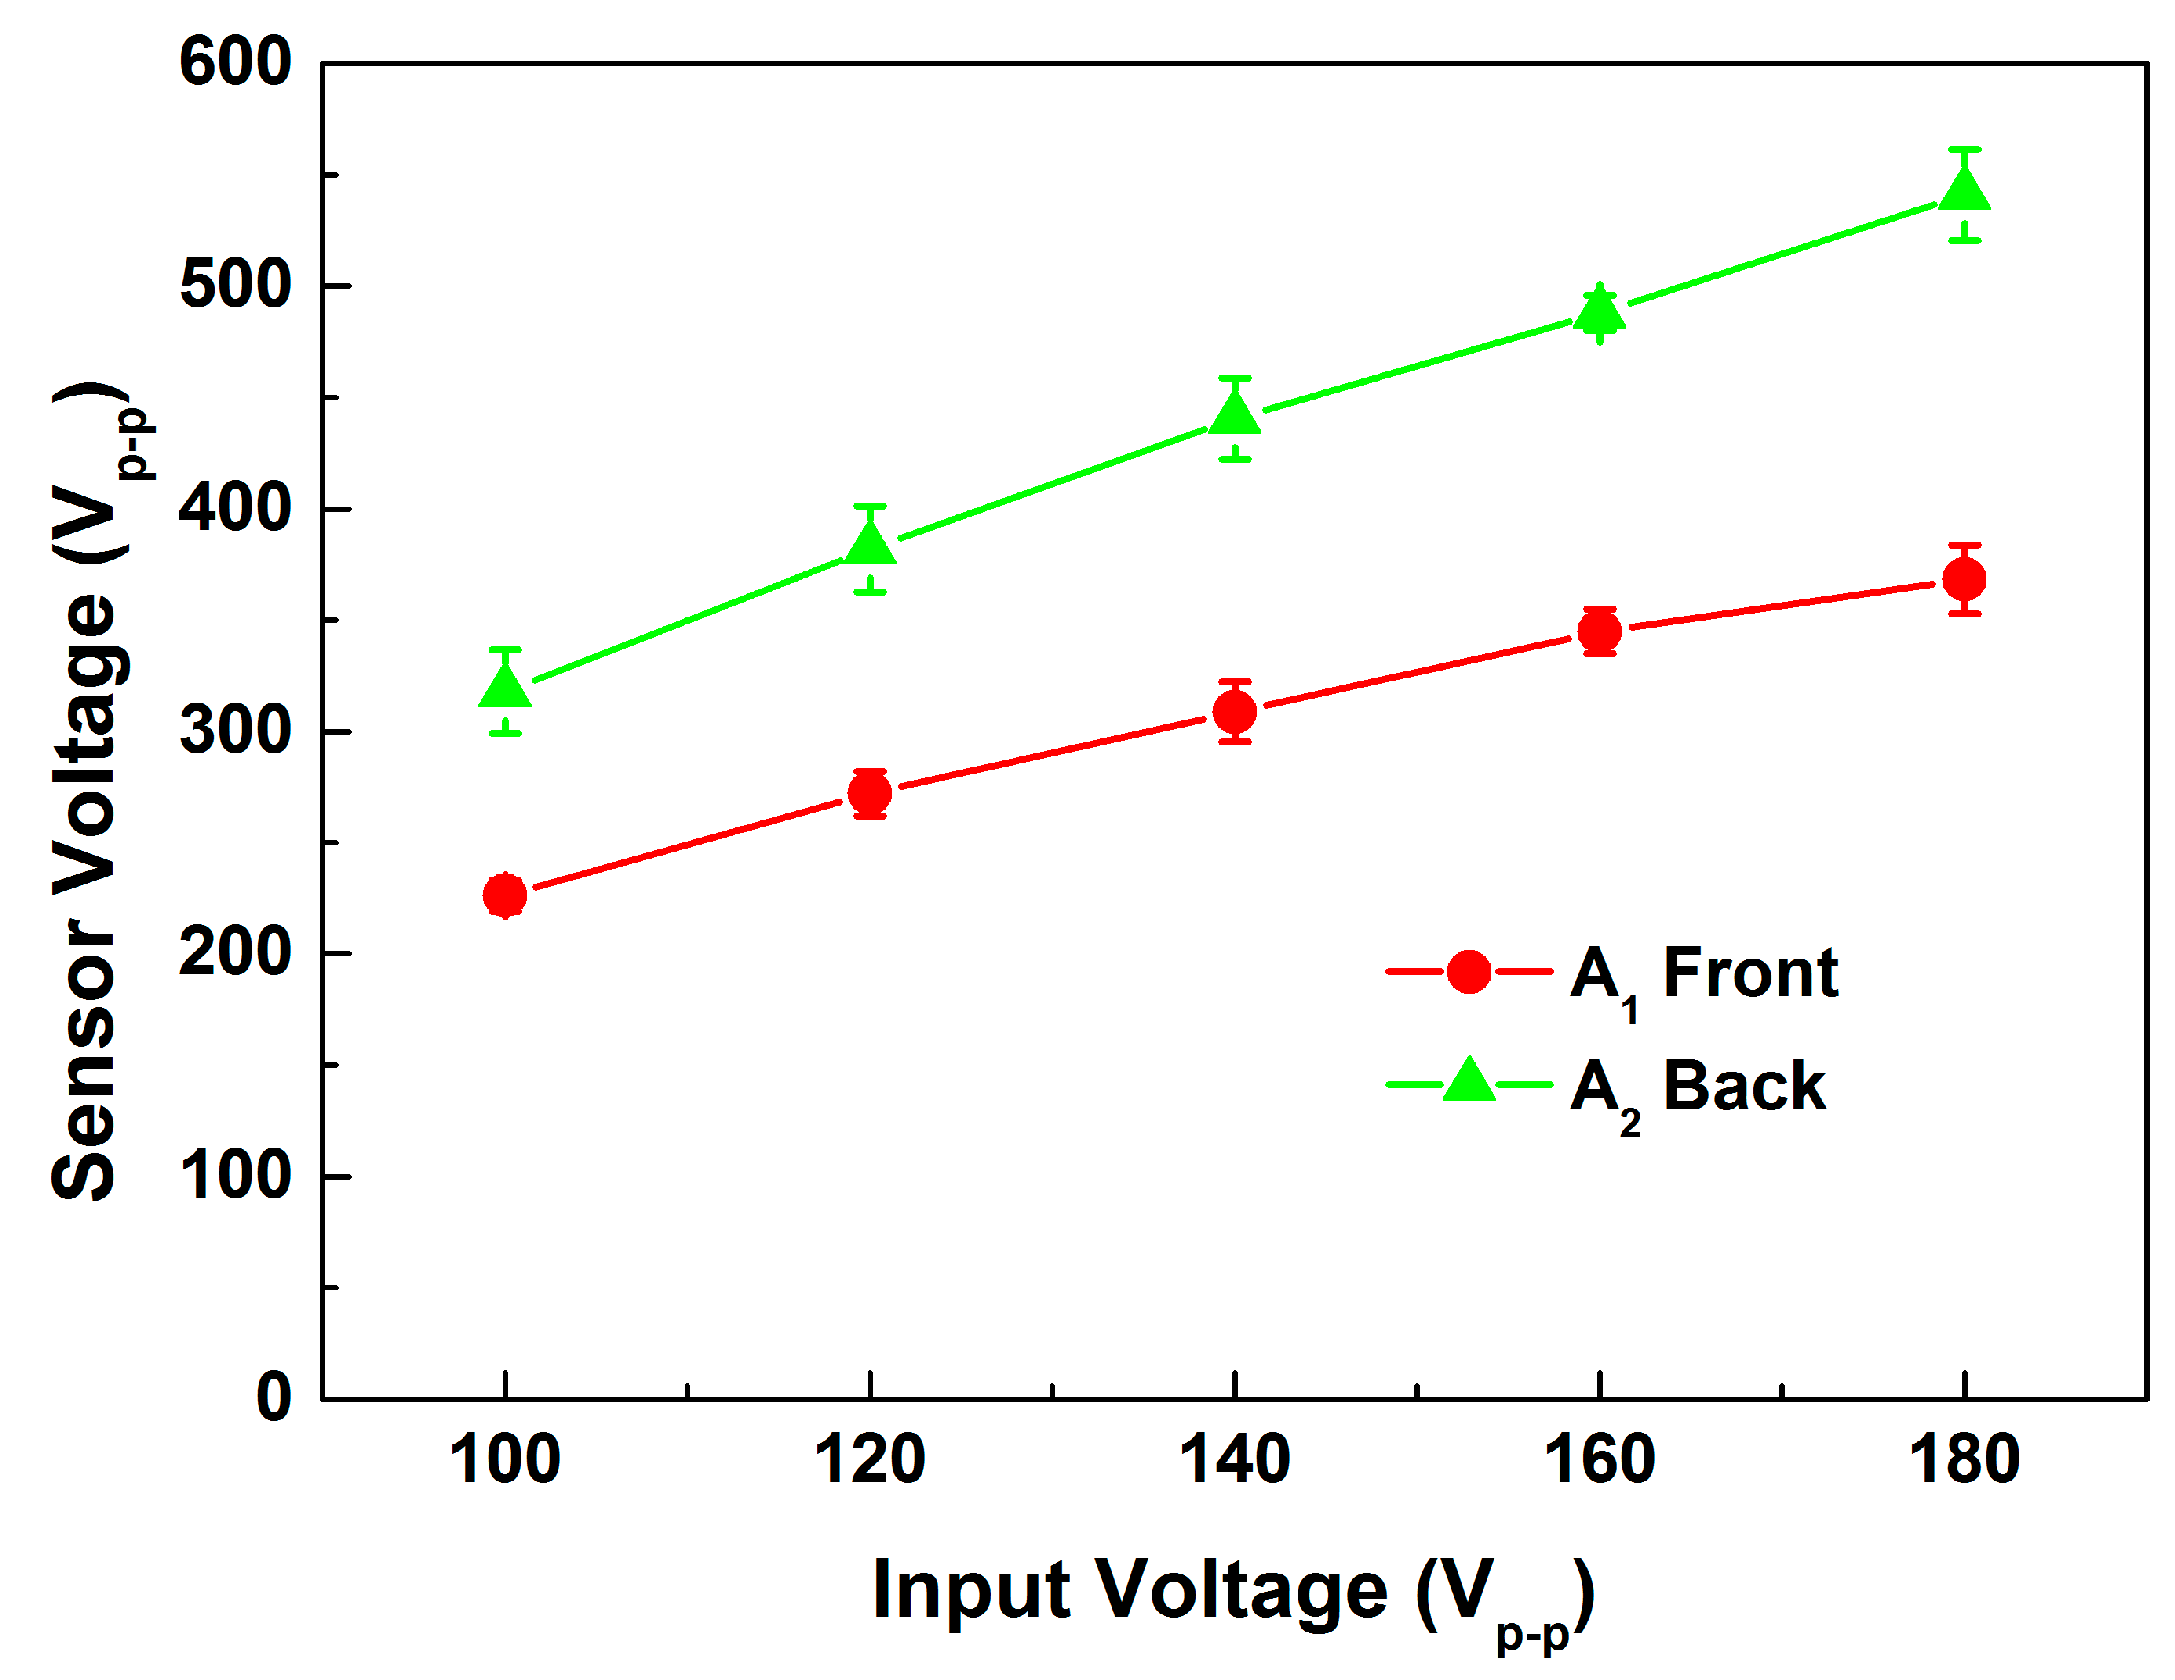
4.1. Sensor Performance in Free Vibration

Figure 7 shows the longitudinal displacement results for different sensor locations. In all locations, the longitudinal displacement was lower than the result for the uninstalled sensor. It can be inferred that energy was consumed when the sensors were inserted into the transducer, and some energy was converted into the sensor signal, a reasonable expectation. The results also show that the signal of the sensor location A3 was distorted at high input voltage; it was found that the glue become unstable under high temperature approximately 130 °C which exceeding the recommend temperature of operation. Moreover, set A1 produced the maximum longitudinal displacement and a lower sensor voltage than did set A2. According to Figure 8, the sensor voltage of A2 was much higher than that of A1. It can be inferred that the sensor voltage was higher because the sensor of set A2 was located close to the node of the transducer. In this work, a large displacement and sufficient voltage were needed for the device to work. Thus, the A1 type was used for the experimental sets T.
Figure 7. Longitudinal displacements with different sensor locations.
Sensors 15 13670 g007
As shown in Figure 9, experiments were performed to examine the influence of the type of sensor. The poor longitudinal displacement of sensor type T2 was quite noticeable and indicated that the soft PVDF material obviously lowered the transducer displacement, even though the PVDF was very thin. In addition, the displacement of T1 was higher than that of T3. About the comparison of properties of T1 and T3, the value of each item was similar, except the Mechanical Quality Factor (QM). The value represents the magnitude of energy dissipation. This also indicated that a low QM corresponds to a high mechanical loss.
Figure 8. Sensor voltages of sensor locations A1 and A2.
Sensors 15 13670 g008
Figure 9. Longitudinal displacements of various sensor types.
Sensors 15 13670 g009

4.2. Sensor Performance in Contact Test Sample

Figure 10 shows the sensor voltages for the different degrees of equivalent stiffness for sensor types T1 and T4. Both designs were able to estimate the stiffness of the sample under a low contact load of 3 N. The sensor design of T1 showed high stiffness sensitivity of 2.47 Vm/kN, and T4 had a stiffness sensitivity of 1.55 Vm/kN in the stiffness range of 0 to 25 kN/m. Noticed that there is a sudden jump at 2 kN/m for type T4. The phenomenon was believed in the cause of the assembly-gap. For T4 type, a 12.5% PZT ring was divided as a sensor by a manual cutting method with the diamond pen. The method might result in the measurement error during the measurement of the low equivalent stiffness due to the slight irregularities of the sensor edge.
Figure 10. Sensor voltages at various equivalent stiffness.
Sensors 15 13670 g010

5. Conclusions

This investigation presents a new PZT sensor for integration into an ultrasonic dental tool. The sensor can distinguish hard and soft materials, even under a low contact load of 3 N. The stiffness of different test samples was detected by analyzing the voltage from the sensor. The experimental data showed that the location and the type of the sensor affected the sensitivity of the sensor and the displacement of the transducer. Measurements indicated that both type T1 and T4 were capable of distinguishing materials of different stiffness. The difference in the design of type T4 should be noted. This design allows a sensor voltage to be obtained without the use of an independent PZT ring as a sensor. The signal produced by this design is also sufficient for analysis, with good sensitivity of 1.55 Vm/kN. This study also determined the optimal sensor location to be A1, where the PZT sensor can be placed for maximum displacement of the transducer.

Acknowledgments

This research was supported by the Southern Taiwan Science Park Administration (STSPA), Taiwan, under contract AZ-09-10-25-98.

Author Contributions

Yan-Rui Li wrote and edited the manuscript. Wen-Jin Lin performed the experiments for measurement and data acquisition. Chih-Chung Su and Shuo-Hung Chang improved the quality of this research. All authors reviewed the manuscript before submission and approved its publication.

Conflicts of Interest

The authors declare no conflict of interest.

References

  1. González-García, A.; Diniz-Freitas, M.; Somoza-Martín, M. Ultrasonic osteotomy in oral surgery and implantology. Oral Surg. Oral Med. Oral Pathol. Oral Radiol. Endodontol. 2009, 108, 360–367. [Google Scholar] [CrossRef] [PubMed]
  2. Mathieu, V.; Vayron, R.; Barthel, E.; Dalmas, D.; Soffer, E; Anagnostou, F.; Haïat, G. Mode III cleavage of a coin-shaped titanium implant in bone: Effect of friction and crack propagation. J. Mech. Behav. Biomed. Mater. 2012, 8, 194–203. [Google Scholar] [CrossRef] [PubMed]
  3. Vayron, R.; Soffer, E.; Anagnostou, F.; Haïat, G. Ultrasonic evaluation of dental implant osseointegration. J. Biomech. 2014, 47, 3562–3568. [Google Scholar] [CrossRef] [PubMed]
  4. Geminiani, A.; Papadimitriou, D.E.; Ercoli, C. Maxillary sinus augmentation with a sonic handpiece for the osteotomy of the lateral window: A clinical report. J. Prosthet. Dent. 2011, 106, 279–283. [Google Scholar] [CrossRef]
  5. Thomas, J. Piezoelectric ultrasonic bone surgery benefits for the interdisciplinary team and patients. Funct. Esthet. Restor. 2008, 2, 20–24. [Google Scholar]
  6. Toda, S.; Fujita, T.; Arakawa, H.; Toda, K. An ultrasonic nondestructive technique for evaluation layer thickness in human teeth. Sens. Actuators A Phys. 2005, 125, 1–9. [Google Scholar] [CrossRef]
  7. Harput, S.; Evans, T.; Bubb, N.; Freear, S. Diagnostic ultrasound tooth imaging using fractional Fourier Transform. IEEE Trans. Ultrason. Ferroelectr. Freq. Control 2011, 58, 2096–2106. [Google Scholar] [CrossRef] [PubMed]
  8. Kim, D.S.; Lee, W.J.; Choi, S.C.; Lee, S.S.; Heo, M.S.; Huh, K.H.; Kim, T.I.; Lee, I.B.; Han, J.H.; Yi, W.J.; et al. A new method for the evaluation of dental implant stability using an inductive sensor. Mech. Eng. Phys. 2012, 34, 1247–1252. [Google Scholar] [CrossRef] [PubMed]
  9. Chu, P.W.P.; Li, H.L.; Chan, H.L.W.; Ng, K.M.W.; Liu, P.C.K. Smart ultrasonic transducer for wire-bonding applications. Mater. Chem. Phys. 2002, 75, 95–100. [Google Scholar] [CrossRef]
  10. Or, S.W.; Chan, H.L.W.; Lo, V.C.; Yuen, C.W. Ultrasonic wire-bond quality monitoring using piezoelectric sensor. Sens. Actuators A Phys. 1998, 65, 69–75. [Google Scholar] [CrossRef]
  11. Feng, W.; Meng, Q.; Xie, Y.; Fan, H. Wire bonding quality monitoring via refining process of electrical signal from ultrasonic generator. Mech. Syst. Signal Process. 2011, 25, 884–900. [Google Scholar] [CrossRef]
  12. Maruyama, Y.; Takasaki, M.; Kutami, T.; Mizuno, T. Application of ultrasonic dental scaler for diagnosis. In Proceedings of the 2007 IEEE/ASME International Conference on Advanced Intelligent Mechatronics, Zurich, Switzerland, 4–7 September 2007; pp. 1–6.
  13. Beheshti-Aval, S.B.; Lezgy-Nazargah, M.; Vidal, P.; Polit, O. A refined sinus finite element model for the analysis of piezoelectric-laminated beams. J. Intell. Mater. Syst. Struct. 2011, 22, 203–219. [Google Scholar] [CrossRef]
  14. Helgason, B.; Perilli, E.; Schileo, E.; Taddei, F.; Brynjo’lfsson, S.; Viceconti, M. Mathematical relationships between bone density and mechanical properties: A literature review. Clin. Biomech. 2008, 23, 135–146. [Google Scholar] [CrossRef] [PubMed]

