Article

Multiple Human Tracking Using Binary Infrared Sensors

The University of Aizu, Aizuwakamatsu, Fukushima 965-8580, Japan
*
Author to whom correspondence should be addressed.
Sensors 2015, 15(6), 13459-13476; https://doi.org/10.3390/s150613459
Submission received: 31 March 2015 / Accepted: 1 June 2015 / Published: 8 June 2015
(This article belongs to the Special Issue State-of-the-Art Sensors Technology in Japan 2015)

Abstract

:
To create a context-aware environment, human locations and movement paths must be considered. In this paper, we propose an algorithm that tracks human movement paths using only binary sensed data obtained by infrared (IR) sensors attached to the ceiling of a room. Our algorithm can estimate multiple human movement paths without a priori knowledge of the number of humans in the room. By repeating predictions and estimations of human positions and links from the previous human positions to the estimated ones at each time period, human movement paths can be estimated. Simulation-based evaluation results show that our algorithm can dynamically trace human movement paths.

1. Introduction

Human tracking technologies have attracted considerable attention over the years. For example, with real-time human tracking technology, air conditioners and lights can be controlled smartly by considering the requirements of each human. In addition, elderly people or children can be monitored for safety reasons [1,2]. Consequently, many human tracking systems and algorithms have been proposed [3,4,5,6,7,8,9,10,11,12,13,14,15,16,17,18,19,20]. One popular method involves camera-based systems [3,4,5,6,7,8,9,10]. However, they are often not acceptable for monitoring elderly people or other similar applications whose objective is to observe humans without invading their privacy. This is because people may be uncomfortable with monitoring using video cameras, even if the original image data are modified and not used directly to perform human tracking. In addition, the size of video data is large compared to other sensor data; therefore, camera-based systems are not suitable for long-term observations. In other popular methods, IC tags or radio frequency identification devices (RFIDs) [11,12] are used. A person wears a RFID, which is then detected by nearby RFID receivers located on the floor or ceiling of the monitored area. Thus, using data stored in the RFID receivers, the person can be tracked. Although the RFID-based systems can be considered to enhance privacy, they force people to carry the RFID devices.
For these reasons, some human tracking methods use infrared (IR) sensors [13,14,15,16,17,18,19,20]. The IR sensor produces a “1” if it detects a human, and a “0” otherwise [21]. Thus, using the IR sensors, the movement paths of subjects can be estimated without sacrificing their privacy. In addition, IR sensors are low-cost and their installation is relatively simple. However, IR sensors have a deficiency—they react regardless of whether they detect one or multiple persons. Therefore, almost all human tracking methods using IR sensors assume that the number of humans in the room is known beforehand. However, from the perspective of practical application development, the number of humans in a room is often unknown.
We previously proposed an algorithm that can simultaneously estimate both the number of humans and their movement paths [22,23], however, the method still had some drawbacks. Thus, the algorithm is invoked after all sensed data are collected, making it difficult to estimate the human movement in real time. In addition, the estimated human position must be the position of a fired IR sensor or the midpoint of the overlapped detection areas of multiple fired IR sensors; thus, the method lacks flexibility. To address these issues we now propose a novel method that can overcome the aforementioned problems [24]. The method dynamically estimates human positions using the weighted centers of grouped fired IR sensors, instead of simply using the position of a fired IR sensor or the midpoint of the overlapped detection areas of multiple fired IR sensors in the previous methods. Thus, by using the new method, we can estimate multiple human movement paths in a timely manner, and the estimated human positions are not restricted by the locations of the IR sensors, thus improving the human tracking accuracy.
The remainder of this paper is organized as follows: in Section 2, a model of the assumed IR sensor system is described. Next, the details of the proposed algorithm are explained in Section 3. Then, evaluation results are shown in Section 4. Finally, our conclusions and future studies are described in Section 5.

2. Model of IR Sensor System

In this paper, we consider a system constructed using IR sensors and a PC. The IR sensors are randomly installed on the ceiling of a room, but their locations are known. In addition, each IR sensor has a non-directional and circular detection range, the radius of which is r. Here, r is typically several meters, if we use commercially available IR sensors [21]. We assume r = 2.0 m in this paper. The sensor outputs binary data, i.e., it produces a “1” if it detects one or more humans and a “0” otherwise. Moreover, all the IR sensors are connected to the PC using a wired or wireless communication network. Thus, data obtained from the IR sensors are collected in the PC. The data sampling rate is 6 Hz, and the sensed data are saved on the PC with a time stamp. In addition, the positional coordinates of each sensor is known. Furthermore, the detection ranges of the IR sensors should cover the entire area to detect human movements. Note that some IR sensor arrays have been proposed recently [25], and they can detect human movements, but their detection range is typically several meters. Thus, even if using the IR sensor array, it is difficult to cover a large area. Furthermore, the method proposed in this paper can naturally handle the IR sensor array by treating it as a set of densely deployed IR sensors, if the sensor array produces a set of {0, 1}-data depending on human detection.

3. Proposed Algorithm

We can trace a human movement path by connecting the positions of the fired sensors step by step, if the position coordinates of each sensor is known. However, this method presents the problem that if some of the IR sensors are close together, they often detect the same event and output “1” data at the same time, which could make it difficult to track the human movements using the simple method mentioned above. This is especially true when there is more than one person in the room. To solve this problem, we propose a heuristic algorithm that can estimate multiple human movement paths using only the binary sensed data.

3.1. Notations

First, to explain the procedures of our algorithm, we define the variables and parameters as follows:
|*|: The number of elements in list *.
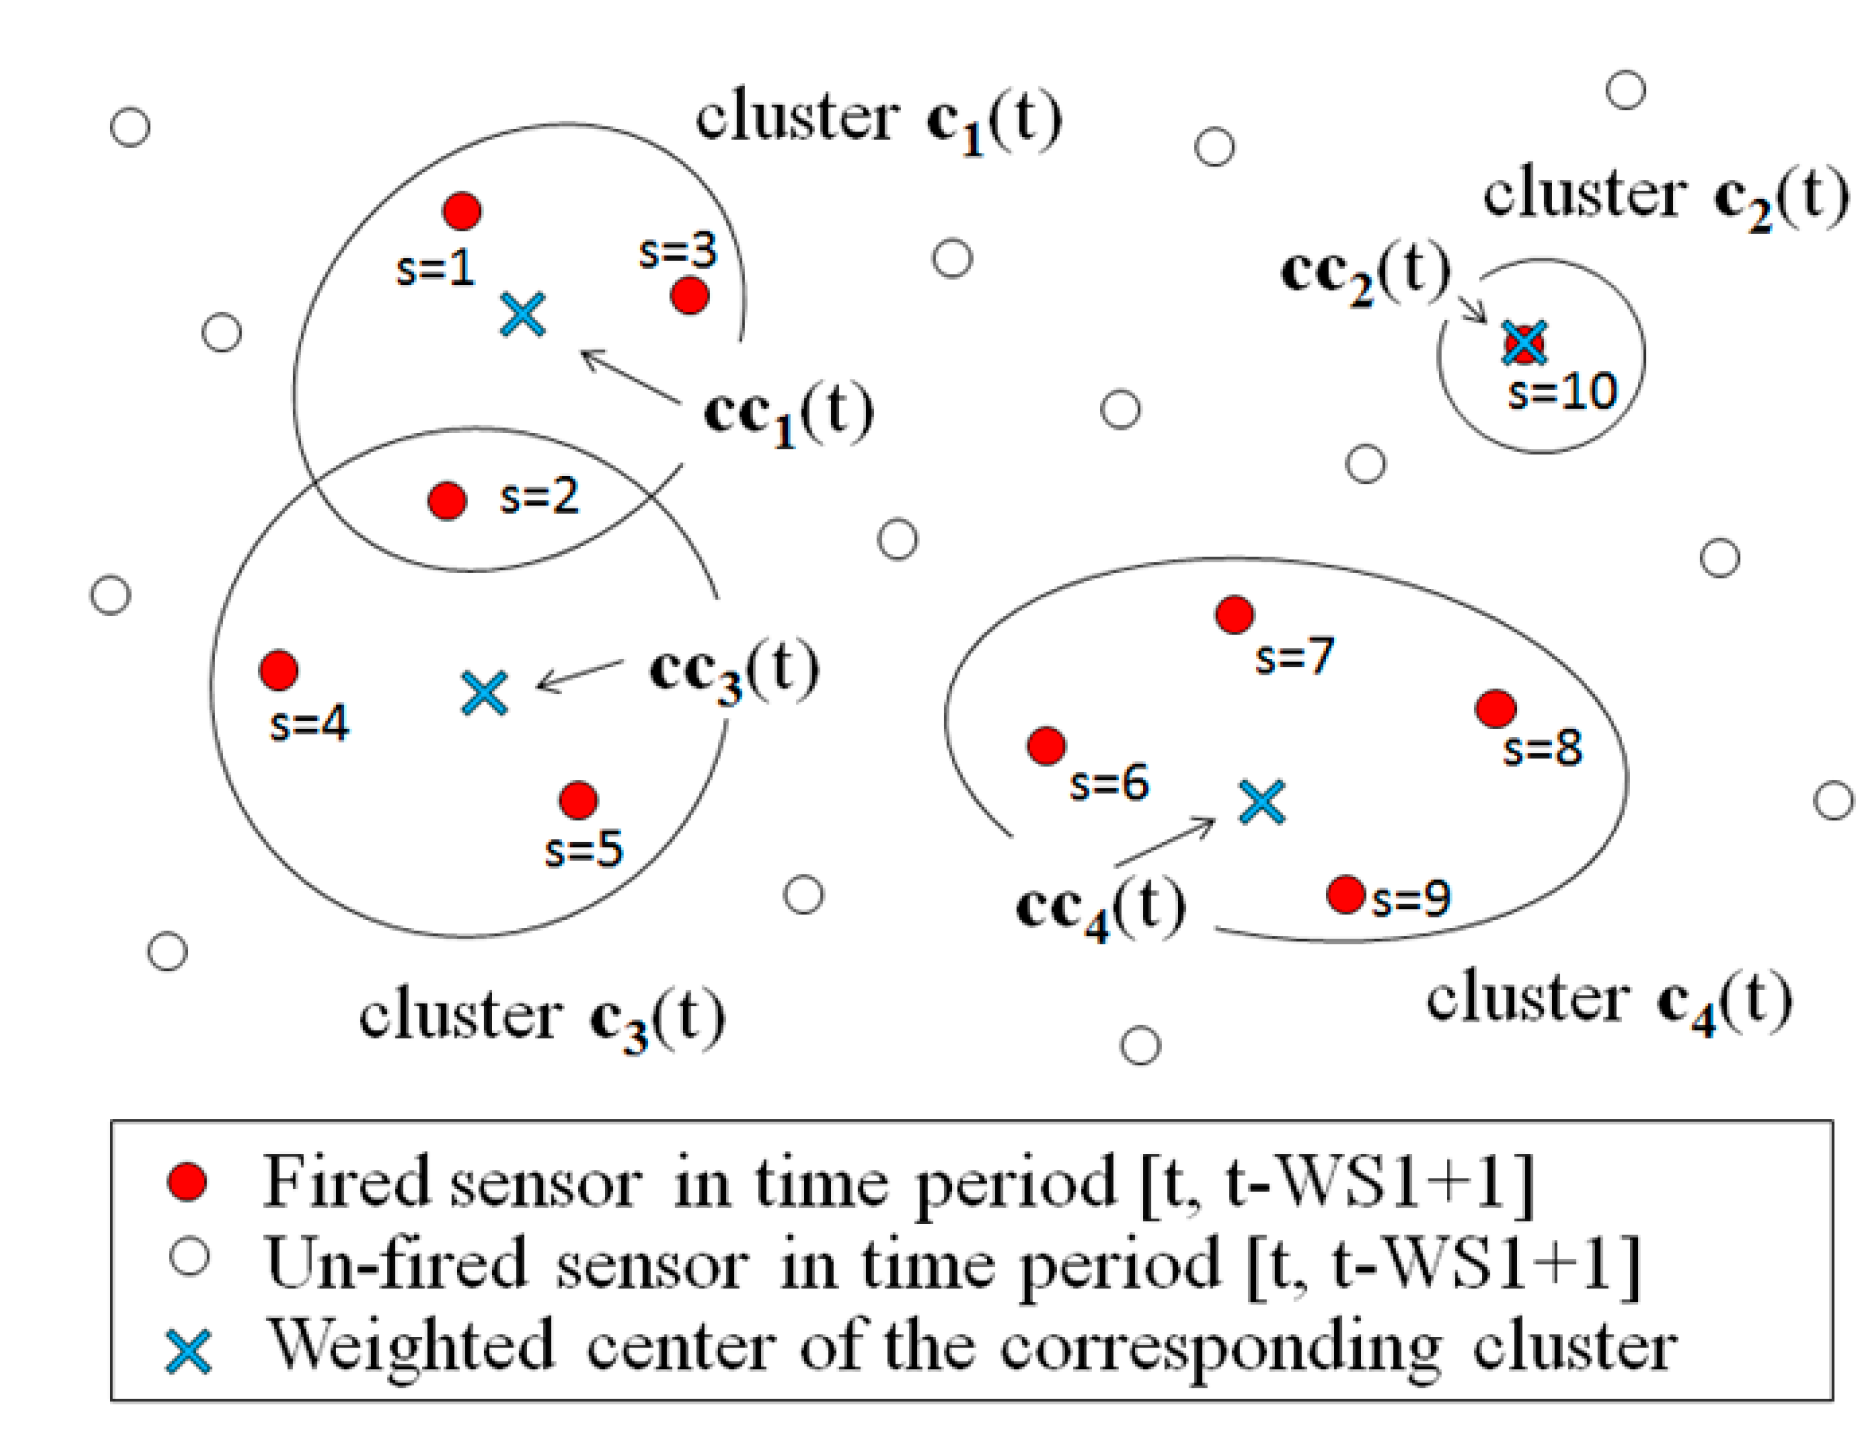
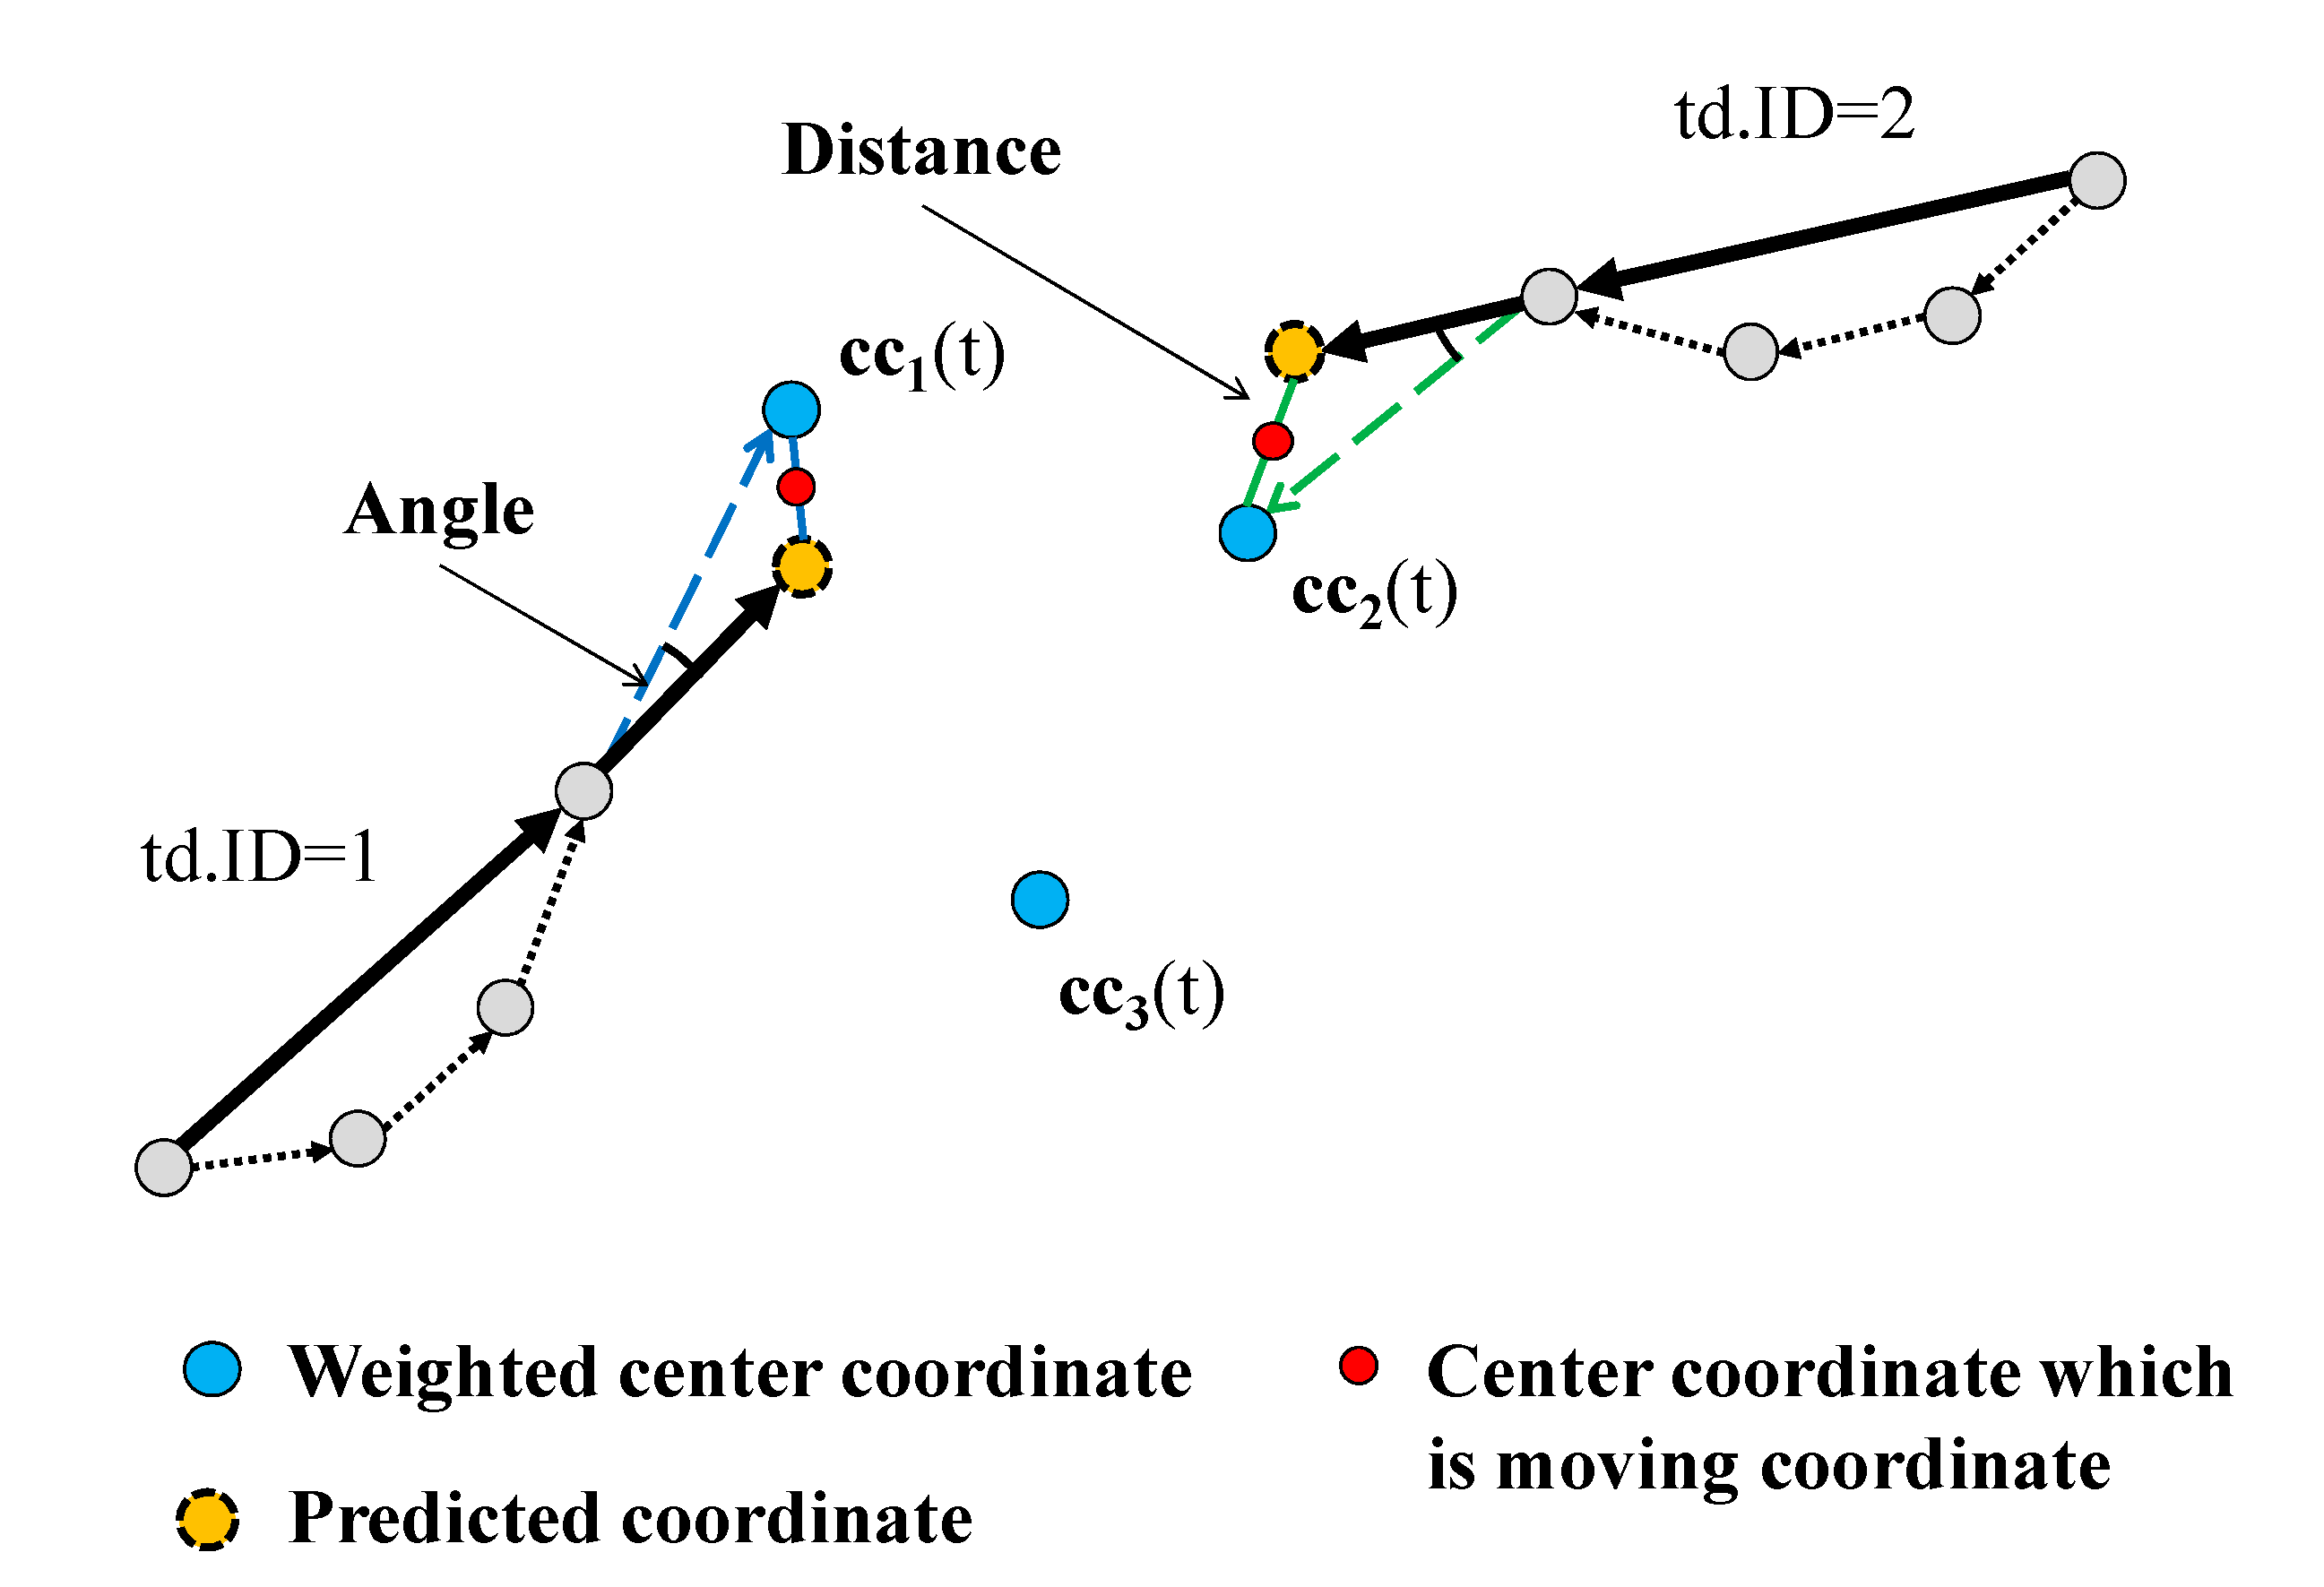
CC(t): A set of the weighted center coordinates of the clusters at time t. CC(t) = {cci(t)|i = 1, …, Cmax(t)}, where cci(t) = (x, y) and they are referred to as cci(t).x and cci(t).y, respectively.
Cmax(t): The number of clusters at time t.
ds(t): A binary sensed datum obtained by IR sensor s at time t. ds(t) ϵ {0, 1}.
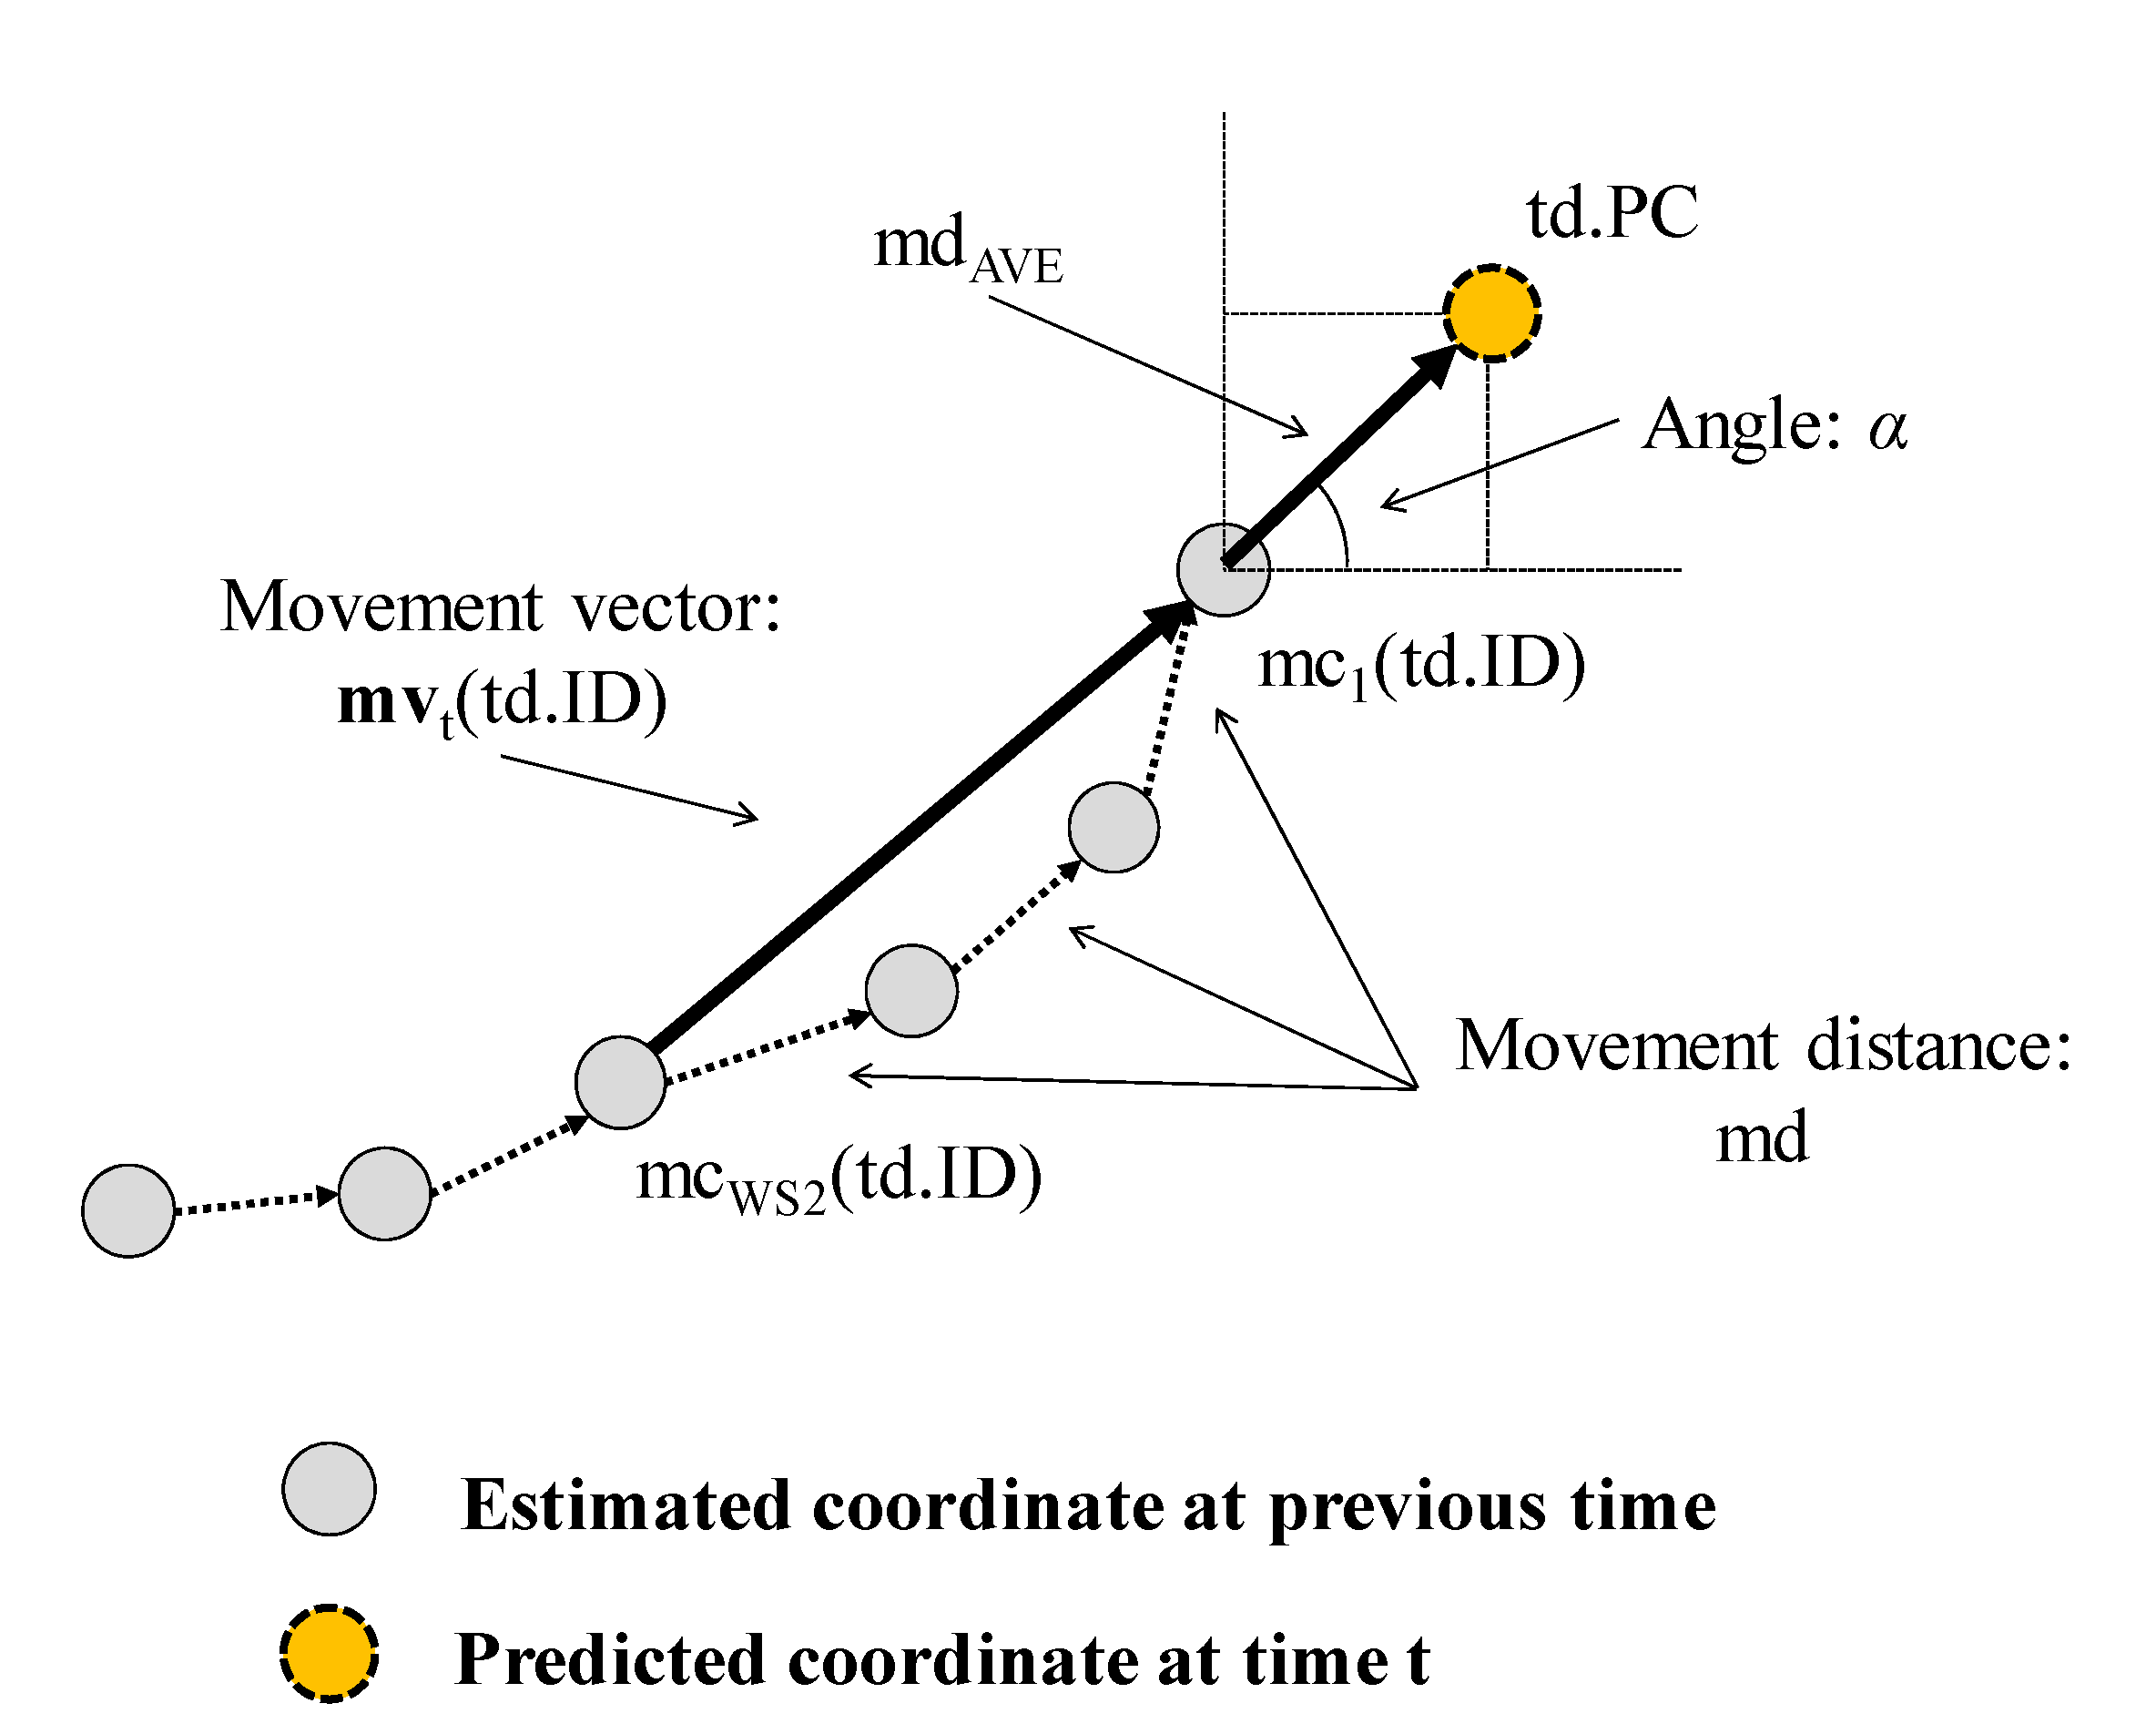
mdAVE(td.ID): An average of movement distance of target human “td.ID.” The details are described later.
mvt(td.ID): A coordinate set of the most recently estimated WS2 number of coordinates in Path of “td.ID” at time t. mvt(td.ID) = {mci(td.ID)|i = 1, 2, … WS2}, where mci(td.ID) = (x, y). They are referred to as mci(td.ID).x and mci(td.ID).y, respectively. mc1(td.ID) is more recent than mc2(td.ID).
MV(td.ID): A vector from coordinate mcWS2(td.ID) to coordinate mc1(td.ID), i.e., mcWS2(td.ID) → mc1(td.ID). This vector is referred to as the movement vector of target human “td.ID” at time t.
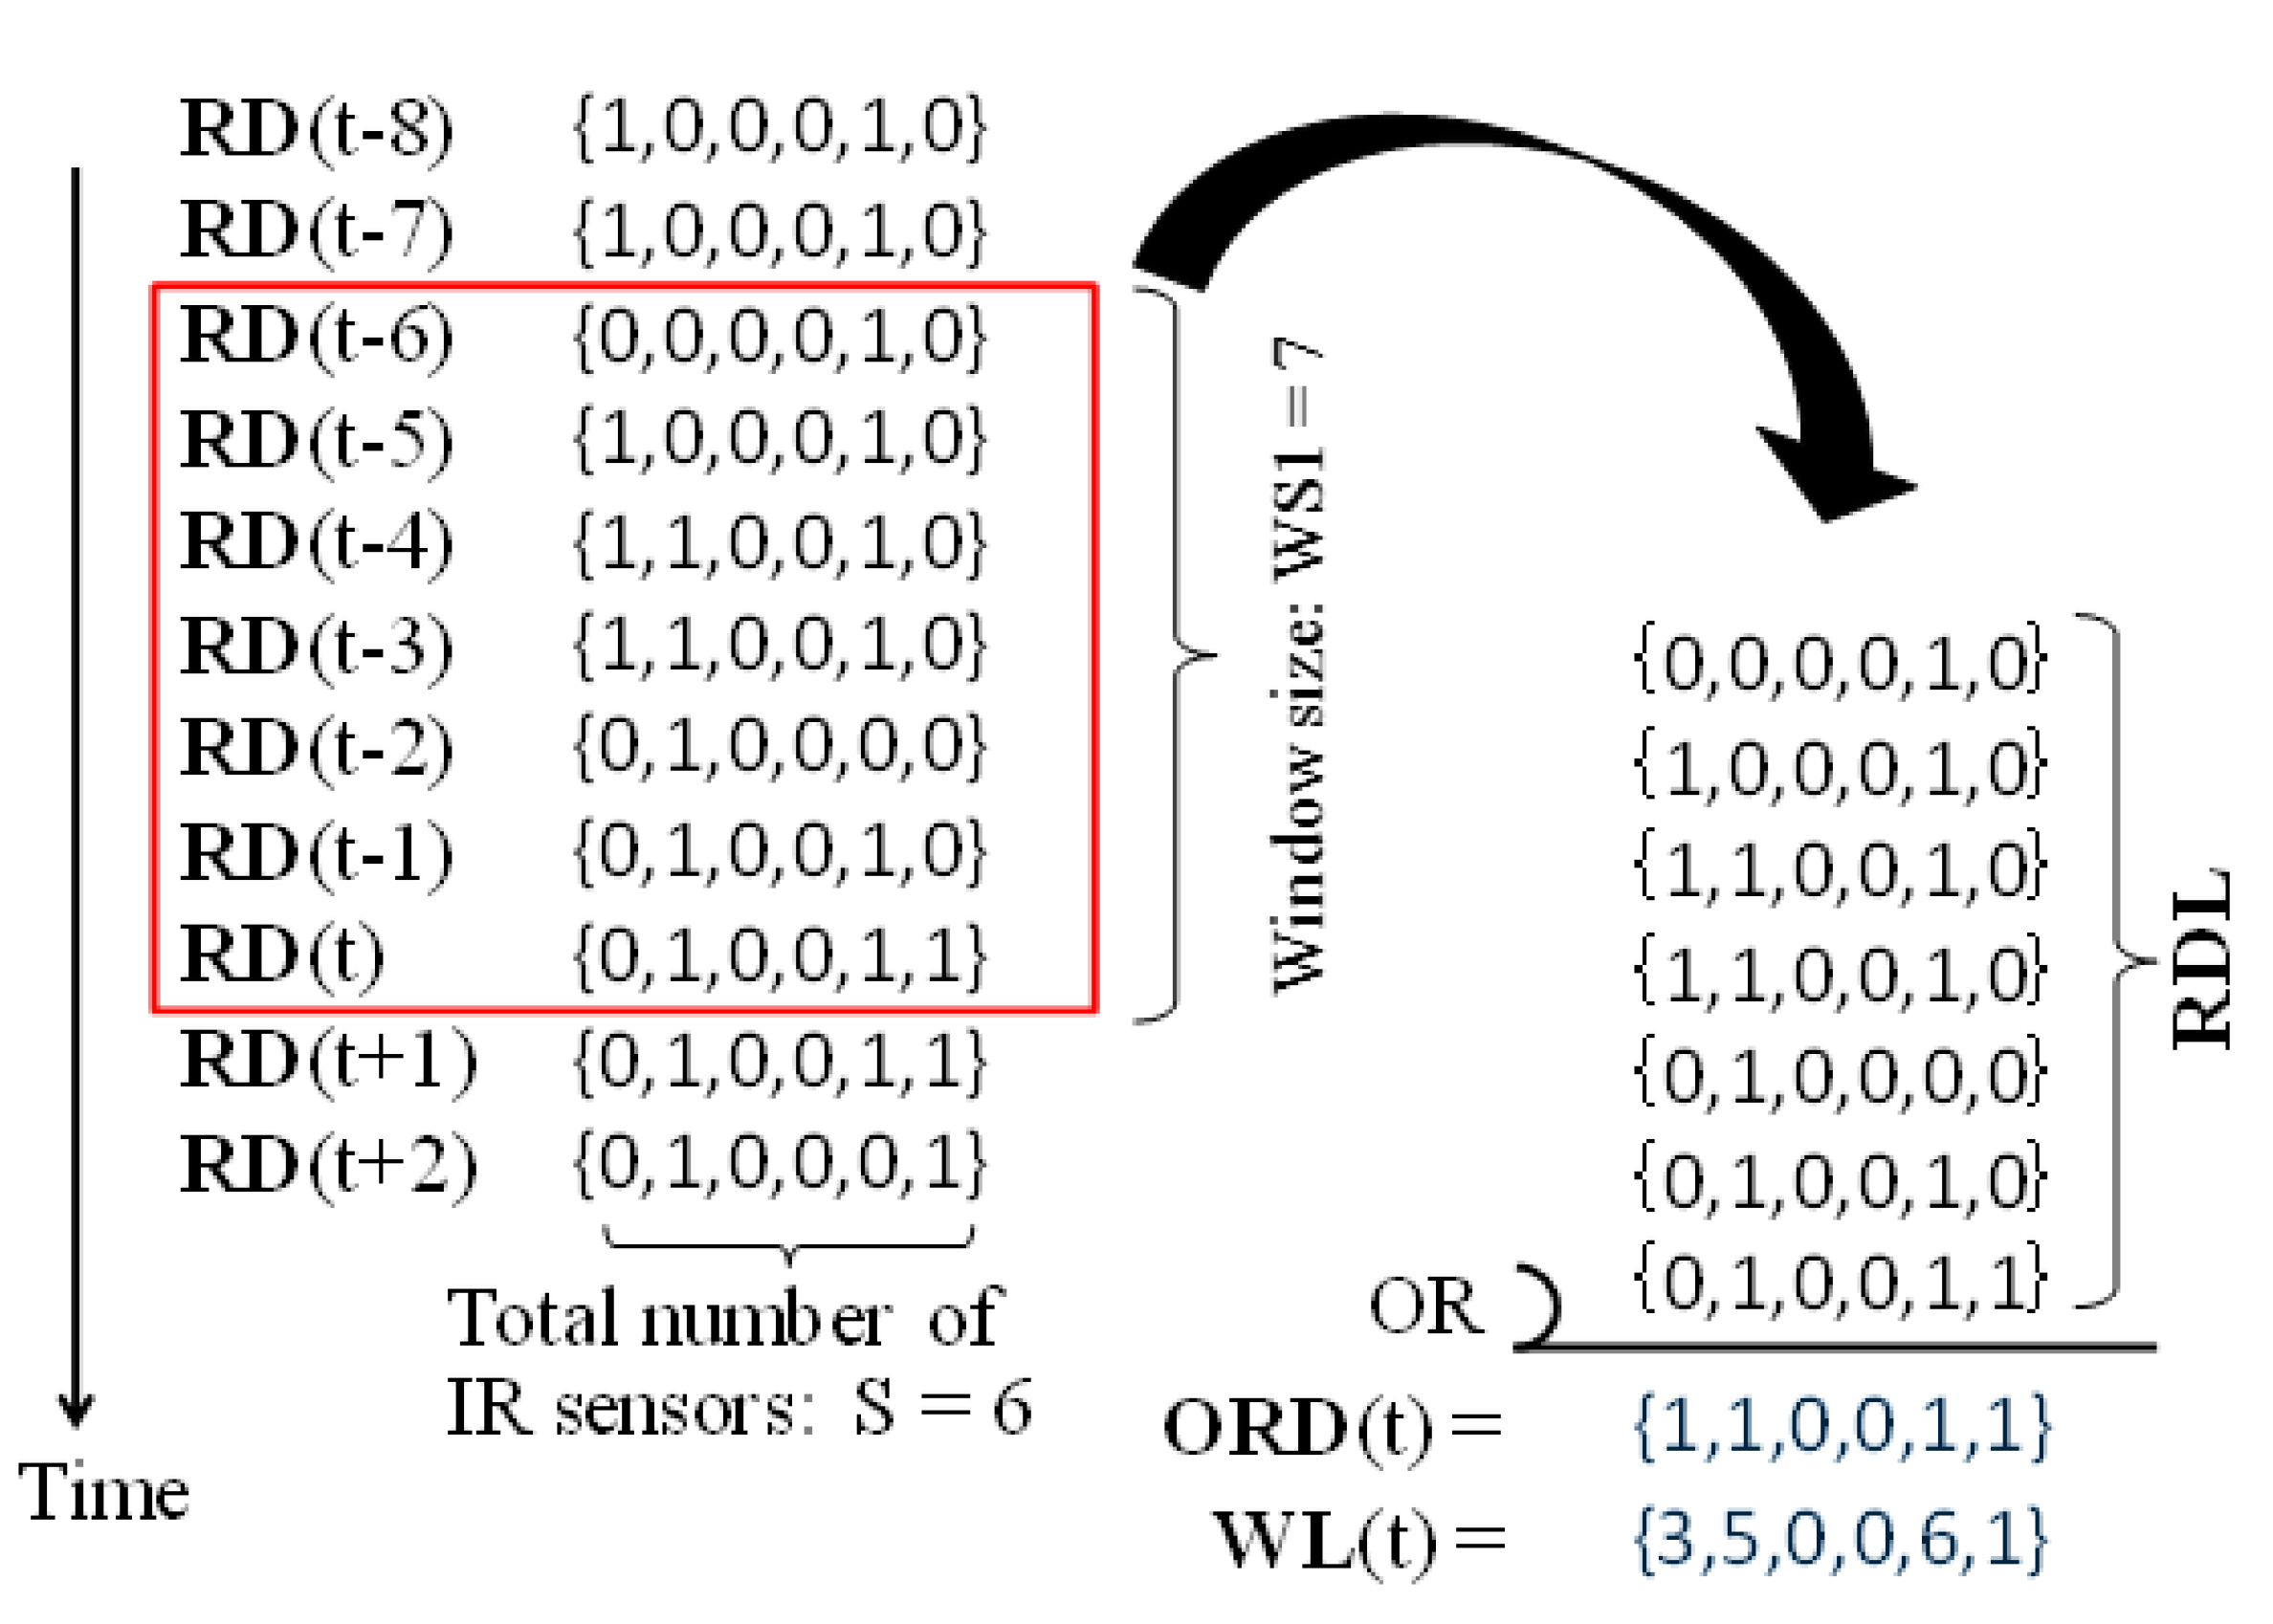
ORD(t): A binary dataset obtained by applying the logical-OR operation to RDL at time t. ORD(t) = {os(t)|s = 1, …, S}, where os(t) = U i = t t WS 1 + 1 d s ( i ) , s = 1 , ... , S .
r: The radius of the detection range of each IR sensor.
RD(t): A set of sensed raw data at time t. RD(t) = {ds(t)|s = 1, …, S}. |RD(t)| = S.
RDL: A list containing sets of the sensed raw data. At time t, RDL = {RD(t-WS1 + 1), RD(t-WS1 + 2), …, RD(t-1), RD(t)}. |RDL| = WS1.
S: The total number of IR sensors. S > 0.
td: A data structure representing a target human. It contains ID, TTL, PC, and Path. They are referred to as td.ID, td.TTL, td.PC, and td.Path, respectively.
td.ID: A human ID. This is an integer value. Td.ID > 0.
td.PC: A predicted coordinate of target human “td.ID” at time t, where td.PC = (x, y). They are referred to as td.PC.x and td.PC.y, respectively.
td.Path: A list of the estimated route coordinates of target human “td.ID.” By connecting all elements in this list from the first to the last, the estimated movement path of human “td.ID” is obtained.
td.TTL: A lifetime of target human “td.ID”. This is an integer value. The initial value of td.TTL is “1,” and its maximum value is TTLMAX.
TDL: A list of target humans who currently exist in the room.
TTLMAX: A constant integer value. The maximum value of TTL (time to live). TTLMAX > 0.
WL(t): A weight set of the sensors at time t. WL(t) ={ws(t)|s = 1, …, S}.
ws(t): A weight of sensor s at time t. ws(t) = i = t t WS 1 + 1 d s ( i ) | s = 1 , ... , S . This is used to calculate the weighted center coordinate of a cluster, to which sensor s belongs. The coordinate calculation method will be defined later.
WS1: Window size for the number of sensed raw datasets to which the logical-OR operation is applied. This is a given integer value. WS1 > 0.
WS2: Window size or the number of elements (coordinates) that construct movement vector mvt(td.ID). This is a given integer value. WS2 > 1.

3.2. Main Procedure

Figure 1. Main procedure of the proposed algorithm.
Sensors 15 13459 g001
The main procedure of the proposed algorithm is shown in Figure 1. It mainly consists of two processing steps: the location estimation step and path estimation step. The former is described as a part of the main procedure, whereas the latter step will be shown later. At each time t, the two steps are invoked sequentially, and a link from the current to the next human position is estimated. First, as the location estimation step, the candidates for human positions are listed using a clustering technique. Then, in the path estimation step, the links are determined by selecting reasonable positions among the candidates obtained in the location estimation step. At time t, the position of each human is estimated using the candidate sets, i.e., the sets of the weighted centers of clusters, obtained from t-WS2 + 1 to t. Here, WS2 is relatively small. Thus, our algorithm can trace the human movement paths almost in real time, without knowing the number of humans in the room. Our previous algorithm could not do this [22,23]. In addition, the framework of the proposed algorithm is the same as that of the algorithm introduced in [24], except that both the location estimation and path estimation steps are modified to improve human tracking accuracy. In the following subsections, the detailed procedure of each step will be explained.

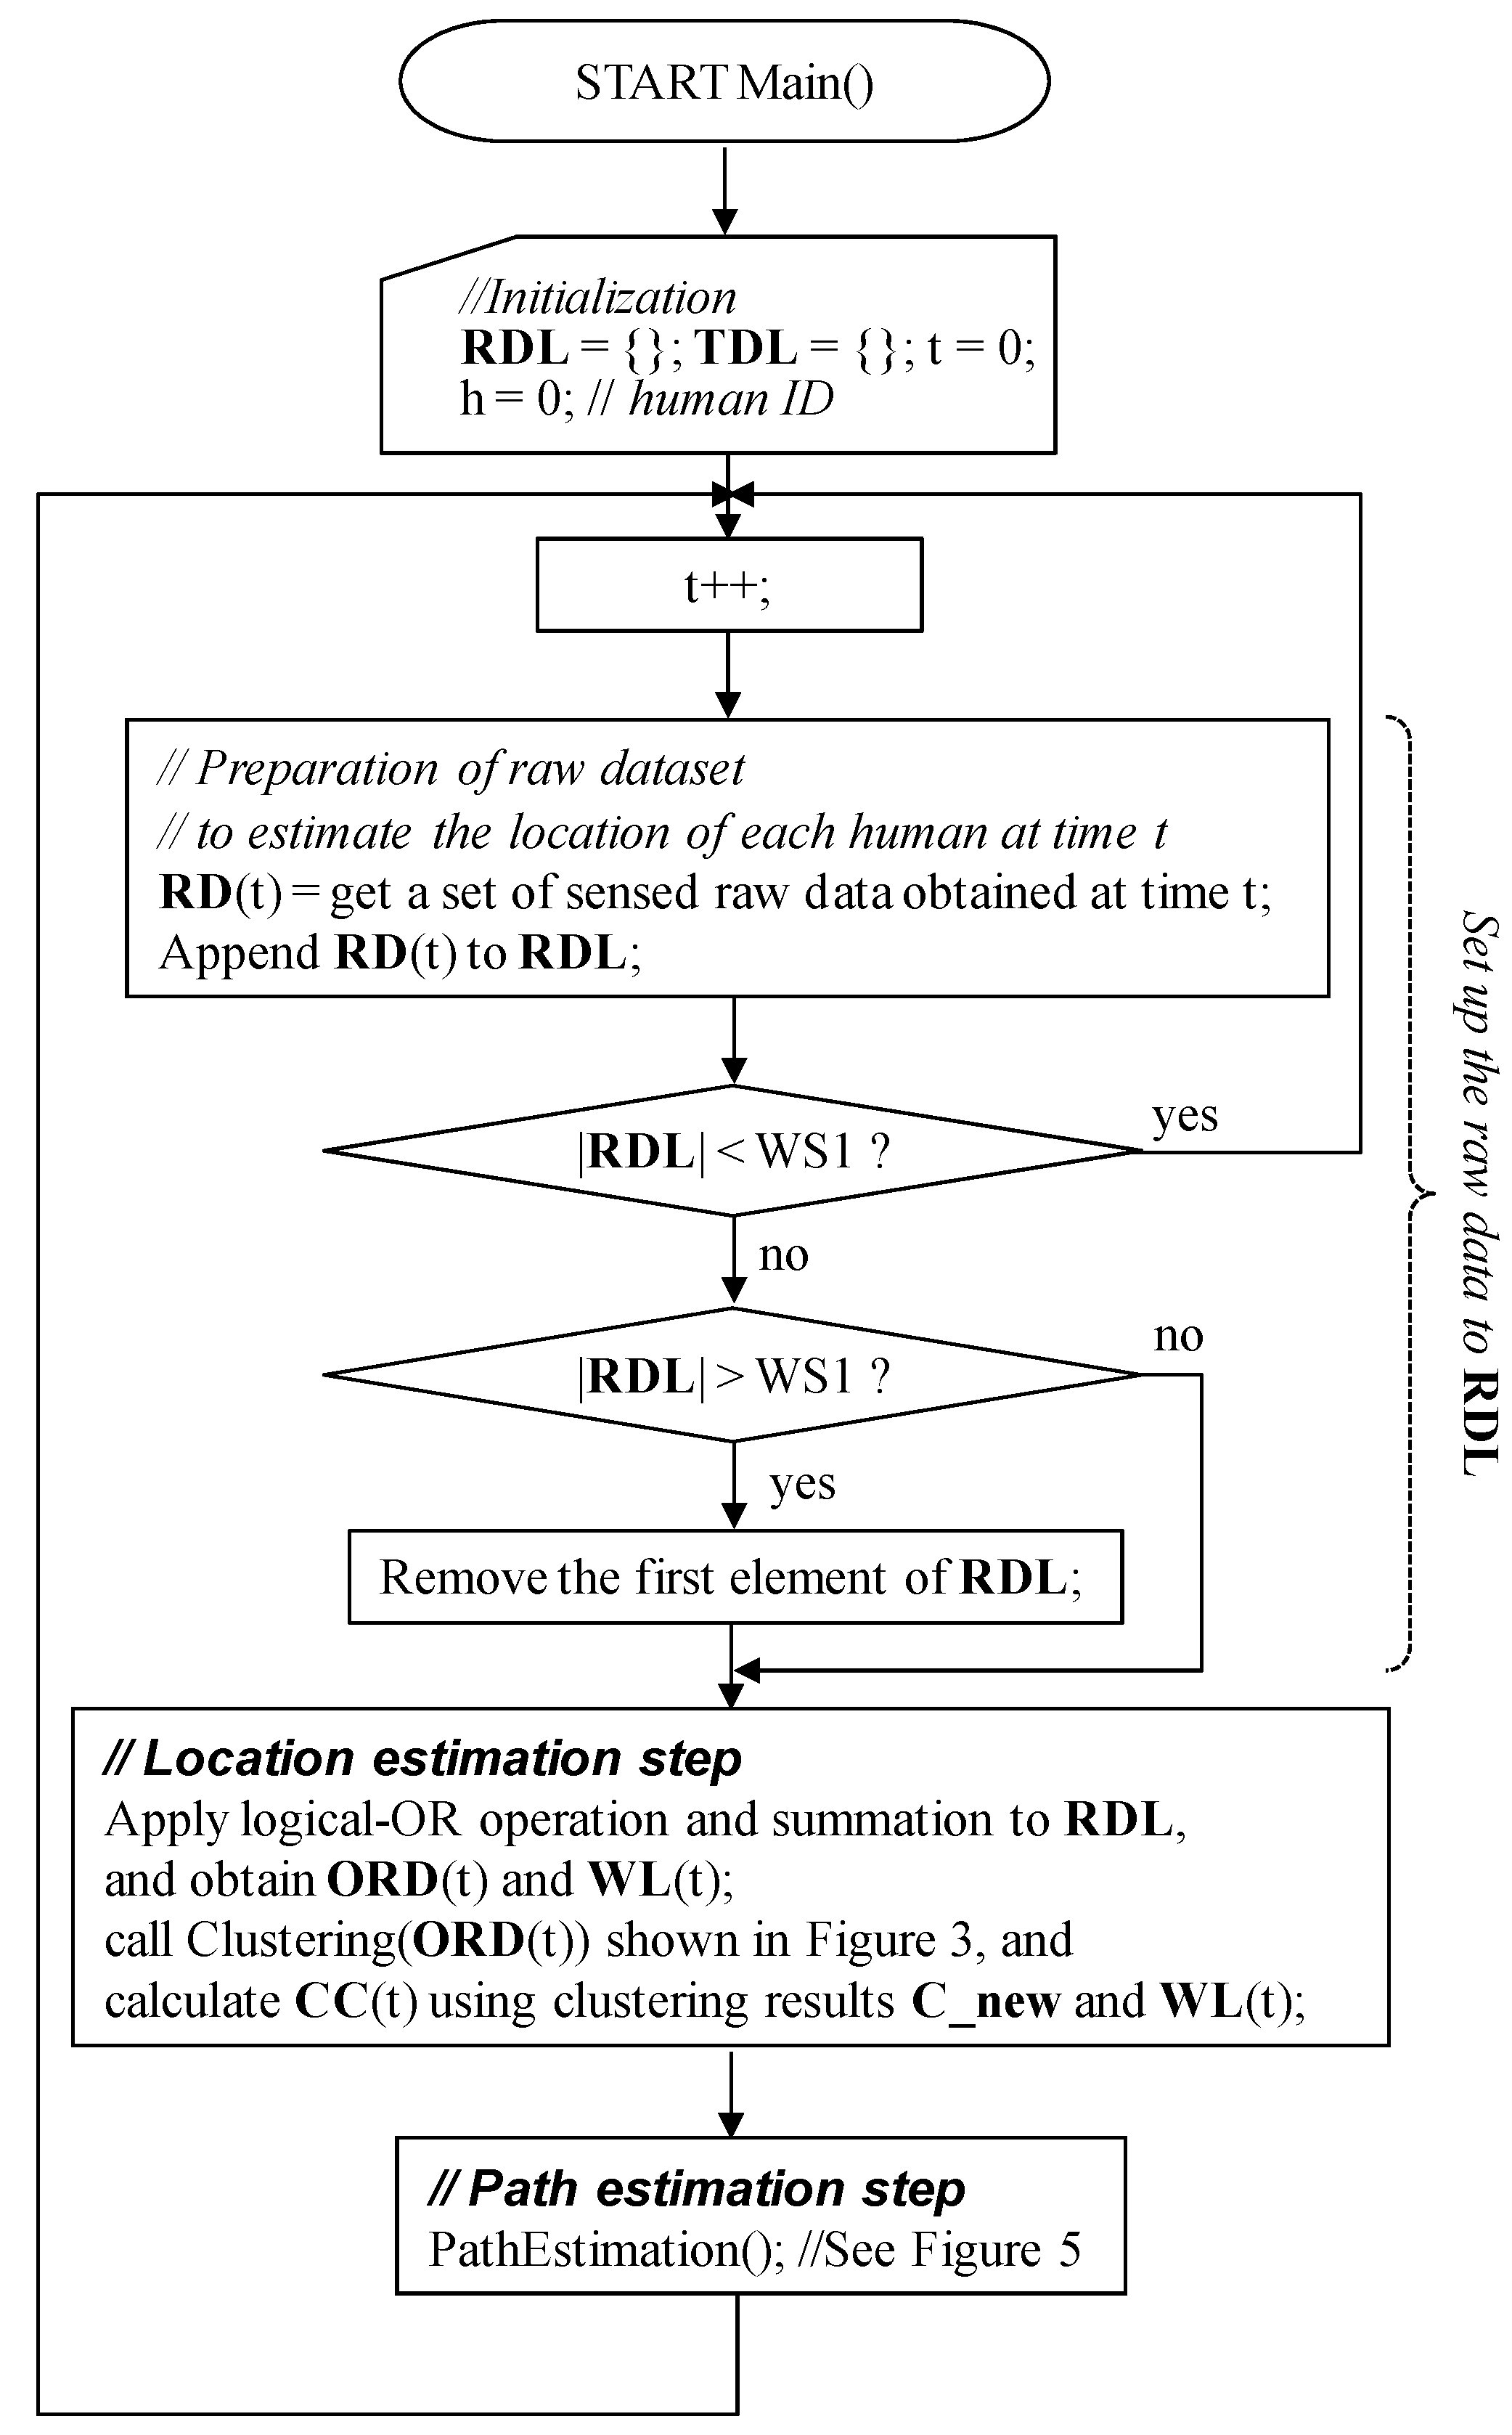
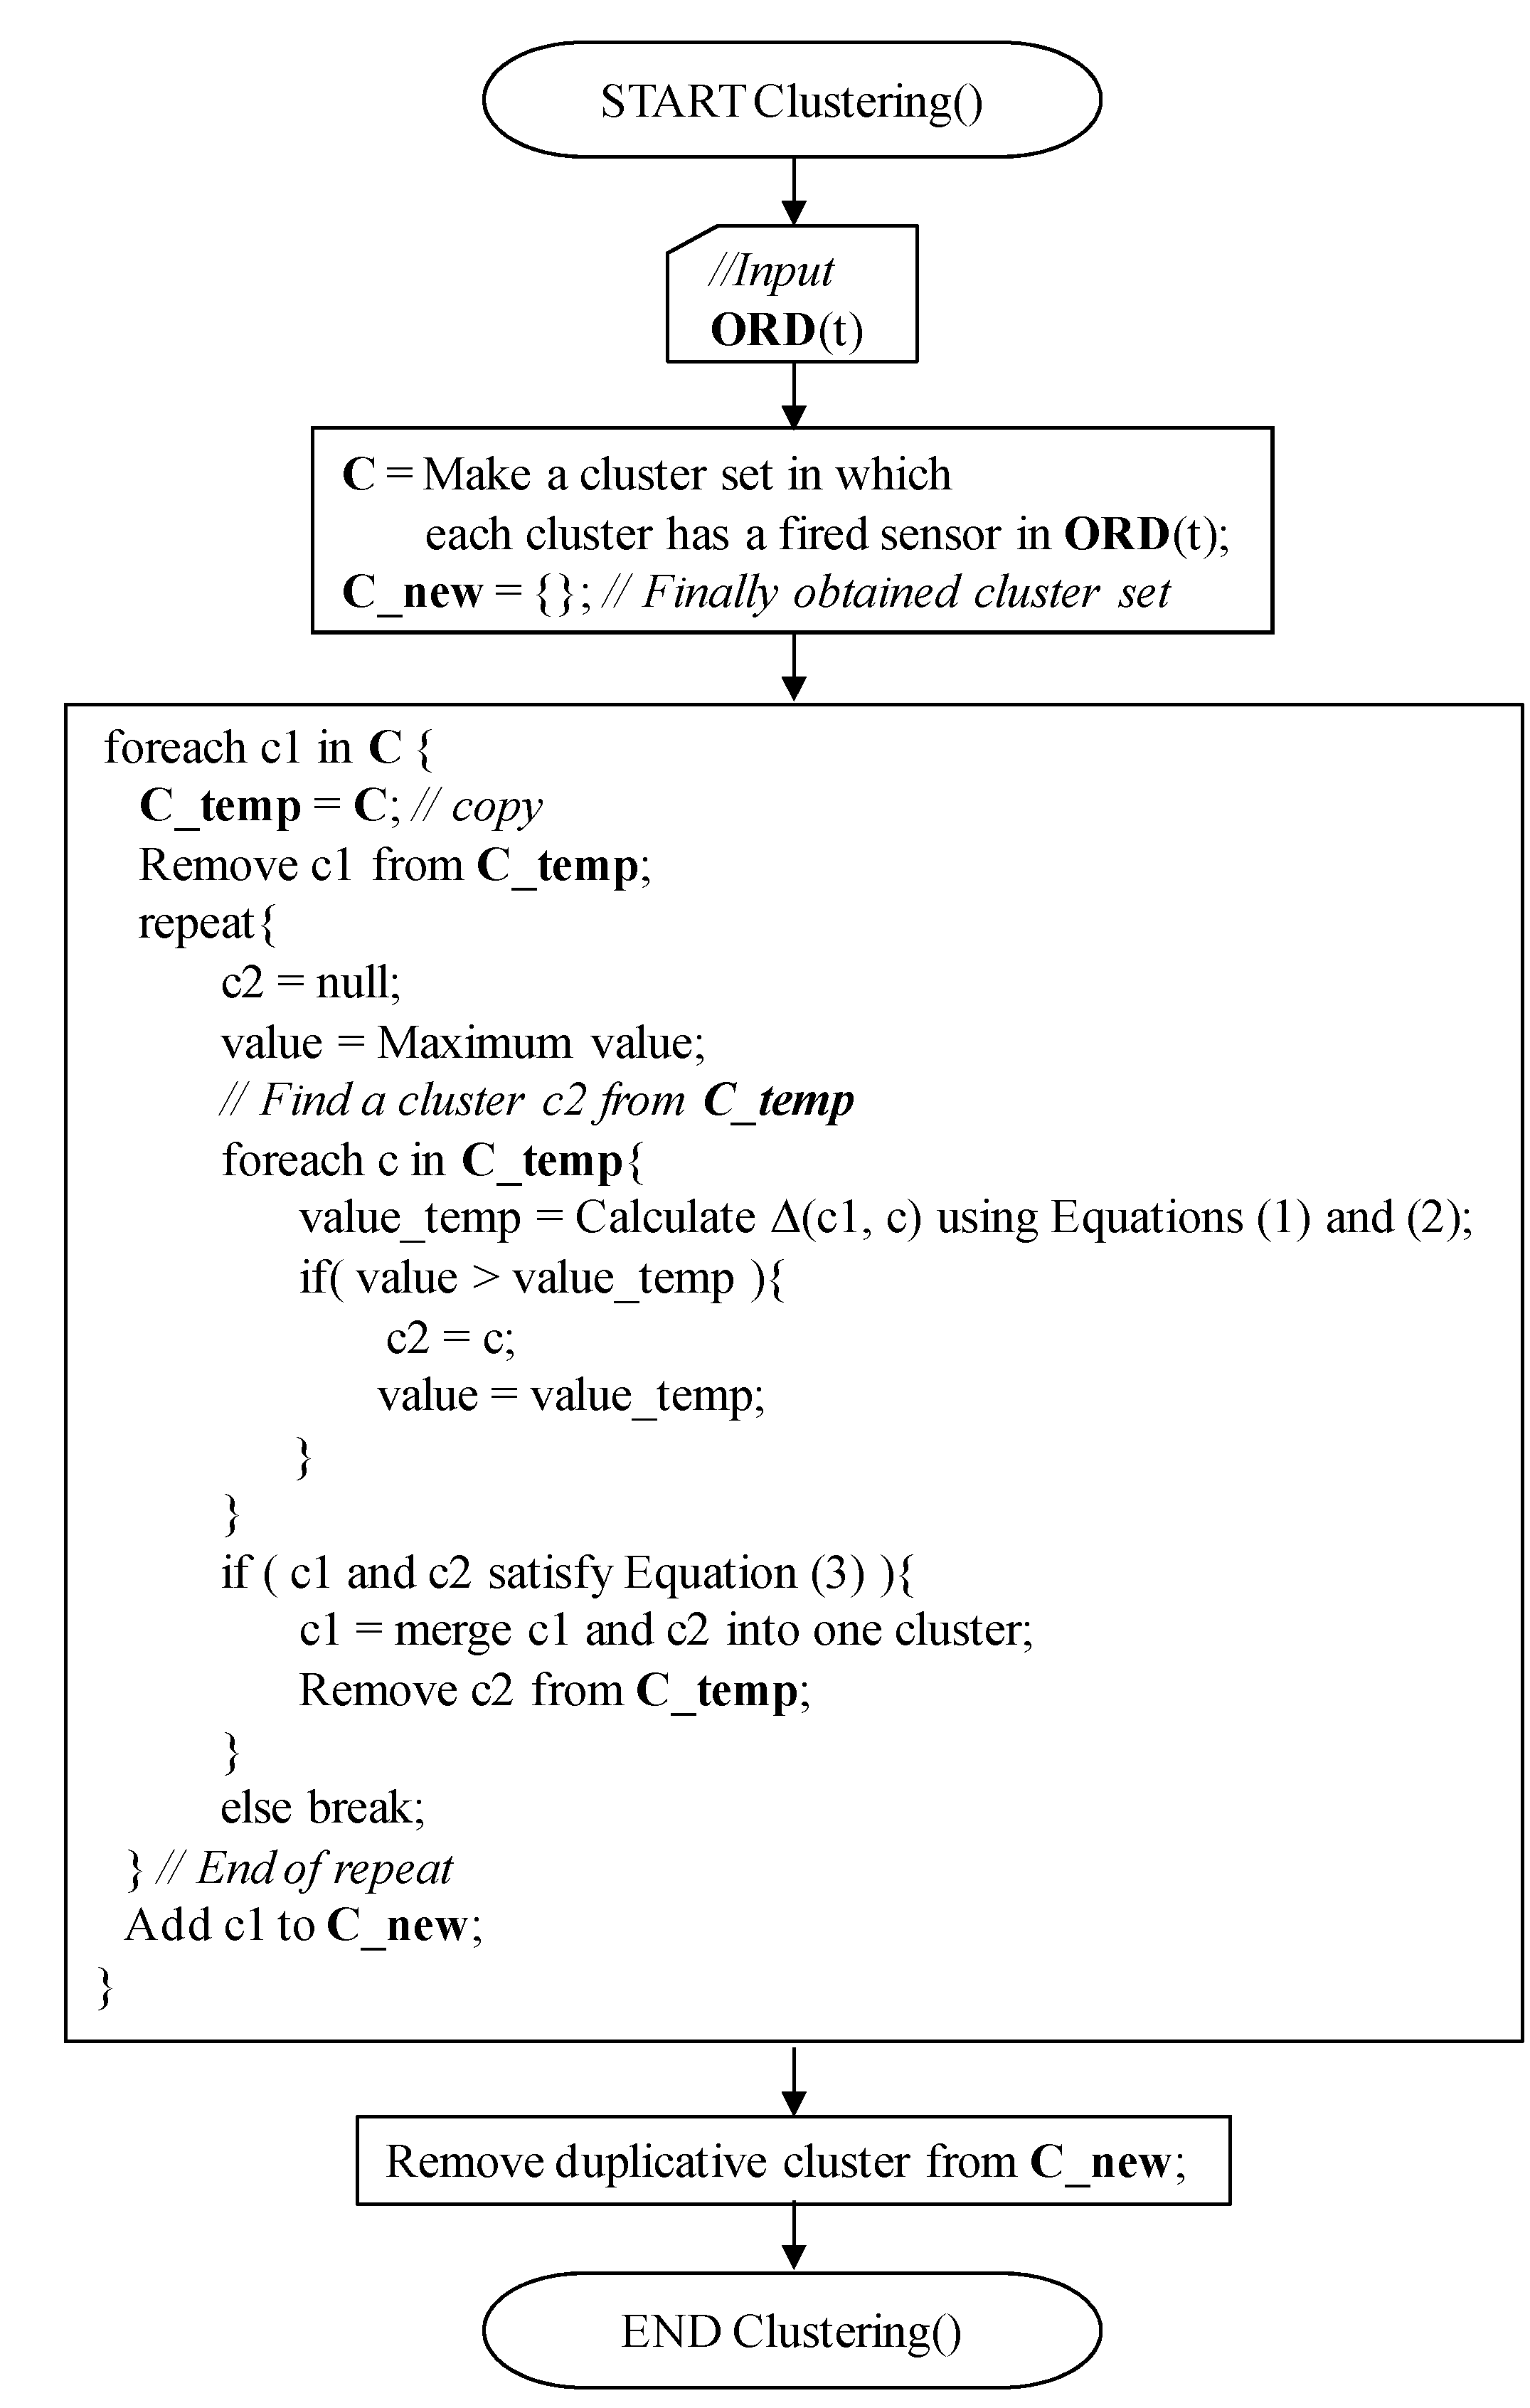
3.3. Location Estimation Step

The main purpose of this step is to provide a candidate list containing the next locations of the humans in the room. To achieve this, logical-OR operations and summations are applied to list RDL that contains all sensed raw data in time period [t, t-WS1 + 1], and ORD(t) and WL(t) are obtained. Figure 2 shows an example. In this example, S = 6, and WS1 = 7. RDL = {(0,0,0,0,1,0), (1,0,0,0,1,0), …, (0,1,0,0,1,1)}.
Thus, ORD(t) becomes {1,1,0,0,1,1} after applying a logical-OR operation to RDL, and WL(t) becomes {3,5,0,0,6,1} by summing up the corresponding sensed raw data in RDL. Here, in the case of S = 1, we cannot estimate human movements actually. However, we can detect if humans exist in the detection area of the IR sensor. It is often called “proximity” position detection. To simplify the discussion, we treat S = 1 case as a human-trackable case in this paper.
Figure 2. Example of sensed raw data processing.
Sensors 15 13459 g002
Next, using ORD(t) and WL(t), the fired sensors during time period [t, t-WS1 + 1] are grouped using a clustering method. Finally, the weighted centers of the clusters are calculated, and they are used in the path estimation step as the candidates for the next human positions. The clustering algorithm is shown in Figure 3. The algorithm is based on the Ward method [26]; however, the termination condition of our algorithm is different from that of the original method. While the original Ward method tries to merge the nearest pair of clusters until all initial clusters are merged into one cluster, our algorithm stops the cluster merging if Equation (3), i.e., the termination condition, is no longer satisfied. The geometrical distance between the centers of any two clusters in the finally obtained cluster set will be longer than the radius of the detection range of IR sensor r.
Here, we assume that a person exists in each obtained cluster, and his/her position is the weighted center of the cluster. The weighted center coordinate cci(t) = (xi(t), yi(t)) of cluster ci(t) at time t is calculated using Equation (4).
Note that each element can belong to more than one cluster in our new clustering method, contrary to that used in our previous algorithm [24]. Thus, we can manage the case that multiple humans exist in the detection range of the same IR sensor, which cannot be managed by our previous algorithm introduced in [24]:
min c i , c j C ; i j Δ ( c i , c j ) = E ( c i c j ) E ( c j ) E ( c j )
E ( c ) = k c { ( x k X ¯ ) 2 + ( y k Y ¯ ) 2 }
X ¯ = 1 | c | k c x k ,   Y ¯ = 1 | c | k c y k
where ( x k , y k ) is the coordinate of element k , and | c | is the number of elements in cluster c:
r 2 < 1 | c i c j | E ( c i c j )
x i ( t ) = s c i ( t ) w s ( t ) x s ( t ) s c i ( t ) w s ( t ) ,   y i ( t ) = s c i ( t ) w s ( t ) y s ( t ) s c i ( t ) w s ( t )
where “s” is a sensor ID. The weighted centers of all clusters are set to CC(t). They become candidates for human positions at time t. Figure 4 shows an example. In the example, cluster c1(t) consists of sensors s = 1, s = 2, and s = 3. If the position coordinates of the sensors are (10, 10), (9, 5), and (14, 8), and their weights are w1(t) = 4, w2(t) = 1, and w3(t) = 2, the center coordinate cc1(t) will be (11.0, 8.7), i.e., x1(t) = (4 × 10 + 1 × 9 + 2 × 14)/(4 + 1 + 2) and y1(t) = (4 × 10 + 1 × 5 + 2 × 8)/(4 + 1 + 2). Furthermore, sensor s = 2 belongs to another cluster c3(t). Thus, the coordinate of s = 2 is also used to calculate the weighted center cc3(t) of cluster c3(t). If a cluster contains only one sensor, like cluster c2(t) in Figure 4, the center position coordinate is simply the position of the sensor. After all weighted center coordinates of the clusters are calculated and set to CC(t), the path estimation step will be initiated.
Figure 3. Clustering algorithm.
Sensors 15 13459 g003
Figure 4. Example of clustering.
Sensors 15 13459 g004

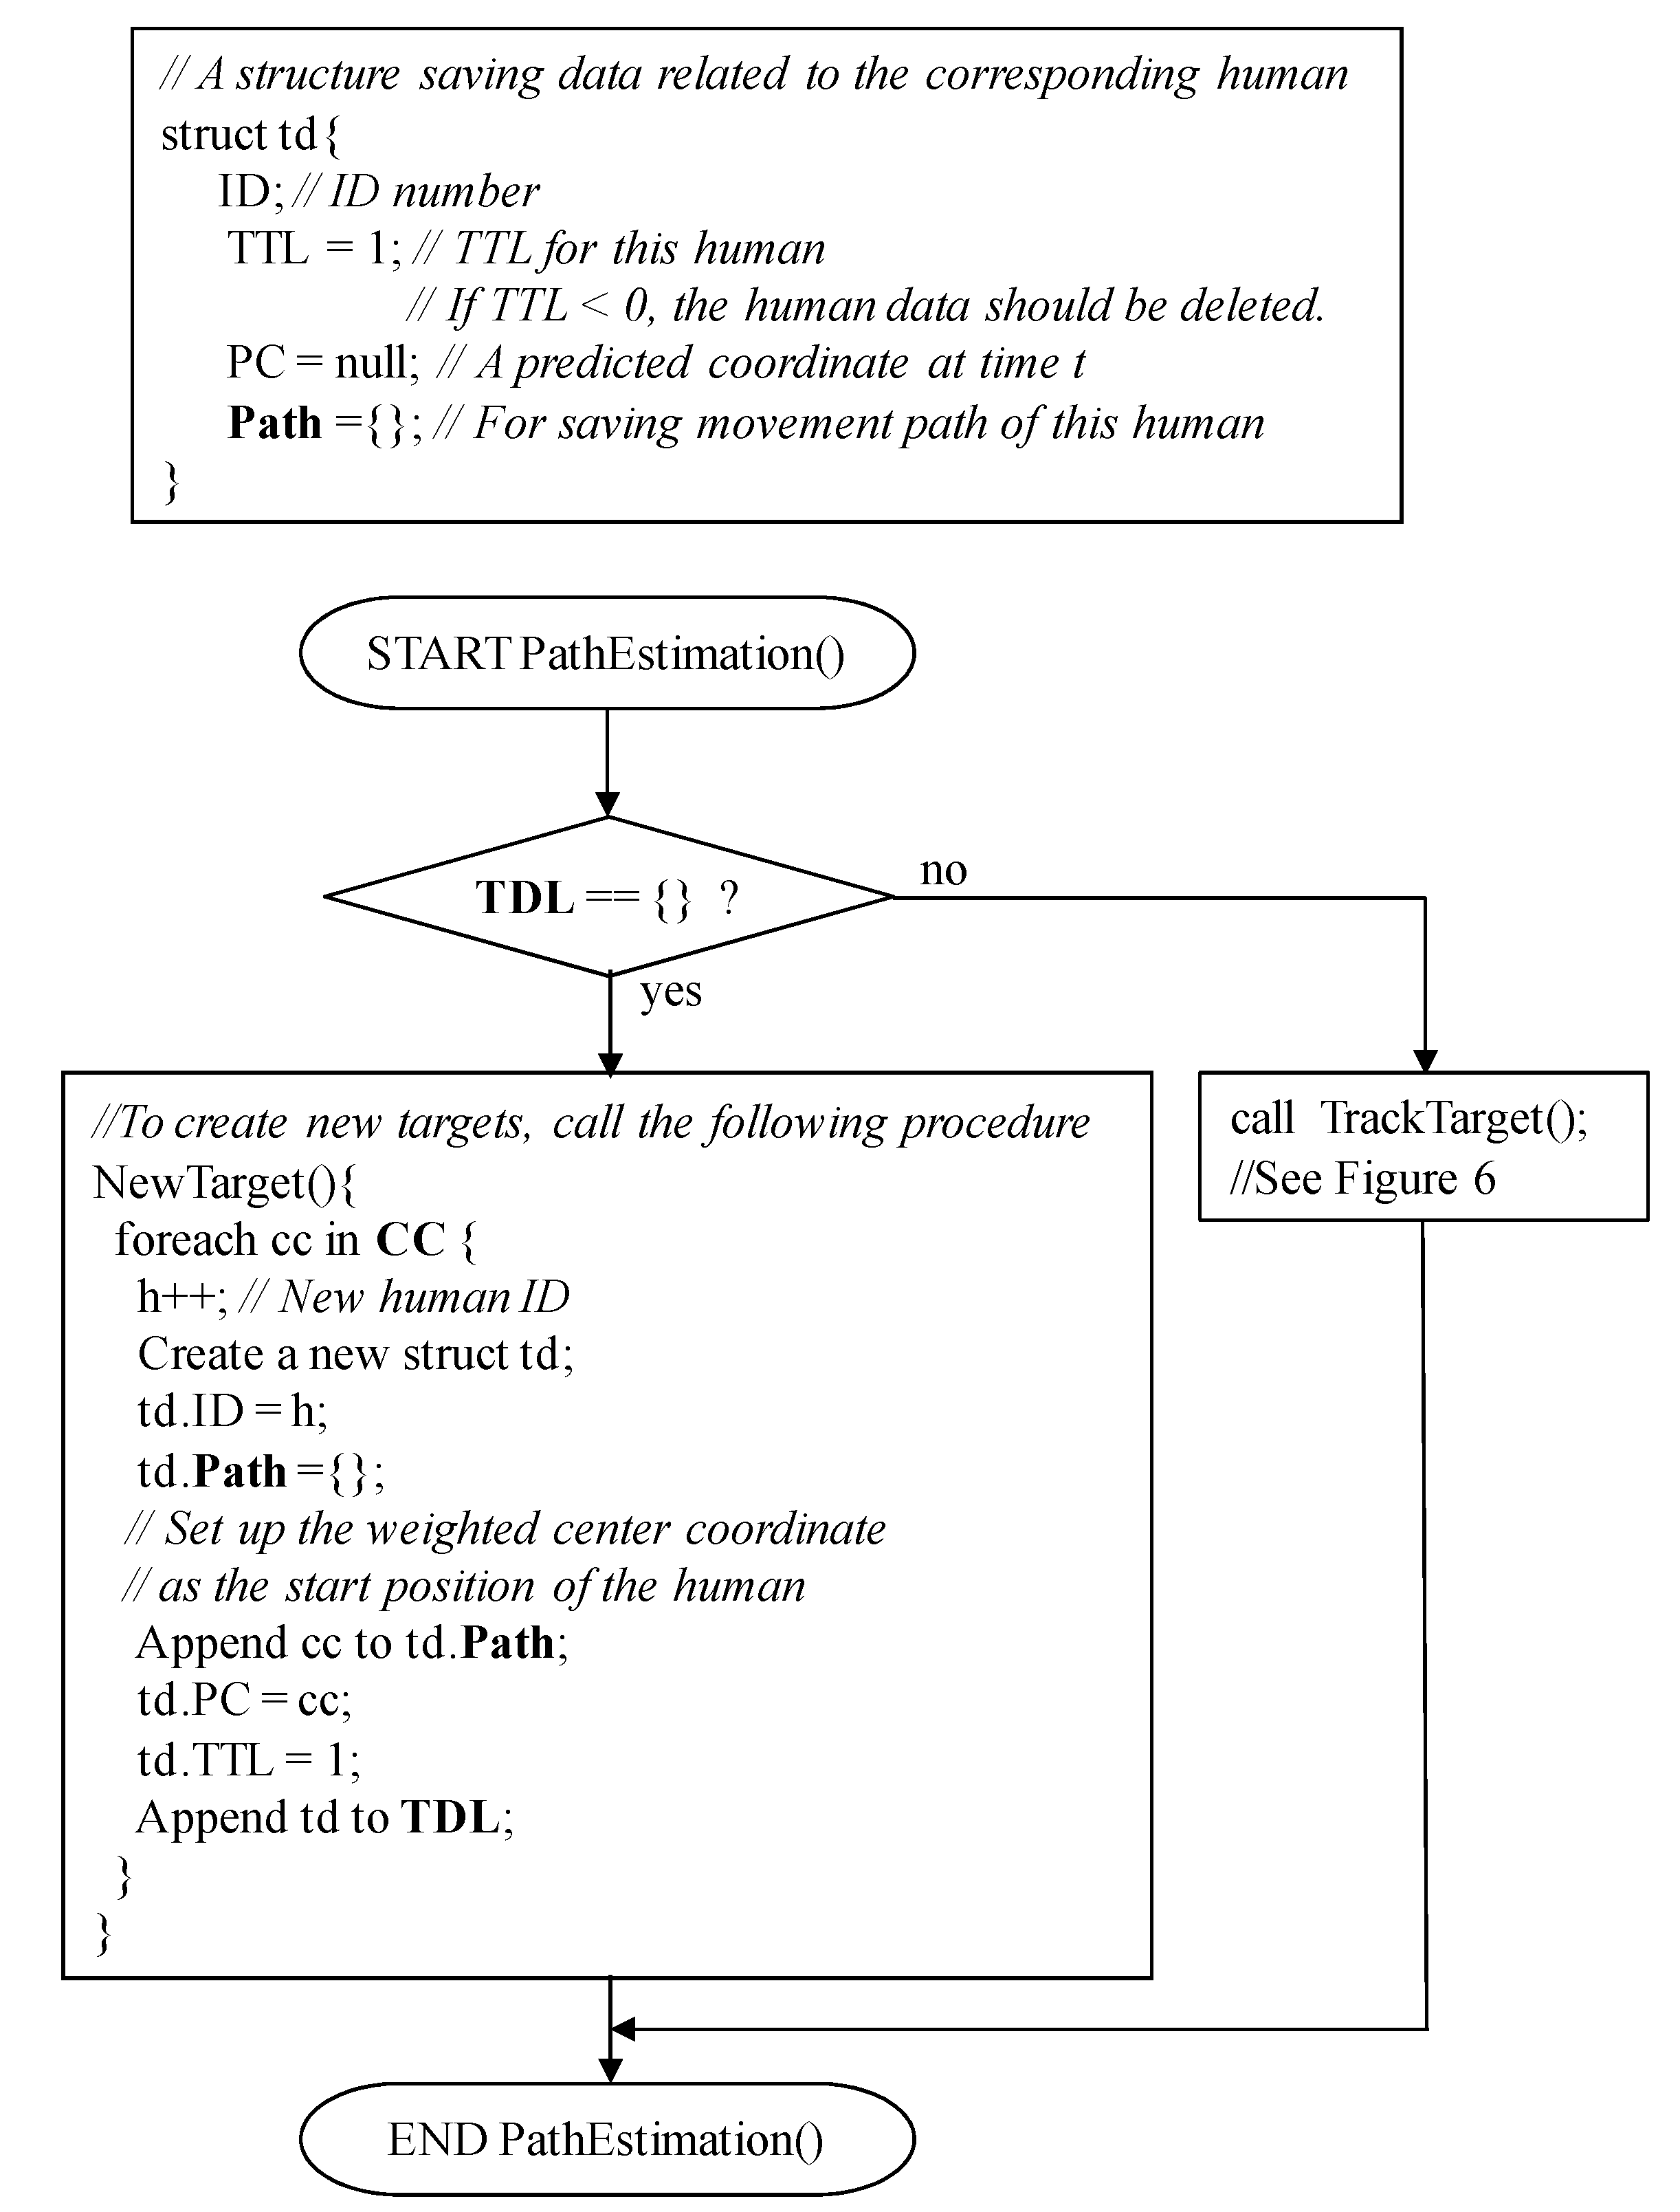
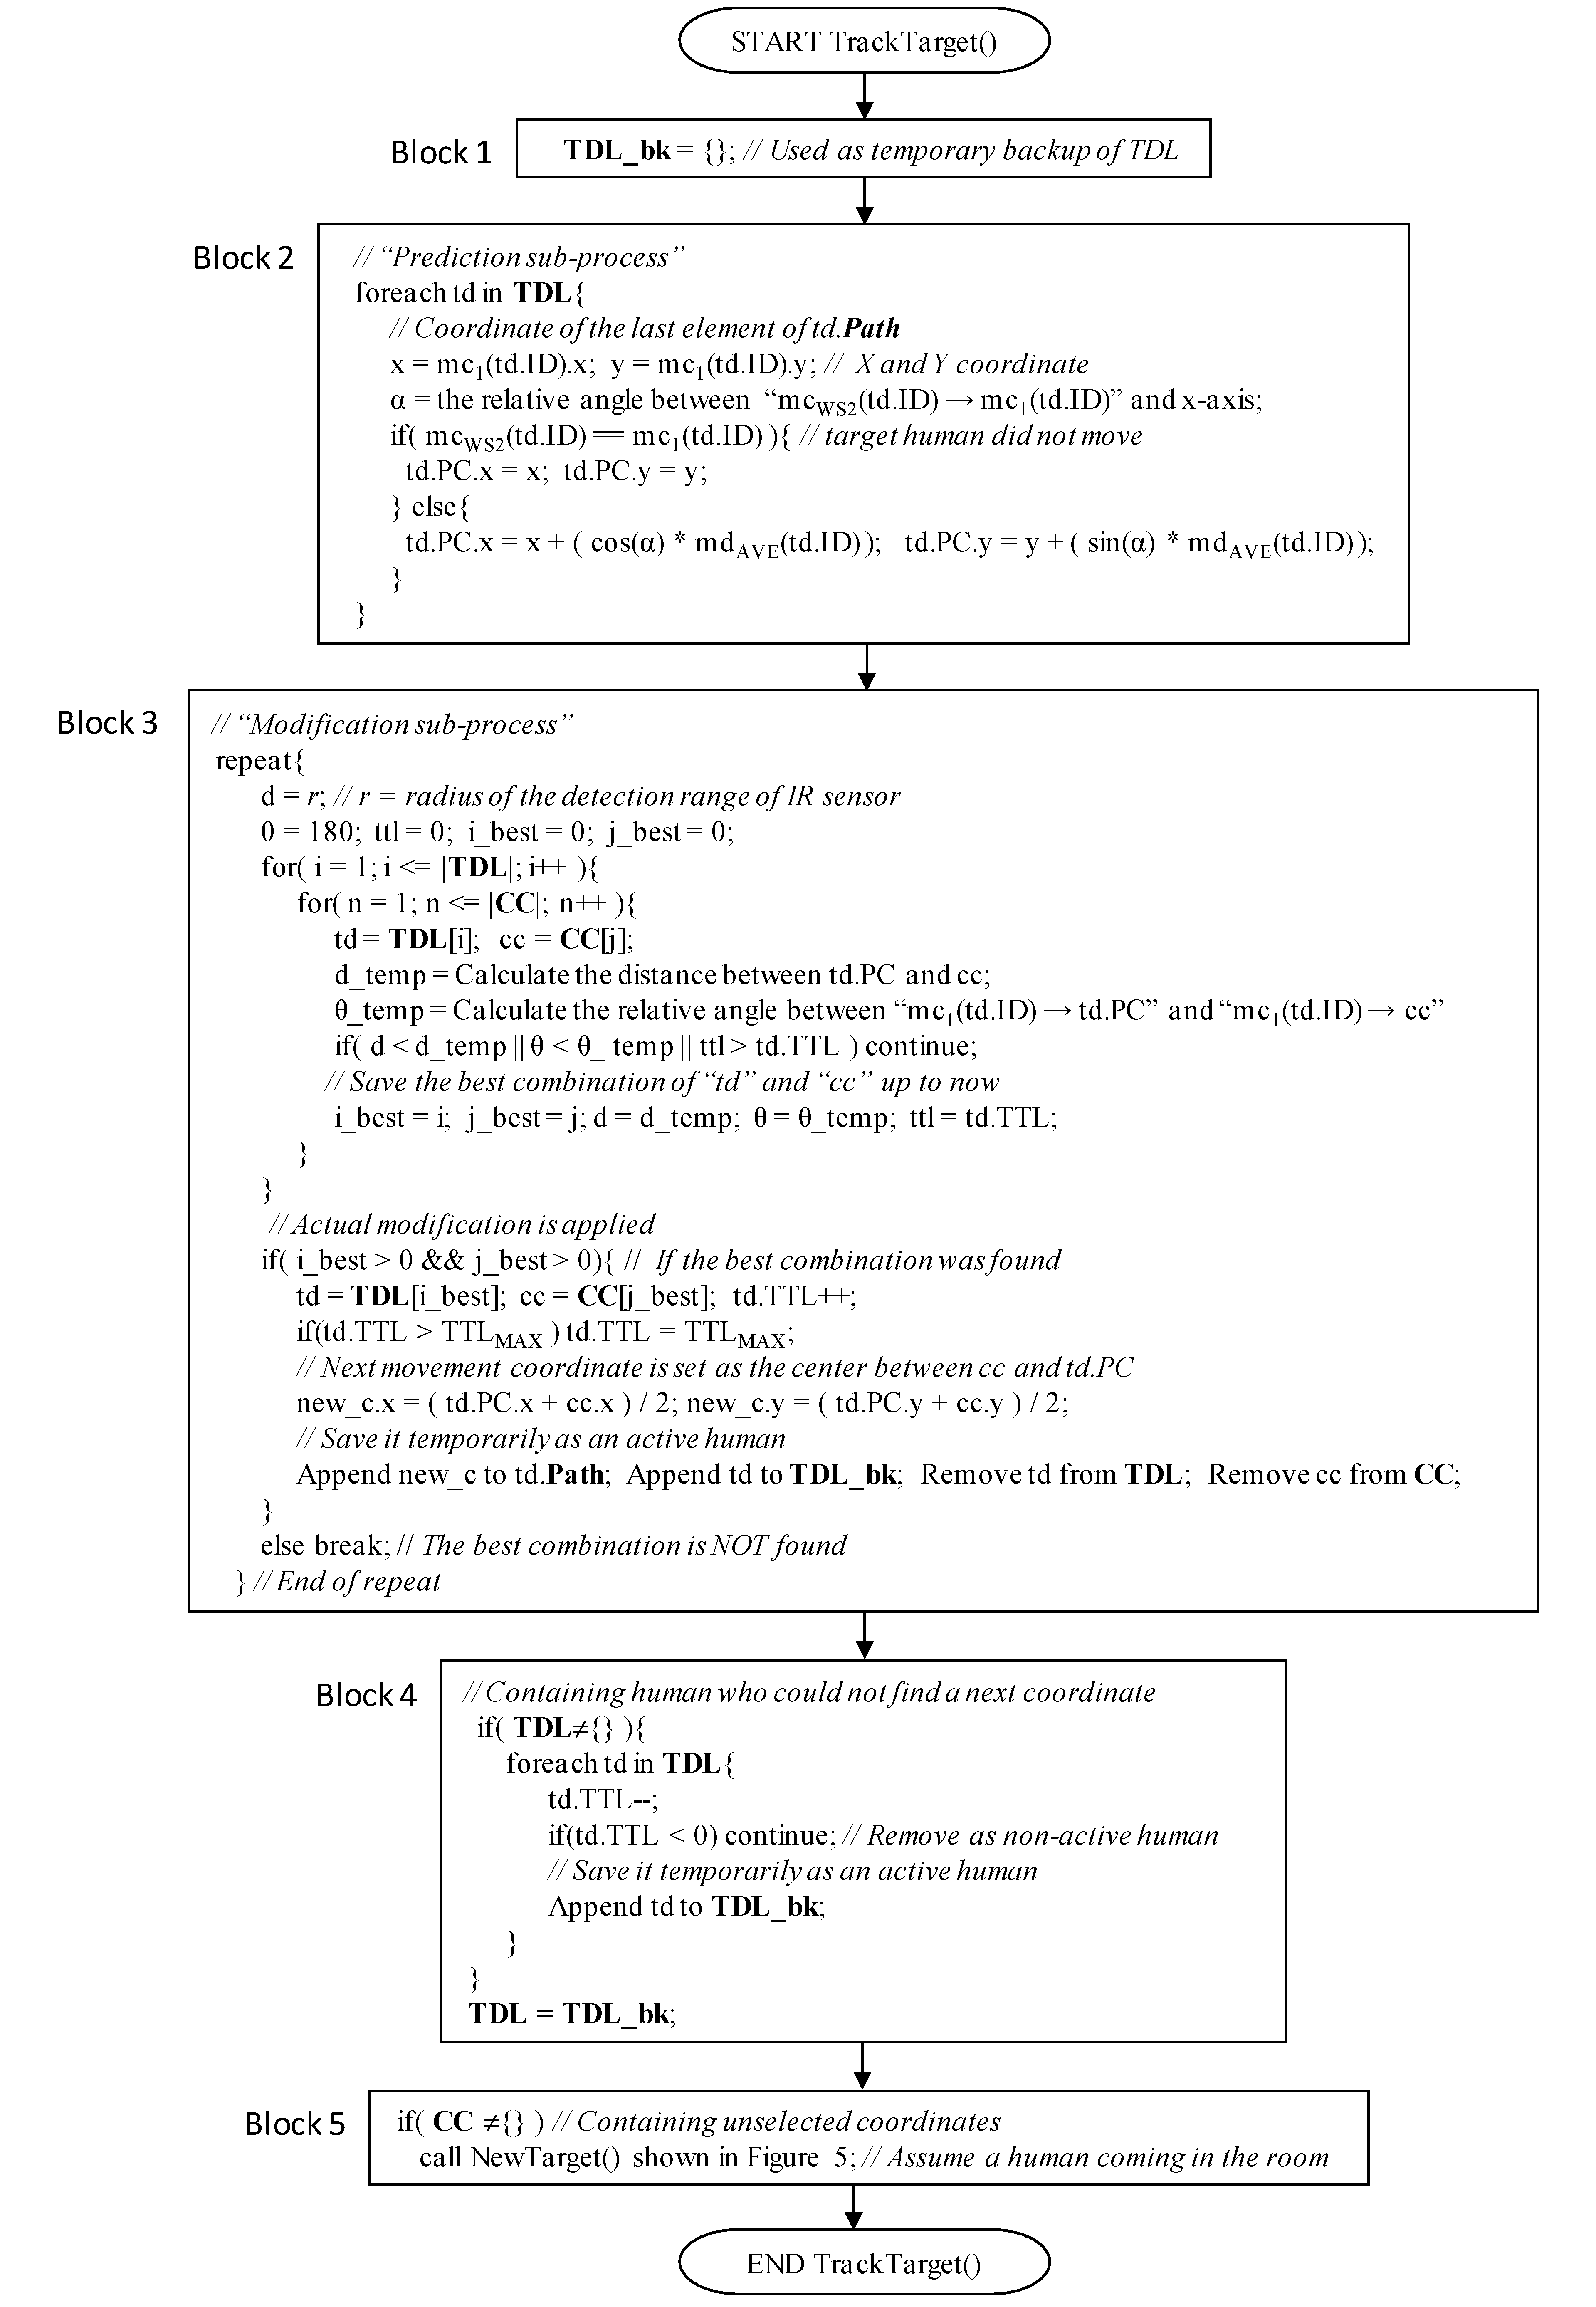
3.4. Path Estimation Step

The procedure of this step is described in detail in Figure 5 and Figure 6. In the main procedure, PathEstimation(), if TDL is empty, NewTarget() is called to create new humans. Their starting points are simply the weighted center coordinate of CC, respectively. Here, TDL represents humans currently existing in the room. If some humans exist, i.e., TDL is not empty, TrackTarget() in Figure 6 is invoked to obtain the next position coordinate of each human. TrackTarget(), which has been changed from our previous one introduced in [24], contains two sub-processes: prediction and modification. In the prediction sub-process, a predicted coordinate, td.PC, is provided for each human as the next position coordinate at time t (see “Block 2” in Figure 6). First, a movement angle α of each human at time t is calculated using a movement vector MV(td.ID). Here, the movement vector represents the expected direction of the corresponding human, and is calculated using the most recently estimated WS2 number of the position coordinates of the human, i.e., mvt(td.ID). Here, equal values for mcWS2(td.ID) and mc1(td.ID) indicate that the target human did not move. Therefore, the predicted coordinate td.PC is simply treated as mc1(td.ID). Otherwise, the prediction is calculated. Figure 7 shows an example. First, an average of movement distance mdAVE(td.ID) is calculated using mvt(td.ID), defined as:
m d A V E ( t d . I D ) = 1 W S 2 1 i = 2 W S 2 ( x i 1 x i ) 2 + ( y i 1 y i ) 2
where x’i = mci(td.ID).x and y’i = mci(td.ID).y. Using the movement angle α and mdAVE(td.ID), the predicted coordinate td.PC is calculated (see also procedure for TrackTarget() shown in Figure 6).
Figure 5. Procedure of the path estimation step.
Sensors 15 13459 g005
Figure 6. Procedure to estimate the next position of each human.
Sensors 15 13459 g006
Figure 7. Example of the calculation of predicted next coordinate.
Sensors 15 13459 g007
Next, as the modification sub-process, all pairs of the weighted coordinates in CC and target humans in TDL are examined, and the best pair is selected in consideration of distance d, angle θ, and time to live (TTL) of “td.” Here, “d” is the distance between td.PC and cc. “θ” is the relative angle between “mc1(td.ID) → td.PC” and “mc1(td.ID) → cc.” A pair that minimizes “d” and “θ” and maximizes TTL at the same time is finally selected as the best pair.
Actual modification is, then, applied for the best pair found in the prediction sub-process, and the next movement position coordinate is obtained as the center of td.PC and cc of the best pair (see also “Block 3” in Figure 6). The obtained next position is appended to the td.Path of the corresponding target human. The elements representing the selected pair of the weighted center coordinate cc and target td are removed from CC and TDL. The aforementioned best-pair selection process is repeated until no more selected pairs exist. In addition, if the next position of a human can be successfully found, the TTL value of the human is incremented; otherwise, it is decremented. Here, the initial value of TTL is “1,” and its maximum value is TTLMAX. The TTL value never exceeds TTLMAX. If the TTL of a human becomes less than 0, the human is removed from the TDL as he/she has left the room. In addition, if an unselected coordinate is contained in CC, NewTarget() is invoked and a human is appended to TDL as he/she enters the room. Due to this mechanism, even if the number of humans is not estimated correctly using the clustering algorithm in the location estimation step shown in Figure 1 and Figure 3, and some humans have accidentally been generated by NewTarget() at this point, they will be removed within a short period.
Figure 8 shows an example of the Path Estimation step. Here, TDL = {td1, td2} and CC = {cc1(t), cc2(t), cc3(t)}. First, a pair of td1.pc and cc1(t) is selected. The distance between them is smaller than that between others, and the angle is less than 180° and smaller than that between others. Thus, the center coordinate of td1.PC and cc1(t) is calculated, and it is appended to td1.Path. In addition, td1.TTL is incremented. In the next step, because TDL = {td2} and CC = {cc2(t), cc3(t)}, a pair of td2.PC and cc2(t) is selected, and the process described above is applied to the pair.
Figure 8. Example of TrackTarget().
Sensors 15 13459 g008
Our path estimation algorithm shown in Figure 6 can be formulated using Equations (6) and (7). Assume that p t is the position of a target human at time t, p t = [ x t y t ] . Then, a prediction at time t is given by:
p ^ t = p t 1 + B u t
where p ^ t is a predicted coordinate at time t; in this paper, it is the same as td.PC: p ^ t   = [ x t y t ] . In addition, B is the average of the movement distance mdAVE(td.ID) of the target human, and u t is the x-y component form of the predicted movement distance at time t. u t = [ sin α cos α ] . Here, α is the angle of the movement vector MV(td.ID) at time t. Furthermore, the modified position at time t is given by:
p t = 1 2 ( p ^ t + z t )
where z t is a measurement of the target human at time t and is the same as the center position coordinate cc(t), which is obtained by the best-pair selection. z t = [ x t y t ] .
Equation (6) is similar in form to the Kalman filter, which is used in related work [19,20]. However, as compared to the original Kalman filter, in our proposed algorithm, p ^ t and z t are calculated as mentioned previously, not using the method for obtaining the Kalman gain. Since the system environment is drastically changed by the numbers of IR sensors and humans in a room and the detection range and distribution density of IR sensors, we cannot apply the calculation method to obtain the Kalman gain.

4. Evaluation

4.1. Evaluation Environment

To evaluate our algorithm, we used generated simulation data. The details are as follows. First, the density of IR sensors “D” is defined by:
D = S π r 2 A
where “S” is the number of IR sensors; “r” is the radius of the IR sensor detection range, r = 2.0 m; and “A” is the entire area of the room monitored, A = 100 m2 (10 m × 10 m). We assume that the entire area A should be covered with the minimum number of IR sensors. Thus, if we fix the density D as 2.0, 3.0, 4.0, or 5.0, the number of IR sensors S that should be deployed is calculated using Equation (8). The corresponding value of S is actually 16, 24, 32, or 40 as shown in Table 1. Here, “S” sensors should be randomly deployed in the area.
Table 1. Number of deployed IR sensors S used for experiments. It is related to the density of the sensors D.
DS
2.016
3.024
4.032
5.040
r = 2.0 m
The number of humans “H” is changed from one to four, and the human movement data are created for each case. The human movement scenario is as follows. After a random waiting time from 0 to 30 s, each human should enter an area through a door and walk around randomly. The walking scenarios are as follows. The human decides a destination position and walks toward it using the shortest path. Then, the human either stops at the destination position, or walks to a new random destination. Here, the human does not return quickly. After 60 s, the human should exit through the door. The walking speed of each human is randomly changed from 1.25 m/s to 1.75 m/s. For each “H,” 50 different variations of data were generated. In total, 800 (4 different H × 4 different S × 50 different variations) different input data were generated and used for the evaluation of the proposed algorithm. Here, the parameters of our algorithm are WS1 = 4, WS2 = 24, and TTLMAX = 18. According to our preliminary estimations, these combinations of values produce good path estimations.

4.2. Evaluation Results and Remarks

Our method estimates the number of humans and their movement paths simultaneously. Thus, it is difficult to evaluate the method using tracking errors like in other human tracking methods, which assume that the number of humans is fixed and known [20,27]. To evaluate our method, we introduced four metrics: success estimation rate, averaged error, averaged tracking rate, and success rate of the number of humans. The details are as follows: Table 2, Table 3, Table 4 and Table 5 show the evaluation results. For comparison, we also evaluated the previously proposed algorithm [24]. In the tables, the upper values represent the results of the proposed algorithm and the lower ones represent the results of the previous one.

(1)   Success estimation rate

Table 2 represents the percentage of 50 input patterns provided for each different case that were estimated correctly by our algorithm. For H = 1, both algorithms estimated all human movement paths correctly for all different densities. For H = 2, the success estimation rate of the proposed and previous algorithms were 60% and 57% on average, respectively. In addition, for H = 3 and H = 4, both the estimation rates were decreased to less than 34%. If the number of humans increase, their movement paths are often overlapped, which makes it difficult to estimate individual human movement. Thus, the success estimation rate decreases with the increase in the number of humans in a room, regardless of the path estimation methods being compared.
Table 2. Success estimation rate (Unit: %).
Density (D)Number of Humans (H)
H = 1H = 2H = 3H = 4
D = 2.010056346
10066286
D = 3.010064224
10060324
D = 4.0100642410
100462010
D = 5.0100562814
10056226
Average100.060.027.08.5
100.057.025.56.5
Upper value: The result obtained by the proposed algorithm; Lower value The result obtained by the previous algorithm [24].

(2)   Averaged error

Table 3 shows the averaged error of the estimated human movement paths compared to the true human movement paths among the successfully estimated data. In our algorithm, a position coordinate of the IR sensor was basically used. Therefore, an error in the detection range of the IR sensor is contained during the initial stage of the path estimation. Even so, for H = 1 and H = 2, the proposed method can trace the human movement path accurately for less than 0.60 m and 1.42 m on average, respectively. However, although our previous algorithm can trace one human for less than 0.68 m, the averaged error is more than 2.08 m when H = 2. In other cases, it could not trace the human movement paths correctly.

(3)   Averaged tracking rate

In Table 4, the averaged tracking rate for each target human is described. The tracking rate is defined as the ratio of the length of the correctly estimated route to the total length of the actual human movement path. If the rate is high, it indicates that the human path is estimated well for a long time. For H = 1, the human was tracked with an accuracy rate of more than 94% in both algorithms. In other cases, if the density was high, the tracking rate was also high. This implies that many sensors are needed to estimate multiple humans.
Table 3. Averaged error of the estimated path (Unit: m).
Density (D)Number of Humans (H)
H = 1H = 2H = 3H = 4
D = 2.00.60 (0.32)1.22 (0.89)2.05 (1.50)3.09 (2.09)
0.68 (0.36)2.08 (1.69)3.11 (2.23)3.42 (2.28)
D = 3.00.59 (0.29)1.27 (0.88)1.97 (1.43)1.52 (1.04)
0.66 (0.34)2.24 (1.73)3.12 (2.27)3.90 (2.32)
D = 4.00.59 (0.31)1.42 (0.94)1.44 (1.02)2.04 (1.43)
0.66 (0.35)2.43 (1.84)3.21 (2.22)3.18 (2.26)
D = 5.00.54 (0.27)1.38 (1.11)2.01 (1.42)2.62 (1.63)
0.61 (0.30)3.20 (2.35)3.03 (2.26)2.69 (2.39)
Average0.58 (0.30)1.32 (0.96)1.87 (1.34)2.32 (1.55)
0.65 (0.34)2.49 (1.90)3.12 (2.25)3.30 (2.31)
Upper value: The result obtained by the proposed algorithm; Lower value The result obtained by the previous algorithm [24]; ( ): standard deviation.
Table 4. Averaged tracking rate (Unit: %).
Density (D)Number of Humans (H)
H = 1H = 2H = 3H = 4
D = 2.097.98 (7.33)57.22 (14.04)35.40 (5.60)33.56 (2.73)
94.63 (13.31)61.34 (17.19)43.30 (8.87)42.90 (2.38)
D = 3.099.78 (0.09)66.94 (16.34)55.12 (11.15)43.47 (5.13)
99.55 (0.10)69.67 (12.97)58.22 (8.06)54.60 (1.34)
D = 4.099.78 (0.06)75.39 (13.19)58.46 (9.13)48.46 (5.11)
99.55 (0.07)71.77 (15.41)54.64 (4.07)55.06 (7.89)
D = 5.099.78 (0.07)83.20 (14.34)64.51 (14.57)51.57 (6.82)
99.55 (0.07)73.69 (13.02)59.29 (4.40)58.39 (2.70)
Average99.33 (1.89)70.69 (14.48)53.37 (10.11)44.27 (4.95)
98.32 (3.39)69.12 (14.65)53.86 (6.35)52.74 (3.58)
Upper value: The result obtained by the proposed algorithm; Lower value The result obtained by the previous algorithm [24]; ( ): standard deviation.

(4)   Success rate of the number of humans

Table 5 shows what percentage of the number of humans correctly estimated in the room at each time. It is directly related to our clustering algorithm. Using the proposed algorithm, when H = 1 and H = 2, the success rates of H were more than 97% and 76%, respectively. However, for H = 3 and H = 4, these rates were from 45% to 60%. If the number of humans increases, the probability that some of them are walking close together increases. Therefore, the performance of the clustering algorithm decreases. Compared to our previous algorithm, the newly proposed clustering algorithm does not perform well.
Table 5. Success detection rate of number of humans (Unit: %).
Density (D)Number of Humans (H)
H = 1H = 2H = 3H = 4
D = 2.097.76 (0.95)83.15 (5.58)60.32 (5.58)52.79 (1.81)
98.87 (0.64)85.79 (6.36)59.77 (6.62)44.63 (4.07)
D = 3.097.87 (1.01)76.76 (9.58)58.97 (8.43)55.69 (6.29)
99.03 (0.59)84.17 (9.64)69.65 (9.13)50.08 (0.08)
D = 4.098.86 (0.54)81.62 (8.53)55.01 (9.76)51.20 (1.83)
99.54 (0.31)88.17 (8.39)61.91 (11.76)54.41 (3.68)
D = 5.099.10 (0.38)78.22 (6.65)57.73 (7.74)45.62 (3.49)
99.68 (0.17)88.83 (6.35)71.43 (7.61)53.90 (9.94)
Average98.40 (0.72)79.94 (7.59)58.01 (7.88)51.13 (3.35)
99.28 (0.43)86.74 (7.68)65.69 (8.78)50.76 (4.44)
Upper value: The result obtained by the proposed algorithm; Lower value The result obtained by the previous algorithm [24]; ( ): standard deviation.
According to these results, if the number of humans in the room increased, the tracking accuracy of our method decreased. This is because our clustering algorithm does not work well if some humans walk closely together. In addition, if relatively many humans exist, e.g., when H = 3 and H = 4 in our experiments, almost all the IR sensors are fired simultaneously. In such cases, no algorithm can estimate the number of humans correctly. However, as shown for H = 2, our algorithm can estimate the human movement paths well with a 1.42 m averaged error. In addition, our human-location-estimation algorithm based on a clustering method performs with a success rate of greater than 76% even for the complicated case when two persons enter and exit the room at different times. Compared to our previous algorithm, the clustering method itself in the proposed algorithm does not perform well, because the new clustering method allows a position candidate to belong to more than one cluster. However, owing to this fact, the averaged accuracy of the final human tracking is improved. As shown in Table 3, the averaged errors of the estimated human movement paths are improved two-fold for H = 2.
Figure 9 illustrates an example of the estimated human movement paths for H = 2. The solid line is the true path of the first human, and the dotted line is the true path of the second human. They are indicated by “TruePath1” and “TruePath2” in Figure 9. Two different kinds of markers represent the estimated locations of two persons, respectively. They are “EstPath1” and “EstPath2” in the figure. The start and goal locations of both persons are the same, which is indicated as “Door” in the figure. As shown in Figure 9, our proposed algorithm can trace human movement well. This is the best result among 50 different input data generated with the same condition, D = 5.0. That is, 40 sensors were deployed in the field. The numerical results for the case shown in Figure 9 are as follows: the averaged error of the estimated paths, corresponding to Table 3, is 0.56 m. The averaged tracking error, corresponding to Table 4, is 99.89%. Success detection rate of number of humans, corresponding to Table 5, is 86.85%.
Figure 9. Example of the path estimation results.
Sensors 15 13459 g009

5. Conclusions

We have proposed an algorithm that can track the human movement paths using only the binary sensing data obtained from infrared sensors attached to the ceiling. The human positions are estimated at each timepoint based on a clustering method. Thus, the proposed algorithm can track multiple humans even if the number of humans in the room is changed dynamically, which was difficult to realize using methods proposed in related studies. According to simulation-based evaluations, our algorithm can trace real human movement paths with a 1.32 m error on average if two humans are in the room. In future studies, we will evaluate our algorithm using real sensed data obtained from a real infrared sensor system.

Acknowledgments

This work was partly supported by Strategic Information and Communications R&D Promotion Programme (SCOPE No. 121802001).

Author Contributions

The method was developed by both authors. T. Miyazaki contributed to writing the paper, while Y. Kasama evaluated the proposed method and prepared the evaluation results.

Conflicts of Interest

The authors declare no conflict of interest.

References

  1. Bhagat, K.; Wermter, S.; Burn, K. Hybrid learning architecture for unobtrusive infrared tracking support. In Proceedings of the IEEE International Joint Conference on Neural Networks 2008 (IJCNN 2008), Brisbane, Australia, 1–8 June 2008; pp. 2703–2709.
  2. Seki, H.; Tadakuma, S. Abnormality detection monitoring system for elderly people in sensing and robotic support roomt. In Proceedings of the 10th IEEE International Workshop on Advanced Motion Control 2008 (AMC ’08), Trento, Italy, 26–28 March 2008; pp. 56–61.
  3. Hu, W.; Tan, T.; Wang, L.; Maybank, S. A survey on visual surveillance of object motion and behaviors. IEEE Trans. Syst. Man Cybernet. Part C Appl. Rev. 2004, 34, 334–352. [Google Scholar] [CrossRef]
  4. Lin, D.T.; Huang, K.Y. Collaborative pedestrian tracking with multiple cameras: Data fusion and visualization. In Proceedings of the International Joint Conference on Neural Networks (IJCNN2010), Barcelona, Spain, 18–23 July 2010; pp. 1–8.
  5. Watada, J.; Musaand, Z.B. Tracking human motions for security system. In Proceedings of the SICE Annual Conference 2008, Tokyo, Japan, 20–22 August 2008; pp. 3344–3349.
  6. Changjiang, Y.; Duraiswami, R.; Davis, L. Fast multiple object tracking via a hierarchical particle filter. In Proceedings of the 10th IEEE International Conference on Computer Vision (ICCV 2005), Ottawa, ON, Canada, 17–21 October 2005; Volume 1, pp. 212–219.
  7. Deng, M.; Guan, Q.; Xu, S. Intelligent video target tracking system based on DSP. In Proceedings of the 2010 International Conference on Computational Problem-Solving (ICCP2010), Li Jiang, China, 3–5 December 2010; pp. 366–369.
  8. Dhou, S.; Motai, Y. Scale-Invariant Tracking Predictor Using a Pan-Tilt-Zoom Camera. Robotica 2015. [Google Scholar] [CrossRef]
  9. Lin, D.-T.; Huang, K.-Y. Collaborative Pedestrian Tracking and Data Fusion with Multiple Cameras. IEEE Trans. Inf. Forensics Secur. 2011, 6, 1432–1444. [Google Scholar] [CrossRef]
  10. Han, J.; Pauwels, E.J.; de Zeeuw, P.M.; de With, P.H.N. Employing a RGB-D Sensor for Real-Time Tracking of Humans across Multiple Re-Entries in a Smart Environment. IEEE Trans. Consum. Electron. 2012, 58, 255–263. [Google Scholar]
  11. Alberto, I.; Sergio, R.; de Lopez, A.J.; Aritz, V. Location, tracking and identification with RFID and vision data fusion. In Proceedings of the European Workshop on Smart Objects: Systems, Technologies, and Applications (RFID Sys Tech 2010), Ciudad, Spain, 15–16 June 2010; pp. 1–6.
  12. Mori, T.; Suemasu, Y.; Noguchi, H.; Sato, T. Multiple people tracking by integrating distributed floor pressure sensors and RFID system. In Proceedings of the IEEE International Conference on Systems, Man, and Cybernetics, San Diego, CA, USA, 10–13 October 2004; Volume 6, pp. 5271–5278.
  13. Shrivastava, N.; Mudumbai, R.; Madhow, U.; Suri, S. Target tracking with binary proximity sensors. ACM Trans. Sens. Netw. 2009, 5, 1–33. [Google Scholar] [CrossRef]
  14. Honda, S.; Fukui, K.; Moriyama, K.; Kurihara, S.; Numao, M. Extracting human behaviors with infrared sensor network. In Proceedings of the Fourth International Conference on Networked Sensing Systems (INSS ’07), Braunschweig, Germany, 6–8 June 2007; pp. 122–125.
  15. Watanabe, Y.; Kurihara, S.; Sugawara, T. Sensor network topology estimation using time-series data from infrared human presence sensors. In Proceedings of the IEEE Sensors 2010, Kona, HI, USA, 1 November 2010; pp. 664–667.
  16. Byunghun, S.; Haksoo, C.; Hyung, S.L. Surveillance tracking system using passive infrared motion sensors in wireless sensor network. In Proceedings of the International Conference on Information Networking 2008 (ICOIN2008), Busan, Korea, 23–25 January 2008; pp. 1–5.
  17. Wang, Z.; Bulut, E.; Szymanski, E.K. Distributed target tracking with directional binary sensor networks. In Proceedings of the IEEE Global Telecommunications Conference 2009 (GLOBECOM 2009), Honolulu, HI, USA, 30 November–4 December 2009; pp. 1–6.
  18. Hao, Q.; Hu, F.; Xiao, Y. Multiple human tracking and identification with wireless distributed pyroelectric sensor systems. IEEE Syst. J. 2009, 3, 428–439. [Google Scholar] [CrossRef]
  19. Nithya, V.S.; Sheshadri, K.; Kumar, A.; Hari, K.V.S. Model based target tracking in a wireless network of passive infrared sensor nodes. In Proceedings of the 2010 International Conference on Signal Processing and Communications (SPCOM2010), Bangalore, India, 18–21 July 2010; pp. 1–5.
  20. Luo, X.; Shen, B.; Guo, X.; Luo, G.; Wang, G. Human tracking using ceiling pyroelectric infrared sensors. In Proceedings of the IEEE International Conference on Control and Automation 2009 (ICCA 2009), Kunming, China, 9–11 December 2009; pp. 1716–1721.
  21. Panasonic MP Motion Sensor NaPiOn. Available online: http://www3.panasonic.biz/ac/e/control/sensor/human/napion/index.jsp (accessed on 22 May, 2015).
  22. Kasama, Y.; Miyazaki, T. Simultaneous estimation of the number of humans and their movement loci in a room using infrared sensors. In Proceedings of the IEEE 26th International Conference on Advanced Information Networking and Applications Workshops (WAINA2012), Fukuoka, Japan, 26–29 March 2012; pp. 508–513.
  23. Miyazaki, T.; Kasama, Y. Estimation of the number of humans and their movement paths in a room using binary infrared sensors. In Proceedings of the ACM International Conference on Ubiquitous Information Management and Communication (ICUIMC2012), Kuala Lumpur, Malaysia, 20–23 February 2012.
  24. Kasama, Y.; Miyazaki, T. Movement path estimation for multiple humans in a room using binary infrared sensors. In Proceedings of the IEEE 27th International Conference on Information Networking (ICOIN2013), Bangkok, Thailand, 27–30 January 2013; pp. 42–47.
  25. Panasonic Infrared Array Sensor Grid-EYE. Available online: https://industrial.panasonic.com/ww/products/sensors/built-in-sensors/grid-eye (accessed on 22 May, 2015).
  26. Ward, J.H., Jr. Hierarchical grouping to optimize an objective function. J. Am. Stat. Assoc. 1963, 58, 236–244. [Google Scholar] [CrossRef]
  27. Hao, Q.; Brady, D.J.; Guenther, B.D.; Burchett, J.B.; Shankar, M.; Feller, S. Human Tracking With Wireless Distributed Pyroelectric Sensors. IEEE Sens. J. 2006, 6, 1683–1696. [Google Scholar] [CrossRef]

