Gait Event Detection on Level Ground and Incline Walking Using a Rate Gyroscope

Abstract
:
1. Introduction
2. Method
2.1. Subjects
2.2. Protocol
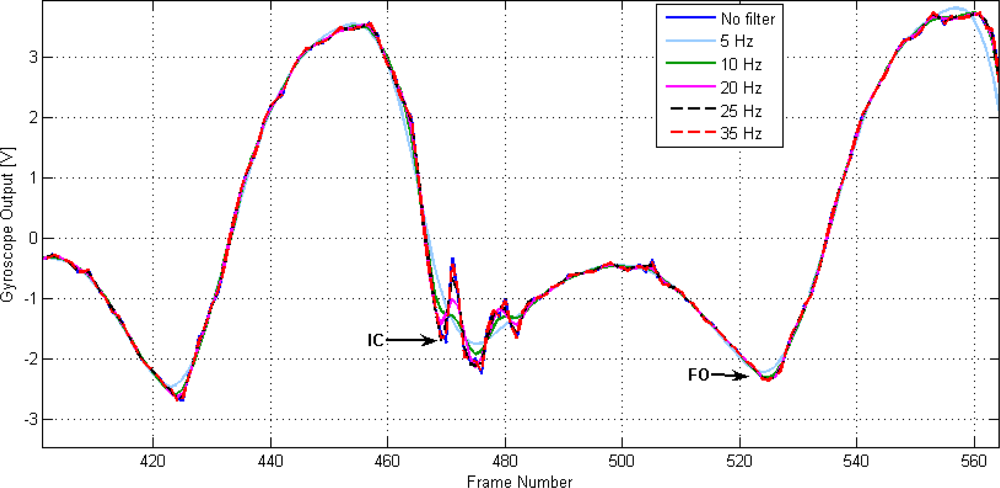
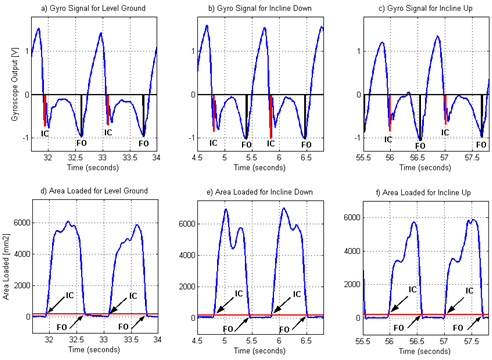
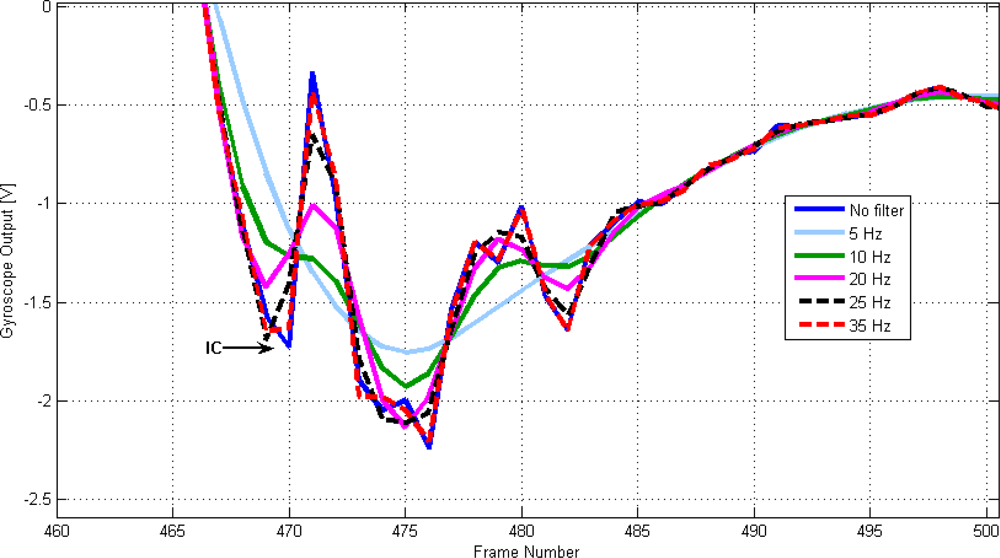
2.3. Gyroscope Data
2.4. Reference Systems
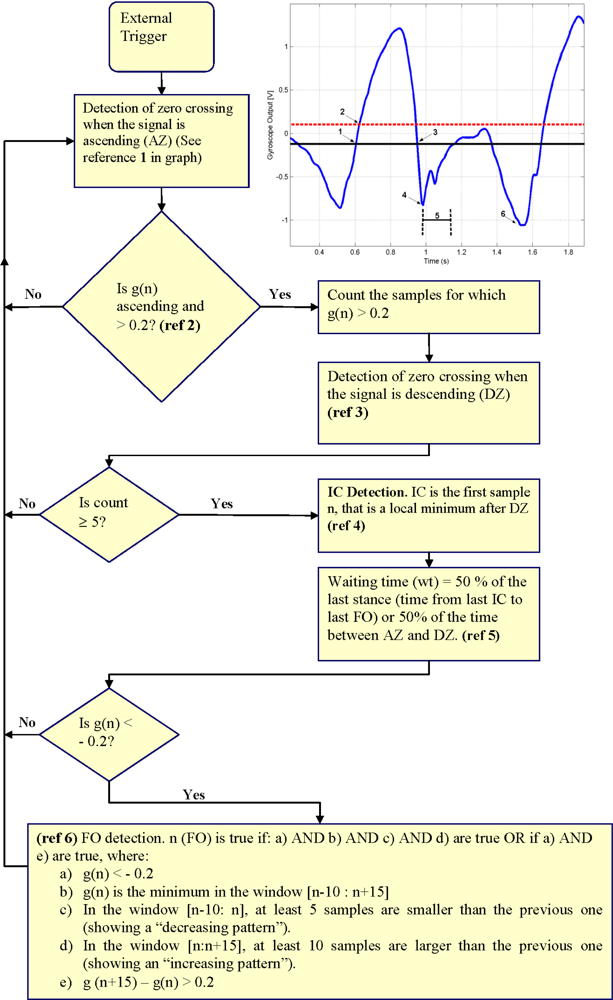
2.5. Data Analysis
- s is the estimated standard deviation
- n is the number of measures used to calculate the mean
- t1–α/2 is the “Student’s t”, its value depends on the probability level chosen and on the degrees of freedom upon which s is based [37].
3. Results and Discussion
3.1. Mean Differences
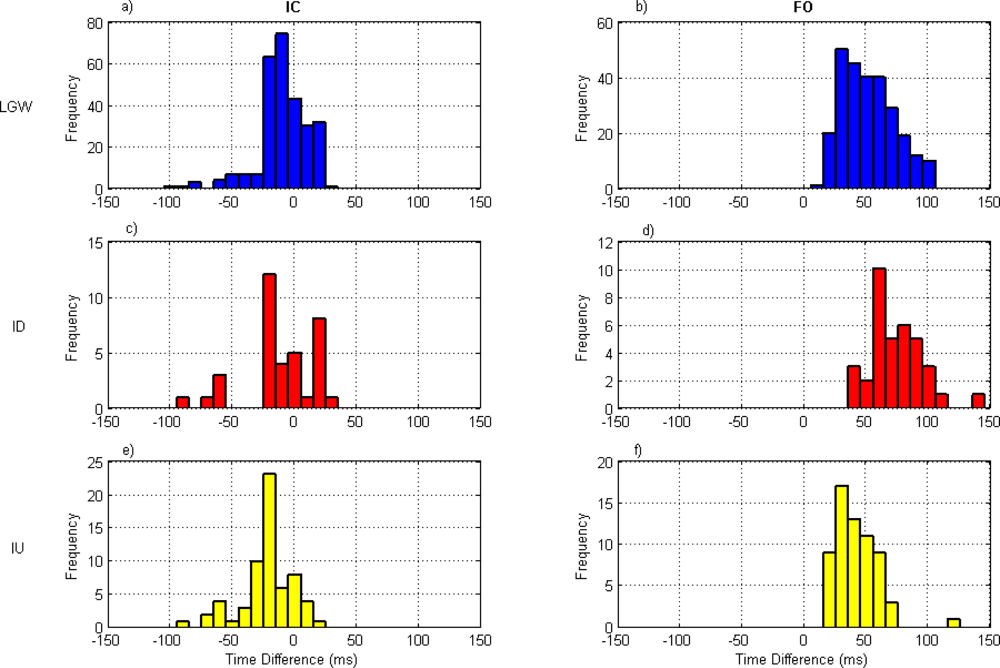
3.2. Distribution of the Differences
3.3. Reliability
3.4. Final Considerations
4. Conclusions
Acknowledgments
References
- Hansen, M.; Haugland, M.K.; Sepulveda, F. Feasibility of Using Peroneal Nerve Recordings for Deriving Stimulation Timing in a Foot Drop Correction System. Neuromodulation 2003, 6, 68–77. [Google Scholar]
- Jasiewicz, J.M.; Allum, J.H.J.; Middleton, J.W.; Barriskill, A.; Condie, P.; Purcell, B.; Li, R.C.T. Gait Event Detection Using Linear Accelerometers or Angular Velocity Transducers in Able-Bodied and Spinal-Cord Injured Individuals. Gait Posture 2006, 24, 502–509. [Google Scholar]
- Hreljac, A.; Marshall, R.N. Algorithms to Determine Event Timing During Normal Walking Using Kinematic Data. J. Biomech 2000, 33, 783–786. [Google Scholar]
- Peham, C.; Scheidl, M.; Licka, T. Limb Locomotion-Speed Distribution Analysis as a New Method for Stance Phase Detection. J. Biomech 1999, 32, 1119–1124. [Google Scholar]
- Desailly, E.; Daniel, Y.; Sardain, P.; Lacouture, P. Foot Contact Event Detection Using Kinematic Data in Cerebral Palsy Children and Normal Adults Gait. Gait Posture 2009, 29, 76–80. [Google Scholar]
- Ghoussayni, S.N.; Stevens, C.H.H.; Durham, S.; Ewins, D.J. Assessment and Validation of a Simple Automated Method for the Detection of Gait Events and Intervals. Gait Posture 2003, 20, 266–272. [Google Scholar]
- Roerdink, M.; Coolen, B.; Clairbois, B.E.; Lamoth, C.J.C.; Beek, P.J. Online Gait Event Detection Using a Large Force Platform Embedded in a Treadmill. J. Biomech 2008, 41, 2628–2632. [Google Scholar]
- Maffiuletti, N.A.; Gorelick, M.; Kramers-de Quervain, I.; Bizzini, M.; Munzinger, J.P.; Tomasetti, S.; Stacoff, A. Concurrent Validity and Intrasession Reliability of the IDEEA Accelerometry System for the Quantification of Spatiotemporal Gait Parameters. Gait Posture 2008, 27, 160–163. [Google Scholar]
- Sabatini, A.M.; Martelloni, C.; Scapellato, S.; Cavallo, F. Assessment of Walking Features from Foot Inertial Sensing. IEEE Trans. Biomed. Eng 2005, 52, 486–494. [Google Scholar]
- Findlow, A.; Goulermas, J.Y.; Nester, C.; Howard, D.; Kenney, L.P.J. Predicting Lower Limb Joint Kinematics Using Wearable Motion Sensors. Gait Posture 2008, 28, 120–126. [Google Scholar]
- O’Donovan, K.J.; Kamnik, R.; O’Keeffe, D.T.; Lyons, G.M. An Inertial and Magnetic Sensor Based Technique for Joint Angle Measurement. J. Biomech 2007, 40, 2604–2611. [Google Scholar]
- Simcox, S.; Parker, S.; Davis, G.M.; Smith, R.W.; Middleton, J.W. Performance of Orientation Sensor for Use With A Functional Electrical Stimulation Mobility System. J. Biomech 2005, 38, 1185–1190. [Google Scholar]
- Mayagoitia, R.; Nene, A.; Veltink, P.H. Accelerometer and Rate Gyroscope Measurement of Kinematics: An Inexpensive Alternative to Optical Motion Analysis Systems. J. Biomech 2002, 35, 537–542. [Google Scholar]
- Dai, R.; Stein, R.B.; Andrews, B.J.; James, K.B.; Wieler, M. Application of Tilt Sensors in Functional Electrical Stimulation. IEEE Trans. Rehabil. Eng 1996, 4, 63–72. [Google Scholar]
- Williamson, R.; Andrews, B. Sensor Systems for Lower Limb Functional Electrical Stimulation (FES) Control. Med. Eng. Phys 2000, 22, 313–325. [Google Scholar]
- Selles, R.; Formanoy, M.A.G.; Bussmann, J.B.J.; Janssens, P.J.; Stam, H.J. Automated Estimation of Initial and Terminal Contact Timing Using Accelerometers; Development and Validation in Transtibial Amputees and Controls. IEEE Trans. Neural Syst. Rehabil. Eng 2005, 13, 81–88. [Google Scholar]
- Hanlon, M.; Anderson, R. Real-Time Gait Event Detection Using Wearable Sensors. Gait Posture 2009, 30, 523–527. [Google Scholar]
- Aminian, K.; Najafi, B.; Bula, C.; Leyvraz, P.F.; Roberts, P. Spatio-Temporal Parameters of Gait Measured by an Ambulatory System Using Miniature Gyroscopes. J. Biomech 2002, 35, 689–699. [Google Scholar]
- Ghoussayni, S.N. Application of Angular Rate Gyroscopes as Sensors In Electrical Orthoses for Foot Drop Correction, PhD Thesis,; University of Surrey: Guildford, UK, 2004. Available online: https://ethos.bl.uk (accessed on 14 March 2010).
- Miyazaki, S. Long-Term Unrestrained Measurement of Stride Length and Walking Velocity Utilizing a Piezoelectric Gyroscope. IEEE. Trans. Biomed. Eng 1997, 44, 753–759. [Google Scholar]
- Paraschiv-Ionescu, A.; Buchser, E.E.; Rutschmann, B.; Najafi, B.; Aminian, K. Ambulatory System for the Quantitative and Qualitative Analysis of Gait and Posture in Chronic Pain Patients Treated With Spinal Cord Stimulation. Gait Posture 2004, 20, 113–125. [Google Scholar]
- Tuncel, O.; Altun, K.; Barshan, B. Classifying Human Leg Motions with Uniaxial Piezoelectric Gyroscopes. Sensors 2009, 9, 8508–8546. [Google Scholar]
- Moser, D.; Ewins, D. A Control System for a Lower Limb Prosthesis or Orthosis. Worldwide Patent 2006/024876 A2,. 2006. [Google Scholar]
- Tong, K.; Granat, M.H. Virtual Artificial Sensor Technique for Functional Electrical Stimulation. Med. Eng. Phys 1998, 20, 458–468. [Google Scholar]
- Wu, G. A Review of Body Segmental Displacement, Velocity and Acceleration in Human Gait. In Gait Analysis Theory and Application; Craik, R.L., Oatis, C.A., Eds.; Mosby: St Louis, MO, USA, 1995; pp. 205–222. [Google Scholar]
- Aminian, K.; Trevisan, C.; Najafi, B.; Dejnabadi, H.; Frigo, C.; Pavan, E.; Telonio, A.; Cerati, F.; Marinoni, E.C.; Robert, P.; Leyvraz, P.F. Evaluation of an Ambulatory System for Gait Analysis in Hip Osteoarthritis and after Total Hip Replacement. Gait Posture 2004, 20, 102–107. [Google Scholar]
- Salarian, A.; Russmann, H.; Vingerhoets, F.J.G.; Dehollian, C.; Blanc, Y.; Burkhard, P.; Aminian, K. Gait Assessment in Parkinson’s Disease: Toward an Ambulatory System for Long-Term Monitoring. IEEE Trans. Biomed. Eng 2004, 51, 1434–1443. [Google Scholar]
- Ghoussayni, S.N.; Henty, J.R.; Wood, D.E.; Ewins, D.J. An Experimental Evaluation of the Gyroscope as a Sensor in FES Foot-Drop Correction Systems. Proceedings of the 7th Vienna International Workshop on Functional Electrical Stimulation, Vienna, Austria, September 12–15, 2001; pp. 200–203.
- Lay, A.N.; Hass, C.J.; Gregor, R.J. The Effects of Sloped Surfaces on Locomotion: A Kinematic And Kinetic Analysis. J. Biomech 2006, 39, 1621–1628. [Google Scholar]
- Prentice, S.D.; Hasler, E.N.; Groves, J.J.; Frank, J.S. Locomotor Adaptations for Changes in the Slope of the Walking Surface. Gait Posture 2004, 20, 255–265. [Google Scholar]
- Kuster, M.; Sakurai, S.; Wood, G.A. Kinematic and Kinetic Comparison of Downhill and Level Walking. Clin. Biomech 1995, 10, 79–84. [Google Scholar]
- Henty, J. Detection of Gait Events Using a Gyroscope Sensor in FES Drop Foot Correction, PhD Thesis,; University of Surrey: Guildford, UK, 2003. Available online: https://ethos.bl.uk. (accessed on 15 March 2010).
- Tong, K.; Granat, M.H. A Practical Gait Analysis System Using Gyroscopes. Med. Eng. Phys 1999, 21, 87–94. [Google Scholar]
- Nene, A.; Mayagoitia, R.; Veltink, P.H. Assesment of Rectus Femoris Function During Initial Swing Phase. Gait Posture 1999, 9, 1–9. [Google Scholar]
- Ghoussayni, S.N. Use of the Angular Rate Gyroscope as a Sensor for FES Droop Foot Correction; Master Thesis,; University of Surrey: Guildford, UK, 2000. [Google Scholar]
- Catalfamo, P.; Moser, D.; Ghoussayni, S.N.; Ewins, D.J. Detection of Gait Events Using an F-Scan in-Shoe Pressure Measurement System. Gait Posture 2008, 28, 420–426. [Google Scholar]
- Taylor, J.K.; Cihon, C. Statistical Techniques for Data Analysis, 2nd ed; Chapman and Hall: Boca Raton, FL, USA, 2004. [Google Scholar]
- Smith, B.T.; Coiro, D.J.; Finson, R.; Betz, R.R.; McCarthy, J. Evaluation of Force-Sensing Resistors for Gait Event Detection to Trigger Electrical Stimulation to Improve Walking in the Child with Cerebral Palsy. IEEE Trans. Neural Syst. Reh. Eng 2002, 10, 22–29. [Google Scholar]
- Redfern, M.S.; Di Pasquale, J. Biomechanics of Descending Ramps. Gait Posture 1997, 6, 119–125. [Google Scholar]
- Stoquart, G.; Detrembleur, C.; Lejeune, T. Effect of Speed on Kinematic, Kinetic, Electromyographic and Energetic Reference Values during Treadmill Walking. Neurophysiol. Clin 2008, 38, 105–116. [Google Scholar]
- Oberg, T.; Karsznia, A.; Oberg, K. Joint Angle Parameters in Gait: Reference Data for Normal Subjects, 10–79 Years of Age. J. Rehabil. Res. Develop 1994, 31, 199–213. [Google Scholar]
- Stolze, H.; Kuhtz-Buschbeck, J.P.; Mondwurf, C.; Boczek-Funcke, A.; Jöhnk, K.; Deuschl, G.; Illert, M. Gait Analysis During Treadmill and Overground Locomotion in Children and Adults. Electroencephalogr. Motor Control 1997, 105, 490–497. [Google Scholar]
- Strathy, G.M.; Chao, E.Y.; Laughman, R.K. Changes in Knee Function Associated with Treadmill Ambulation. J. Biomech 1983, 16, 517–522. [Google Scholar]
- Alton, F.; Baldey, L.; Caplan, S.; Morrissey, M.C. A Kinematic Comparison of Overground and Treadmill Walking. Clin. Biomech 1998, 13, 434–440. [Google Scholar]
- Riley, P.O.; Paolini, G.; Della Croce, U.; Paylo, K.W.; Kerrigan, D.C. A Kinematic and Kinetic Comparison of Overground and Treadmill Walking in Healthy Subjects. Gait Posture 2007, 26, 17–24. [Google Scholar]
- Parvataneni, K.; Ploeg, L.; Olney, S.J.; Brouwer, B. Kinematic, Kinetic and Metabolic Parameters of Treadmill versus Overground Walking in Healthy Older Adults. Clin. Biomech 2009, 24, 95–100. [Google Scholar]
- Taylor, P.N.; Burridge, J.H.; Dunkerley, A.L.; Lamb, A.; Wood, D.E.; Norton, J.A.; Swain, I.D. Patients’ Perception of the Odstock Dropped Foot Stimulator (ODFS). Clin. Rehabil 1999, 13, 439–446. [Google Scholar]
- Mansfield, A.; Lyons, G.M. The Use of Accelerometry to Detect Heel Contact Events for Use as a Sensor in FES Assisted Walking. Med. Eng. Phys 2003, 25, 879–885. [Google Scholar]
- Monaghan, C.C.; Veltink, P.H.; Bultstra, G.; Droog, E.; Kotiadis, D.; Van Riel, W. Control of Triceps Surae Stimulation Based on Shank Orientation Using a Uniaxial Gyroscope. Proceedings of the 9th Annual Conference of the International FES Society, Bournemouth, UK, September 2004; pp. 413–415.
- Pappas, I.P.I.; Popovic, M.R.; Keller, T.; Dietz, V.; Morari, M. A Reliable Gait Phase Detection System. IEEE Trans. Neural Syst. Reh. Eng 2001, 9, 113–125. [Google Scholar]
- Ott, E.; Munih, M.; Benko, H.; Kralj, A. Comparison of Foot Switch and Hand Switch Triggered FES Correction of Foot Drop. Proceedings of the 6th Vienna International Workshop on Functional Electrical Stimulation, Vienna, Austria, September 22–24, 1998; pp. 193–196.


| IC | 5 Hz | 10 Hz | 12 Hz | 15 Hz | 20 Hz | 25 Hz | 30 Hz | 35 Hz | 40 Hz |
|---|---|---|---|---|---|---|---|---|---|
| Unimpaired | 60.3 ± 34.3 | 26.5 ± 25.0 | 15.6 ± 20.0 | 12.0 ± 17.7 | 5.6 ± 7.0 | 4.7 ± 6.1 | 2.9 ± 4.6 | 2.3 ± 4.3 | 0.6 ± 2.4 |
| CP | 11.3 ± 5.2 | 3.3 ± 4.9 | 2.5 ± 4.6 | 3.3 ± 0.6 | 3.3 ± 0.6 | 3.3 ± 0.6 | 2.7 ± 0.6 | 4.0 ± 0.9 | 0 ± 0 |
| FO | 5 Hz | 10 Hz | 12 Hz | 15 Hz | 20 Hz | 25 Hz | 30 Hz | 35 Hz | 40 Hz |
|---|---|---|---|---|---|---|---|---|---|
| Unimpaired | 10.9 ± 8.2 | 5.6 ± 6.2 | 4.1 ± 4.9 | 3.7 ± 5.5 | 2.5 ± 4.4 | 2.2 ± 4.2 | 1.8 ± 4.0 | 1.8 ± 4.7 | 2.2 ± 6.6 |
| CP | 4.6 ± 6.6 | 3.8 ± 5.0 | 3.8 ± 5.0 | 3.8 ± 5.0 | 3.1 ± 0.5 | 2.3 ± 4.3 | 1.5 ± 3.7 | 2.3 ± 4.4 | 2.3 ± 6.0 |
| Level Ground Walking | Incline Down Walking | Incline Up Walking | |||||||
|---|---|---|---|---|---|---|---|---|---|
| AMD | MD | CI | AMD | MD | CI | AMD | MD | CI | |
| IC | 15 ± 6 | −8 ± 9 | [−16; 1] | 20 ± 11 | −9 ± 20 | [−29;12] | 24 ± 12 | −21 ± 15 | [−35; −8] |
| FO | 50 ± 14 | 50 ± 14 | [37; 63] | 73 ± 12 | 73 ± 12 | [60; 85] | 43 ± 10 | 43 ± 10 | [34; 52] |
© 2010 by the authors; licensee MDPI, Basel, Switzerland. This article is an open access article distributed under the terms and conditions of the Creative Commons Attribution license (http://creativecommons.org/licenses/by/3.0/).
Share and Cite
Catalfamo, P.; Ghoussayni, S.; Ewins, D. Gait Event Detection on Level Ground and Incline Walking Using a Rate Gyroscope. Sensors 2010, 10, 5683-5702. https://doi.org/10.3390/s100605683
Catalfamo P, Ghoussayni S, Ewins D. Gait Event Detection on Level Ground and Incline Walking Using a Rate Gyroscope. Sensors. 2010; 10(6):5683-5702. https://doi.org/10.3390/s100605683
Chicago/Turabian StyleCatalfamo, Paola, Salim Ghoussayni, and David Ewins. 2010. "Gait Event Detection on Level Ground and Incline Walking Using a Rate Gyroscope" Sensors 10, no. 6: 5683-5702. https://doi.org/10.3390/s100605683