Optical Fiber Sensing Based on Reflection Laser Spectroscopy


Abstract
:1. Introduction
2. Strain and Temperature Sensing
2.1. Bragg Gratings in Highly-Birefringent (HiBi) Fibers
2.2. Fiber Bragg-Grating Resonators
3. Acceleration Measurements by FBG Strain Sensors
4. Application of Fiber Optic Sensing to Recordings of Musical Instruments
4.1. Single FBG Transducer
4.2. FBG Cavity Transducer
5. Chemical Sensing by Optical-Fiber Ring Resonators
6. Conclusions
Acknowledgments
References and Notes
- Kersey, A.D. A Review of Recent Developments in Fiber Optic Sensor Technology. Opt. Fiber Technol 1996, 2, 291–317. [Google Scholar]
- In Fiber Optic Sensors; Yu, F.T.S.; Yin, S. (Eds.) Marcel Dekker, Inc: New York, NY, USA, 2002; p. 449.
- Rao, Y.J. In-Fibre Bragg Grating Sensors. Meas. Sci. Technol 1997, 8, 355–375. [Google Scholar]
- Xu, M.G.; Geiger, H.; Dakin, J.P. Interrogation of Fiberoptic in Interferometric Sensors Using Acoustooptic Tunable Filter. Electron. Lett 1995, 31, 1487–1488. [Google Scholar]
- Lissak, B.; Arie, A.; Tur, M. Highly Sensitive Dynamic Strain Measurements by Locking Lasers to Fiber Bragg Gratings. Opt. Lett 1998, 23, 1930–1932. [Google Scholar]
- Chow, J.H.; McClelland, D.E.; Gray, M.B.; Littler, I.C.M. Demonstration of a Passive Subpicostrain Fiber Strain Sensor. Opt. Lett 2005, 30, 1923–1925. [Google Scholar]
- Gagliardi, G.; Salza, M.; Ferraro, P.; De Natale, P. Interrogation of FBG-Based Strain Sensors by Means of Laser Radio-Frequency Modulation Techniques. J. Opt. A-Pure Appl. Opt 2006, 8, S507–S513. [Google Scholar]
- Pipino, A.C.R. Ultrasensitive Surface Spectroscopy with a Miniature Optical Resonator. Phys. Rev. Lett 1999, 83, 3093–3096. [Google Scholar]
- Tong, Z.G.; Wright, A.; McCormick, T.; Li, R.K.; Oleschuk, R.D.; Loock, H.P. Phase-Shift Fiber-Loop Ring-Down Spectroscopy. Anal. Chem 2004, 76, 6594–6599. [Google Scholar]
- Tong, Z.G.; Jakubinek, M.; Wright, A.; Gillies, A.; Loock, H.P. Fiber-Loop Ring-Down Spectroscopy: A Sensitive Absorption Technique for Small Liquid Samples. Rev. Sci. Instrum 2003, 74, 4818–4826. [Google Scholar]
- Koo, K.P.; Kersey, A.D. Bragg Grating-Based Laser Sensors Systems with Interferometric Interrogation and Wavelength-Division Multiplexing. J. Lightwave Technol 1995, 13, 1243–1249. [Google Scholar]
- Littler, I.C.M.; Gray, M.B.; Chow, J.H.; Shaddock, D.A.; McClelland, D.E. Pico-Strain Multiplexed Fiber Optic Sensor Array Operating Down to Infra-Sonic Frequencies. Opt. Express 2009, 17, 11077–11087. [Google Scholar]
- Oh, S.T.; Han, W.T.; Paek, U.C.; Chung, Y. Discrimination of Temperature and Strain with a Single Fbg Based on the Birefringence Effect. Opt. Express 2004, 12, 724–729. [Google Scholar]
- Salza, M.; Gagliardi, G.; Di Maio, A.; Ferraro, P.; De Natale, P.; Chehura, E.; Tatam, R.P. Laser-Frequency Locking Techniques for High-Sensitivity Strain Measurements by High-Birefringence Fiber Bragg Gratings and Resonators. Proceedings of the SPIE, San Diego, CA, USA; 2007; pp. 661–915. [Google Scholar]
- Gagliardi, G.; Salza, M.; Ferraro, P.; De Natale, P. Fiber Bragg-Grating Strain Sensor Interrogation Using Laser Radio-Frequency Modulation. Opt. Express 2005, 13, 2377–2384. [Google Scholar]
- Drever, R.W.P.; Hall, J.L.; Kowalski, F.V.; Hough, J.; Ford, G.M.; Munley, A.J.; Ward, H. Laser Phase and Frequency Stabilization Using an Optical Resonator. Appl. Phys. B 1983, 31, 97–105. [Google Scholar]
- Chehura, E.; Ye, C.C.; Staines, S.E.; James, S.W.; Tatam, R.P. Characterization of the Response of Fibre Bragg Gratings Fabricated in Stress and Geometrically Induced High Birefringence Fibres to Temperature and Transverse Load. Smart Mater. Struct 2004, 13, 888–895. [Google Scholar]
- Hansch, T.W.; Couillaud, B. Laser Frequency Stabilization by Polarization Spectroscopy of a Reflecting Reference Cavity. Opt. Commun 1980, 35, 441–444. [Google Scholar]
- Erdogan, T.; Mizrahi, V. Characterization of UV-Induced Birefringence in Photosensitive Ge-Doped Silica Optical Fibers. J. Opt. Soc. Am. B 1994, 11, 2100–2105. [Google Scholar]
- Dossou, K.; LaRochelle, S.; Fontaine, M. Numerical Analysis of the Contribution of the Transverse Asymmetry in the Photo-Induced Index Change Profile to the Birefringence of Optical Fiber. J. Lightwave Technol 2002, 20, 1463–1470. [Google Scholar]
- Gagliardi, G.; De Nicola, S.; Ferraro, P.; De Natale, P. Interrogation of Fiber Bragg-Grating Resonators by Polarization-Spectroscopy Laser-Frequency Locking. Opt. Express 2007, 15, 3715–3728. [Google Scholar]
- Berkoff, T.A.; Kersey, A.D. Experimental Demonstration of a Fiber Bragg Grating Accelerometer. IEEE Photon. Technol. Lett 1996, 8, 1677–1679. [Google Scholar]
- Todd, M.D.; Johnson, G.A.; Althouse, B.A.; Vohra, S.T. Flexural Beam-Based Fiber Bragg Grating Accelerometers. IEEE Photon. Technol. Lett 1998, 10, 1605–1607. [Google Scholar]
- Gagliardi, G.; Salza, M.; Ferraro, P.; De Natale, P.; Di Maio, A.; Carlino, S.; De Natale, G.; Boschi, E. Design and Test of a Laser-Based Optical-Fiber Bragg-Grating Accelerometer for Seismic Applications. Meas. Sci. Technol 2008, 19, 085306. [Google Scholar]
- Gagliardi, G.; Salza, M.; Lam, T.T.-Y.; Chow, J.H.; De Natale, P. 3-Axis Accelerometer Based on Lasers Locked to Π–Shifted Fibre Bragg Gratings. Proceedings of The 20th International Conference on Optical Fibre Sensors, Edinburgh Conference Centre, Scotland, UK, October 2009.
- Canning, J.; Sceats, M.G. Pi-Phase-Shifted Periodic Distributed Structures in Optical Fibers by Uv Post-Processing. Electron. Lett 1994, 30, 1344–1345. [Google Scholar]
- Wieman, C.E.; Hollberg, L. Using Diode-Lasers for Atomic Physics. Rev. Sci. Instrum 1991, 62, 1–20. [Google Scholar]
- Chow, J.H.; Littler, I.C.M.; McClelland, D.E.; Gray, M.B. Laser Frequency-Noise-Limited Ultrahigh Resolution Remote Fiber Sensing. Opt. Express 2006, 14, 4617–4624. [Google Scholar]
- Loock, H.P.; Hopkins, W.S.; Morris-Blair, C.; Resendes, R.; Saari, J.; Trefiak, N.R. Recording the Sound of Musical Instruments with Fbgs: The Photonic Pickup. Appl. Optics 2009, 48, 2735–2741. [Google Scholar]
- Seitz, W.R. Chemical Sensors Based on Fiber Optics. Anal. Chem 1984, 56, A16. [Google Scholar]
- Seitz, W.R. New Directions in Fiber Optic Chemical Sensors—Sensors Based on Polymer Swelling. J. Mol. Struct 1993, 292, 105–113. [Google Scholar]
- Wolfbeis, O.S. Fiber-Optic Chemical Sensors and Biosensors. Anal. Chem 2006, 78, 3859–3873. [Google Scholar]
- Seitz, W.R. Chemical Sensors Based on Immobilized Indicators and Fiber Optics. Crit. Rev. Anal. Chem 1988, 19, 135–173. [Google Scholar]
- Wolfbeis, O.S. Fiber Optic Probes for Determining Enzyme-Activities. Select. Electr. Rev 1988, 10, 41. [Google Scholar]
- Caron, S.; Pare, C.; Paradis, P.; Trudeau, J.M.; Fougeres, A. Distributed Fibre Optics Polarimetric Chemical Sensor. Meas. Sci. Technol 2006, 17, 1075–1081. [Google Scholar]
- von Lerber, T.; Sigrist, M.W. Cavity-Ring-Down Principle for Fiber-Optic Resonators: Experimental Realization of Bending Loss and Evanescent-Field Sensing. Appl. Optics 2002, 41, 3567–3575. [Google Scholar]
- Zhou, K.M.; Chen, X.F.; Zhang, L.; Bennion, I. Implementation of Optical Chemsensors Based on Hf-Etched Fibre Bragg Grating Structures. Meas. Sci. Technol 2006, 17, 1140–1145. [Google Scholar]
- Golnabi, H.; Bahar, M.; Razani, M.; Abrishami, M.; Asadpour, A. Design and Operation of an Evanescent Optical Fiber Sensor. Opt. Laser Eng 2007, 45, 12–18. [Google Scholar]
- Pipino, A.C.R.; Woodward, J.T.; Meuse, C.W.; Silin, V. Surface-Plasmon-Resonance-Enhanced Cavity Ring-Down Detection. J. Chem. Phys 2004, 120, 1585–1593. [Google Scholar]
- Ma, L.; Katagiri, T.; Matsuura, Y. Surface-Plasmon Resonance Sensor Using Silica-Core Bragg Fiber. Opt. Lett 2009, 34, 1069–1071. [Google Scholar]
- Sai, V.V.R.; Kundu, T.; Mukherji, S. Novel U-Bent Fiber Optic Probe for Localized Surface Plasmon Resonance Based Biosensor. Biosens. Bioelectron 2009, 24, 2804–2809. [Google Scholar]
- Spackova, B.; Piliarik, M.; Kvasnicka, P.; Themistos, C.; Rajarajan, M.; Homola, J. Novel Concept of Multi-Channel Fiber Optic Surface Plasmon Resonance Sensor. Sensors and Actuators B-Chemical 2009, 139, 199–203. [Google Scholar]
- Gupta, M.; Jiao, H.; O'Keefe, A. Cavity-Enhanced Spectroscopy in Optical Fibers. Opt. Lett 2002, 27, 1878–1880. [Google Scholar]
- Loock, H.P. Ring-Down Absorption Spectroscopy for Analytical Microdevices. Trac-Trend Anal. Chem 2006, 25, 655–664. [Google Scholar]
- Pu, S.A.; Gu, X.J. Fiber Loop Ring-Down Spectroscopy with a Long-Period Grating Cavity. Opt. Lett 2009, 34, 1774–1776. [Google Scholar]
- Arnold, S.; Khoshsima, M.; Teraoka, I.; Holler, S.; Vollmer, F. Shift of Whispering-Gallery Modes in Microspheres by Protein Adsorption. Opt. Lett 2003, 28, 272–274. [Google Scholar]
- Armani, A.M.; Vahala, K.J. Heavy Water Detection Using Ultra-High-Q Microcavities. Opt. Lett 2006, 31, 1896–1898. [Google Scholar]
- Vollmer, F.; Arnold, S. Whispering-Gallery-Mode Biosensing: Label-Free Detection Down to Single Molecules. Nat. Methods 2008, 5, 591–596. [Google Scholar]
- Barnes, J.; Carver, B.; Fraser, J.M.; Gagliardi, G.; Loock, H.P.; Tian, Z.; Wilson, M.W.B.; Yam, S.; Yastrubshak, O. Loss Determination in Microsphere Resonators by Phase-Shift Cavity Ring-Down Measurements. Opt. Express 2008, 16, 13158–13167. [Google Scholar]
- Stokes, L.F.; Chodorow, M.; Shaw, H.J. All-Single-Mode Fiber Resonator. Opt. Lett 1982, 7, 288–290. [Google Scholar]

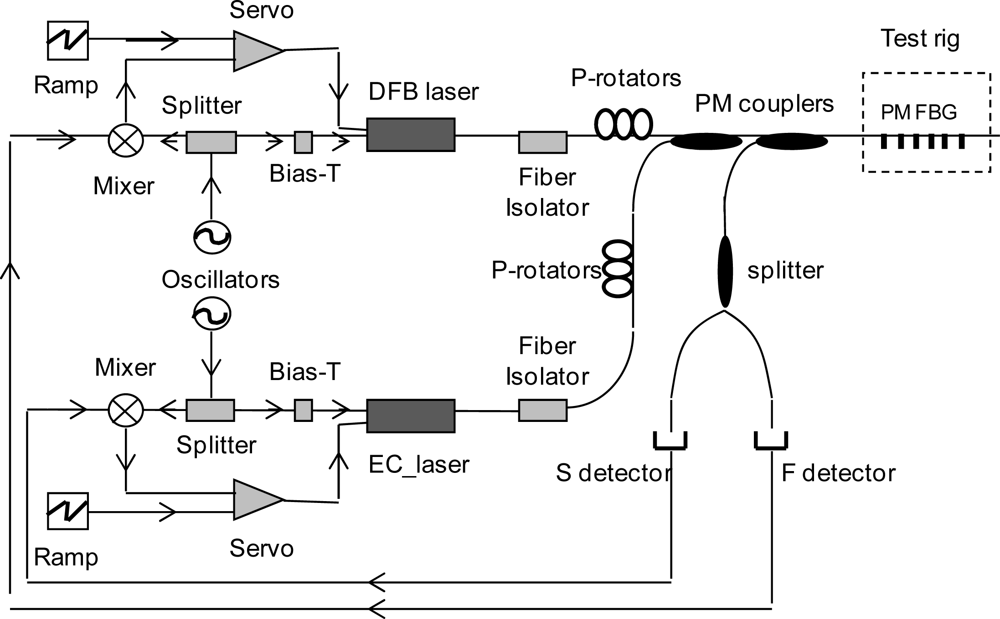
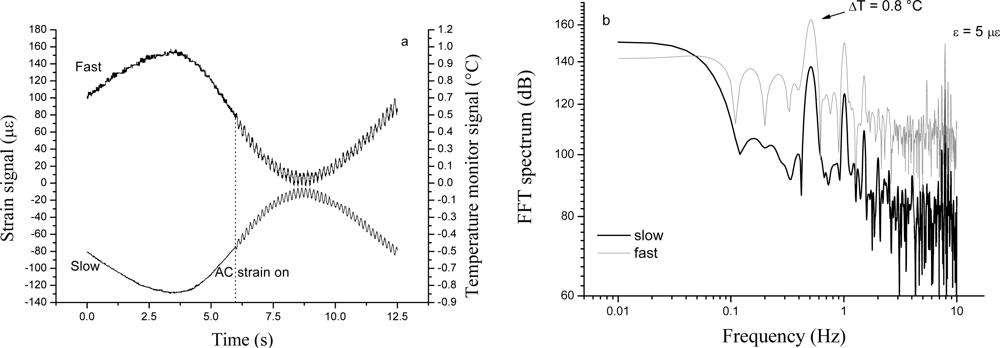
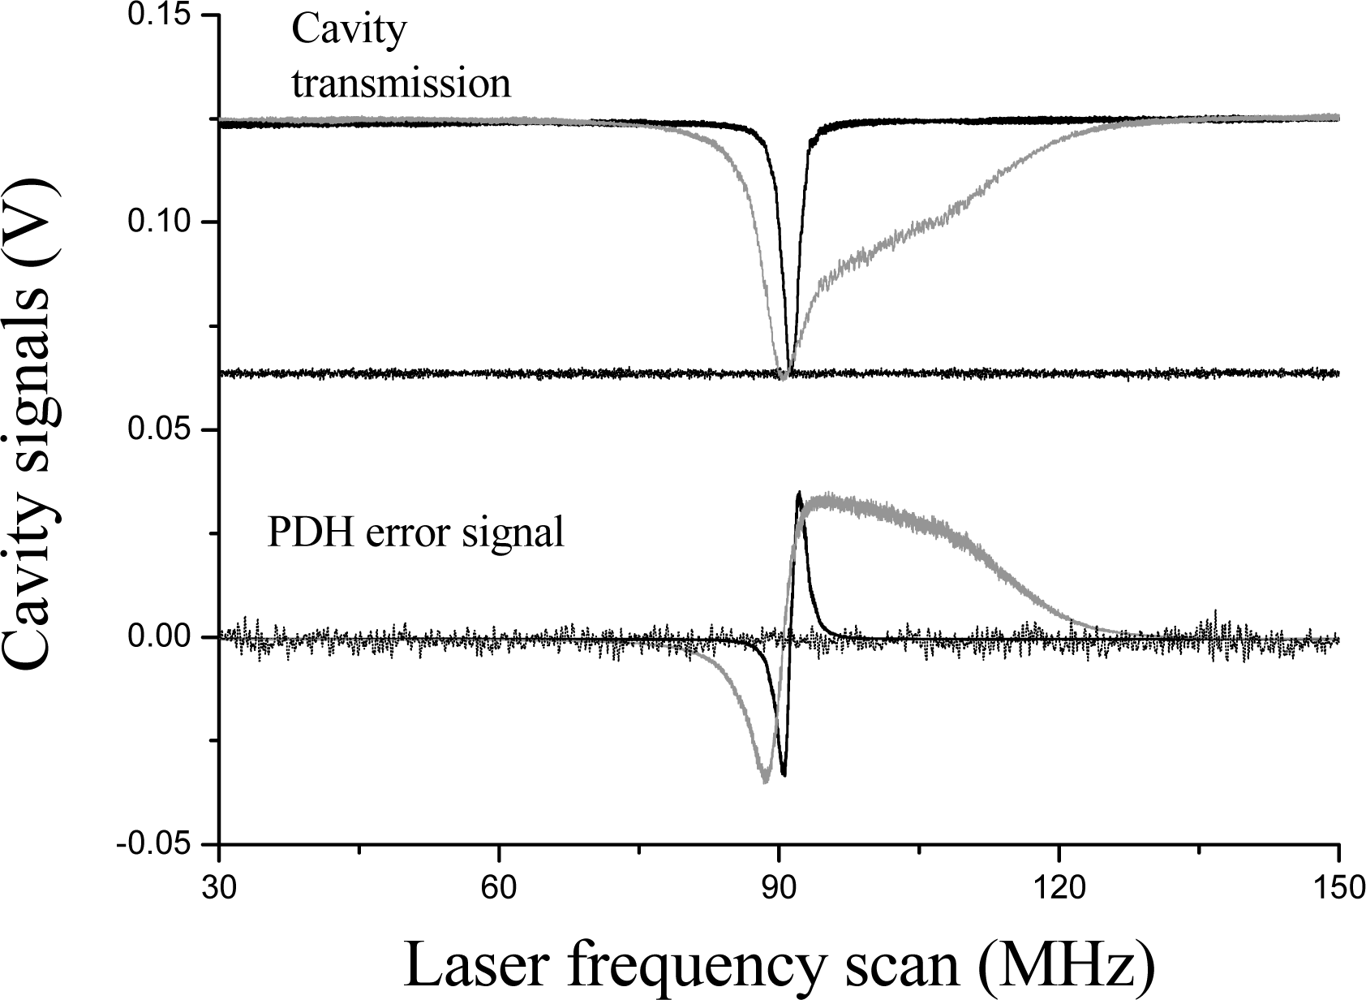
 (grey), Fast and ▴ (black), Slow axes.
(grey), Fast and ▴ (black), Slow axes.
(grey), Fast and ▴ (black), Slow axes.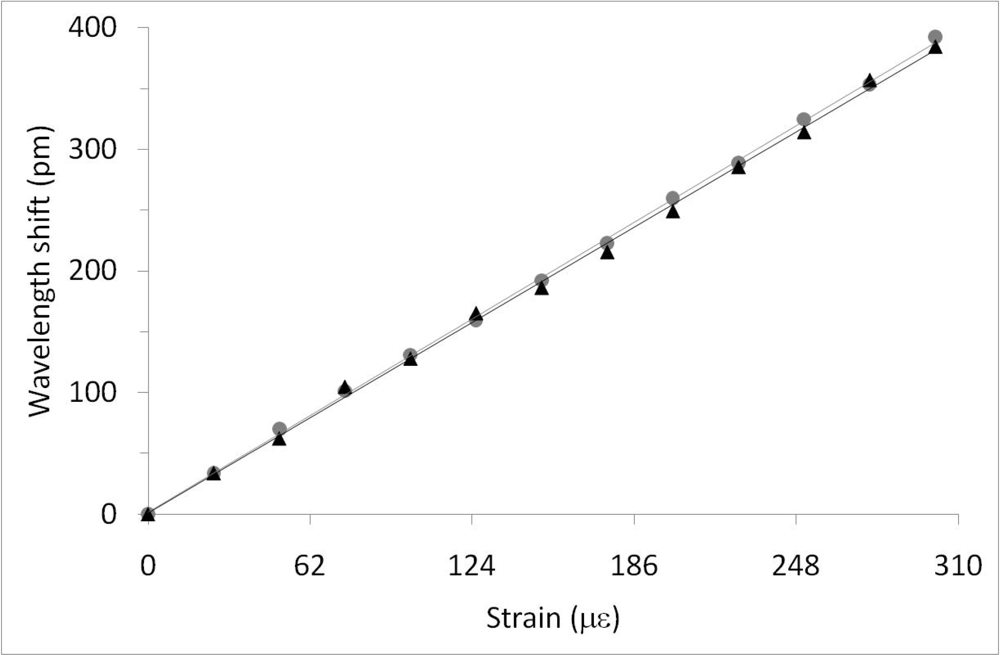 (grey), Fast and ▴ (black), Slow axes.
(grey), Fast and ▴ (black), Slow axes.
(grey), Fast and ▴ (black), Slow axes.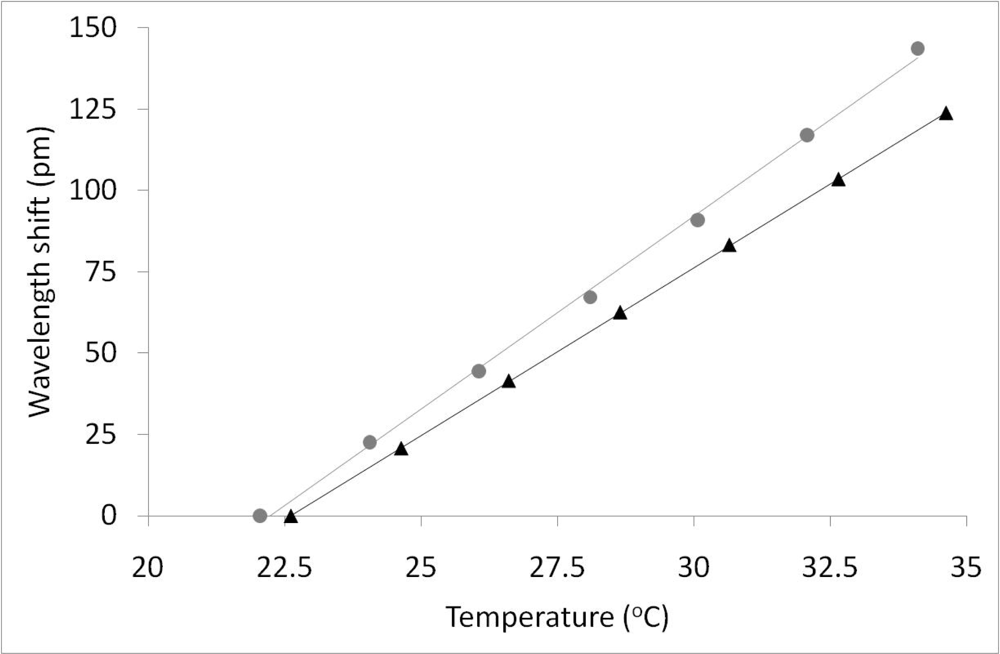


© 2010 by the authors; licensee Molecular Diversity Preservation International, Basel, Switzerland. This article is an open access article distributed under the terms and conditions of the Creative Commons Attribution license (http://creativecommons.org/licenses/by/3.0/).
Share and Cite
Gagliardi, G.; Salza, M.; Ferraro, P.; Chehura, E.; Tatam, R.P.; Gangopadhyay, T.K.; Ballard, N.; Paz-Soldan, D.; Barnes, J.A.; Loock, H.-P.; et al. Optical Fiber Sensing Based on Reflection Laser Spectroscopy. Sensors 2010, 10, 1823-1845. https://doi.org/10.3390/s100301823
Gagliardi G, Salza M, Ferraro P, Chehura E, Tatam RP, Gangopadhyay TK, Ballard N, Paz-Soldan D, Barnes JA, Loock H-P, et al. Optical Fiber Sensing Based on Reflection Laser Spectroscopy. Sensors. 2010; 10(3):1823-1845. https://doi.org/10.3390/s100301823
Chicago/Turabian StyleGagliardi, Gianluca, Mario Salza, Pietro Ferraro, Edmond Chehura, Ralph P. Tatam, Tarun K. Gangopadhyay, Nicholas Ballard, Daniel Paz-Soldan, Jack A. Barnes, Hans-Peter Loock, and et al. 2010. "Optical Fiber Sensing Based on Reflection Laser Spectroscopy" Sensors 10, no. 3: 1823-1845. https://doi.org/10.3390/s100301823
APA StyleGagliardi, G., Salza, M., Ferraro, P., Chehura, E., Tatam, R. P., Gangopadhyay, T. K., Ballard, N., Paz-Soldan, D., Barnes, J. A., Loock, H.-P., Lam, T. T.-Y., Chow, J. H., & De Natale, P. (2010). Optical Fiber Sensing Based on Reflection Laser Spectroscopy. Sensors, 10(3), 1823-1845. https://doi.org/10.3390/s100301823