Article

Are the Genes nadA and norB Involved in Formation of Aflatoxin G1?

Southern Regional Research Center, 1100 Robert E. Lee Blvd, P.O. Box 19687, New Orleans, LA 70179, USA
*
Authors to whom correspondence should be addressed.
Int. J. Mol. Sci. 2008, 9(9), 1717-1729; https://doi.org/10.3390/ijms9091717
Submission received: 6 August 2008 / Revised: 26 August 2008 / Accepted: 4 September 2008 / Published: 9 September 2008

Abstract

:
Aflatoxins, the most toxic and carcinogenic family of fungal secondary metabolites, are frequent contaminants of foods intended for human consumption. Previous studies showed that formation of G-group aflatoxins (AFs) from O-methylsterigmatocystin (OMST) by certain Aspergillus species involves oxidation by the cytochrome P450 monooxygenases, OrdA (AflQ) and CypA (AflU). However, some of the steps in the conversion have not yet been fully defined. Extracts of Aspergillus parasiticus disruption mutants of the OYE-FMN binding domain reductase-encoding gene nadA (aflY) contained a 386 Da AFG1 precursor. A compound with this mass was predicted as the product of sequential OrdA and CypA oxidation of OMST. Increased amounts of a 362 Da alcohol, the presumptive product of NadA reduction, accumulate in extracts of fungi with disrupted aryl alcohol dehydrogenase-encoding gene norB. These results show that biosynthesis of AFG1 involves NadA reduction and NorB oxidation.

1. Introduction

Aflatoxins (AFs) are Aspergillus secondary metabolites that are highly toxic to certain animal species, in particular, birds and fish, and are potent carcinogens [4]. A. flavus produces only B-group AFs while A. parasiticus, A. nomius, and several other species produce both B- and G-group AFs (AFB1, AFB2, AFG1, AFG2) [1]. AF biosynthesis requires the expression of at least 28 clustered genes [17]. The roles in biosynthesis of some of the genes have not yet been defined. Although structurally, G-group AFs differ from those of the B-group by having an extra oxygen atom in the A-ring, the conversion requires a number of steps. The initial step in the conversion of O-methylsterigmatocystin (OMST) to AFs is oxidation by the cytochrome P450 monooxygenase, OrdA (AflQ) [16]. The G-group AFs are not formed directly by oxidation of B-group AFs but instead require oxidation by the cytochrome P450 monooxygenase, CypA (AflU), of an intermediate common to both types of AFs (Figure 1) [9].
11-HydroxyOMST (HOMST) was proven to be a precursor of AFB1 [13] and is the expected product from OrdA-catalyzed oxidization of the A-ring of OMST (Figure 1). Because expression of ordA in yeast enabled the yeast to convert OMST to AFB1, it was assumed that OrdA also catalyzes the oxidation of HOMST. This oxidation is expected to produce a 370 Da intermediate 1 or 2 (Scheme 1) which was presumed to rearrange non-enzymatically to AFB1. CypA oxidation of the 370 Da intermediate would produce a 386 Da AFG1 precursor, 3.
In A. flavus, portions of cypA and the neighboring gene, norB (aflF), which encodes a putative aryl alcohol dehydrogenase, are deleted [7]. Loss of the ability to produce G-group AFs in A. flavus is due to the cypA mutation [7]. The role of norB in AF biosynthesis is unknown. Whether or not oxidation by CypA is sufficient to produce G-group AFs is unclear since the substrate for CypA has not been isolated. Formation of AFG1 following cytochrome P450-catalyzed oxidation requires hydration, ring-cleavage, rearrangement, cyclization, dehydration, and O-methyl cleavage. At least some of these steps are likely to be enzyme-catalyzed.
Recently we embarked on a study to assign functions to the remaining uncharacterized genes in the AF biosynthesis pathway. Among these is nadA, which, based on microarray studies, belongs to the AF biosynthesis gene cluster [11] rather than to an adjoining sugar utilization gene cluster as originally proposed [15]. This gene is predicted to encode an OYE (old yellow enzyme) FMN-binding domain (NCBI conserved domain database, cd04733) reductase. While this work was underway, Cai et al [3] showed that nadA encodes an enzyme that is involved in formation of AFG1 and isolated an intermediate with mass 360 Da from nadA mutant cultures. They describe this compound as the immediate AFG1 precursor [3]. We now provide evidence that nadA mutants initially accumulate a 386 Da compound, the probable CypA oxidation product. Additionally, we provide evidence that NorB is responsible for the final oxidation step in AFG1 formation.

2. Results

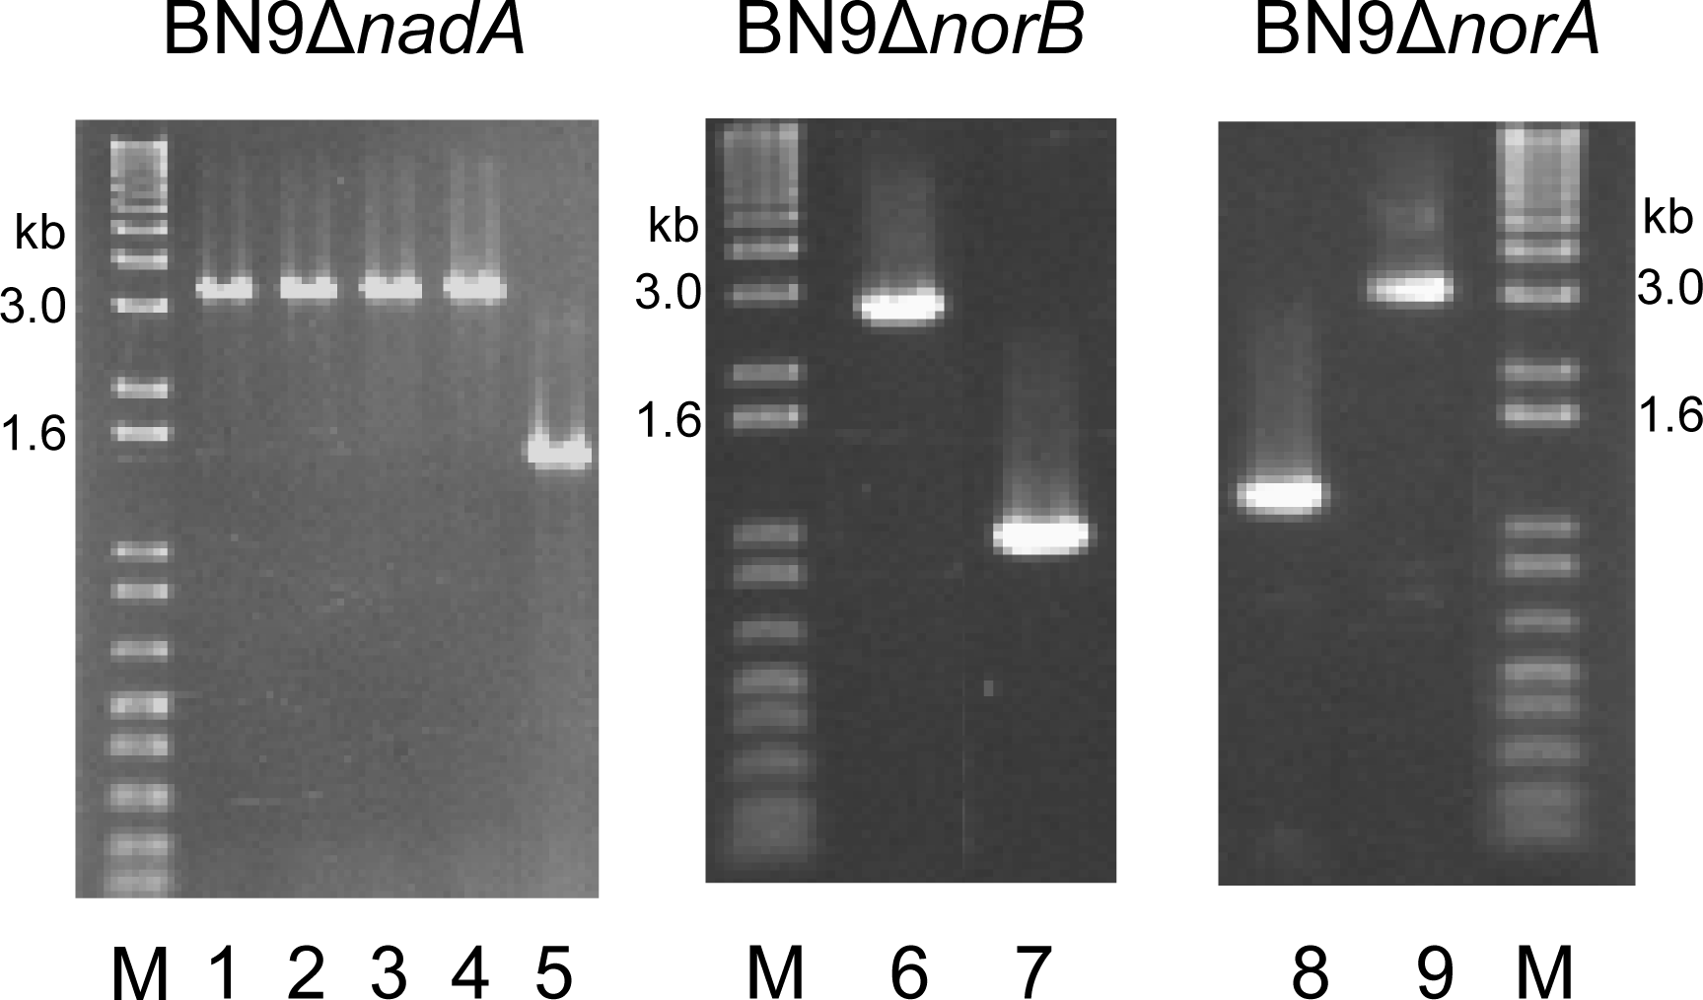
2.1. Production of gene disruptants

Disruption of nadA, norA or norB was achieved by transformation of A. parasiticus BN9Δku70 with the insert portion of plasmid constructs in which the A. oryzae pyrithiamine reductase gene, ptr, displaced part of the coding region of each gene (see Experimental Section). At least ten colonies were obtained from each transformation experiment. Correct insertion of the disrupted gene by homologous recombination was checked by PCR with either the outer oligonucleotide 5′- and 3′-primers chosen for plasmid construction (norAK/H and norBK/H oligonucleotides) or with primers internal to the DNA portion used for construct preparation (nadA). Formation of a 3.5 kb PCR product compared to a 1.5 kb for the wild-type confirmed that the 2.0 kb ptr selection marker was inserted correctly in the nadA transformants (Figure 1, lanes 1–5).
norB and norA disruptants were checked similarly for the correct insertion (Figure 1, lanes 6–7 and 8–9, respectively) and, in these cases, a 3.0 kb band indicated correct insertion, while a 1.2 kb band indicated the intact gene. The frequency of transformants with correctly targeted insertion was higher than 80%.

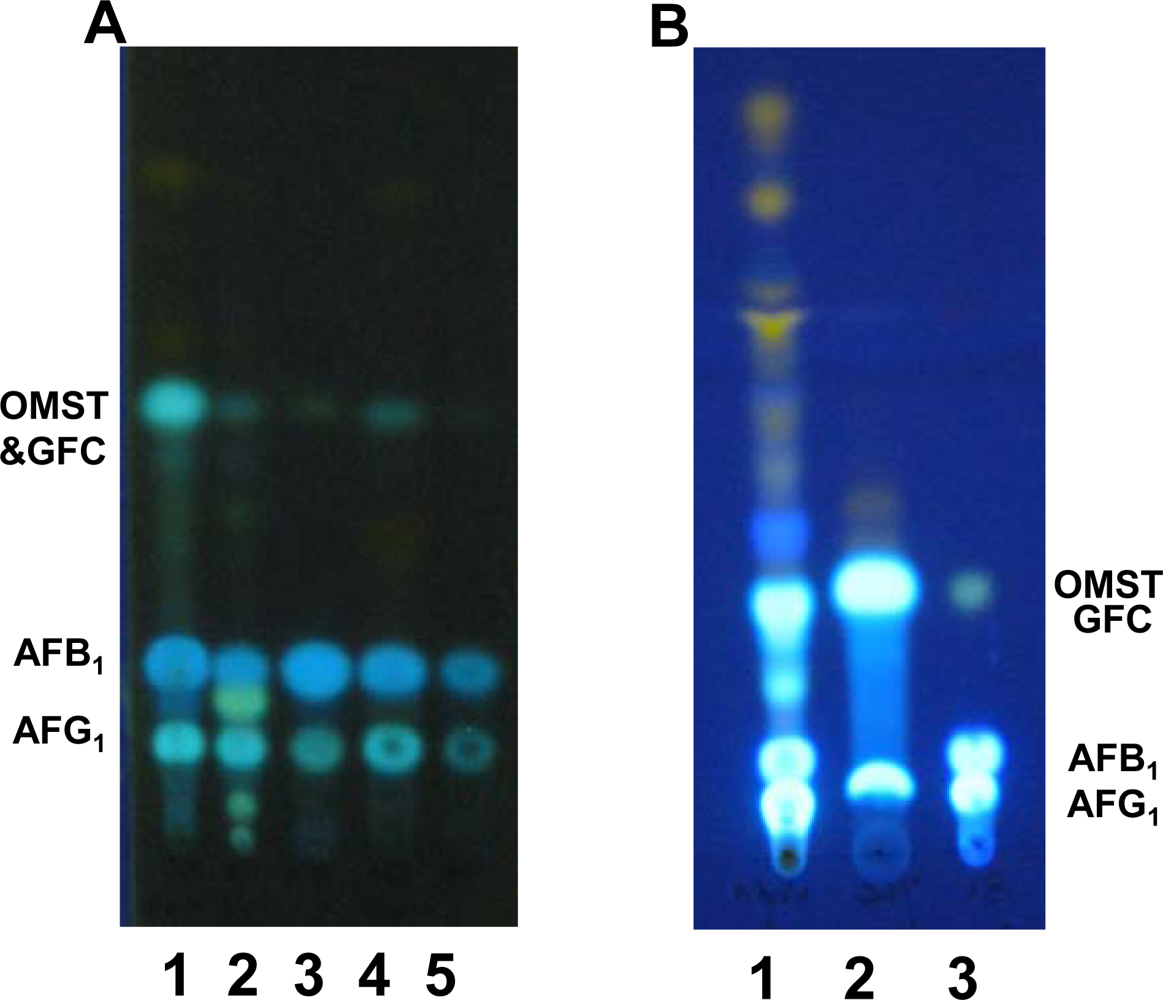
2.2. TLC analyses of extracts of BN9ΔnadA, BN9ΔnorA and BN9ΔnorB

A greenish-blue fluorescent compound (GFC) was present in acetone extracts of nadA disruptant cultures but not in the parental culture. Upon TLC the GFC almost co-migrated with OMST (Rf 0.38) (Figure 2A, lane 1). When the GFC was completely separated from AFG1 by preparative TLC, a small amount of AFG1 still appeared in the product mixture (Figure 2B, lane 2). Colonies of BN9ΔnorB produced several compounds that appeared as greenish-blue fluorescent bands on TLC (Figure 2A, lane 2) that were not found in the untransformed strain (Figure 2A, lane 5). Extracts of cultures of BN9ΔnorA accumulated slightly elevated amounts of OMST and several reddish-brown compounds compared to the control.

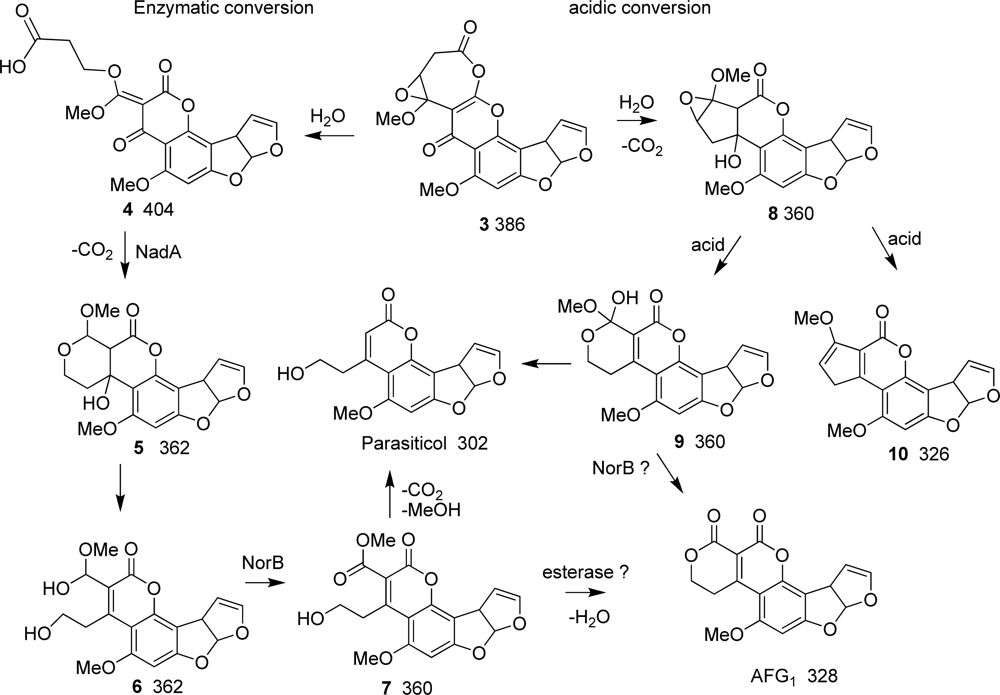
2.3. LC/MS analysis of transformant extracts

LC/MS analysis was done on extracts from BN9ΔnadA, BN9ΔnorB, BN9ΔnorA, and the BN9 control cultures. Based on the relative peak heights in the LC profiles, the ratio of LC fraction peaks with retention times and mass to charge ratios (m/z) expected for AFB1 (m/z 313, 4.5 min) and AFG1(m/z 329, 4.3 min) was 1.4 for the BN9ΔnadA extract, 4.0 for the BN9ΔnorB extract, 0.8 for the BN9ΔnorA extract, and 0.9 for the BN9 control strain extract (Table 1).
Metabolites with ion peaks m/z 387 and 355 were found in the BN9ΔnadA (clone 6) extract (Table 1A) that were not present in the BN9 control extract (Table 1E). In the unpurified BN9ΔnadA extract, the compound with the m/z 387 ion eluted at 5.3 min in the LC profile and the m/z 355 ion eluted at 4.3 min. Under these LC conditions, authentic HOMST (m/z 355) eluted at 4.3 min. The Rf 0.38 TLC-purified material from the BN9ΔnadA extract contained two compounds with the m/z 387 ion peak, one eluting at 4.1 min and the other at 5.4 min (Table 1B). Compounds in the BN9ΔnadA TLC-purified material with ion peaks at m/z 329 and 339 co-eluted with standards of AFG1 and OMST at 4.3 min and 5.0 min, respectively. MSn analysis of the main 387 (5.4 min) ion peak in the BN9ΔnadA extract revealed an ion tree with daughter ions at m/z 329, 311, 283 and 243. A repeat LC/MS analysis (not shown in Table 1) using a shallower acetonitrile/formic acid gradient instead of a steeper acetonitrile/trifluoroacetic acid gradient revealed the presence of a compound with a prominent ion peak at m/z 361 with a retention time of 13.9 min. The m/z 387 ion was not found. The retention time of the 360 Da compound was slightly later than AFB1 (13.7 min) and the compound had a chromophore in its UV spectrum with λmax = 340 nm.

2.4. LC/MS analysis of BN9ΔnorA and BN9ΔnorB transformant extracts

The BN9ΔnorB (clone 19) extract differed from the control extract in that it had prominent m/z 363 and 355 ion peaks at 3.7 min and 4.2 min, respectively. The BN9ΔnorA extract had an LC/MS profile nearly identical to that of the BN9 control (Table 1D). In agreement with the TLC results, ion peaks at the expected retention times and masses for AFB1, and AFG1 were present in all of the unpurified extracts; a peak with the expected retention time and mass for HOMST was detected in the extracts from the BN9ΔnadA and BN9ΔnorB cultures. The repeat LC/MS of the BN9ΔnorB extract revealed the presence of compounds with prominent ion peaks at m/z 303 (12.9 min, λmax, 330 nm), 327 (13.9 min, λmax, 368 nm), and 359 (14.2 min, λmax, 370 nm). Under these LC conditions HOMST, AFB1, AFG1, and OMST eluted at 12.4, 12.9, 13.8, and 15.9 min, respectively.

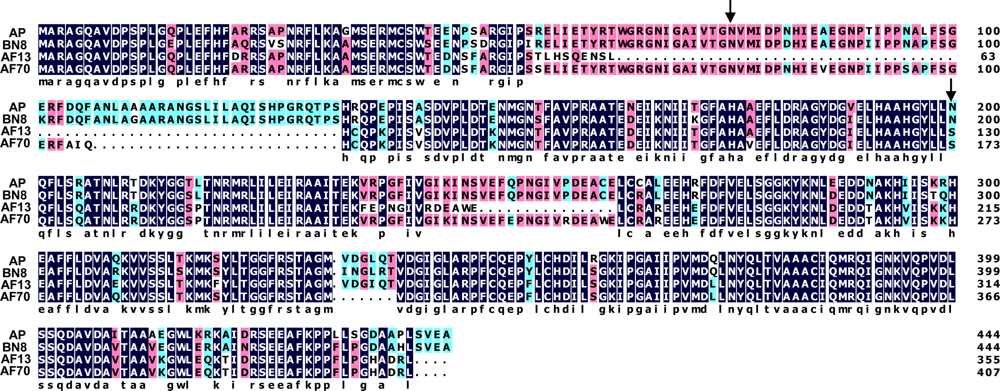
2.5. Comparsion of NadA in A. parasiticus and A. flavus
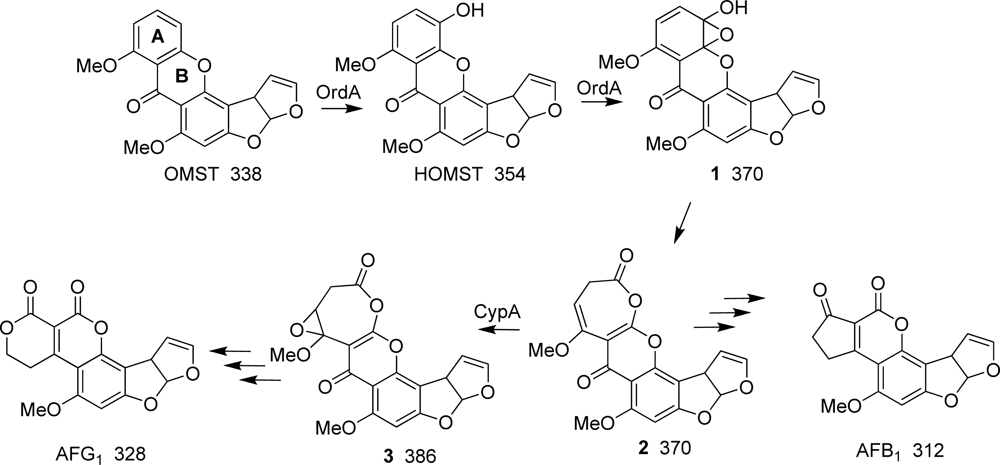
A 444 amino acid protein and a coding sequence with a single intron are predicted for nadA in A. parasiticus SU-1 and BN008 isolates based on an analysis using the Softberry FGENESH coding sequence finder software for Aspergillus genes. However, the coding sequence for nadA from S-strain A. flavus AF70 (GenBank accession number AY510453) is predicted to have two introns and to encode a 407 aa protein while the coding sequence for nadA in L-strain A. flavus AF13 (GenBank accession number AY510451) is predicted to have 5 introns and to encode a 355 aa protein (Figure 3). BLASTp analysis showed that all of the predicted proteins possess a conserved OYE-FMN reductase family domain. In the deduced sequences of the A. flavus proteins, a glutamine that may be necessary for catalytic activity is missing [2]. The predicted AF13 NadA sequence differs substantially in other regions as well.

3. Discussion

A. parasiticus nadA disruptants accumulate a 386 Da greenish-blue-fluorescent (GFC) metabolite that is not found in strains with the intact gene. A compound with this molecular weight is consistent with the predicted lactone (3, Scheme 1) or one or more of its isomeric forms (not shown) created by sequential addition to HOMST (354 Da) of two oxygen atoms by the cytochrome P450 monooxygenases, OrdA and CypA (Scheme 1) [7, 13]. This is the first report providing experimental evidence for the presence of this compound in A. parasiticus extracts. The TLC and LC/MS results suggest that this compound readily loses CO2 non-enzymatically and rearranges to AFG1. The ion tree of the 386 Da compound revealed by MSn analysis indicates that this compound fragments with loss of a m/z 58 ion (CO2 and CH2) or a m/z 72 ion (CO2 and CH3OH), a pattern consistent with its identification as an AFG1 precursor.
In addition to the 386 Da compound, AFB1, AFG1, HOMST and OMST (Table 1) accumulate in the nadA knockout culture as determined by comparison of retention times and UV chromophores to those of control samples. This is the first report that HOMST, a proven substrate for OrdA-catalyzed conversion to AFB1 [13], is present in metabolite extracts of A. parasiticus cultures. The extracts from the A. parasiticus BN9 control and BN9ΔnadA and BN9ΔnorB cultures also contain a compound with a prominent m/z 371 ion. Based on its mass and LC retention time relative to that of AFB1 this compound is most likely the predicted oxidation product of OMST [13] and the precursor 2 of both AFB1 and AFG1 as shown in Scheme 1. Although norsolorinic acid, an early metabolite in AF biosynthesis, also has a positive ion MS peak at m/z 371, it has a markedly different retention time under these conditions on LC (7.3 min for norsolorinic acid vs. 3.7 min for the 370 Da metabolite).
Sequence analyses indicate that A. parasiticus NadA has a conserved domain (cd04733; http://www.ncbi.nlm.nih.gov/Structure/cdd/cddsrv.cgi?uid=cd04733) characteristic of old yellow enzyme (OYE)-related FMN binding domain reductases [14]. Proteins with such domains are predicted to use NADPH to reduce the carbon-carbon double bond of α,β-unsaturated-aldehydes or ketones [8]. A. parasiticus NadA was found to contain amino acids predicted for such reductases. These include amino acids His-195 and Asn-200 involved in binding the oxygen atom of the substrate, and Tyr-197 required for proton transfer to the β-carbon atom of the α,β-unsaturated ketone to complete the reduction initiated by hydride transfer from the N-5 atom of flavin mononucleotide.
Based on predicted intron assignments for nadA from the two types of A. flavus, the proteins for NadA would differ considerably from those predicted for A. parasiticus and an isolate of the A. parasiticus-like species, BN008 [15] (Figure 3). Such differences are unexpected since the sequences and intron assignments of the other AF biosynthesis genes are the same among the different AF-producing species [15]. Furthermore, the conserved Asn-76 thought to be involved in flavin-binding is missing and the catalytic Asn-200 is replaced by a Ser in A. flavus NadA. These amino acid changes are expected to decrease or prevent enzyme activity [8]. Transcripts of nadA have been identified in A. flavus, but no studies have been done to show if a functional enzyme is encoded by these transcripts. The predicted sequence of A. flavus AF13 NadA also is missing other portions of the coding sequence that also may contain critical amino acid residues (Figure 3). Based on these sequence differences, we predict that NadA from A. flavus AF13 (L strain) and possibly from AF70 (S strain) is not functional. To form AFB1 in A. flavus a reduction step may also be involved (Ehrlich et al unpublished results), but NadA is unlikely to play a role. Another reducing agent, possibly Nor-1 the reductase involved in conversion of norsolorinic acid to averantin in the first AF bioconversion step, may be involved in formation of AFB1 in A. flavus.
A 360 Da intermediate (7, 8 or 9 in Scheme 2) was obtained from a repeat analysis of a BN9ΔnadA extract. This compound may be the same as that partially characterized by Cai et al. [6] in a similar nadA knockout culture from A. parasiticus. However, because NadA is an OYE FMN-domain reductase, it is unlikely to catalyze the oxidation of the 360 Da intermediate to AFG1. A necessary step in the conversion of 8 to the alcohol 9 involves epoxide ring-opening. NadA-catalyzed reduction may facilitate the subsequent epoxide ring-opening and rearrangement of the vinylogous ester 4 shown in Scheme 2. In the absence of NadA, ring-opening and rearrangement may occur only when the 386 Da metabolite is exposed to the acidic conditions of the culture medium during the extraction process, a possibility that could explain the apparent ability of nadA mutants to form AFG1 in the absence of enzyme.
A. parasiticus BN9ΔnorB cultures accumulate 362 and 326 Da yellowish-green fluorescent metabolites in addition to HOMST, OMST and AFs, but they do not accumulate the 386 Da metabolite. The presence of these metabolites is consistent with the proposition that NorB catalyzes an oxidation step after NadA reduction. In the scheme in Scheme 2, the 362 Da rearrangement product (5 or 6) may be oxidized by NorB to produce an ester (7), which could be enzymatically de-esterified by numerous fungal esterases. This product upon dehydration would yield AFG1. Oxidation of the alcohol 6 to form 7 is consistent with the presumed enzymatic capability of NorB. Although both norA and norB are predicted to encode similar NAD+ or NADP+-dependent alcohol dehydrogenases, A. parasiticus transformants lacking functional NorA showed essentially no change in their abilities to produce AFs compared to a control culture. Therefore, NorA presumably is unable to completely complement the activity of NorB. In the absence of NorB the epoxide ring could undergo an alternative acid-catalyzed ring-opening to give a diol that, upon dehydration, gives the methyl ether of AFB1 10.
Based on its predicted activity and its involvement after NadA in AFG1 formation, we suggest that NorB catalyzes the biosynthesis step after the rearrangement and decarboxylation of the NadA-reduced 386 Da intermediate. Upon repeat LC/MS three additional compounds with M+H ions at m/z 303, 327, and 359 were detected that were not found in the control culture extract. The chromophores of these compounds are consistent with derailment products resulting from non-enzymatic breakdown of one or more of the precursor metabolites upon prolonged storage. The 303 ion is most likely to be parasiticol (302 Da), a compound often found in aged cultures of extracts containing AFG1 [12]. Parasiticol could be a degradation product of the alcohol 7 after losses of CO2 and MeOH. The m/z 327 ion indicates a compound resulting from net loss of an oxygen atom and CO2 from the 386 Da lactone 3 or an oxygen atom and water from either of the 360 Da intermediates, 7 or 8. The m/z 359 in the repeat LC/MS analysis suggests the net loss of a carbonyl from the 386 Da lactone 8. Such chemical changes are consistent with the presumed instability of the AFG1 intermediate(s) in the presence of acid and the chromophores detected for these compounds.
Acid-catalyzed hydrolysis and decarboxylation of the 386 Da intermediate 3 could give an unstable 360 Da compound 8 or 9 which may spontaneously rearrange to AFG1 (Scheme 2). Because extracts of both the nadA and norA knockout mutants still contain AFG1, an acid-catalyzed conversion process probably is allowed to occur when the cells are lysed in an acidic environment. The ester 7 resulting from ring-opening of 9 or NorB oxidation of 6 may be an intermediate in the conversion of 3 to AFG1. Parasiticol and the 326 Da AFB1 methyl ether could be degradation products of this intermediate ester.

4. Experimental Section

4.1. Construction of gene knockout vectors

PCR and standard recombinant DNA techniques were used to prepare plasmids for insertional inactivation of the Aspergillus genes ku70, nadA, norA, and norB in A. parasiticus isolate BN009E ([7], BN9). To increase gene-targeting frequency in fungal transformants, a ku70-mutant was created in A. parasiticus BN9niaD. Disruption of ku70 allows selection of a higher frequency of homologous recombination. Preparation of the ku70 mutant involved construction of a disruption plasmid, PCR amplification and sequential cloning into pUC19 of a 1.4-kb 5′-untranslated region (UTR) and a 1.7-kb 3′-UTR using the oligonucleotide primer pairs ku5Sm: CTTCGCCCGGGTACGGGTCACCT AATC and ku5X: TATCTAGAGTCGTAAGTCATGAATTGCGT and ku3X, ATTCTAGACAACG CTAGTATTGGTTACGAG and ku3S, CTAGAACGAATTCGTGTCGACACTGA. Following this, a 6.7-kb XbaI fragment that contained A. parasiticus niaD selectable marker [6] was inserted into the plasmid to give pA ku70. Prior to transformation the pA ku70 was digested by SmaI and SalI and Δku70 transformants selected. Protoplasting, transformation and selection were done according to a previously described procedure [5].
The resulting BN9Δku70 was the recipient strain for subsequent fungal transformations. The nadA disruption vector was prepared by PCR using the following primers: nad5KH, ATCAGGTACCGACTGCCCCCAAGCTTCAAGC; nad5X, ATCCGGCTCGATCTAGAAACTCG, nad3X, GTTTGATTCTAGAGATCCGTGC; nad3H, GAAGGCTAAGCTTCGACTGATAAG (nt 70029 to 70981 and 71125 to 71825, respectively in GenBank Acc. #AY371490) to generate DNA fragments that included portions of the nadA 5′-promoter and coding region and the 3′-coding region. The PCR fragments were cloned into pUC19 followed by insertion of the A. oryzae pyrithiamine resistance gene (ptr) [10] into the filled-in XbaI site. The ptr fragment was amplified from pPTR1 (Takara, Japan) with primers ptr730P: ATACTGCAGACGGGCAATTGATTACGG and ptr1230P: TTACTGCAGCCGCTCTTGCATCTTTG. The resulting vector was linearized with HindIII prior to transformation into BN9Δku70. To confirm the disruption of the nadA gene, PCR of DNA from single-spore cloned transformants was done with primers, nad1500, 5′-TATGCTTCCTTTGTACCGATCA and nad2970, ATTGCCGTGCACCAGAGATC (nt 70397 and 71882 in AY371490).
Similarly, 0.4-kb and 0.6-kb portions of the norB 3′-coding and UTR and 5′-norB coding region were generated by PCR with primers norBH, GCAAAAGCTTCAGACGAGCTAT and norBF, TGTCCAACACTCTGCAGACGCTG, and norBK: CGTTGGAAACAGGTACCAATGG and norBR: CACTCTGCAGACGCTGCGATCAT (nt 1427 to 2424 and 506 to 2041 in AY371490). The PCR fragments were cloned into pUC19 followed by the insertion of the above ptr fragment into the PstI site. The resulting vector was linearized by HindIII and KpnI prior to transformation of BN9Δku70. Primers norBH and norBK were used in PCR to confirm norB gene disruption. A norA disruption vector was similarly prepared using the primers norAH, 5′-CGATAAGCTTGTAAGGCATTCT and norAK 5′-CTCGGTACCAAGCCGAGAGCCT (nt 39851 to 40911 in AY371490) for PCR. The ptr fragment was inserted into a PstI site 560 bp from the 5′-end. Fungal transformation and selection of pyrithiamine resistant colonies was done as previously described [5] or as described in the product manual for ptr selection by Takara-Bio, Inc ( http://www.takara-bio.com/research.htm).

4.2. Thin layer chromatography (TLC) and liquid chromatography mass spectrometry (LC/MS)

Dried samples of the chloroform/acetone extract of liquid cultures grown at 22 °C on potato dextrose broth (PDB) medium were analyzed by TLC on 250 μm silica gel plates (J.T. Baker), developed with toluene-ethyl acetate-acetic acid (8:1:1) or by LC/MS on a 3x50 mm Betasil (Thermo Fisher Scientific) column using either a 7 to 10 min, 10% acetonitrile: 0.025% trifluoroacetic acid to 95% acetonitrile: 0.025% trifluoroacetic acid gradient (HT Laboratories, San Diego CA); http://www.ht-labs.com;) or on a Luna C18 100 × 4.6 mm column (5 μm, 100Å, Phenomenex) using a 30 min 10% acetonitrile/0.1% formic acid and 90% water/0.1% formic acid to 99.9% acetonitrile/0.1% formic acid gradient. LC detection was by photodiode array at 215 nm and MS was done using atmospheric pressure chemical ionization. Metabolites were monitored by both diode array UV-visible spectrophotometry and quadrupole MS (Agilent 6130). MSn analysis (mass spectrometry performed in sequential stages) was run until signal detection was no longer possible.

4.3. Sequence comparison

Sequences of the nadA regions from A. parasiticus SU-1 (AY371490), A. flavus AF13 (GenBank accession number AY510451), an isolate of the unnamed B and G-accumulating Aspergillus taxon (BN008) (AY510453), were aligned by DNAMAN. Assessment of coding regions was done using FGENESH (Softberry, http://www.softberry.com/berry.phtml) software. BLASTp searches were done against the non-redundant protein database ( http://www.ncbi.nlm.nih.gov/sites/entrez?db=pubmed).

5. Conclusions

The genes nadA and norA encode enzymes involved in AFG1 formation. In the absence of nadA a 386 Da intermediate accumulates that is the product expected to result from OrdA and CypA oxidation. In the absence of norB, 360 and 362 Da compounds accumulate that are immediate precursors of AFG1. Other products accumulating in the transformants, namely parasiticol and a 326 Da compound are likely to be derailment products of these intermediates.

Acknowledgments

The authors thank Jason M. Crawford, Department of Chemistry, Johns Hopkins University, Baltimore, MD and now at Department of Biological Chemistry and Medical Pharmacology, Harvard Medical School, Boston, MA for performing some of the LC-MS analyses and for many helpful discussions.

References

  1. Bhatnagar, D; Yu, J; Ehrlich, KC. Toxins of filamentous fungi. In Fungal Allergy and Pathogenicity; Breitenbach, M, Crameri, R, Lehrer, SB, Eds.; Karger: Basel, 2002; pp. 167–206. [Google Scholar]
  2. Brown, BJ; Hyun, JW; Duvvuri, S; Karplus, PA; Massey, V. The role of glutamine-114 in old yellow enzyme. J. Biol. Chem 2002, 277, 2138–2145. [Google Scholar]
  3. Cai, JJ; Zeng, H; Shima, Y; Hatabayashi, H; Nakagawa, H; Ito, Y; Nakajima, H; Yabe, K. Involvement of the nadA gene in formation of G-group aflatoxins in Aspergillus parasiticus. Fungal. Genet. Biol 2008, 45, 1081–1093. [Google Scholar]
  4. Cary, JW; Bhatnagar, D; Linz, JE. Aflatoxins: biological significance and regulation of biosynthesis. In Microbial Foodborne Diseases: Mechanisms of Pathogenesis and Toxin Synthesis; Cary, JW, Linz, JE, Bhatnagar, D, Eds.; Technomic Publishing Company: Lancaster, PA, 2000; pp. 317–361. [Google Scholar]
  5. Chang, P-K. A highly efficient gene-targeting system for Aspergillus parasiticus. Lett. Appl. Microbiol 2008, 13, 13. [Google Scholar]
  6. Chang, P-K; Ehrlich, KC; Linz, JE; Bhatnagar, D; Cleveland, TE; Bennett, JW. Characterization of the Aspergillus parasiticus niaD and niiA gene cluster. Curr. Genet 1996, 30, 68–75. [Google Scholar]
  7. Ehrlich, KC; Chang, P-K; Yu, J; Cotty, PJ. Aflatoxin biosynthesis cluster gene cypA is required for G aflatoxin formation. Appl. Environ. Microbiol 2004, 70, 6518–6524. [Google Scholar]
  8. Fox, KM; Karplus, PA. Old yellow enzyme at 2 A resolution: overall structure, ligand binding, and comparison with related flavoproteins. Structure 1994, 2, 1089–1105. [Google Scholar]
  9. Henderberg, A; Bennett, JW; Lee, LS. Biosynthetic origin of aflatoxin G1: Confirmation of sterigmatocystin and lack of confirmation of aflatoxin B1 as precursors. J. Gen. Microbiol 1988, 134, 661–667. [Google Scholar]
  10. Kubodera, T; Yamashita, N; Nishimura, A. Transformation of Aspergillus sp. and Trichoderma reesei using the pyrithiamine resistance gene (ptrA) of Aspergillus oryzae. Biosci. Biotechnol. Biochem 2002, 66, 404–406. [Google Scholar]
  11. Price, MS; Yu, J; Nierman, WC; Kim, HS; Pritchard, B; Jacobus, CA; Bhatnagar, D; Cleveland, TE; Payne, GA. The aflatoxin pathway regulator AFLR induces gene transcription inside and outside of the aflatoxin biosynthetic cluster. Fems. Micro. Biol. Lett 2006, 255, 275–279. [Google Scholar]
  12. Stubblefield, RD; Shotwell, OL; Shannon, GM. Aflatoxins M1 and M2 and parasiticol: thin layer chromatography and physical and chemical properties. J. Assoc. Off. Anal. Chem 1972, 55, 762–767. [Google Scholar]
  13. Udwary, DW; Casillas, LK; Townsend, CA. Synthesis of 11-hydroxy O-methylsterigmatocystin and the role of a cytochrome P-450 in the final step of aflatoxin biosynthesis. J. Am. Chem. Soc 2002, 124, 5294–5303. [Google Scholar]
  14. Williams, RE; Bruce, NC. New uses for an Old Enzyme--the Old Yellow Enzyme family of flavoenzymes. Microbiology 2002, 148, 1607–1614. [Google Scholar]
  15. Yu, J; Chang, P-K; Bhatnagar, D; Cleveland, TE. Cloning of a sugar utilization gene cluster in Aspergillus parasiticus. Biochim. Biophys. Acta 2000, 1493, 211–214. [Google Scholar]
  16. Yu, J; Chang, P-K; Ehrlich, KC; Cary, JW; Montalbano, B; Dyer, JM; Bhatnagar, D; Cleveland, TE. Characterization of the critical amino acids of an Aspergillus parasiticus cytochrome P-450 monooxygenase encoded by ordA that is involved in the biosynthesis of aflatoxins B1, G1, B2, and G2. Appl. Environ. Microbiol 1998, 64, 4834–4841. [Google Scholar]
  17. Yu, J; Chang, PK; Ehrlich, KC; Cary, JW; Bhatnagar, D; Cleveland, TE; Payne, GA; Linz, JE; Woloshuk, CP; Bennett, JW. Clustered pathway genes in aflatoxin biosynthesis. Appl. Environ. Microbiol 2004, 70, 1253–1262. [Google Scholar]
Figure 1. PCR confirmation of BN9ΔnadA, BN9ΔnorA, and BN9ΔnorB disruptants. Lanes 1–5, PCR of DNA from BN9ΔnadA clones 1–5 was with oligos nad1500 and nad2970. Lanes 6, 7, PCR of DNA from BN9ΔnorA transformant clones A21 and A22 was with oligos norAK and norAH. Lanes 8, 9, PCR of DNA from BN9ΔnorB transformant clones B4 and B19 was with oligos norBK and norBH. The higher mol wt band in lanes 1–4, 6, and 9 is evidence of insertion of the 2 kb ptr gene into the targeted gene.
Ijms 09 01717f1
Figure 2. TLC of acetone extracts of A. parasiticus BN9ΔnadA, BN9ΔnorB, and BN9ΔnorA. (A) Lane 1, BN9ΔnadA clone 6; lane 2, BN9ΔnorB (clone B19); lane 3, OMST, AFB1 and AFG1 standards; lane 4, BN9ΔnorA extract; lane 5, BN9Δku70 transformed with a plasmid containing ptr1 (clone B4). (B) Lane 1, unpurified BN9ΔnadA extract; lane 2, TLC of purified GFC from BN9ΔnadA clone 6; lane 3, standards as above.
Ijms 09 01717f2
Figure 3. Alignment of the deduced protein sequences for NadA from two B- and G-group of AF-producing species: A. parasiticus (AP) and BN008E (BN8), and two sclerotial morphotypes of the B-group of AF-producing A. flavus: AF70 (S-strain) and AF13 (L-strain). Asparagine residues (N), presumed important for NadA catalytic function, are marked with vertical arrows.
Ijms 09 01717f3
Scheme 1. Oxidation by OrdA and CypA in the conversion of OMST to AFB1 and AFG1. The structures of the 370 Da and 386 Da intermediates have not been proven. Three arrows indicates that multiple steps are involved. Compound numbers in bold font and molecular weights (Da) in normal font are given below the structure
Ijms 09 01717f4
Scheme 2. Scheme showing some possible intermediates in the conversion of the 386 Da lactone 3 to AFG1. NadA-catalyzed reduction is assumed to follow lactone hydration and ring-opening (see Discussion). The quinone (4) resulting from ring-opening of the 386 Da intermediate is shown as the substrate for NadA. The 362 Da alcohol (6) is shown as the substrate for NorB. Non-enzymatic conversion of the 386 Da lactone to AFG1 is also shown.
Ijms 09 01717f5
Table 1. LC/MS data from A. parasiticus BN9ΔnadA, BN9ΔnorB, and BN9ΔnorA extracts The mass spectrometry was in positive ion mode. Retention times on LC are normalized to the retention time of AFB1 to account for slight variations in different LC runs. Retention times in min of standards were: AFB1, 4.5; AFG1, 4.3; HOMST, 4.2; and OMST, 5.0. The mass to charge ratios (m/z) are rounded off to the nearest whole number. Only odd ion peaks and peaks less that m/z 400 are listed. The relative peak intensity is the percent peak height relative to the highest peak in the mass spectrum.
LC PeakRetention time, min (relative peak height)Mass/charge [M+H+] (relative peak intensity)
A. BN9ΔnadA

Peak 1
Peak 2
13.7 (4)371 (100)363 (6)
24.3 (69)329 (100)355 (15)
34.5 (100)313 (100)329 (39)
4
5.3 (2)
387 (100)
339 (24)
B. BN9ΔnadA-TLC


14.1 (50)329 (100)387 (15)
24.3 (100)329 (100)383 (7)
35.0 (7)339 (100)291 (46)
4
5.4 (20)
387 (100)

C. BN9ΔnorB


13.7 (23)363 (100)361 (18)
24.2 (5)355 (100)371 (6)
34.3 (23)329 (100)311 (7)
44.5 (100)313 (100)327 (37)
5
5.0 (3)
339 (100)

D. BN9ΔnorA


34.3 (100)329 (100)311 (9)
44.4 (82)313 (100)329 (25)
5
5.0 (20)
339 (100)
295 (5)
E. BN9control


14.3 (100)329 (100)311 (6)
24.5 (94)313 (100)285 (5)
35.0 (16)339 (100)295 (2)

