Article

Bacteria-Templated NiO Nanoparticles/Microstructure for an Enzymeless Glucose Sensor

1
Department of Chemistry and Biochemistry, National Chung Cheng University, 168 University Road, Min-Hsiung, Chia-Yi 62102, Taiwan
2
Department of Chemical Engineering & Materials Science, Yuan Ze University. No. 135 Yuandong Road, Zhongli District, Taoyuan City 320, Taiwan
3
Department of Earth and Environmental Sciences, National Chung Cheng University, 168 University Road, Min-Hsiung, Chia-Yi 62102, Taiwan
*
Authors to whom correspondence should be addressed.
Int. J. Mol. Sci. 2016, 17(7), 1104; https://doi.org/10.3390/ijms17071104
Submission received: 3 June 2016 / Revised: 24 June 2016 / Accepted: 28 June 2016 / Published: 11 July 2016
(This article belongs to the Special Issue Inorganic Nanostructures in Biological Systems)

Abstract

:
The bacterial-induced hollow cylinder NiO (HCNiO) nanomaterial was utilized for the enzymeless (without GOx) detection of glucose in basic conditions. The determination of glucose in 0.05 M NaOH solution with high sensitivity was performed using cyclic voltammetry (CV) and amperometry (i–t). The fundamental electrochemical parameters were analyzed and the obtained values of diffusion coefficient (D), heterogeneous rate constant (ks), electroactive surface coverage (Г), and transfer coefficient (alpha-α) are 1.75 × 10⁻⁶ cm2/s, 57.65 M−1·s−1, 1.45 × 10⁻¹⁰ mol/cm2, and 0.52 respectively. The peak current of the i–t method shows two dynamic linear ranges of calibration curves 0.2 to 3.5 µM and 0.5 to 250 µM for the glucose electro-oxidation. The Ni2+/Ni3+ couple with the HCNiO electrode and the electrocatalytic properties were found to be sensitive to the glucose oxidation. The green chemistry of NiO preparation from bacteria and the high catalytic ability of the oxyhydroxide (NiOOH) is the good choice for the development of a glucose sensor. The best obtained sensitivity and limit of detection (LOD) for this sensor were 3978.9 µA mM−1·cm−2 and 0.9 µM, respectively.

Graphical Abstract

1. Introduction

Nowadays, amperometric glucose sensors are relevant for use in blood sugar monitoring with reliable sensitivity and selectivity in the health care industry. In the clinical field it was estimated that 2.8% of the world population, around 171 million people, were affected by diabetes in 2000. It will be projected to be 4.4% by the year 2030, approximately 366 million people [1]. The diagnosis of diabetes has become a far more sophisticated branch of science with increasing self-testing kits. Almost 85% of the entire biosensor market is the commercial glucose biosensor which makes diabetes a model for the development of new biosensors [2]. Biosynthesis of nanoparticles (NPs) using biological molecules and microorganisms has rapidly emerged as nanobiotechnology, i.e., biotechnology combined with nanotechnology [3]. Green nanotechnology could be a best alternative for the nanomaterial synthesis with meticulous nature with the help of variety of biological molecules, such as proteins, carbohydrates, and polyphenols [4]. NPs with different shapes, such as spherical, triangular, octahedral, cluster, and amorphous crystalline have been successfully synthesized using microorganisms. Pseudomonas stutzeri, Magnetospirillum, Escherichia coli, Klebsiella aerogenes, and Lactobacillus strains have been used for the bacterial shaped synthesis of silver, gold, cadmium, magnetite, and titanium NPs [5,6,7,8,9].
Most of the studies involved for the glucose sensor are the enzymatic reaction between the glucose and glucose oxidase (GOx). GOx catalyzes the oxidation of glucose to gluconolactone in the presence of redox mediators and metallic NPs coated on the electrode. However, the value of the enzyme, mediator, and electrode are expensive. In addition, electrode fouling might occur due to the thermal environment, pH change, lack of chemical stability, and fair toxicity [10,11,12]. Hence, the enzymeless glucose sensors are dramatically developed due to the low fabrication cost, overpotential reduction, and low detection limit with selectivity, sensitivity, and stability [13,14,15,16,17,18].
The noble metals and their oxides used as the redox mediators for the non-enzymatic glucose sensors have been reported [19,20,21,22,23,24,25]. Further work for the sensitive determination of glucose by simple and available materials, which have low cost and are less time consuming is required. Nanomaterials of NiO become popular for sensor devices because of its magnetic and heterogeneous electrocatalytic activities [26,27,28,29,30]. Green method is preferable for the preparation of materials in chemical industry, which is cost effective and is safe to the environment and human beings [31]. NPs of HCNiO with unique bacterial morphology were synthesized and used for glucose sensor in this study. Nanomaterials were precipitated due to the urea hydrolysis induced by bacterial metabolism [32,33]. The role of bacteria is to produce urease which catalyzes the hydrolysis of urea to CO32− and NH4+ ions. Those ions result in an increasing pH which favors carboxylate ion (−COO) on the bacterial cell wall to bind with the positive nickel ion providing a nucleation site. The CO32− from urea hydrolysis reacts with nickel ions to form Ni precipitate on the surface of bacterial template. This is the formation of bio-Ni precipitate on the cell-wall structure.
The aim of this study is to develop the enzymeless electrode for the glucose detection at lower concentration without any additives, such as enzymes and expensive metallic NPs. The glassy carbon electrode, with the help of bacterial-shaped hollow cylinder NiO (HCNiO) nanomaterial was used as a sensor and its properties were studied. This sensor showed excellent electrocatalytic activity towards the glucose detection, and was investigated by cyclic voltammetry and amperometry i–t techniques.

2. Results and Discussions

2.1. Electrochemical Properties of the HCNiO/GC-Modified Electrode

The electrocatalytic activity of the constructed HCNiO/GC electrode was examined in 0.05 M NaOH using CV experiments within the potential range of 0.2 V to 0.7 V. The characteristic shape of the CV curves for HCNiO/GC in an alkaline medium is shown in Figure 1. The HCNiO/GC electrode was pre-dipped in NaOH solution for a while, developed the redox peak for Ni3+/Ni2+ couple in the initial first scan but, at the same time, the sharp redox peaks were not observed for the freshly-modified electrode due to scarcity of Ni(OH)2. This indicated that the need of aqueous OH for the film formation of the hydrous Ni(II) oxide species and Ni(OH)2 spontaneously on the electrode then leads to NiOOH formation [34,35,36]. In addition, a basic medium with the suitable concentration, 0.05 M NaOH is essential for the nickel-based material for the enhancement of the catalytic activity for the sensitive oxidation of carbohydrates [37]. The anodic and cathodic peaks at a potential of 0.49 V and 0.41 V are represented by the formation of NiOOH and Ni(OH)2, respectively, on the solid surface of the HCNiO/GC electrode in the liquid NaOH medium. The deposition of the Ni2+/Ni3+ redox couple was confirmed by the continuous increment of the anodic and cathodic peak currents during the successive CV scan. This implied that the modified electrode in the hydroxyl group environment produced enough of the redox couple on the surface of electrode, are extremely sensitive for shuttling of electrons between the solid surface and liquid medium [38,39]. The overall scheme (Scheme 1) of the reaction mechanism (Equations (1) and (2)) for Figure 1 is suggested below:
NiO + OH NiOOH + e
Ni ( OH ) 2 + OH Reduction  ( Red ) Oxidation  ( Oxd ) NiOOH + H 2 O + e
Thus, the couple at half-wave potential (Ep/2) = 0.45 V and ΔEp = 0.08 V values exhibited a Ni3+/Ni2+ redox with a quasi-reversible process. During the successive scan the anodic peak current (Ipa) beyond the +0.6 V increased successively, which may be attributed to the electro-oxidation of OH ions to O2 with HO radicals as intermediates. This has also been checked with the increasing OH ion concentration of supporting electrolyte for this system. It is observed that the anodic peak potential (Epa) and cathodic peak potential (Epc) shifted in the negative direction of potentials (lower), and the peak currents (Ipa and Ipc) were shifting to higher values when the scan cycle number increased, which might be due to the rapid development of NiOOH by adsorptive behavior of nucleation from Ni(OH)2. This is the indication of active sites of Ni2+/Ni3+ produced on the surface of HCNiO/GC electrode, which is in agreement with the similar study of Wang et al. in the Ti/TiO2 nanotube arrays (NTAs)/Ni electrode in which the CV scans were performed in 0.1 M NaOH solution [40].

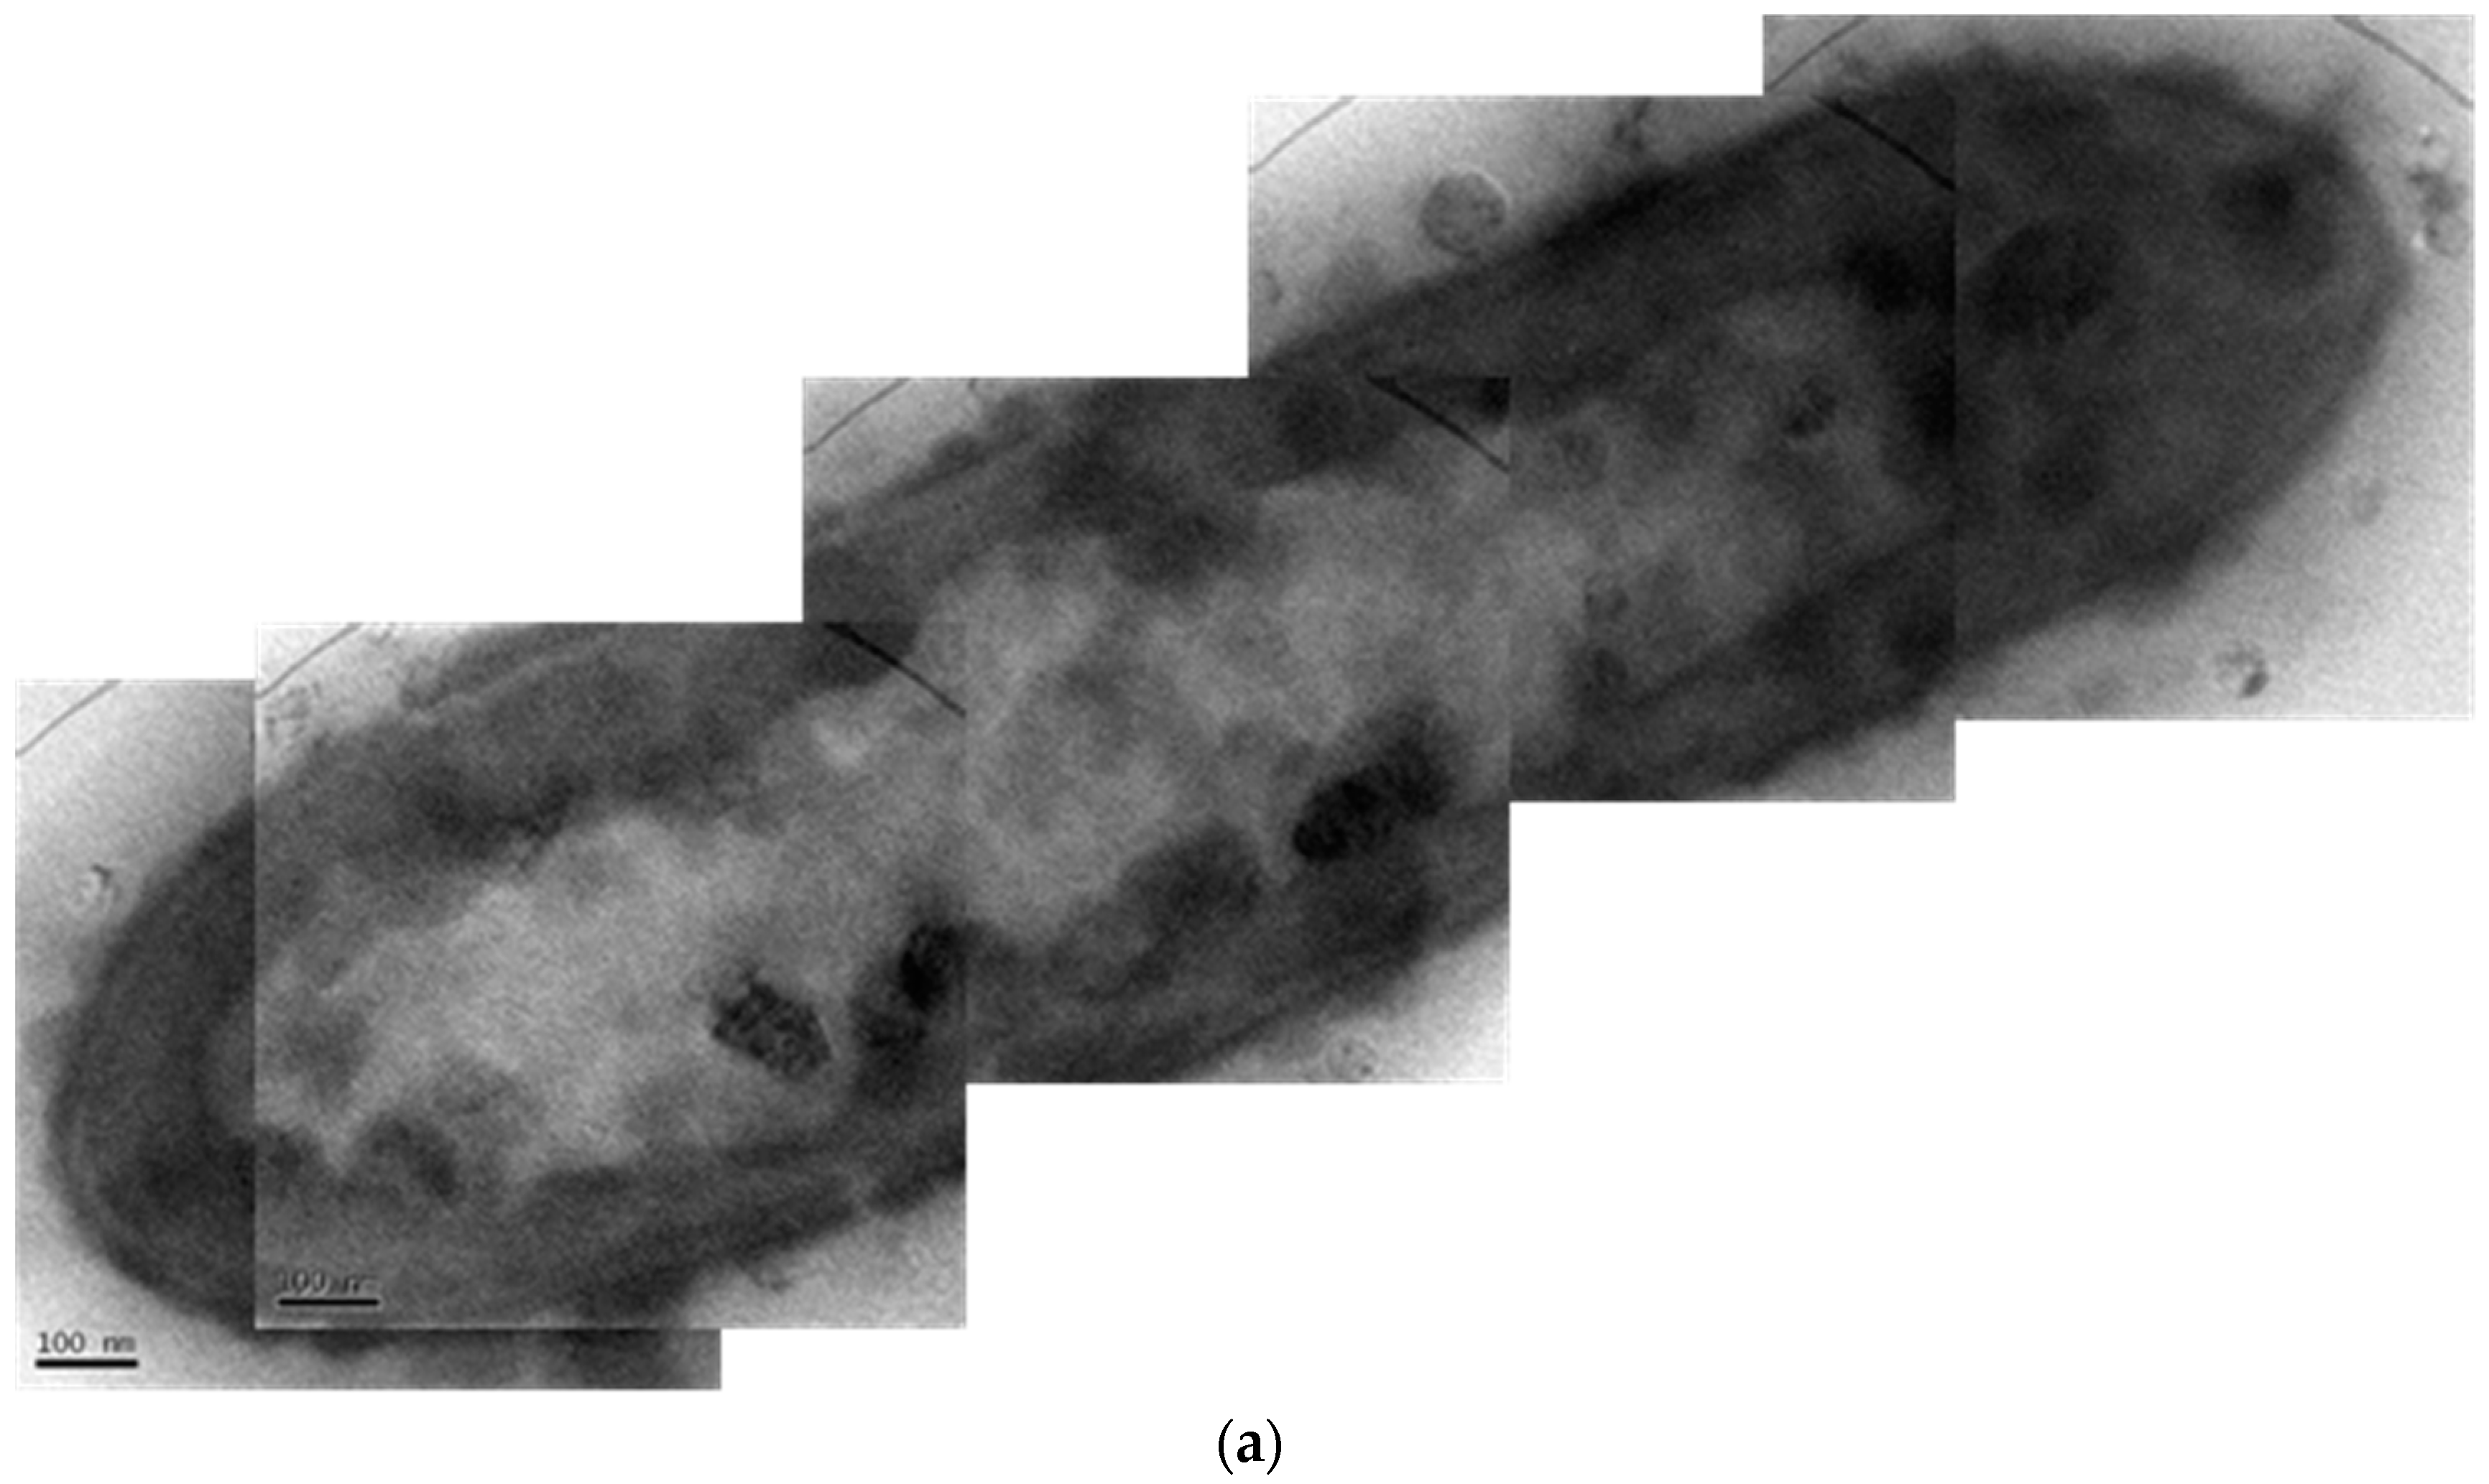
2.2. Electrochemical Surface Characterization of the HCNiO/GC Modified Electrode

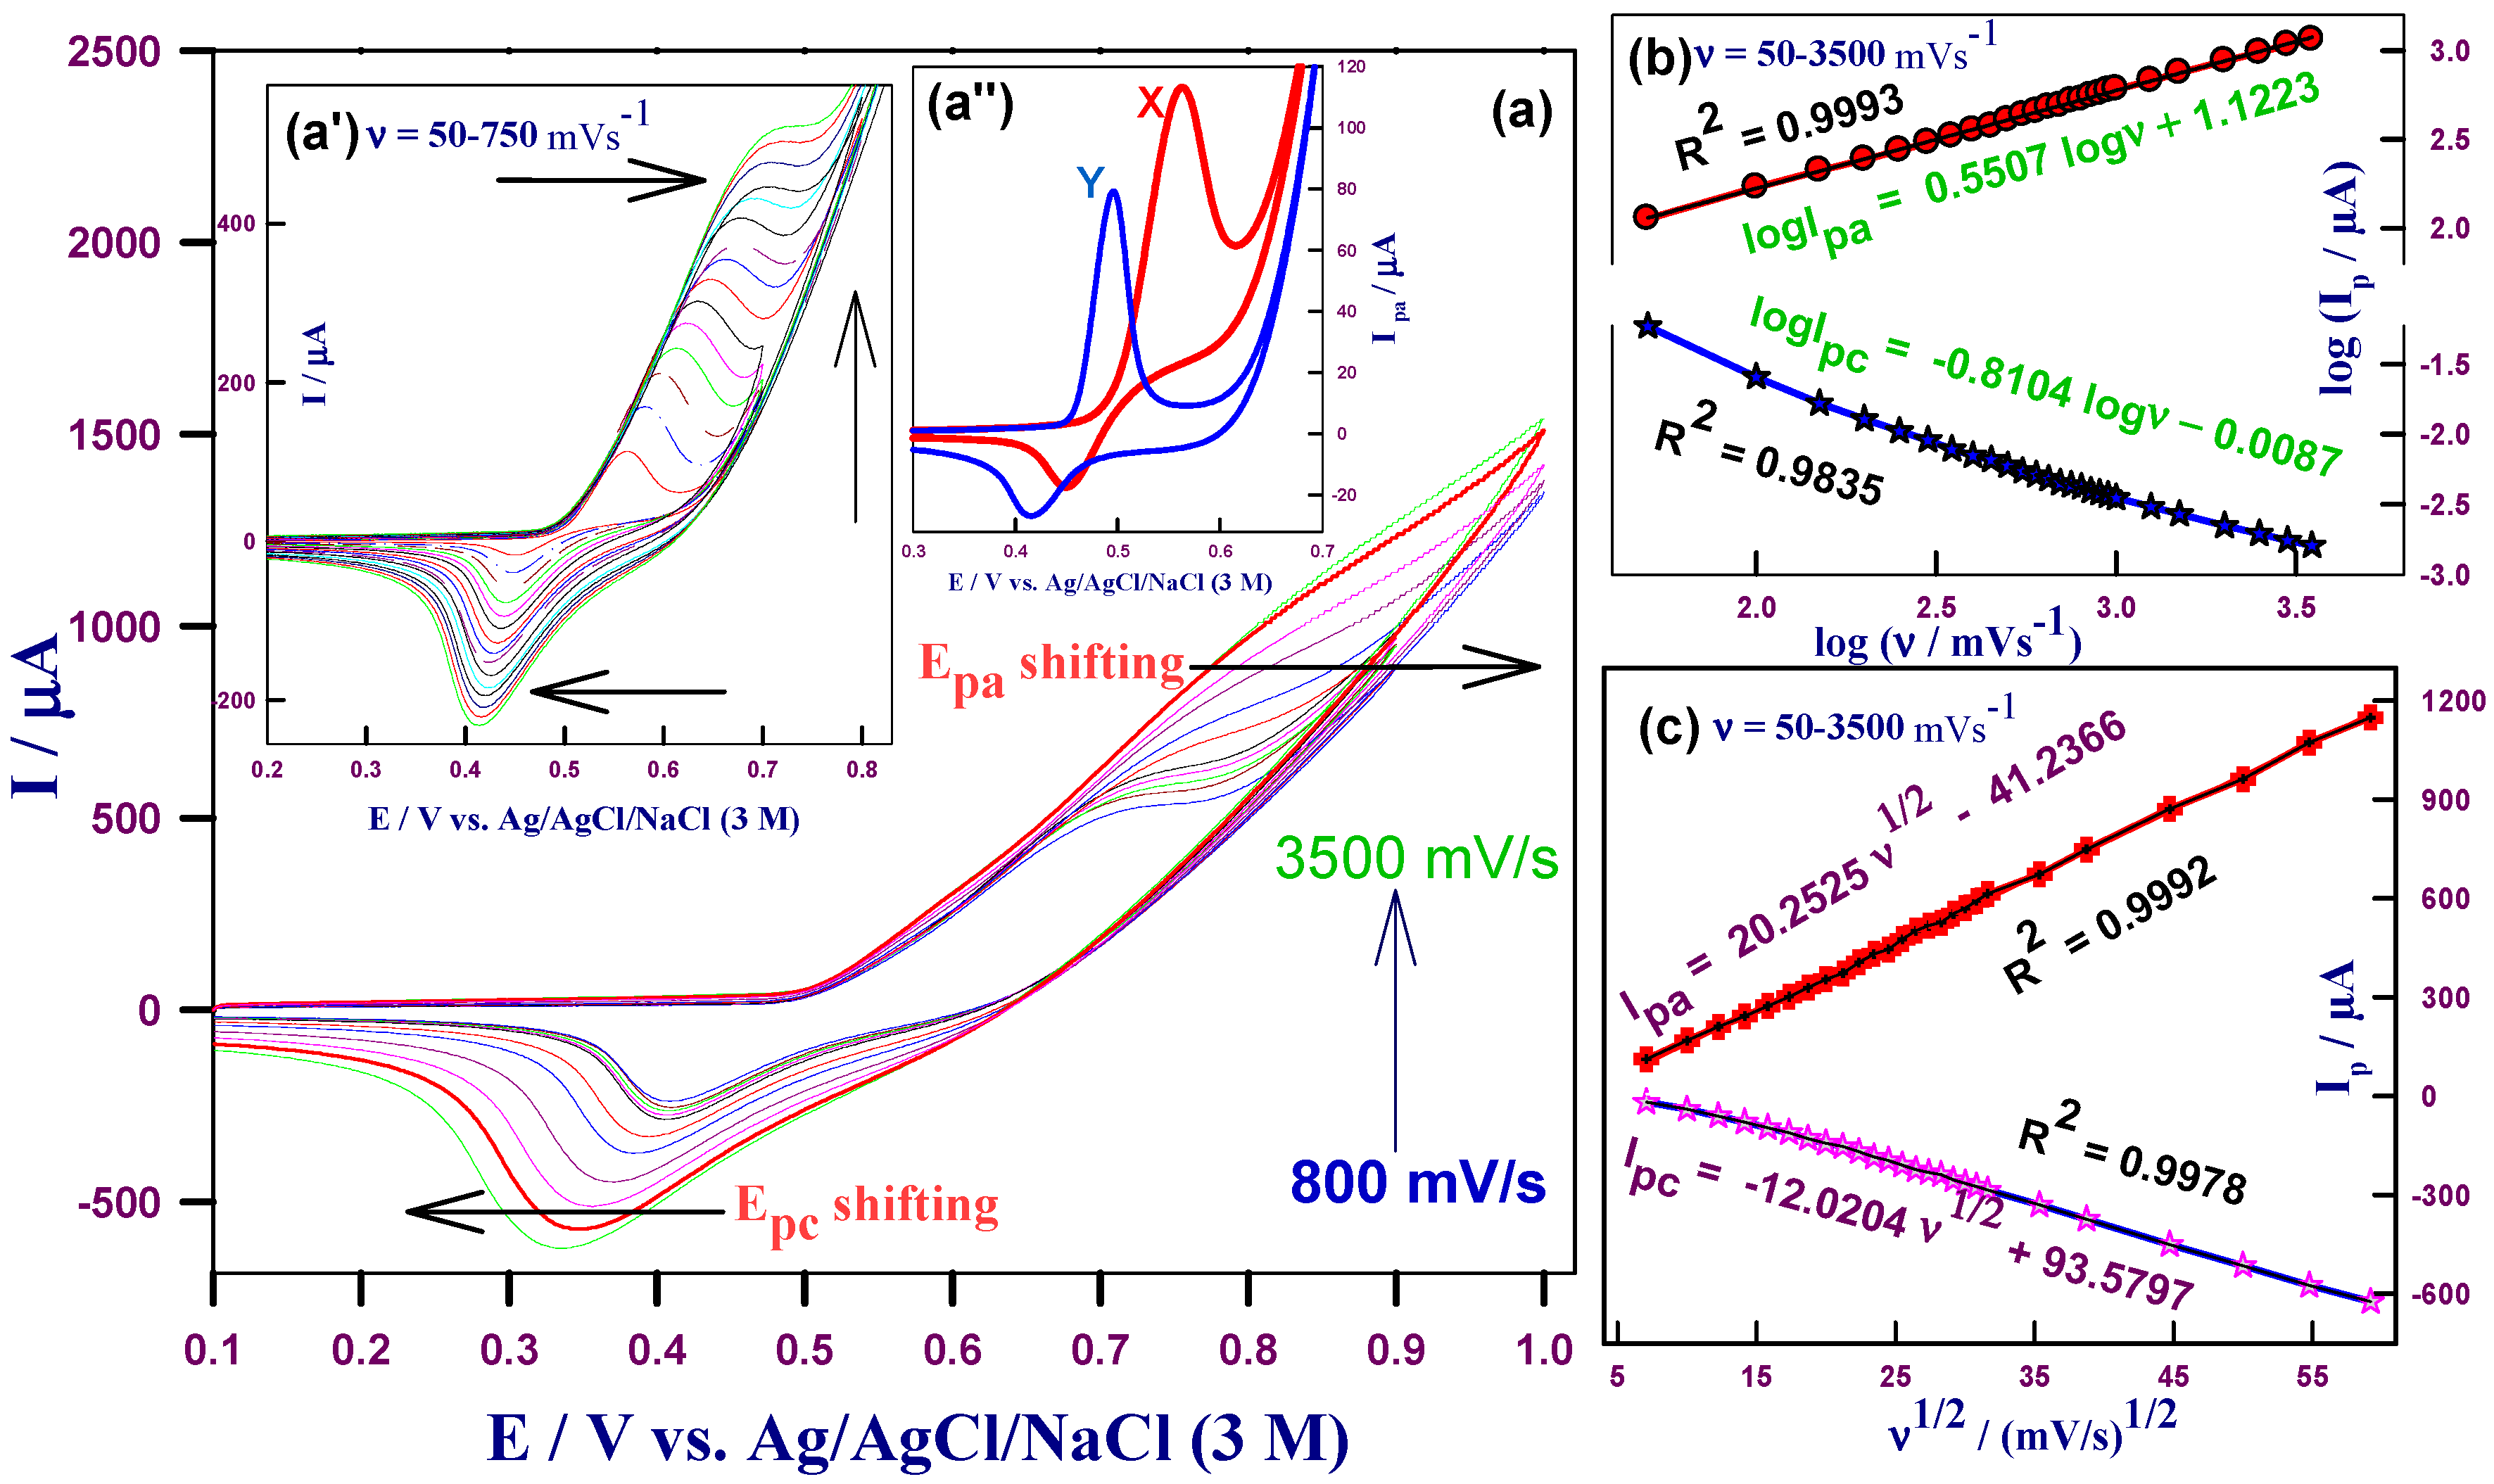
2.2.1. Effect of Scan Rates in the Blank Supporting Electrolyte

After a well production of Ni(OH)2/NiOOH couple by CV scanning at 0.05 V·s−1, the modified electrode was transferred to a fresh 0.05 M NaOH aqueous solution for further studies. Figure 2 shows the cyclic voltammograms of HCNiO/GC-modified electrode at various scan rates (ν) obtained in 0.05 M NaOH solution. The peak currents of anodic (Ipa) and cathodic (Ipc) are linearly proportional to the wide range of scan rates between 50 and 5000 mV·s−1, indicating an immobilized surface-controlled electrode process [41]. This adsorption-controlled process was confirmed by the double logarithmic (log Ip vs. log ν) plot of CV data with the slope values greater than 0.5 (0.58 and 0.68 for oxidation and reduction peaks respectively, Figure 2b). In addition, peak currents (Ipa and Ipc) are linearly proportional to the square root of scan rates (ν1/2) at the same range of scan rates as shown in Figure 2c. Regression squared coefficient, (R2 > 0.99 for both anodic and cathodic) exists for the linearity plot of Ip vs. ν1/2, which indicated that the diffusion controlled process also involved. This is because the huge availability of OH ion diffusion transport from the quiescent supporting electrolyte (liquid) to the vicinity of electrode surface film (solid) and vice versa (diffusion ↔ adsorption), during the reaction shown in Equation (3), below [40].
Ni 2 + ( OH ) 2 ( solid surface ) + OH ( aqueous phase ) Diffusion process  ( Red ) Adsorption process  ( Oxd ) Ni 3 +   OOH ( solid surface ) + e
However, the amount of Ni(OH)2 spontaneously formed at the surface due to the interaction of H2O or OH was found to be extremely limited since no obvious redox peaks can be observed in the initial CV scan and at the lower applied potential energy than the overpotential of the modified electrode. Further reaction processes are occurring, as shown in the Equation (2) in Section 3.1. When increasing the scan rates, the anodic peak potential (Epa) was shifted to the more positive direction and the cathodic peak (Epc) moved towards the negative potential as shown in Figure 2a and inset a’. Even though the peak current increased remarkably with increasing scan rates, but the ratio of the anodic to cathodic peak current (Ipa/Ipc) was above unity. It indicates that the Ni(II) to Ni(III) hydrous oxide transformation process is a quasi-reversible reaction [42,43]. This is due to the charge interaction between the positively-charged Ni, Na, and negatively-charged OH ions in the environment [44].

2.2.2. Effect of Scan Rates and Electrocatalytic Effect in the Basic Glucose Solution

Figure 3 shows the effect of glucose addition on the above situation. The electroactive species of the Ni(OH)2/NiOOH, redox couple generated on the modified HCNiO/GC electrode was tested with (peak X in Figure 3a”) and without (peak Y in Figure 3a”) 1 mM glucose in 0.05 M NaOH solution. It can be seen that an increased Ipa from ~ 78 µA (blank NaOH) to ~ 114 µA (glucose-mixed NaOH solution) were produced at the scan rate of 50 mV·s−1. This excellent electrocatalytic ability is due to the rich production of NiOOH in the HCNiO material by virtue of the enhanced surface area and special morphological nature on the substrate, glassy carbon electrode (GCE) [42]. Here, the cathodic peak (Ipc) decreased at higher than 50 mV·s−1 sweep rate but the enhancement of the glucose oxidation peak (Ipa) was found (Figure 3a”) and there was no reduction peak at the lower than 15 mV·s−1 sweep rate. This is due to the change in the Ni2+/Ni3+ concentration ratio. The redox reaction occurring on the electrode surface (Ni2+↔Ni3+) is restricted due to the limited OH diffusion rate with the presence of glucose ions, which in turn limits the production of Ni(OH)2 from NiOOH, resulting from the direct electrocatalytic oxidation of glucose to gluconolactone, as showed in Equation (4). The simplest proposed reaction mechanism and its rate constant for the above processes are shown in the following Scheme 2 and Equation (4) [42,45]:
By simply,
Ni ( II ) e    k - 1       k 1 , RDS    Ni ( II )  and Ni ( III ) + Glucose    k 2 , k 3    Ni ( II ) + Gluconolactone k 1 = k ° exp [ n F η   R T ] ( oxd ) ; k 1 = k ° exp [ ( 1 ) n F η   R T ] ( red )
In the above expressions the rate constants k1 (forward-anodic) and k−1 (reverse-cathodic) are obviously potential-dependent for the redox reaction, k ° is a standard-rate constant, η is the overpotential, and other parameters are of their usual meaning. The peak potentials (Epa) shifted towards the positive direction (higher Epa), which indicated that the diffusion limitation of glucose in the catalytic process (Figure 3a). The result might show glucose diffusion from the bulk solution phase to the surface of modified electrode in which NiOOH (Ni3+ active sites) formation and glucose oxidation simultaneously occurred. Adsorption of glucose is more competitive than OH on the surface of the electrode when the presence of glucose and OH ions diffused from the solution. Hence, the higher potential was required to form more Ni3+ sites from already-covered Ni2+ sites on the surface for the presence of glucose at the higher scan rates [45,46,47]. This demonstrated the certainty of electrocatalytic oxidation of glucose. In addition, there was no poisoning effect on the surface by the consistent CV run on this system. The effect of scan rates was almost similar for the absence and the presence of 1 mM glucose in 0.05 M NaOH system (Figure 2 and Figure 3). The potential sweep rates between the ranges of 50 to 3500 mV/s were used for the presence of glucose as in Figure 3. It can be seen in Figure 2a and Figure 3a, the potential shifting (both Epa and Epc) occurs upon increasing sweep rates in both the cases. However, the oxidation peak (Epa) broadening started in the case of glucose solution (Figure 3a). Eventually, at higher than 800 mV/s scan rates, a wider broadening arose that indicated the limitation was due to the charge transfer kinetics and which is also associated with the charge propagation in the surface film. A very slow e transfer occurs in the complex situation of the film through Glu, Ni3+, Ni2+, and regenerated Ni3+ when abrupt increasing the sweep rate. This could barrier for the diffusion of ions and migration of e-s. It could also involve the chemical reactions between the ions in the solution (OH, Glu) and the nickel active sites on the surface (i.e., EC’ mechanism). In addition, the polarizability of the ions might interfere for free movement (in and out) through the film. This similar diffusion process and the rate of the reaction have been already reported for other nickel-modified electrodes [43,44,48]. Figure 3b–c show the linear relationships for adsorption controlled and diffusion controlled processes with their regression (R2 > 0.99) and slope values greater than 0.5 (Ipa ~ 0.55 and Ipc ~ 0.81), respectively [49]. This same range of values was obtained in the case of the absence of the glucose experiment (Figure 2). This diffusion process is the rate-determining step (RDS) of the total redox process on the film when the presence of glucose, OH ions and counter Na+ ions (for charge neutralization of the film) [41,43,49]. The surface coverage concentration (Г) of HCNiO/GC was evaluated from the following Equation (5)
Γ = Q nFA
where A is the area of the GCE (0.071 cm2), n is the number of electrons involved in the redox reaction, Q is the charge obtained by integrating the anodic peak area of CV at low scan rate (ν = 10 mV/s) for HCNiO/GC, and F is the Faraday constant (96,500 C/mole). It is assumed that all of the immobilized redox centers are electro-active species on the voltammetry time scale. The values of surface coverage for 2 µL and 10 µL coated HCNiO/GC electrodes were 1.45 × 10⁻¹⁰ mol/cm2 and 1.25 × 10⁻⁹ mol/cm2, respectively, which correspond to the presence of a monolayer of effective surface species.

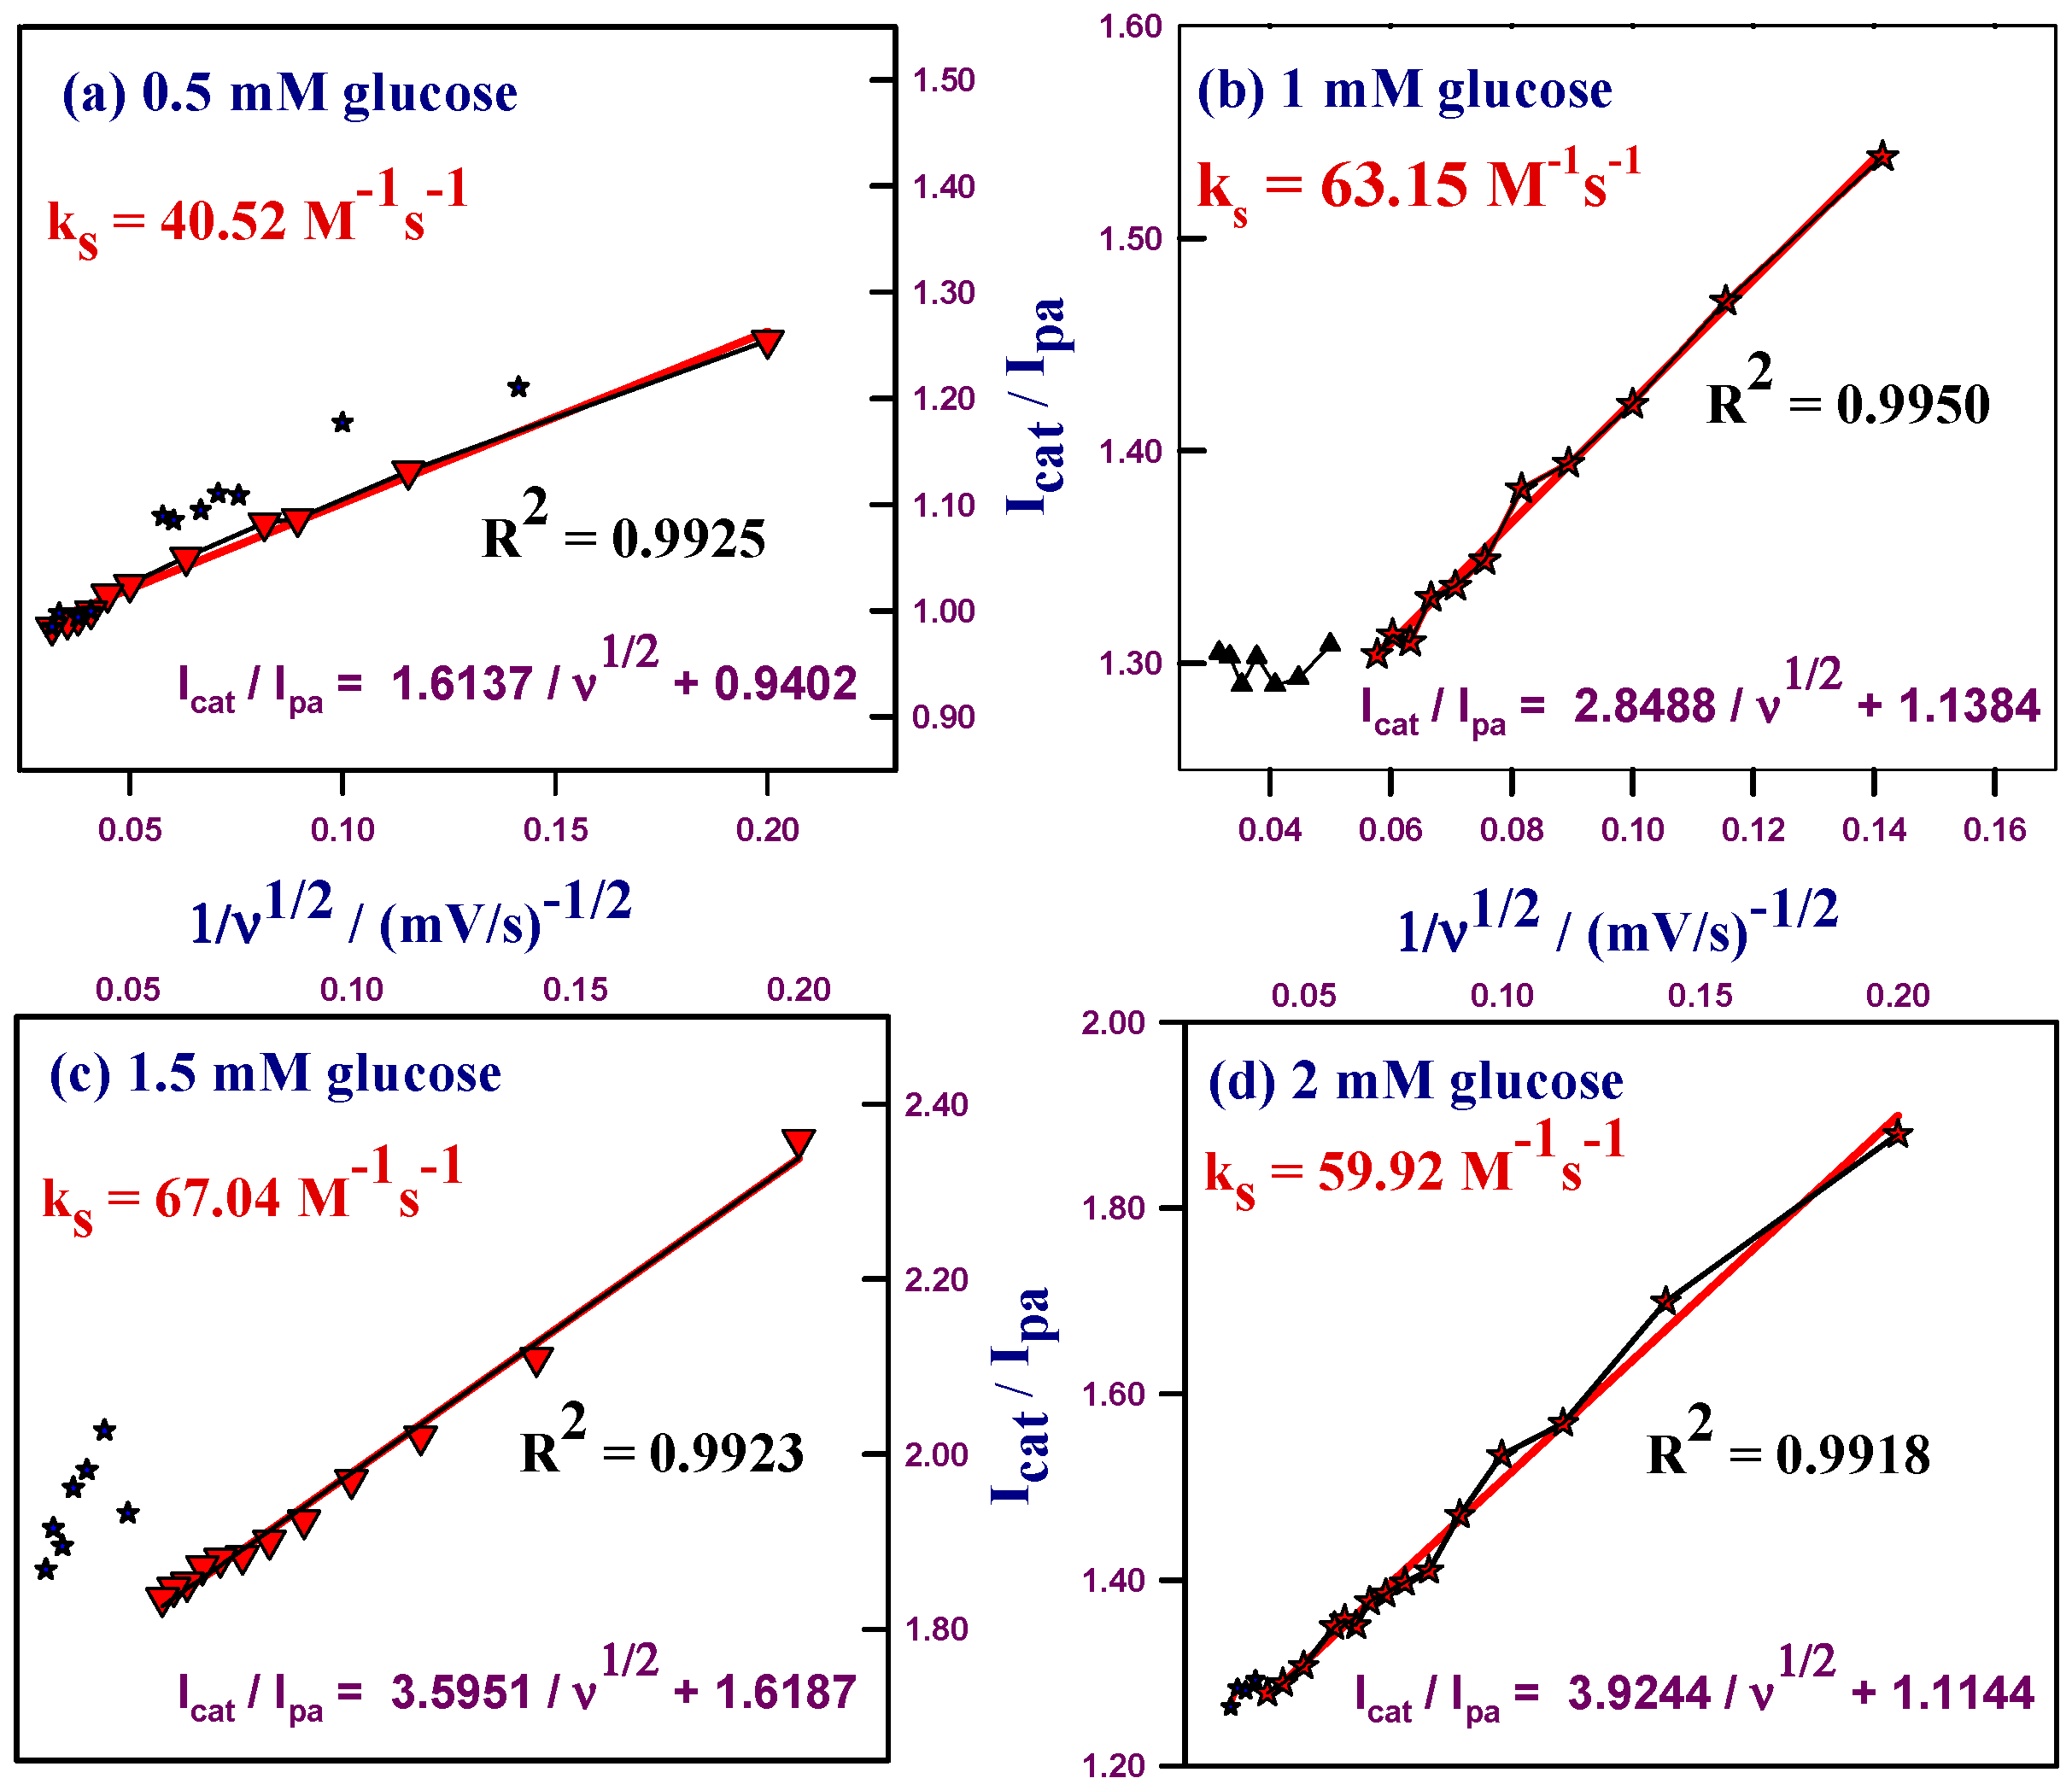
2.2.3. Kinetic Studies of HCNiO/GC Electrode in the Basic Glucose Solution

Moreover, the adsorption process confirmed by the plot of the scan rate normalized current function (I/ν1/2) vs. scan rate (ν). Current function increased with scan rate, as shown in Figure 4a. It is expected for catalytically-coupled adsorption of an electrochemical-chemical (EC’) process. Steady linearity was found at higher ν in both the presence and absence of glucose cases, which indicates that the current function is independent of ν. This consistent fact revealed that the Ni(OH)2/NiOOH transition is the quasi-reversible process in the NaOH/glucose solution [44,50]. In order to obtain information on the rate determining step (RDS), the Tafel slope “b”, was determined from the Figure 4b, plot of Ep vs. log ν, using the following Tafel equation (Equation (6)), valid for a totally irreversible diffusion-controlled process:
η = a + b  log  i or  E p = b 2  log  ν + constant
where “a” and “b” are Tafel constants 2.3 R T α F log io and 2.3 R T α F , respectively; and i and io are current and exchange current, respectively [51]. The partial derivative of E vs. log ν plot is E  log  ν , equal to the Tafel slope b/2. Slope b/2 obtained for this work is 0.0573 V/decade, so, b = 0.1146 V/decade. This slope indicates that a one electron transfer process is the RDS (slow) with the electronic transfer coefficient ( α = 0.52) for glucose solution. This one electron transfer (rate-limiting step) process was also confirmed by the another type of Tafel plot (Epa vs. log I), which were drawn using the data from the rising part of the steady-state current–voltage (I–E) curve for electrocatalytic oxidation of glucose recorded after 30 s of polarization at the desired potential at a scan rate of 5 mV/s in 0.05 M NaOH. A slope of 0.114 V/decade (i.e., 8.77 (V/decade)−1) is obtained as in Figure 4c, indicating the one electron transfer process to be the rate-limiting step with the transfer coefficient of α = 0.52 [52]. The value of diffusion coefficient (D, cm2/s) were obtained by the Randles-Sevcik equation (Equation (7)) for irreversible systems using the slope of scan rates study (Ip vs. ν1/2) with 1 mM glucose solution in 0.05 M NaOH [53]:
Ip = (2.99 × 10⁵) α1/2 A C* D1/2 ν1/2
where C* is the bulk concentration of glucose in 0.05 M NaOH in terms of molar (mol/cm3) solution. In this study the obtained D value is 1.75 × 10⁻⁶ cm2/s from the slope value of Figure 3c, which is correlated with the reported literature; A is the electrode surface area (cm2) and ν is the scan rate (V·s−1). The rate constant of the heterogeneous electron transfer (ks) reaction between basic glucose solution and electro-generated Ni(II)/Ni(III) couple on the solid surface can be calculated by the CV technique [50]. Here, this system involved a second-order rate constant ks (M−1·s−1) because OH and Glu ions are necessary for the oxidation. It may be affected by specific adsorption, surface solvent layer, nature of the electrode material itself (GCE), and the film on the electrode surface. There is no bond formation and bond dissociation in this case [53,54]. The rate constant (ks) was calculated using the following Nicholson and Shain’s interpreted equation (Equation (8)) [50]:
I cat I pa = ( 1 0.447 ) ( R T n F ) 1 / 2 ( k s C ν ) 1 / 2
where Icat is the catalytic oxidation peak current with known glucose concentration (C) and Ipa is the diffusion current of oxidation peak without glucose in 0.05 M NaOH. The linearity plot of (Icat/Ipa) vs. (1/ν)1/2 arrived with the different potential scan rates of 25 to 900 mV/s CV run in the basic glucose and basic solutions separately. The rate constant values 40.52, 63.15, 67.04, and 59.92 M−1·s−1 were obtained for different glucose concentrations 0.5, 1, 1.5, and 2 mM in 0.05 M NaOH solution as shown in Figure 5a–d, respectively. When increasing the concentration of glucose from 0.5 to 1.5 mM, the rate constant also increased gradually, and then decreased, starting at 2 mM glucose, as shown in the Figure 5d. This implied that the limitation of the rate constant occurred which could be attributed to the saturation of the active sites by the passive layer of the basic glucose molecules on the surface of the electrode [55]. It resulted that there may not be sufficient active sites for the adsorption of higher concentrations of glucose. In addition, some other chemical complications, such as the glucose intermediate occurring, could be a barrier to reach the catalytic surface of the electrode for the diffusion of glucose molecules. A high concentration of OH might be required for the oxidation of a high concentration glucose, and this part of work is under progress along with this study [50,52]. The average value of the rate constant for the concentration range of 0.5 mM to 2 mM glucose solution was 57.65 M−1·s−1, which is in agreement with the reported literature [47,50].

2.3. Electrocatalytic Determination of Glucose by a HCNiO/GC Electrode

2.3.1. Cyclic Voltammetric (CV) Method for the Detection of Glucose

Figure 6a shows the CVs of the 2 µL HCNiO (Г = 1.45 × 10⁻¹⁰ mol/cm2)-coated GC electrode recorded in different glucose concentrations (0.10 mM to 2 mM) in 0.05 M NaOH solution at a 50 mV/s sweep rate. The linearity plot obtained for the current versus concentration with R2 = 0.99 from the CV data is shown in the inset (Figure 6a’). The catalytic current of a HCNiO/GC electrode increased towards the glucose oxidation and the enhancement of the anodic peak current attributed to the profound conductivity and large active surface area of the material coated on the electrode.

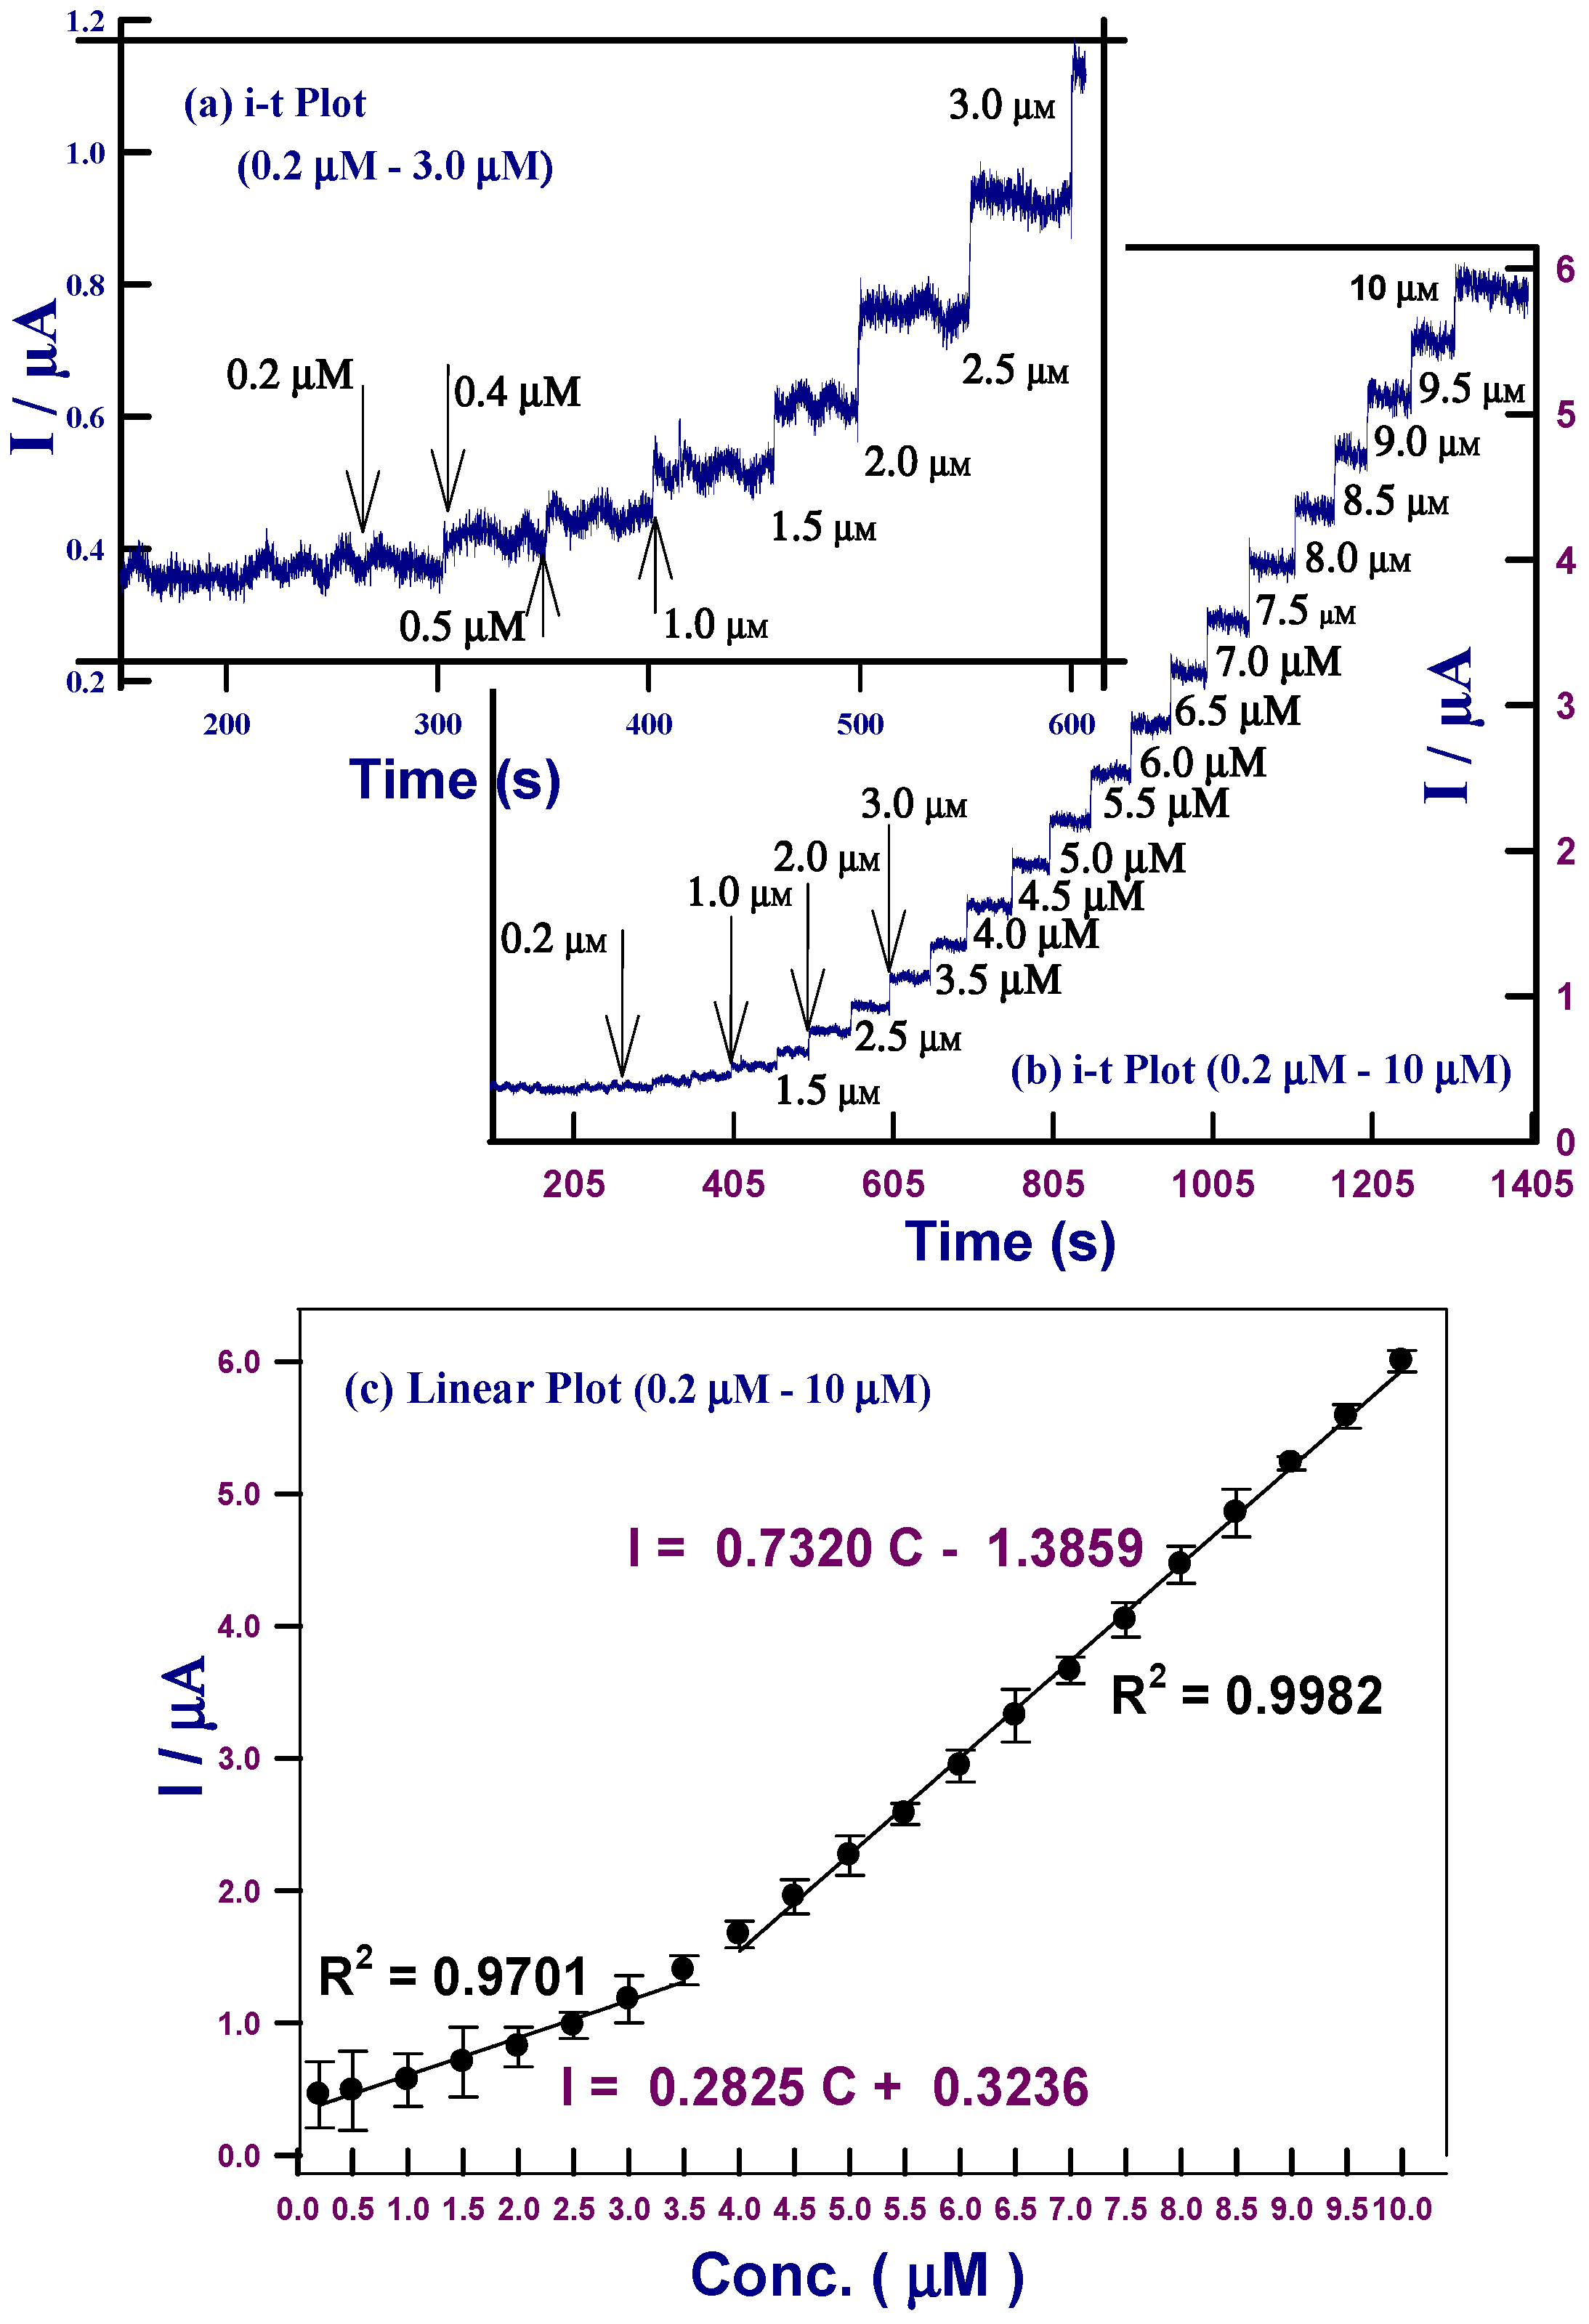
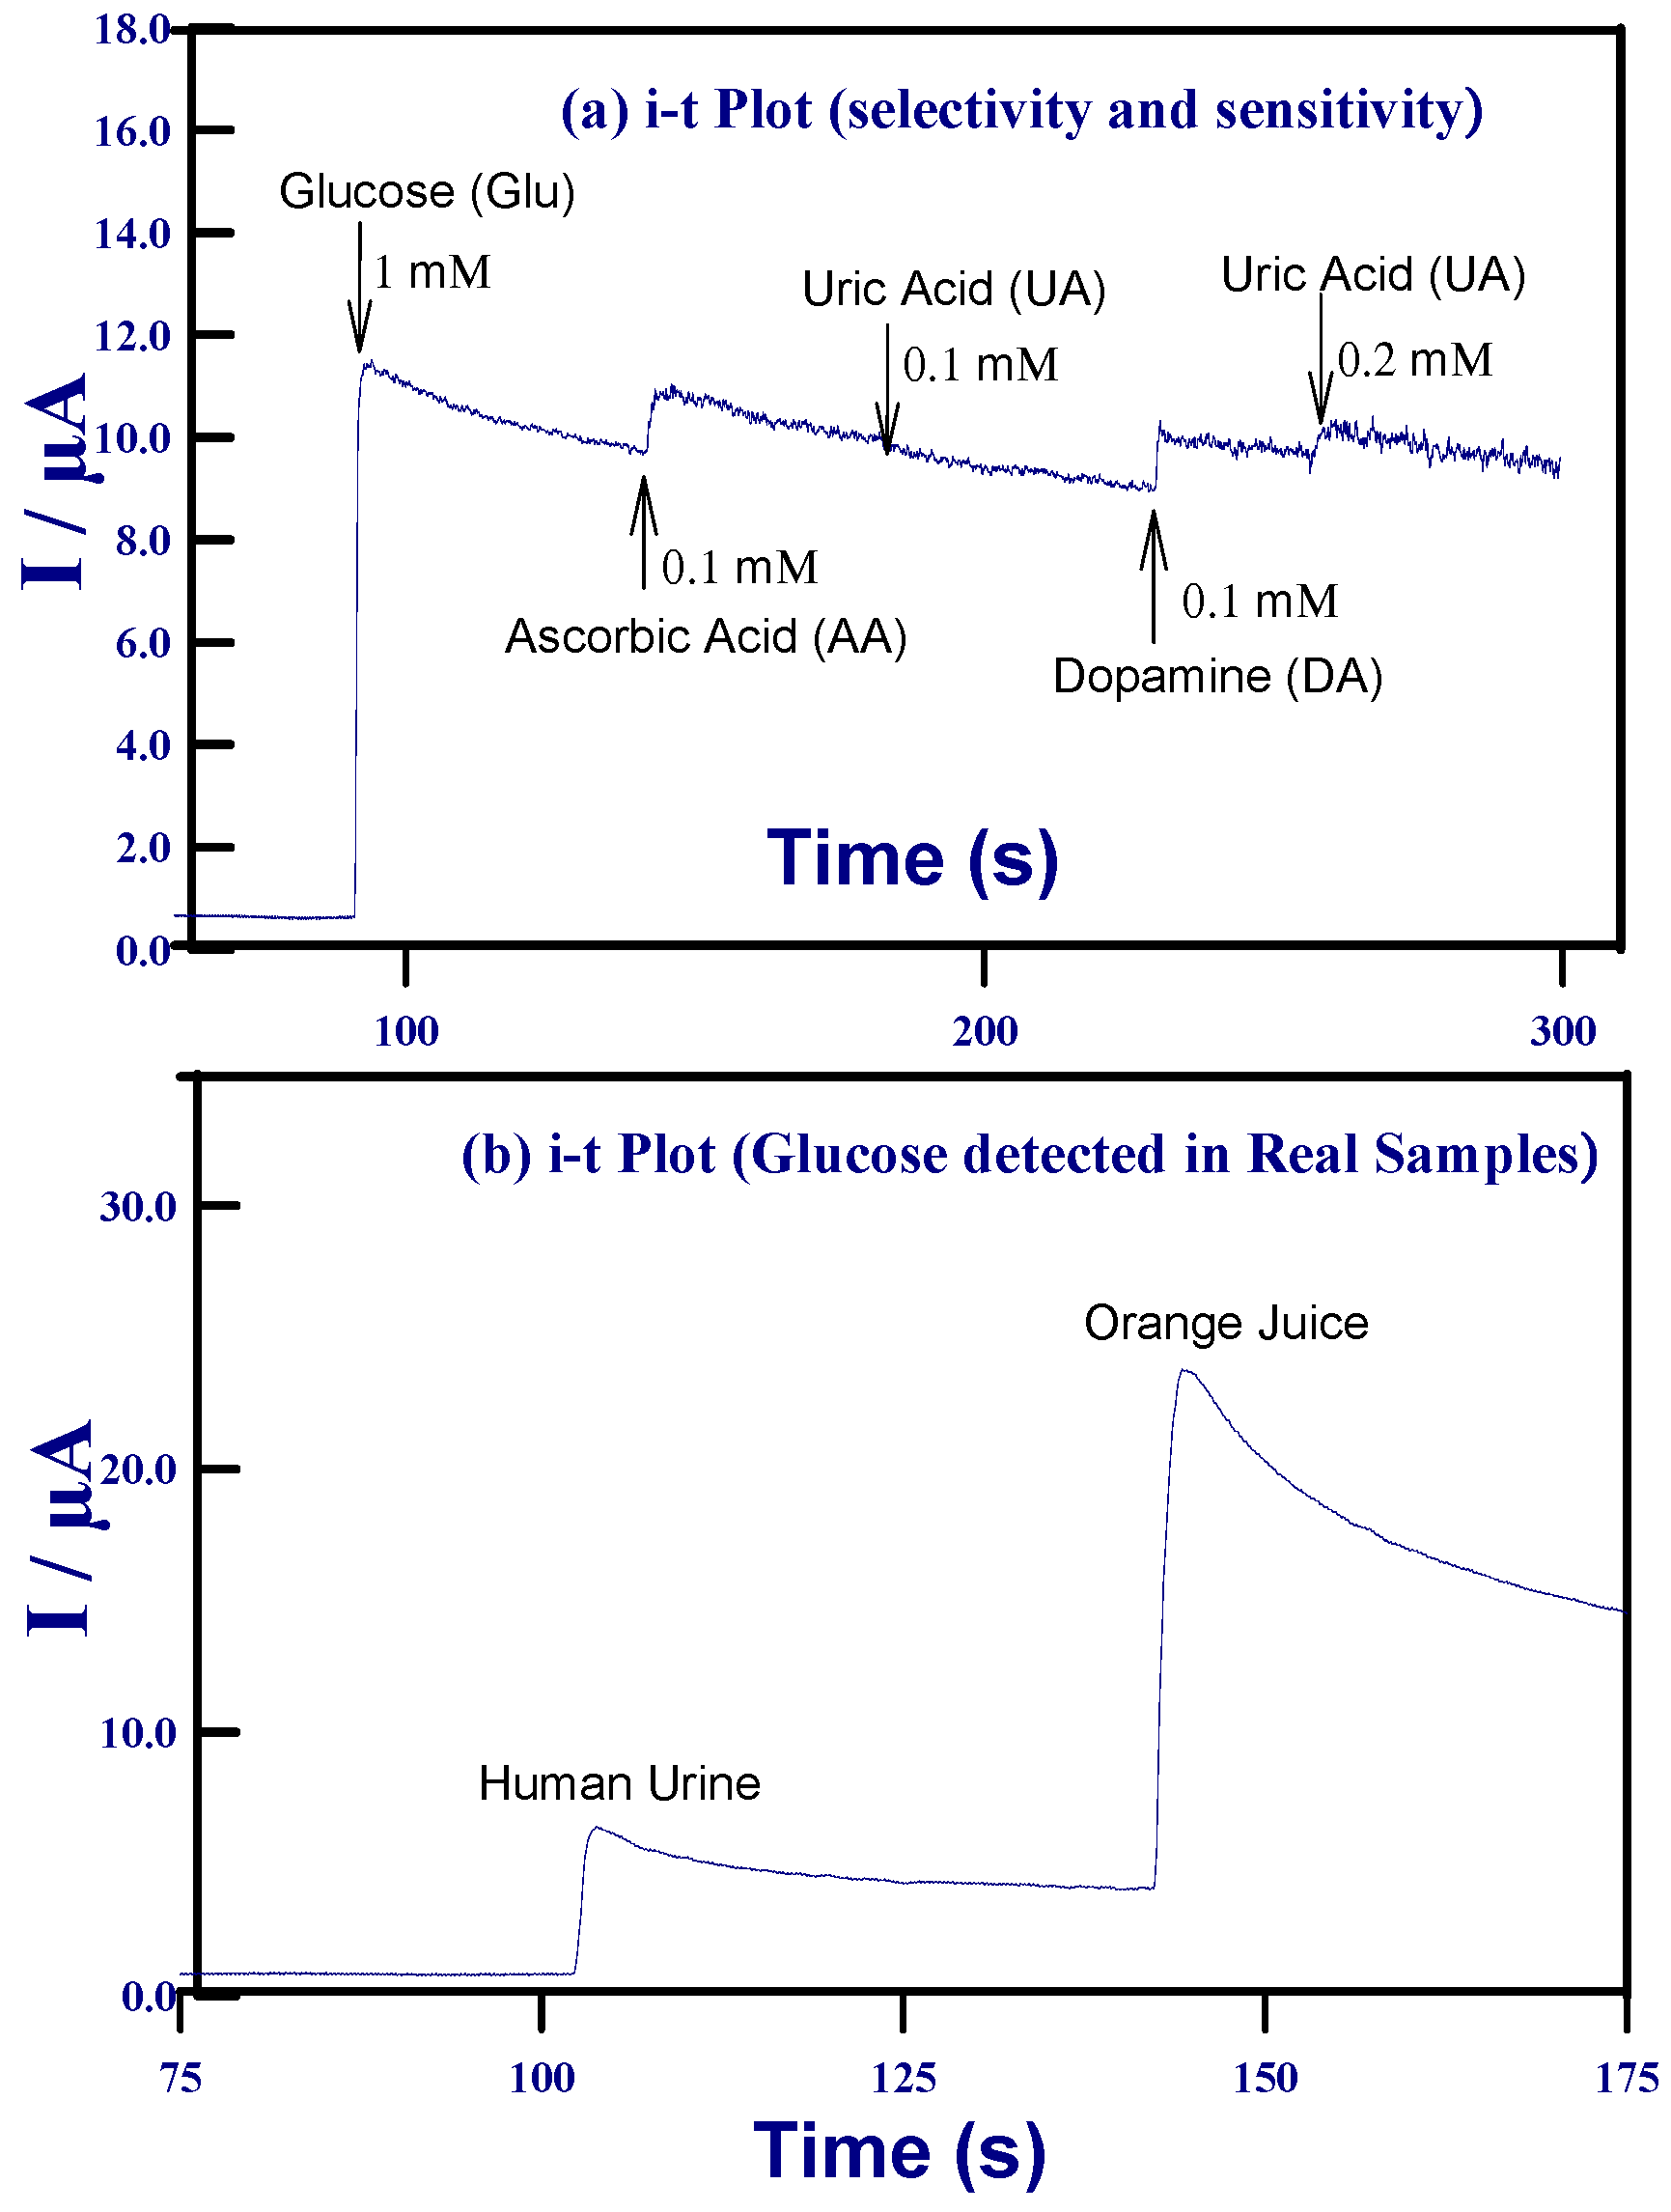
2.3.2. Amperometric i–t Detection of Glucose

The lower quantity of glucose oxidation can be achieved using i–t method, in which potential at 0.52 V was selected. Figure 7a,b show the amperometric sensing of glucose by successive addition of a low range of glucose concentration of 0.2 to 10 µM in a continuously-stirred 0.05 M NaOH solution. Figure 7c shows its two different calibration plot. Moreover, Figure 8a showed the current response for a higher concentration range of 0.5 to 500 µM glucose, in which the current increment was limited up to 250 µM. The current response decreased gradually after 250 µM concentration, which may be due to the diffusion dominance and adsorption difficulties of glucose ions onto the small volume of the active sites when compared to the high glucose concentration. Figure 8a’ is the linearity plot of 0.5 to 250 µM. The fast steady-state current achieved (95% of all within 3 s) and stable response upon the successive additions of 10 µM glucose with the reliable RSD value (1.14% ± 4.32%) for the 13 additions is shown in Figure 8a”. The limit of detection (LOD) was 0.9 µM measured by the standard deviation of the blank run in 0.05 M NaOH by the i–t technique (n = 10) and its signal was also observed by this method. The HCNiO/GC sensor exhibits much higher sensitivities of 3978.9 and 1232.4 µA mM−1 cm−2 for the linear ranges 0.2 to 3.5 µM and 0.5 to 250 µM, respectively, compared to other nickel-based GCEs reported in the literature [23]. The analytical parameters are listed in Table 1 for a comparison study. The stability and reproducibility of the sensor checked by tests every week, and a number of experiments on the same day, indicated that there was almost no change in current density for more than two weeks’ time and up to 25 tests on the same day.
The interference test was also done to check the selectivity. The main interferents and the same oxidation potential for glucose detection in serum or other biological samples are dopamine (DA), ascorbic acid (AA), and uric acid (UA). Figure 9a expressed the selectivity by the presence of interferences of AA, UA, and DA for glucose detection. This sensor shows a better response to glucose than other interferents including AA, DA, and UA, which demonstrated good selectivity. The good result was obtained for real samples in 0.05 M NaOH, as shown in Figure 9b. This sensor could be used for the screening purposes without the invasion for the patients who suffer diabetes mellitus.

3. Materials and Methods

3.1. Reagents

NiCl2·6H2O, NaOH, urea, methanol, and ethanol were obtained from Choneye Pure Chemicals (Taipei, Taiwan), yeast from Becton Dickinson Biosciences (Taipei, Taiwan), ammonium sulfate, Tris–HCl were purchased from J.T. Baker (Chu-Bei, Taiwan), glucose from Sigma-Aldrich China Inc. (Shanghai, China), and Milli-Q (MQ-18.2 MΩ·cm at 25 °C) water were used. All chemicals were used without further purification, analytically pure, and all electrochemical experiments were carried out at ambient temperature unless otherwise stated anywhere in this paper.

3.2. Electrochemical Measurements

Cyclic voltammetry studies were performed on a CHI627C Electrochemical Analyzer (CH Instruments, Inc., Austin, TX, USA). The conventional three-electrode system was used throughout the electrochemical experiments consisted of a bare GCE (geometric area 0.071 cm2) or a modified GCE as the working electrode, a platinum wire as the auxiliary electrode, and Ag/AgCl (3 M NaCl) as the reference electrode against which all potentials were measured in this paper. For steady-state amperometric measurements, the working potential was set at 0.52 V and the solution was stirred gently with a magnetic stirrer. A digital pH meter (SUNTEX TS-1, Suntex Instruments Co., Ltd., Xinbei, Taiwan) for pH measurements and a personal computer were used for data storage and processing.

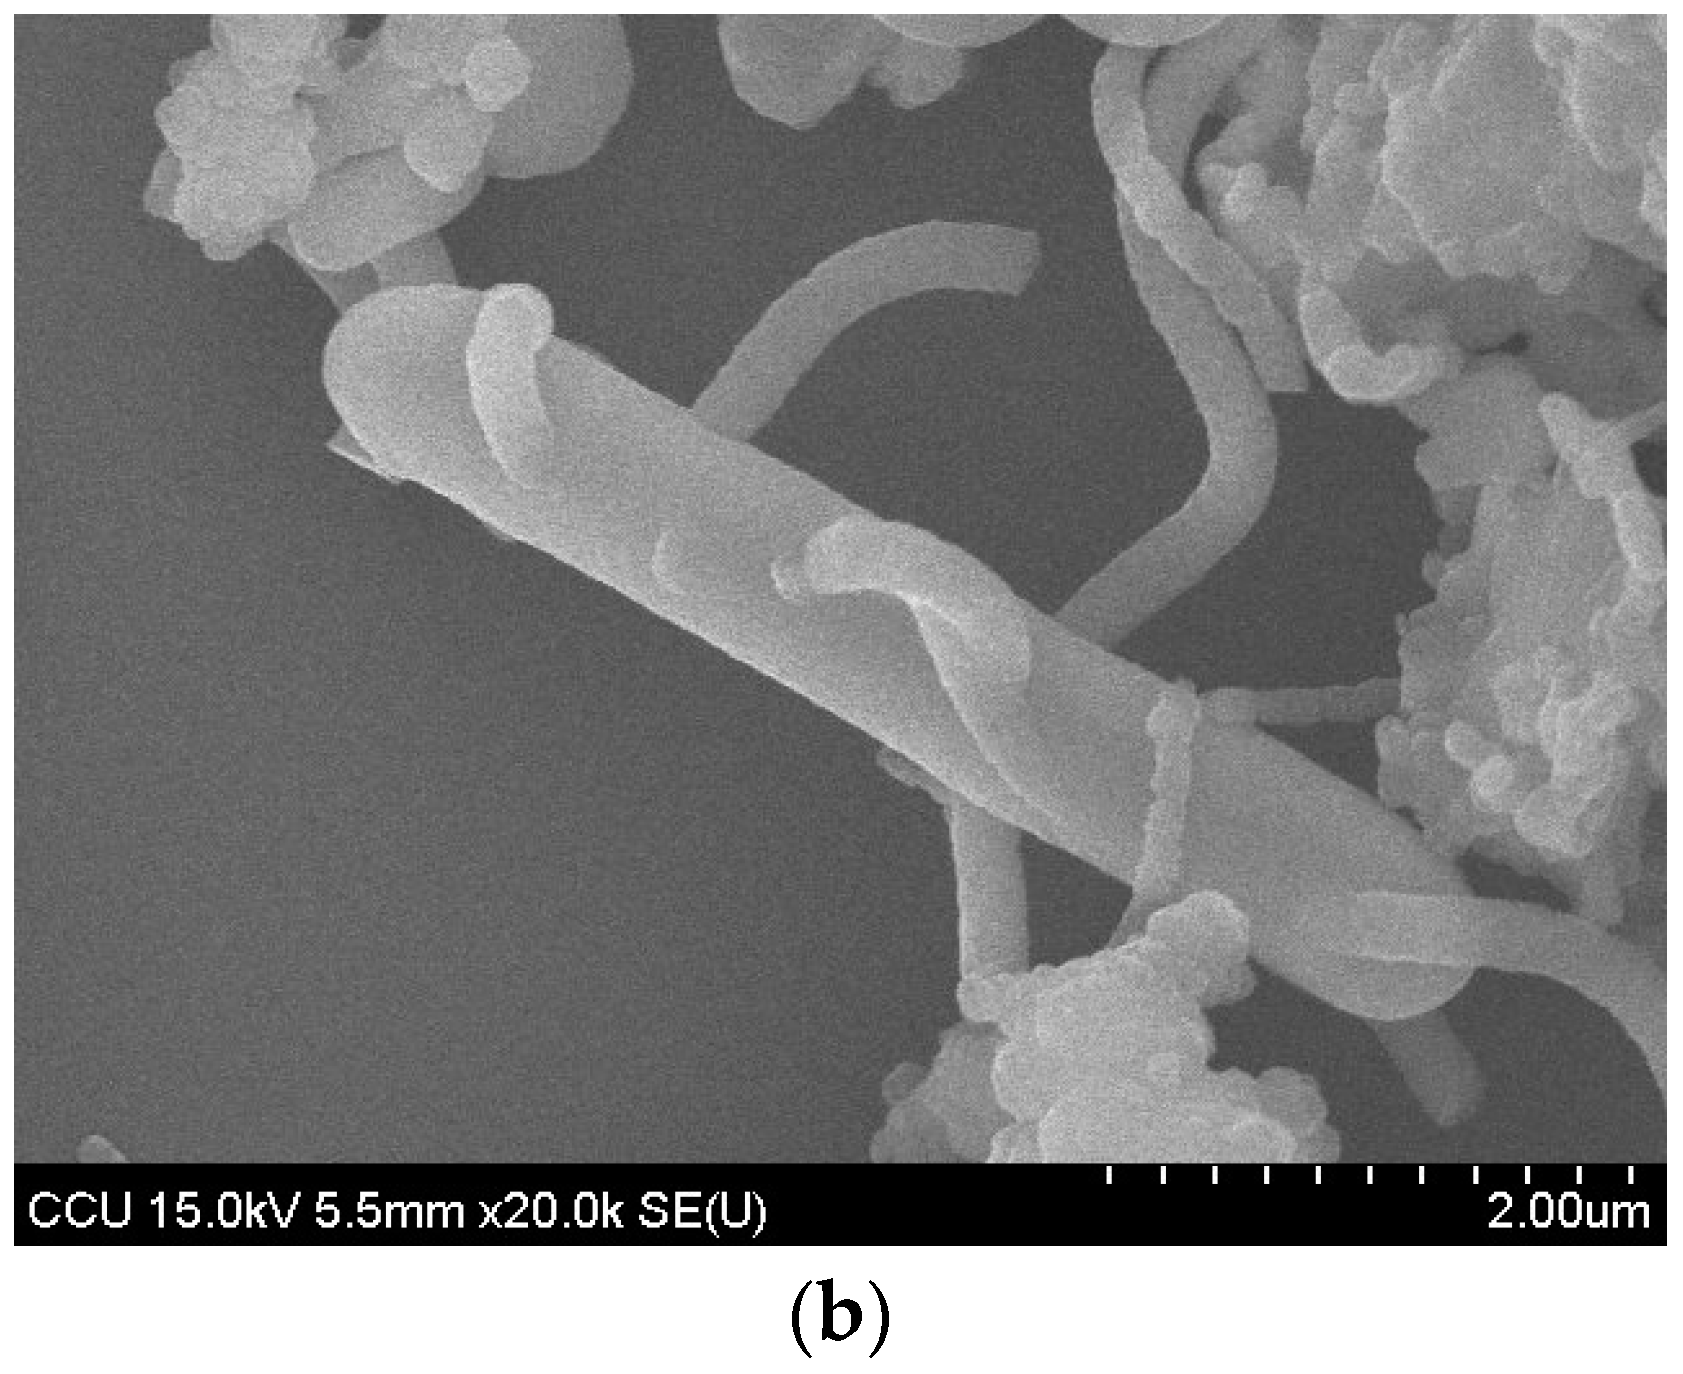
3.3. Preparation of Hollow Cylinder NiO Nanostructured Material

The synthesis procedure followed the method developed by our group [57]. Briefly, a homogeneous mixture was prepared from 0.1 M NiCl2·6H2O, 20 mL MQ water, 1.0 M urea solution, and 40 mL bacterial broth in a screw-capped Teflon tube. Bacterial culture of Sporosarcina pasteurii was carried out using 20 g/L yeast extract, 10 g ammonium sulfate, and 20.48 g Tris–HCl (pH of 8.5) in 1 L sterilized MQ water. The tube was then kept for one day in a mechanical shaker at 35 °C. The obtained precipitate was separated by centrifugation at 3700 rpm for 15 min. Then the precipitate was washed several times with water and, consecutively, with ethanol, dried in an air oven for 6 h at 50 °C, followed by calcination at 550 °C for 6 h. The green precipitate of bio-inorganic nickel compound changed to a black color. The hollow cylinder of microbacterial shape with nanocell wall-like structured NiO (HCNiO) compound was confirmed with the help of transmission electron microscopy (TEM) and scanning electron microscope (SEM) (see Figure 10 for TEM and SEM of bacterial shaped HCNiO).

3.4. HCNiO/GC Electrode Preparation and Its Activation by CV Cycle

Prior to each experiment, the GCE was first polished with gamma alumina in water slurry using a polishing cloth and rinsed thoroughly with MQ water and ethanol. Then the required amount of HCNiO material was ultrasonically dispersed in methanol:water (20:1) solution to achieve a 10 mg/mL uniform ink. Finally, 2 µL of the ink was drop-casted onto the GCE and dried before the electrochemical experiments to study the properties of HCNiO/GCE. Then the electrode (HCNiO/GC) was conditioned between +0.2 to +0.7 V in 0.05 M NaOH, to attain the stable, well-defined peaks of Ni(OH)2/NiOOH film on the modified GCE by cyclic voltammetry, and the optimum 54 cycles developed as in Figure 1; its characteristic peak potentials were identified with the reported literature [10,55].

4. Conclusions

A modified GCE with bacteria-template HCNiO was successfully employed for the enzymeless detection of glucose in basic solutions. Electrochemical characteristic parameters were obtained for this well-developed redox couple on the HCNiO/GC by CV method. The detection of glucose was performed by CV and amperometric i–t techniques and LOD was found as 0.9 µM. The excellent electrocatalytic activity of HCNiO/GC sensor was stable, reproducible, and sensitive towards the detection of glucose. It is noticed that the electrode was stable for the wide range of potential scan rates up to 5 V/s with the linearity curves. Limitation of second order rate constant for the higher concentration of glucose solution was observed. The low cost of the preparation and high catalytic ability of the oxyhydroxide (NiOOH) were achieved for the electro-oxidation of glucose.

Acknowledgments

The authors are very grateful to the MOST (Ministry of Science and Technology) in Taiwan for funding this research project.

Author Contributions

Settu Vaidyanathan and Chien-Yen Chen conceived designed and performed the experiments; Settu Vaidyanathan and Jong-Yuh Cherng analyzed the data; An-Cheng Sun contributed reagents/materials/analysis tools; Settu Vaidyanathan and Chien-Yen Chen wrote the paper.

Conflicts of Interest

The authors declare no conflict of interest.

References

  1. Wild, S.; Roglic, G.; Green, A.; Sicree, R.; King, H. Global prevalence of diabetes: estimates for the year 2000 and projections for 2030. Diabetes Care 2004, 27, 1047–1053. [Google Scholar] [CrossRef] [PubMed]
  2. Wang, J. Electrochemical glucose biosensors. Chem. Rev. 2008, 108, 814–825. [Google Scholar] [CrossRef] [PubMed]
  3. Narayanan, K.B.; Sakthivel, N. Biological synthesis of metal nanoparticles by microbes. Adv. Colloid Interface Sci. 2010, 156, 1–12. [Google Scholar] [CrossRef] [PubMed]
  4. Iravani, S. Green synthesis of metal nanoparticles using plants. Green Chem. 2011, 13, 2638–2650. [Google Scholar] [CrossRef]
  5. Deplanche, K.; Macaskie, L.E. Biorecovery of gold by Escherichia coli and Desulfovibrio desulfuricans. Biotechnol. Bioeng. 2008, 99, 1055–1064. [Google Scholar] [CrossRef] [PubMed]
  6. Nair, B.; Pradeep, T. Coalescence of Nanoclusters and Formation of Submicron Crystallites Assisted by Lactobacillus Strains. Cryst. Growth Des. 2002, 2, 293–298. [Google Scholar] [CrossRef]
  7. Haefeli, C.; Franklin, C.; Hardy, K. Plasmid-determined silver resistance in Pseudomonas stutzeri isolated from a silver mine. J. Bacteriol. 1984, 158, 389–392. [Google Scholar] [PubMed]
  8. Holmes, J.D.; Smith, P.R.; Gowing, R.E.; Richardson, D.J.; Russell, D.A.; Sodeau, J.R. Energy-dispersive X-ray analysis of the extracellular cadmium sulfide crystallites of Klebsiella aerogenes. Arch. Microbiol. 1995, 163, 143–147. [Google Scholar] [CrossRef] [PubMed]
  9. Philipse, A.P.; Maas, D. Magnetic colloids from magnetotactic bacteria: chain formation and colloidal stability. Langmuir 2002, 18, 9977–9984. [Google Scholar] [CrossRef]
  10. Casella, I.G.; Cataldi, T.R.I.; Salvi, A.M.; Desimoni, E. Electrocatalytic oxidation and liquid chromatographic detection of aliphatic alcohols at a nickel-based glassy carbon modified electrode. Anal. Chem. 1993, 65, 3143–3150. [Google Scholar] [CrossRef]
  11. Heller, A.; Feldman, B. Electrochemical glucose sensors and their applications in diabetes management. Chem. Rev. 2008, 108, 2482–2505. [Google Scholar] [CrossRef] [PubMed]
  12. Fang, L.; He, J. Nonenzymatic Glucose Sensors. Prog. Chem. 2015, 27, 585–593. [Google Scholar]
  13. Ahmad, R.; Vaseem, M.; Tripathy, N.; Hahn, Y.B. Wide linear-range detecting nonenzymatic glucose biosensor based on CuO nanoparticles inkjet-printed on electrodes. Anal. Chem. 2013, 85, 10448–10454. [Google Scholar] [CrossRef] [PubMed]
  14. Pandya, A.; Sutariya, P.G.; Menon, S.K. A non enzymatic glucose biosensor based on an ultrasensitive calix[4]arene functionalized boronic acid gold nanoprobe for sensing in human blood serum. Analyst 2013, 138, 2483–2490. [Google Scholar] [CrossRef] [PubMed]
  15. Pang, H.; Lu, Q.; Wang, J.; Li, Y.; Gao, F. Glucose-assisted synthesis of copper micropuzzles and their application as nonenzymatic glucose sensors. Chem. Commun. 2010, 46, 2010–2012. [Google Scholar] [CrossRef] [PubMed]
  16. Ibupoto, Z.H.; Khun, K.; Beni, V.; Willander, M. Non-Enzymatic Glucose Sensor Based on the Novel Flower Like Morphology of Nickel Oxide. Soft Nanosci. Lett. 2013, 3, 46–50. [Google Scholar] [CrossRef]
  17. Fang, B.; Gu, A.; Wang, G.; Wang, W.; Feng, Y.; Zhang, C.; Zhang, X. Silver Oxide Nanowalls Grown on Cu Substrate as an Enzymeless Glucose Sensor. ACS Appl. Mater. Interfaces 2009, 1, 2829–2834. [Google Scholar] [CrossRef] [PubMed]
  18. Wang, J.; Thomas, D.F.; Chen, A. Nonenzymatic Electrochemical Glucose Sensor Based on Nanoporous PtPb Networks. Anal. Chem. 2008, 80, 997–1004. [Google Scholar] [CrossRef] [PubMed]
  19. Jia-Hong, H.; Qiang, X.; Zhong-Rong, S.; Hai-Yan, K. Study on non-enzymatic glucose sensor based on a Ag2O nanoparticles self-assembled Ag electrode. In Proceedings of the 2010 International Conference on Electrical and Control Engineering, Wuhan, China, 25–27 June 2010; pp. 2109–2111.
  20. Lei, J.; Liu, Y.; Wang, X.; Hua, P.; Peng, X. Au/CuO nanosheets composite for glucose sensor and CO oxidation. RSC Adv. 2015, 5, 9130–9137. [Google Scholar] [CrossRef]
  21. Thiagarajan, S.; Chen, S.M. Preparation and characterization of PtAu hybrid film modified electrodes and their use in simultaneous determination of dopamine, ascorbic acid and uric acid. Talanta 2007, 74, 212–222. [Google Scholar] [CrossRef] [PubMed]
  22. Feng, D.; Wang, F.; Chen, Z. Electrochemical glucose sensor based on one-step construction of gold nanoparticle–chitosan composite film. Sens. Actuators B 2009, 138, 539–544. [Google Scholar] [CrossRef]
  23. Wang, Z.; Hu, Y.; Yang, W.; Zhou, M.; Hu, X. Facile One-Step Microwave-Assisted Route towards Ni Nanospheres/Reduced Graphene Oxide Hybrids for Non-Enzymatic Glucose Sensing. Sensors 2012, 12, 4860–4869. [Google Scholar] [CrossRef] [PubMed]
  24. Liu, S.; Yu, B.; Zhang, T. A novel non-enzymatic glucose sensor based on NiO hollow spheres. Electrochim. Acta 2013, 102, 104–107. [Google Scholar] [CrossRef]
  25. Kumar, D.R.; Manoj, D.; Santhanalakshmi, J. Au–ZnO bullet-like heterodimer nanoparticles: synthesis and use for enhanced nonenzymatic electrochemical determination of glucose. RSC Adv. 2014, 4, 8943–8952. [Google Scholar] [CrossRef]
  26. Park, B.; Cairns, E.J. Electrochemical performance of TiO2 and NiO as fuel cell electrode additives. Electrochem. Commun. 2011, 13, 75–77. [Google Scholar] [CrossRef]
  27. Needham, S.A.; Wang, G.X.; Liu, H.K. Synthesis of NiO nanotubes for use as negative electrodes in lithium ion batteries. J. Power Sources 2006, 159, 254–257. [Google Scholar] [CrossRef]
  28. Pang, H.; Lu, Q.; Zhang, Y.; Li, Y.; Gao, F. Selective synthesis of nickel oxide nanowires and length effect on their electrochemical properties. Nanoscale 2010, 2, 920–922. [Google Scholar] [CrossRef] [PubMed]
  29. Ichiyanagi, Y.; Wakabayashi, N.; Yamazaki, J.; Yamada, S.; Kimishima, Y.; Komatsu, E.; Tajima, H. Magnetic properties of NiO nanoparticles. Phys. B 2003, 329, 862–863. [Google Scholar] [CrossRef]
  30. Ren, S.; Yang, C.; Sun, C.; Hui, Y.; Dong, Z.; Wang, J.; Su, X. Novel NiO nanodisks and hollow nanodisks derived from Ni(OH)2 nanostructures and their catalytic performance in epoxidation of styrene. Mater. Lett. 2012, 80, 23–25. [Google Scholar] [CrossRef]
  31. Fernando, L.M.; Merca, F.E.; Paterno, E.S. Biogenic synthesis of gold nanoparticles by plant-growth-promoting bacteria isolated from philippine soils. Philipp. Agric. Sci. 2013, 96, 129–136. [Google Scholar]
  32. Millo, C.; Ader, M.; Dupraz, S.; Guyot, F.; Thaler, C.; Foy, E.; Ménez, B. Carbon isotope fractionation during calcium carbonate precipitation induced by ureolytic bacteria. Geochim. Cosmochim. Acta 2012, 98, 107–124. [Google Scholar] [CrossRef]
  33. Chahal, N.; Rajor, A.; Siddique, R. Calcium carbonate precipitation by different bacterial strains. Afr. J. Biotechnol. 2011, 10, 8359–8372. [Google Scholar]
  34. Xing, W.; Li, F.; Yan, Z.F.; Lu, G.Q. Synthesis and electrochemical properties of mesoporous nickel oxide. J. Power Sources 2004, 134, 324–330. [Google Scholar] [CrossRef]
  35. Lyons, M.; Brandon, M. The Oxygen Evolution Reaction on Passive Oxide Covered Transition Metal Electrodes in Aqueous Alkaline Solution. Part 1-Nickel. Int. J. Electrochem. Sci. 2008, 3, 1386–1424. [Google Scholar]
  36. Kuroda, Y.; Hamano, H.; Mori, T.; Yoshikawa, Y.; Nagao, M. Specific Adsorption Behavior of Water on a Y2O3 Surface. Langmuir 2000, 16, 6937–6947. [Google Scholar] [CrossRef]
  37. Kumary, V.A.; Nancy, T.E.M.; Divya, J.; Sreevalsan, K. Nonenzymatic Glucose Sensor: Glassy Carbon Electrode Modified with Graphene-Nickel/Nickel Oxide Composite. Int. J. Electrochem. Sci. 2013, 8, 2220–2228. [Google Scholar]
  38. Mu, Y.; Jia, D.; He, Y.; Miao, Y.; Wu, H.L. Nano nickel oxide modified non- enzymatic glucose sensors with enhanced sensitivity through an electrochemical process strategy at high potential. Biosens. Bioelectron. 2011, 26, 2948–2952. [Google Scholar] [CrossRef] [PubMed]
  39. Wu, M.S.; Yang, C.H.; Wan, M.J. Morphological and structural studies of nanoporous nickel oxide films fabricated by anodic electrochemical deposition Techniques. Electrochim. Acta 2008, 54, 155–161. [Google Scholar] [CrossRef]
  40. Wang, C.; Yin, L.; Zhang, L.; Gao, R. Ti/TiO2 Nanotube Array/Ni Composite Electrodes for Nonenzymatic Amperometric Glucose Sensing. J. Phys. Chem. C 2010, 114, 4408–4413. [Google Scholar] [CrossRef]
  41. Salimi, A.; Abdi, K.; Khayatiyan, R. Preparation and electrocatalytic oxidation properties of a nickel pentacyanonitrosylferrate modified carbon composite electrode by two-step sol–gel technique: improvement of the catalytic activity. Electrochim. Acta 2004, 49, 413–422. [Google Scholar] [CrossRef]
  42. Hamdan, M.S.; Nordin, N.; Amir, S.F.M.; Riyanto; Othman, M.R. Electrochemical Behaviour of Ni and Ni-PVC Electrodes for the Electroxidation of Ethanol. Sains Malays. 2011, 40, 1421–1427. [Google Scholar]
  43. Kibria, A.K.M.F.; Tarafdar, S.A. Electrochemical studies of a nickel–copper electrode for the oxygen evolution reaction (OER). Int. J. Hydrog. Energy 2002, 27, 879–884. [Google Scholar] [CrossRef]
  44. Ender, B.; Pakize, C. Electrochemical behaviuor of the antibiotic drug Novobiocin sodium on a mercury electrode. Croat. Chem. Acta 2009, 82, 573–582. [Google Scholar]
  45. Danaee, I.; Jafarian, M.; Forouzandeh, F.; Gobal, F.; Mahjani, M.G. Impedance spectroscopy analysis of glucose electro-oxidation on Ni-modified glassy carbon electrode. Electrochim. Acta 2008, 53, 6602–6609. [Google Scholar] [CrossRef]
  46. Zhao, C.; Shao, C.; Li, M.; Jiao, K. Flow-injection analysis of glucose without enzyme based on electrocatalytic oxidation of glucose at a nickel electrode. Talanta 2007, 71, 1769–1773. [Google Scholar] [CrossRef] [PubMed]
  47. Ojani, R.; Raoof, J.B.; Afagh, P.S. Electrocatalytic oxidation of some carbohydrates by poly(1-naphthylamine)/nickel modified carbon paste electrode. J. Electroanal. Chem. 2004, 571, 1–8. [Google Scholar] [CrossRef]
  48. Jafarian, M.; Mahjani, M.G.; Heli, H.; Gobal, F.; Heydarpoor, M. Electrocatalytic oxidation of methane at nickel hydroxide modified nickel electrode in alkaline solution. Electrochem. Commun. 2003, 5, 184–188. [Google Scholar] [CrossRef]
  49. Elahi, M.Y.; Heli, H.; Bathaie, S.Z.; Mousavi, M.F. Electrocatalytic oxidation of glucose at a Ni-curcumin modified glassy carbon electrode. J. Solid State Electrochem. 2007, 11, 273–282. [Google Scholar] [CrossRef]
  50. Muthuraman, G.; Pillai, K.C. Electrocatalysis in micellar media: Indirect reduction of allylchloride in cationic surfactant cetrimide containing aqueous solution. Bull. Electrochem. 1999, 15, 448–451. [Google Scholar]
  51. Bard, A.J.; Faulkner, L.R. Electrochemical methods, Fundamentals and Applications, 2nd ed.; John Wiley: New York, NY, USA, 2001; pp. 96–108. [Google Scholar]
  52. Golabi, S.M.; Zare, H.R. Electrocatalytic oxidation of hydrazine at a chlorogenic acid (CGA) modified glassy carbon electrode. J. Electroanal. Chem. 1999, 465, 168–176. [Google Scholar] [CrossRef]
  53. Acelino, C.S.; Leonardo, L.P.; Nelson, R.S. Sugars Electrooxidation at Glassy Carbon Electrode Decorate with Multi-Walled Carbon Nanotubes with Nickel OxyHydroxide. Int. J. Electrochem. Sci. 2014, 9, 7746–7762. [Google Scholar]
  54. Noel, M.; Vasu, K.I. Cyclic Voltammetry and the Frontiers of Electrochemistry; Oxford and IBH publishing Co. Pvt. Ltd.: New Delhi, India, 1990; pp. 272–304. [Google Scholar]
  55. Shamsipur, M.; Najafi, M.; Hosseini, M.R.M. Highly improved electrooxidation of glucose at a nickel(II) oxide/multi-walled carbon nanotube modified glassy carbon electrode. Bioelectrochemistry 2010, 77, 120–124. [Google Scholar] [CrossRef] [PubMed]
  56. Wei, L.; Feng, M.J.; Quangui, G.; Quan, H.Y.; Feiyu, K. DNA dispersed graphene/NiO hybrid materials for highly sensitive non-enzymatic glucose sensor. Electrochim. Acta 2012, 73, 129–135. [Google Scholar]
  57. Atla, S.B.; Chen, C.Y.; Fu, C.W.; Chien, T.C.; Sun, A.C.; Huang, C.F.; Lo, C.J. Microbial induced synthesis of hollow cylinder and helical NiO micro/nanostructure. MRS Commun. 2014, 4, 121–127. [Google Scholar] [CrossRef]
Scheme 1. Pictorial representation of the reaction mechanism.
Ijms 17 01104 sch001
Figure 1. Cyclic voltammograms of the HCNiO/GC electrode (a) first cycle; (b) second cycle; and (c) 54th cycle in the potential between 0.2 V to 0.7 V in 0.05 M NaOH solution, at a scan rate of 0.05 V·s−1.
Ijms 17 01104 g001
Figure 2. CVs of the conditioned HCNiO/GC electrode in 0.05 M NaOH at different scan rates of inset (a’) 0.05, 0.1, 0.15, 0.2, 0.25, 0.3, 0.35, 0.4, 0.45, 0.5 V·s−1 and (a) 0.55, 0.6, 0.65, 0.7, 0.75, 0.8, 0.85, 0.9, 0.95, 1, 1.25, 1.5, 1.75, 2, 2.5, 3, 3.5, 4, 4.5, and 5 V·s−1 (current response from lower to higher, respectively); (b) Plot of log Ip vs. log ν; and (c) Plot of Ip vs. ν1/2.
Ijms 17 01104 g002
Scheme 2. Glucose oxidation reaction mechanism under basic conditions on Ni(OH)2/NiOOH system.
Ijms 17 01104 sch002
Figure 3. CVs of the conditioned HCNiO/GC electrode in 0.05 M NaOH containing 1 mM glucose at different scan rates of inset (a’) 0.05, 0.1, 0.15, 0.2, 0.25, 0.3, 0.35, 0.4, 0.45, 0.5, 0.55, 0.6, 0.65, 0.7, and 0.75 V·s−1 and (a) 0.8, 0.85, 0.9, 0.95, 1, 1.25, 1.5, 2, 2.5, 3, and 3.5 V s−1 (current response from lower to higher, respectively); (b) Plot of log Ip vs. log ν; and (c) plot of Ip vs. ν1/2. Inset (a”) modified electrode with 1 mM glucose (X), and without glucose (Y), in 0.05 M NaOH at the scan rate of 50 mV/s.
Ijms 17 01104 g003
Figure 4. (a) Variations of the peak current function (I/ν1/2) vs. ν for the oxidation of glucose; (b) Dependence of the peak potential, Epa on log ν; and (c) Tafel plot derived from the potentiodynamic polarization curve (IE) at 5 mV/s for a HCNiO/GC electrode in 0.05 M NaOH in the presence of 1 mM glucose.
Ijms 17 01104 g004
Figure 5. Plot of Icat/Ipa vs. 1/ν1/2 for rate constant studies on a HCNiO/GC electrode in different concentrations of glucose in 0.05 M NaOH at different ν (25–900 mV/s) (a) 0.5 mM glucose; (b) 1 mM glucose; (c) 1.5 mM glucose; and (d) 2 mM glucose.
Ijms 17 01104 g005
Figure 6. (a) CVs of the conditioned HCNiO/GC electrode in 0.05 M NaOH with different concentrations of glucose, (a) 0.0 mM; (b) 0.1 mM; (c) 0.2 mM; (d) 0.4 mM; (e) 0.6 mM; (f) 0.8 mM; (g) 1.0 mM; and (h) 2.0 mM at ν = 50 mV/s; and inset (a’) linearity plot of current vs. concentraion of the CV data. The mean peak current (n = 3) at the relevant concentration is shown with error bars equal to three standard deviation (3σ).
Ijms 17 01104 g006
Figure 7. Amperometry i–t curve of a HCNiO/GC electrode in different concentrations of glucose in 0.05 M NaOH at E = 0.52 V; (a) i–t plot of 0.2 to 3 µM glucose; (b) i–t plot of 0.2 to 10 µM glucose; and (c) lnearity plot of 0.2 µM to 10 µM glucose. The mean peak current (n = 3) at the relevant concentration is shown with error bars equal to three standard deviation (3σ).
Ijms 17 01104 g007
Figure 8. Amperometric i–t curve of a HCNiO/GC electrode in different concentrations of glucose in 0.05 M NaOH at E = 0.52 V; (a) i–t plot of 0.5 µM to 500 µM glucose; inset (a’) linearity plot of 0.5 µM to 250 µM glucose; and inset (a”) i–t plot of 10 µM glucose for Relative standard deviation (RSD).
Ijms 17 01104 g008
Figure 9. Amperometric i–t curve of a HCNiO/GC electrode in 0.05 M NaOH at E = 0.52 V for (a) an interference test in 1 mM glucose, including interferents of 0.1 mM ascorbic acid (AA), 0.1 mM uric acid (UA), 0.1 mM dopamine (DA), and 0.2 mM UA and (b) real samples of human urine and orange juice.
Ijms 17 01104 g009
Figure 10. (a) Transmission electron microscopy (TEM) of bacterial cell wall-like HCNiO; and (b) Scanning electron microscope (SEM) of bacteria-templated HCNiO.
Ijms 17 01104 g010aIjms 17 01104 g010b
Table 1. Comparison of non-enzymatic glucose sensors’ analytical parameters for different nickel-based glassy carbon electrodes (GCEs).
Serial NumberModified GC ElectrodesLinear Range (µM)SensitivityLOD (µM)YearReference
1HCNiO/GC0.2–3.5
0.5–250
3978.9 µA·mM−1·cm−2
1232.4 µA·mM−1·cm−2
0.92016This work
2Ni-rGO/GC1.0–10937 µA·mM−1·cm−2-2012[23]
3NiO/MWCNT/GC200–12,000-1602010[55]
4NiOOH/MWCNT/GC250–56001.5 × 10−5 µA·M−11902014[53]
5GNS/NiO/DNA-GC1–20014.3 µA·mM−1·cm−22.52012[56]
GC: glassy carbon; rGO: reduced graphene oxide; MWCNT: multi-walled carbon nanotube; GNS: graphene nanosheet; DNA: deoxyribonucleic acid; LOD: limit of detection.

