
Structural and Dynamical Insight into PPARγ Antagonism: In Silico Study of the Ligand-Receptor Interactions of Non-Covalent Antagonists

 ,
,
Abstract
:
1. Introduction
2. Results and Discussion
2.1. Experimental Validation of the Obtained Models and Initial Analyses

| No. | Ligand Structure/Name in the Original Source | PDB Complex/Ligand | Effect | Ref. | |
|---|---|---|---|---|---|
| 1 | 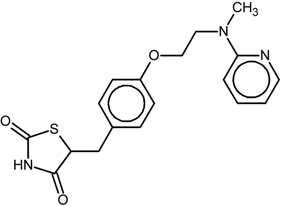 | 1FM6/BRL | Full agonist | [14] | |
| rosiglitazone | |||||
| 2 | 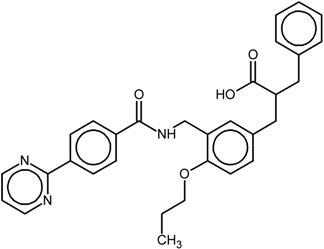 | 3VSO/EK1 | Partial agonist | [15] | |
| MEKT-21 | |||||
| 3 |  | 3WMH/JJA | Partial agonist | [16] | |
| MEKT-75 | |||||
| 4 |  | nr * | Antagonist IC50 = 174 nM Imax = 92% | [7] | |
| 9i | |||||
| 5 | 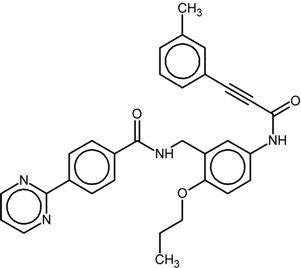 | nr | Antagonist IC50 = 411 nM Imax = 84% | [7] | |
| 9k | |||||
| 6 | 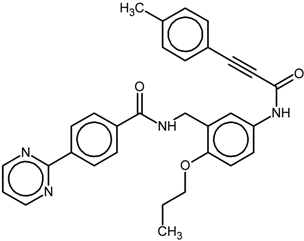 | nr | Antagonist IC50 = 610 nM Imax = 56% | [7] | |
| 9l | |||||
| 7 | 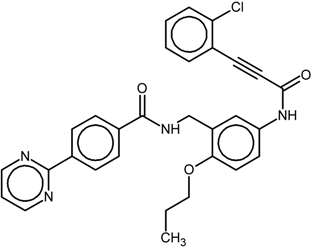 | nr | Antagonist IC50 = 277 nM Imax = 104% | [7] | |
| 9p |

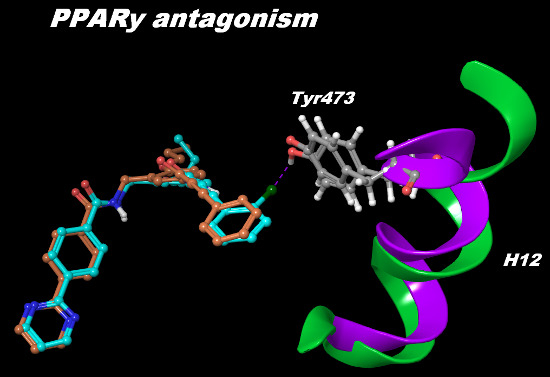
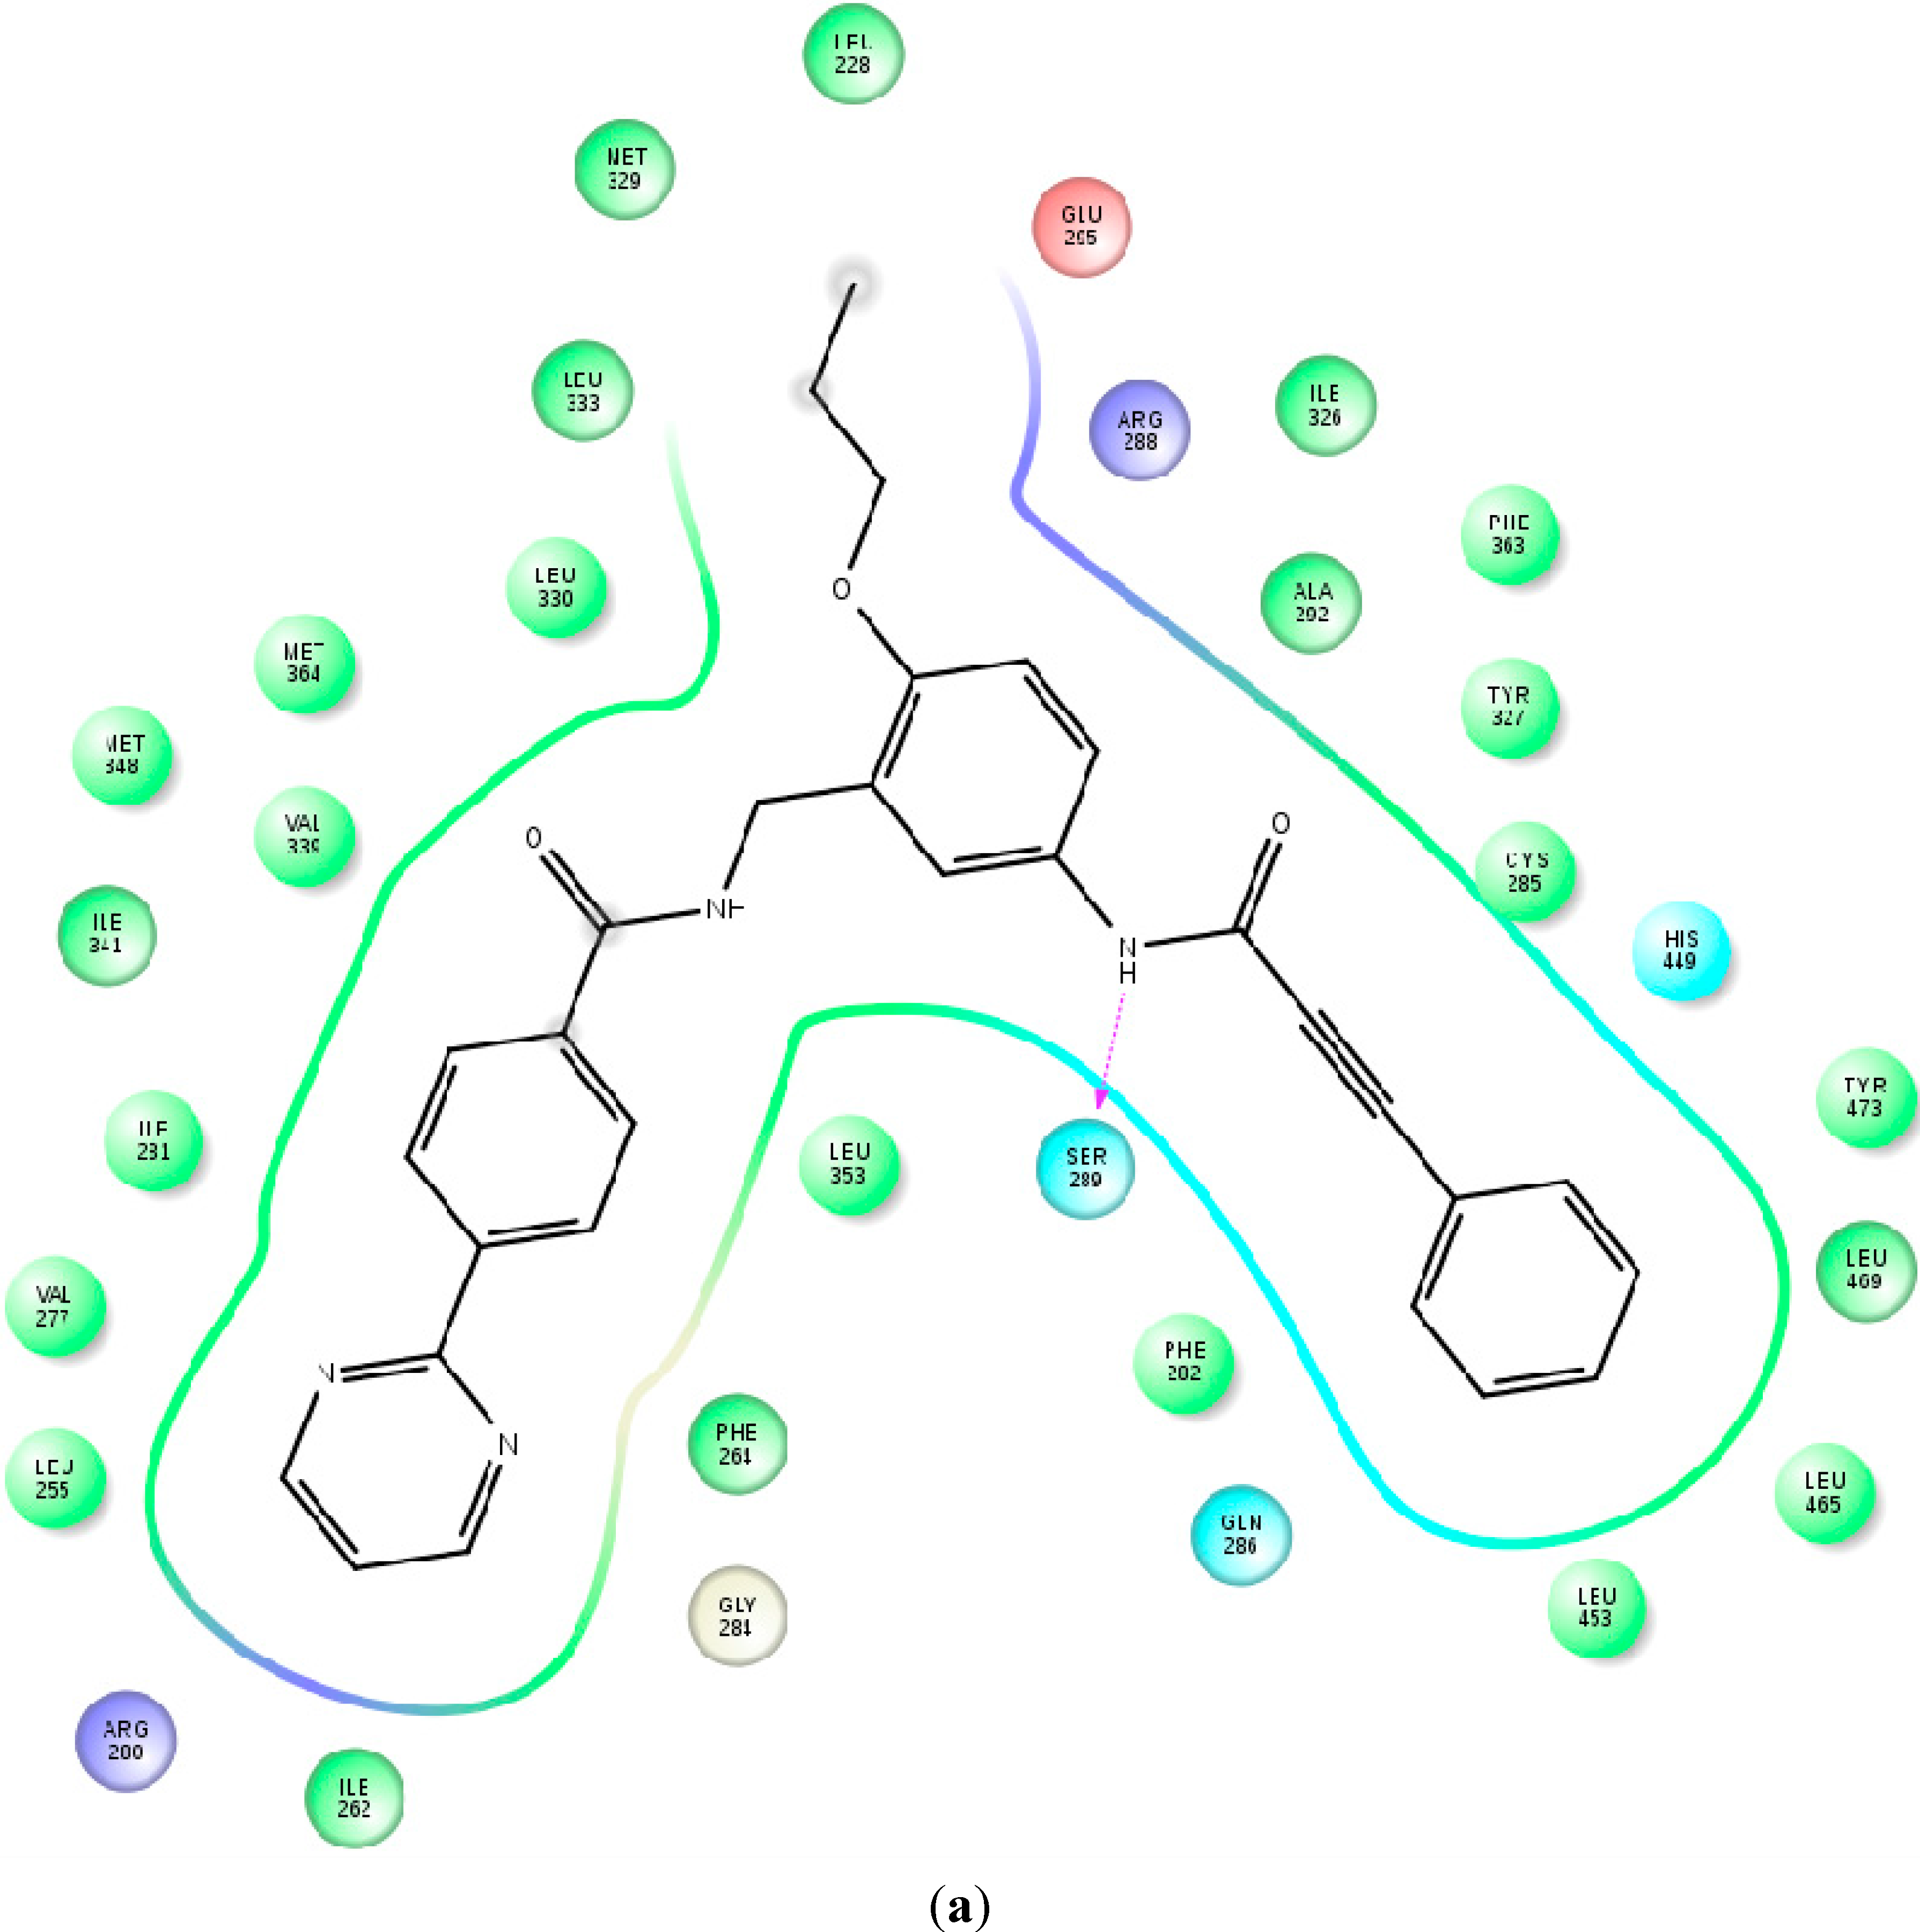
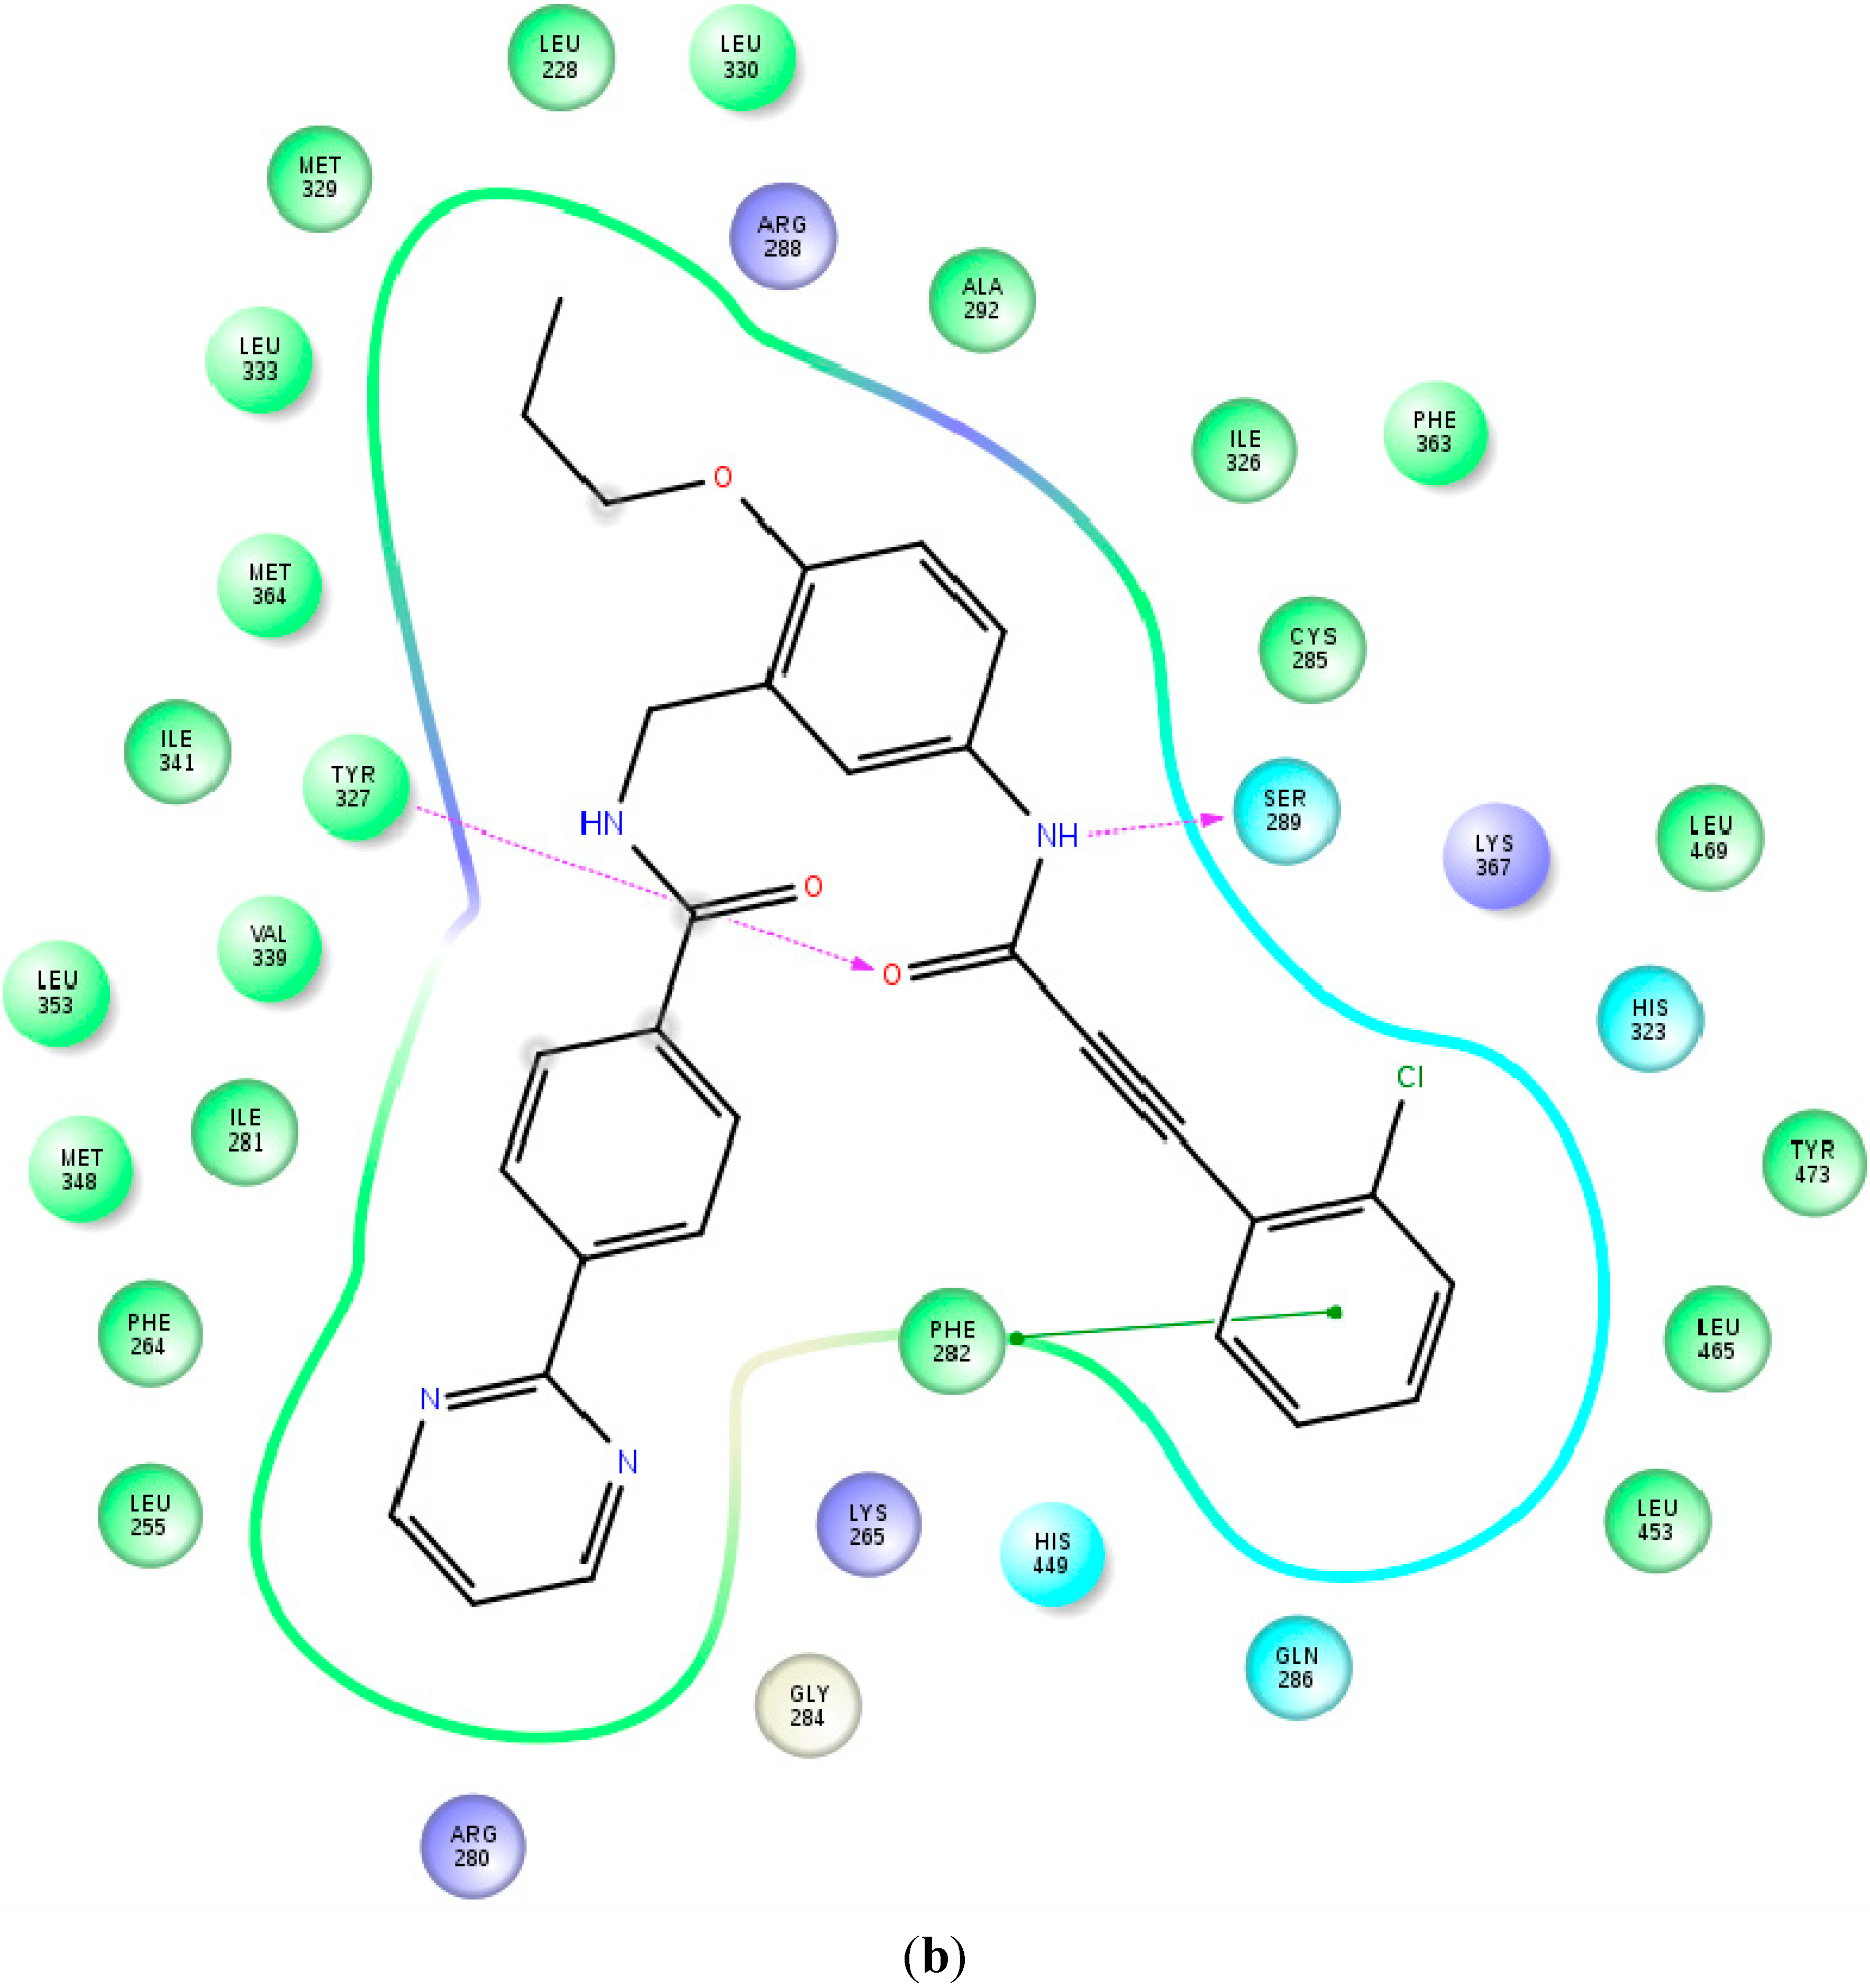
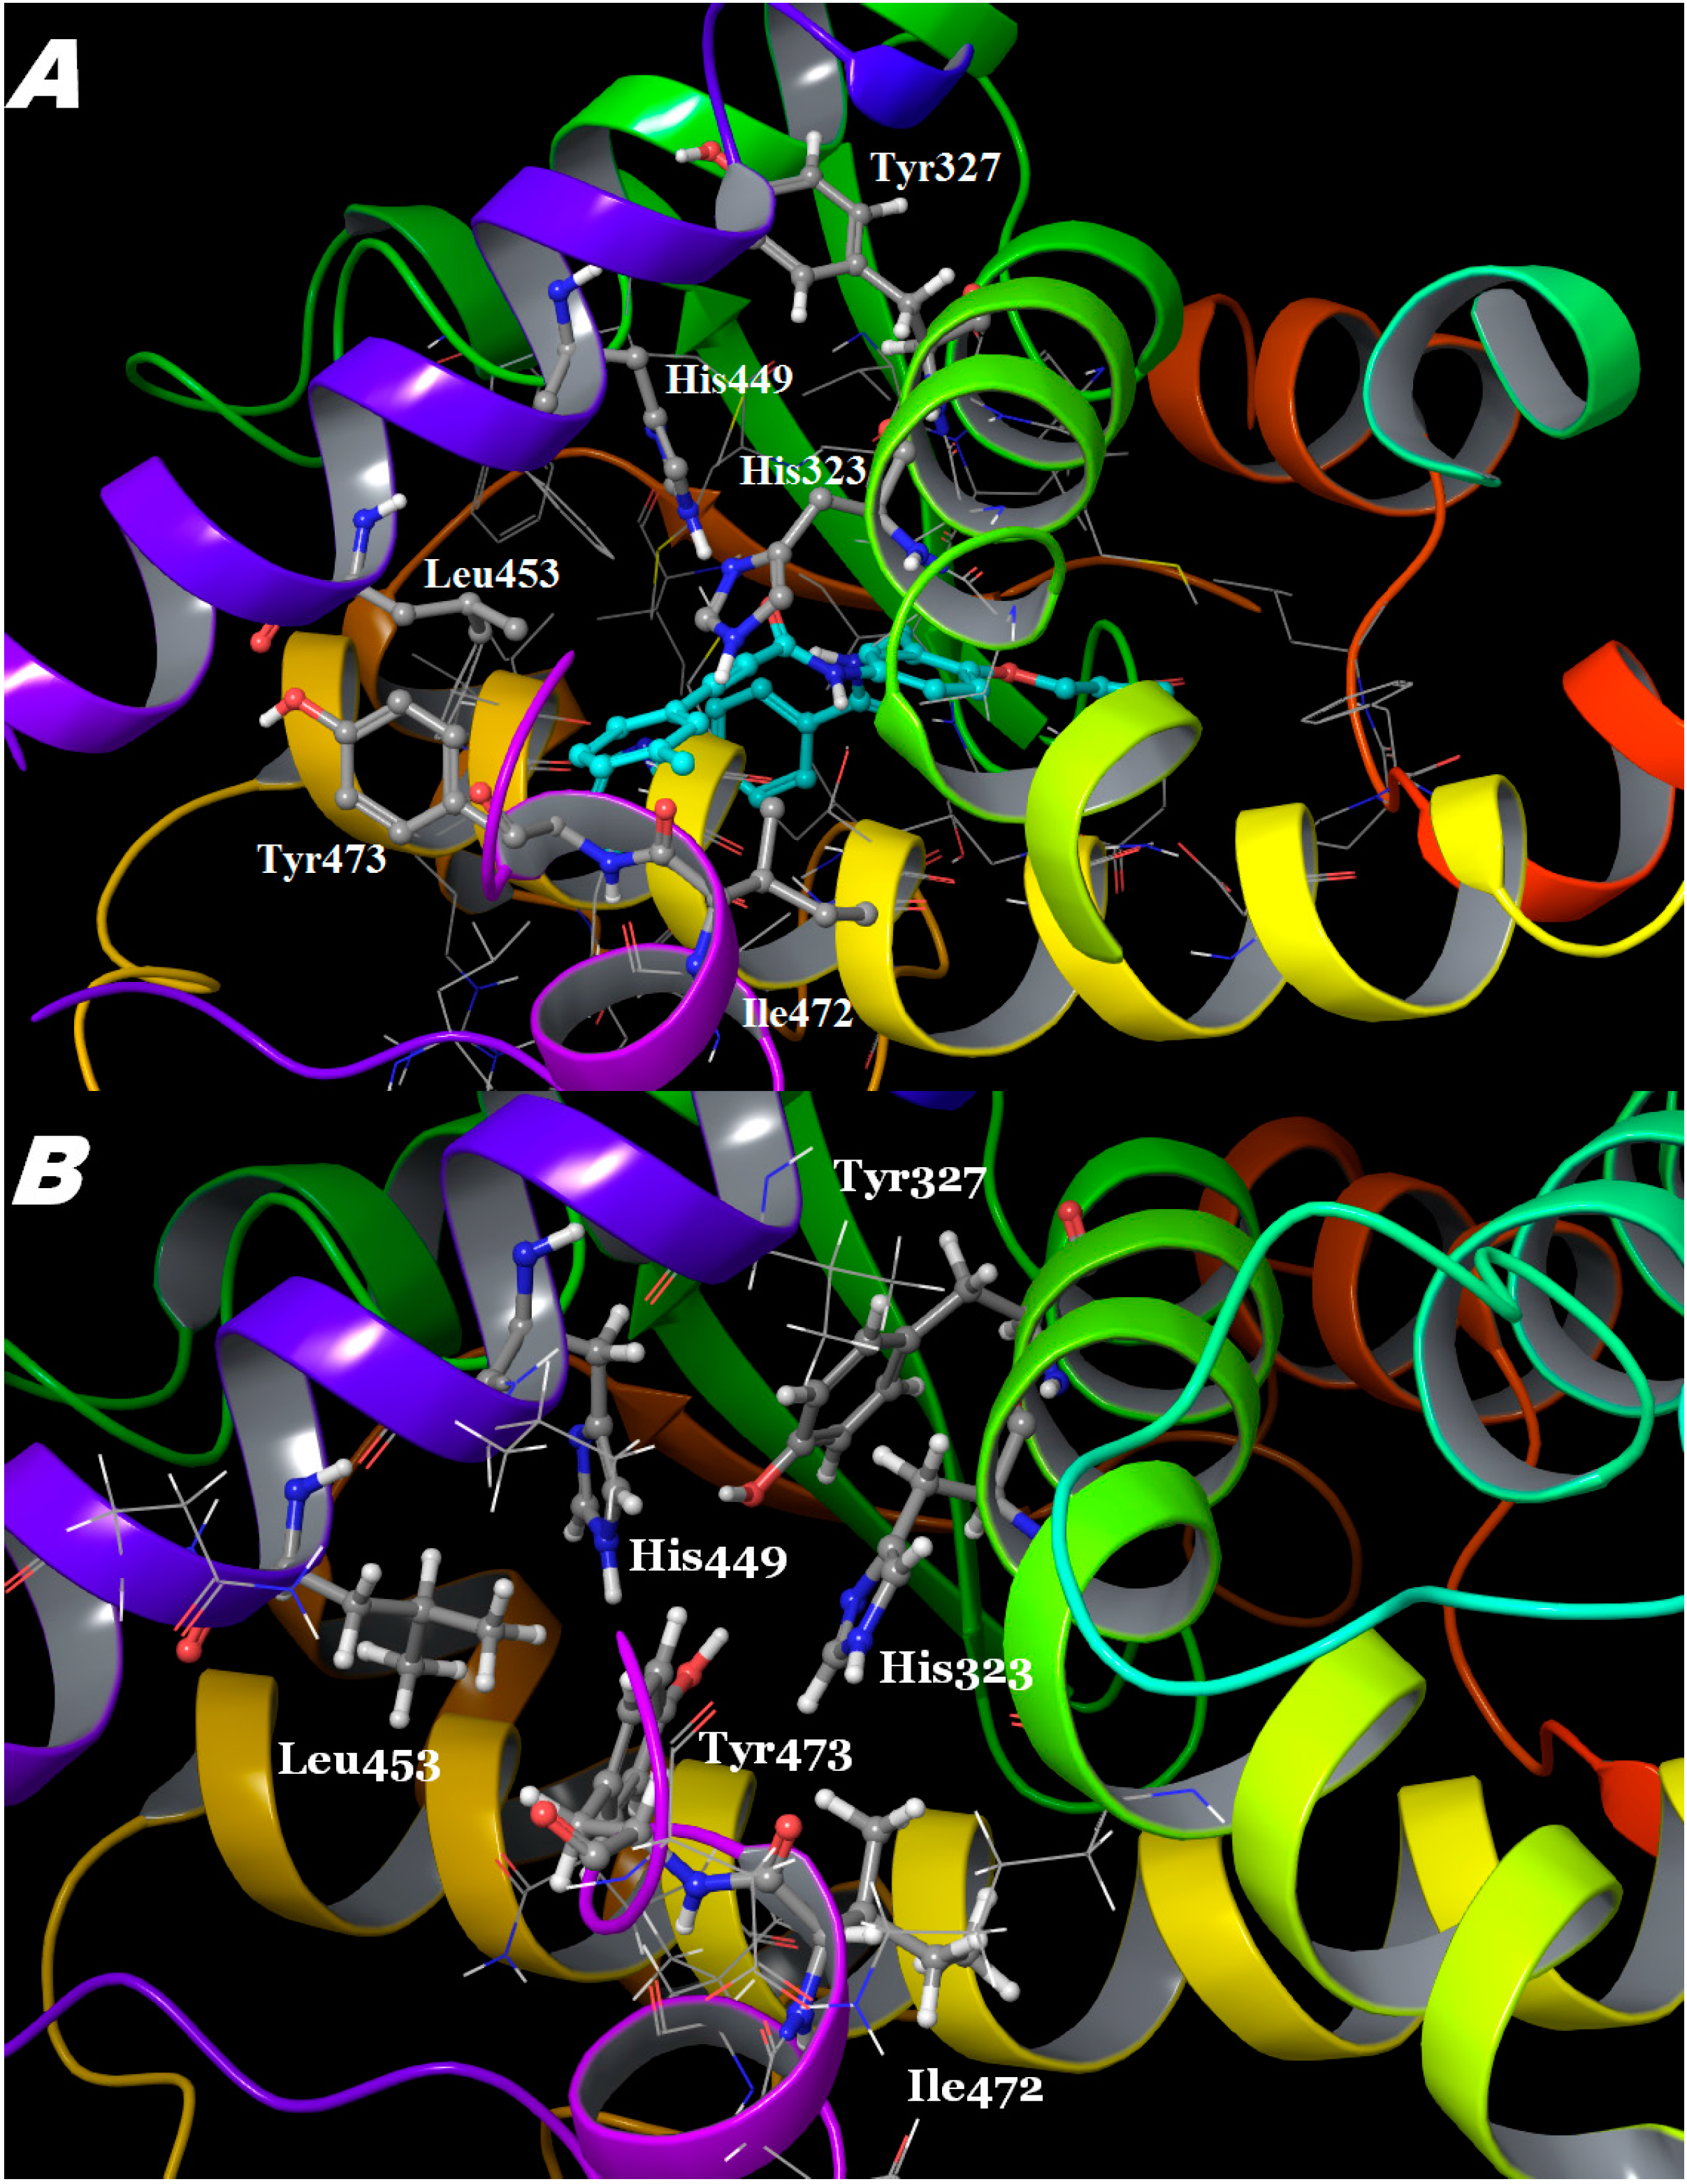
2.2. Binding Mode and Free Energies of the Lead Compound 9i
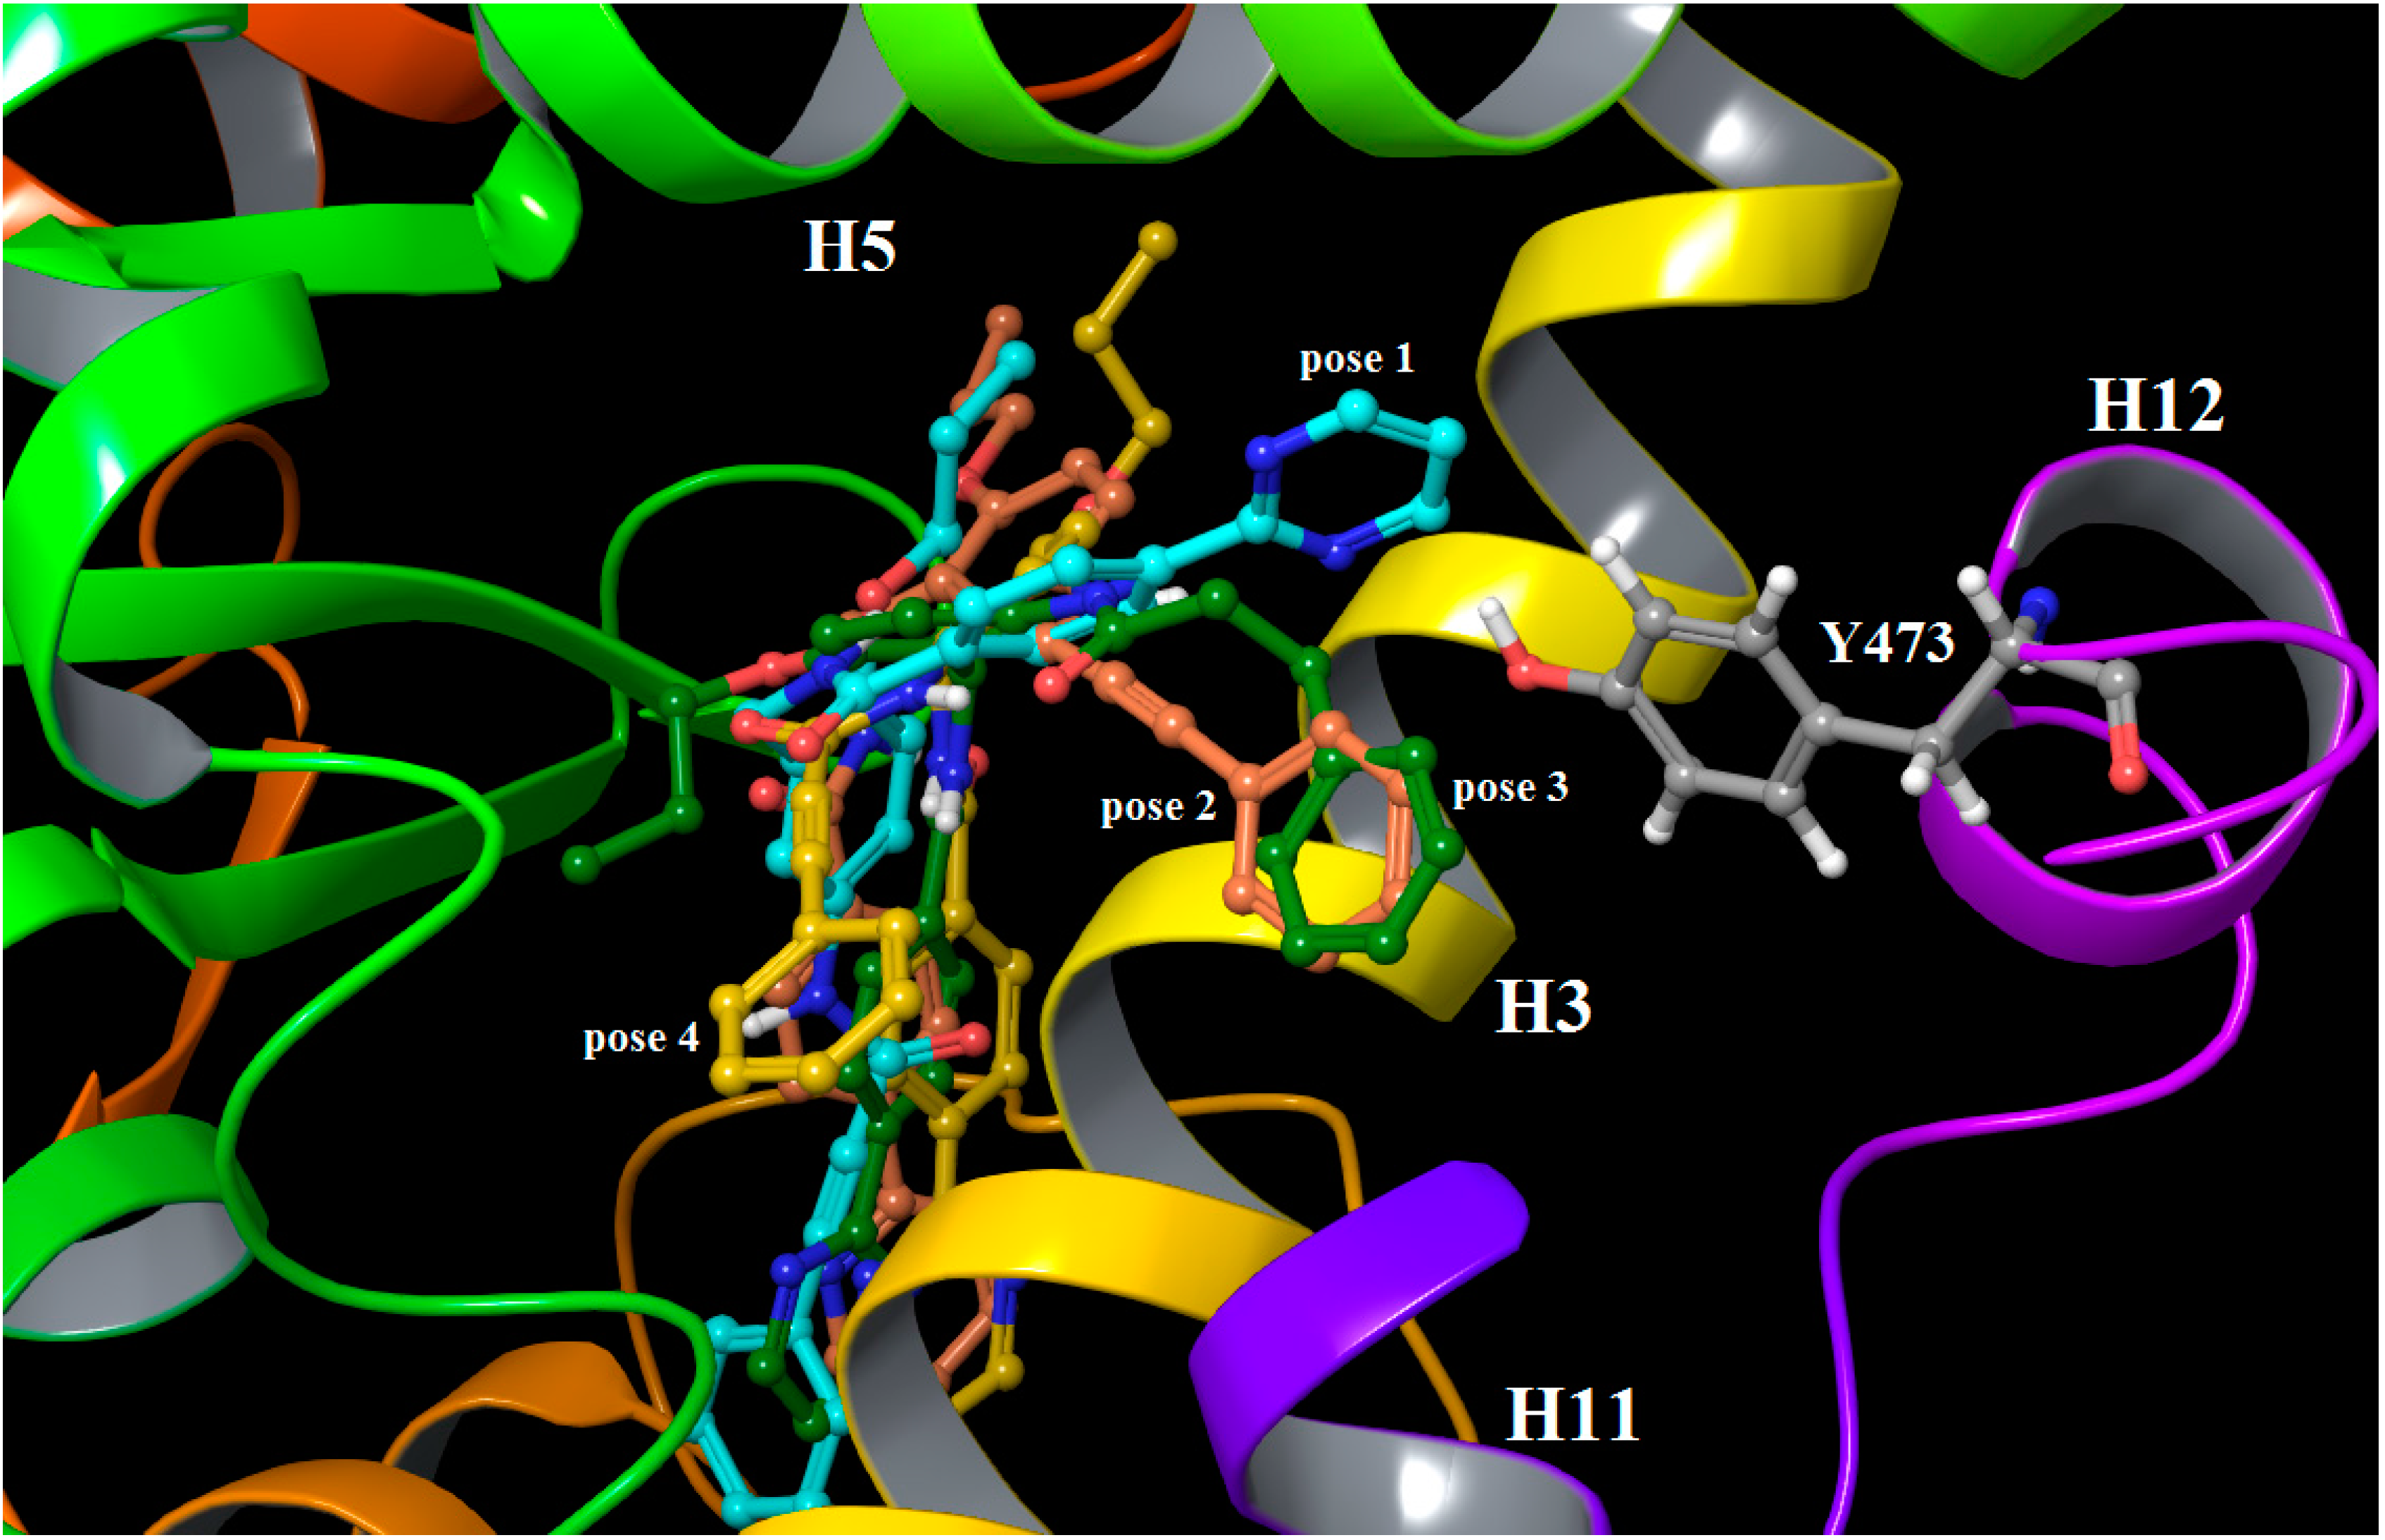
2.3. Binding Mode, Mechanism of Action and Free Energies of the Selected Partial Agonists and Full Antagonists
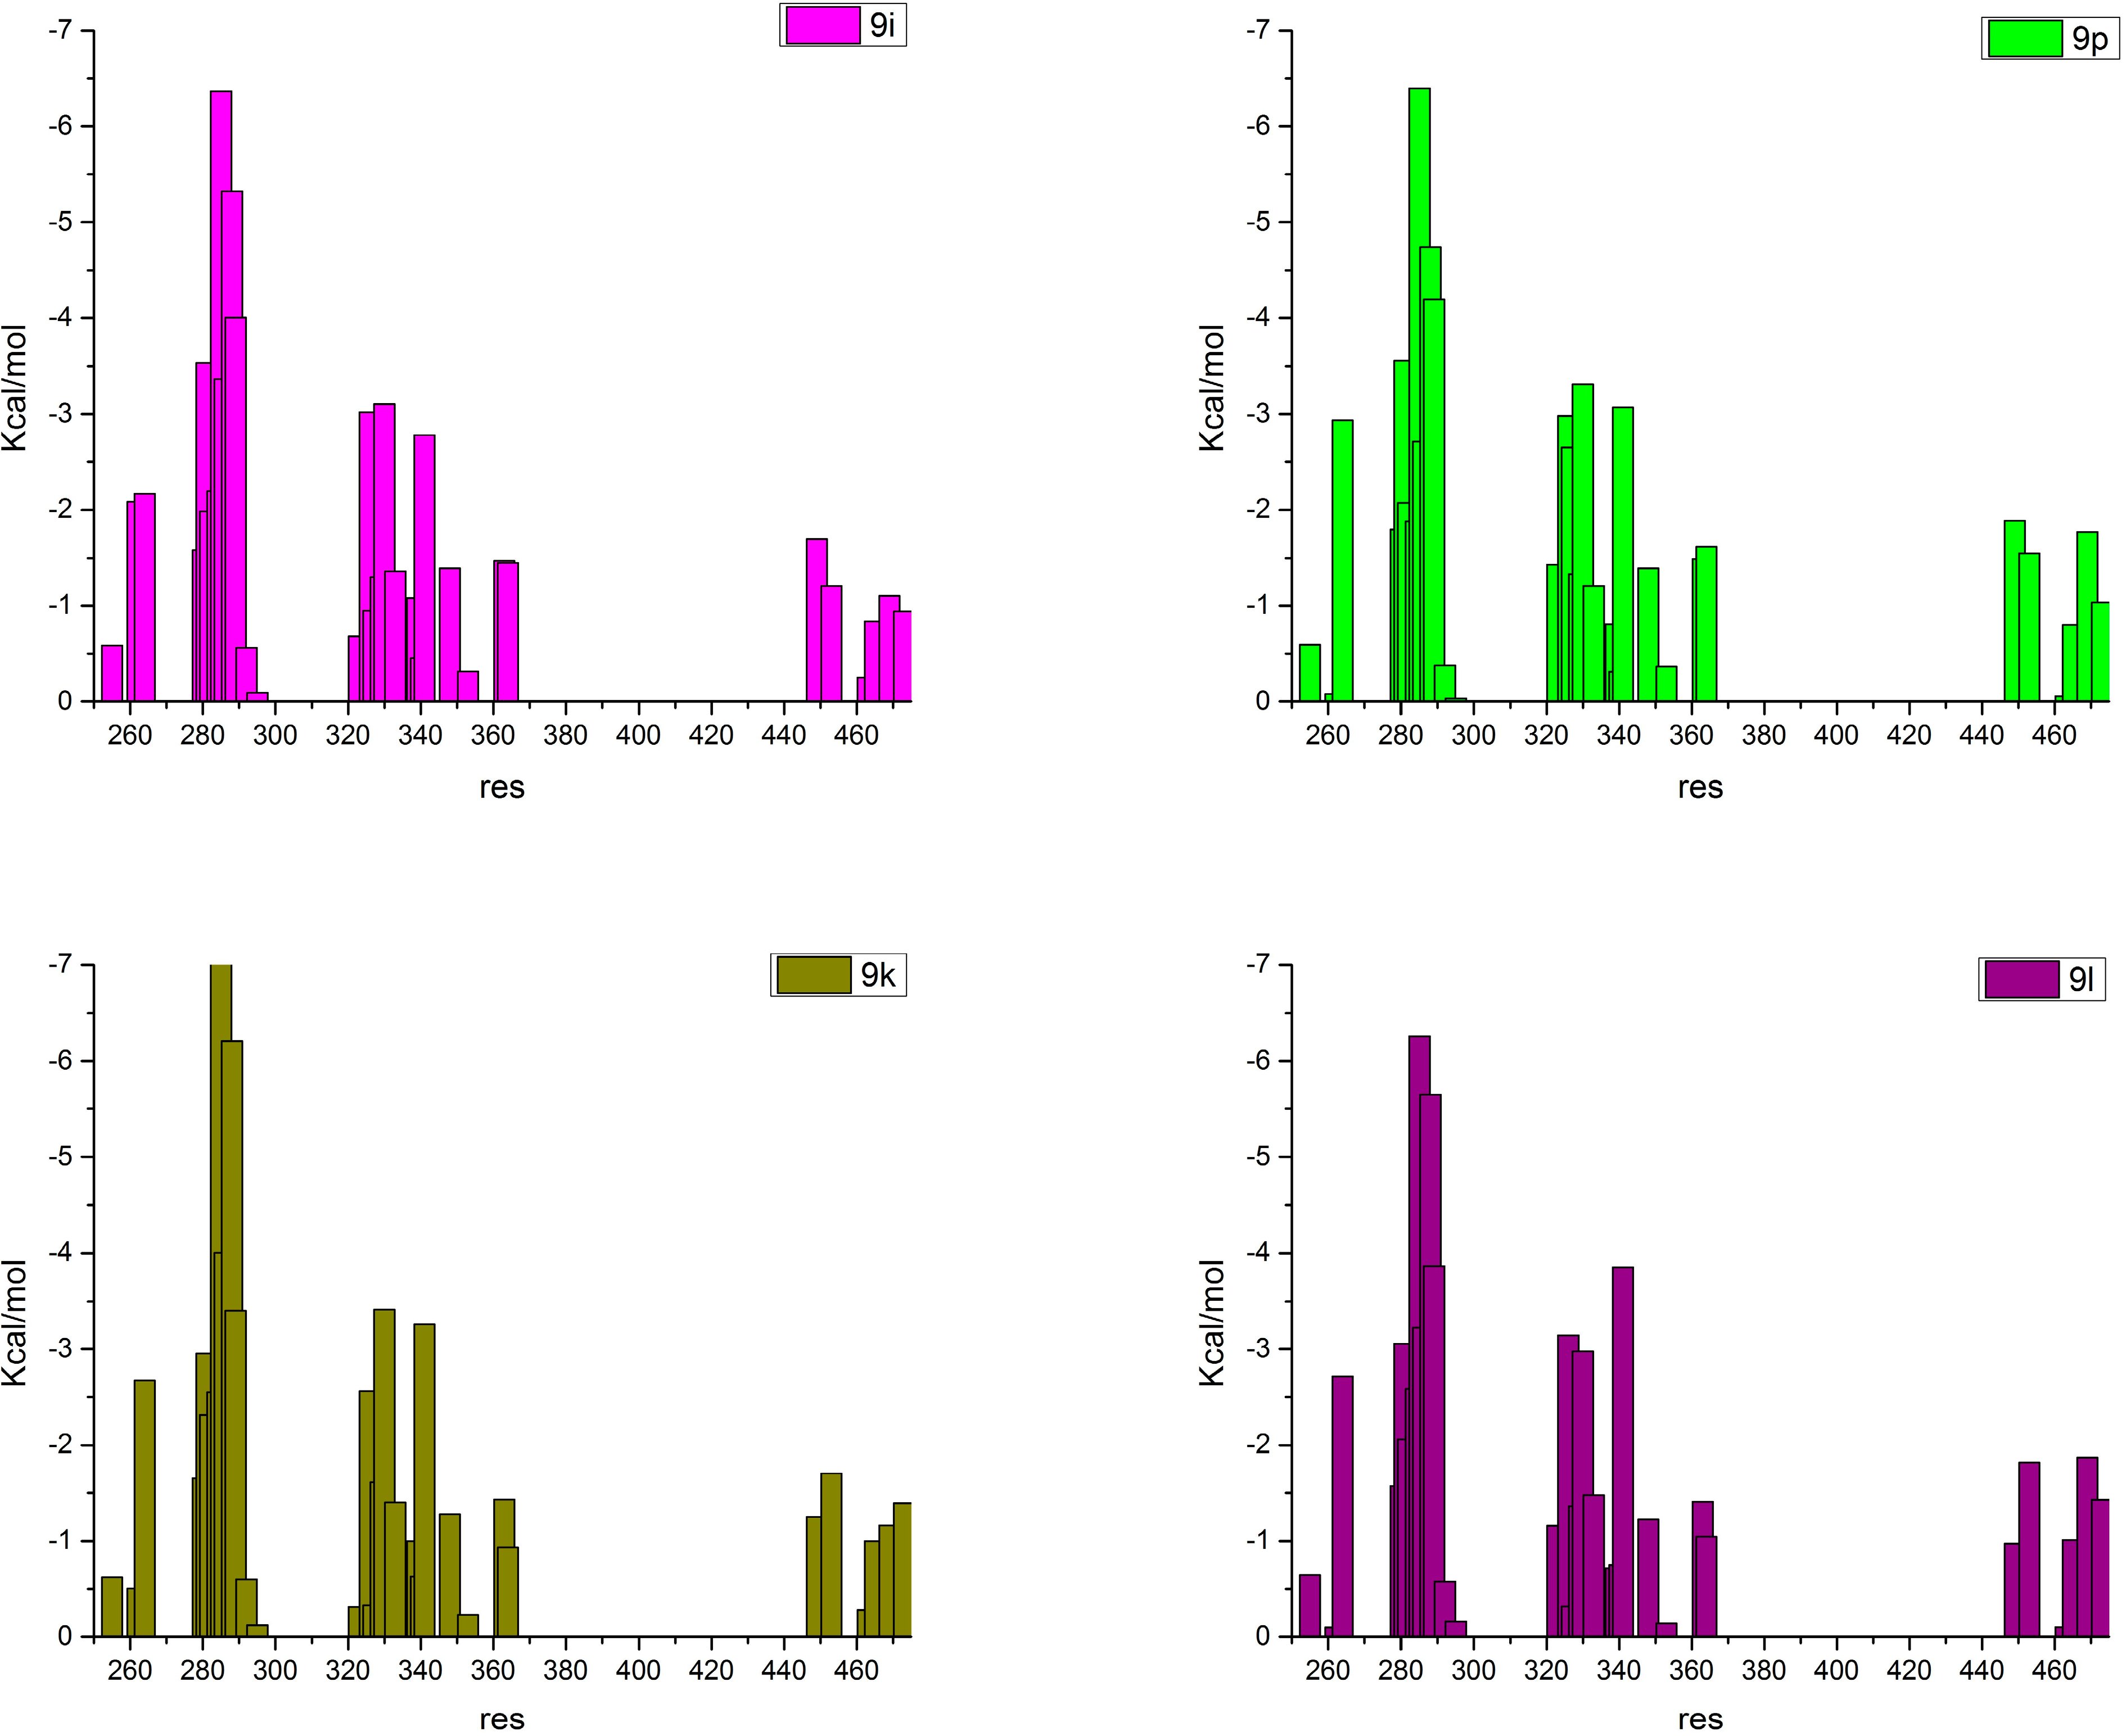
2.4. Contributions of the Individual Residues to the Free Energy of Binding/Mechanism of Action
3. Experimental Section
3.1. Structural and Activity Data
3.2. Protein Preparation
3.3. Docking
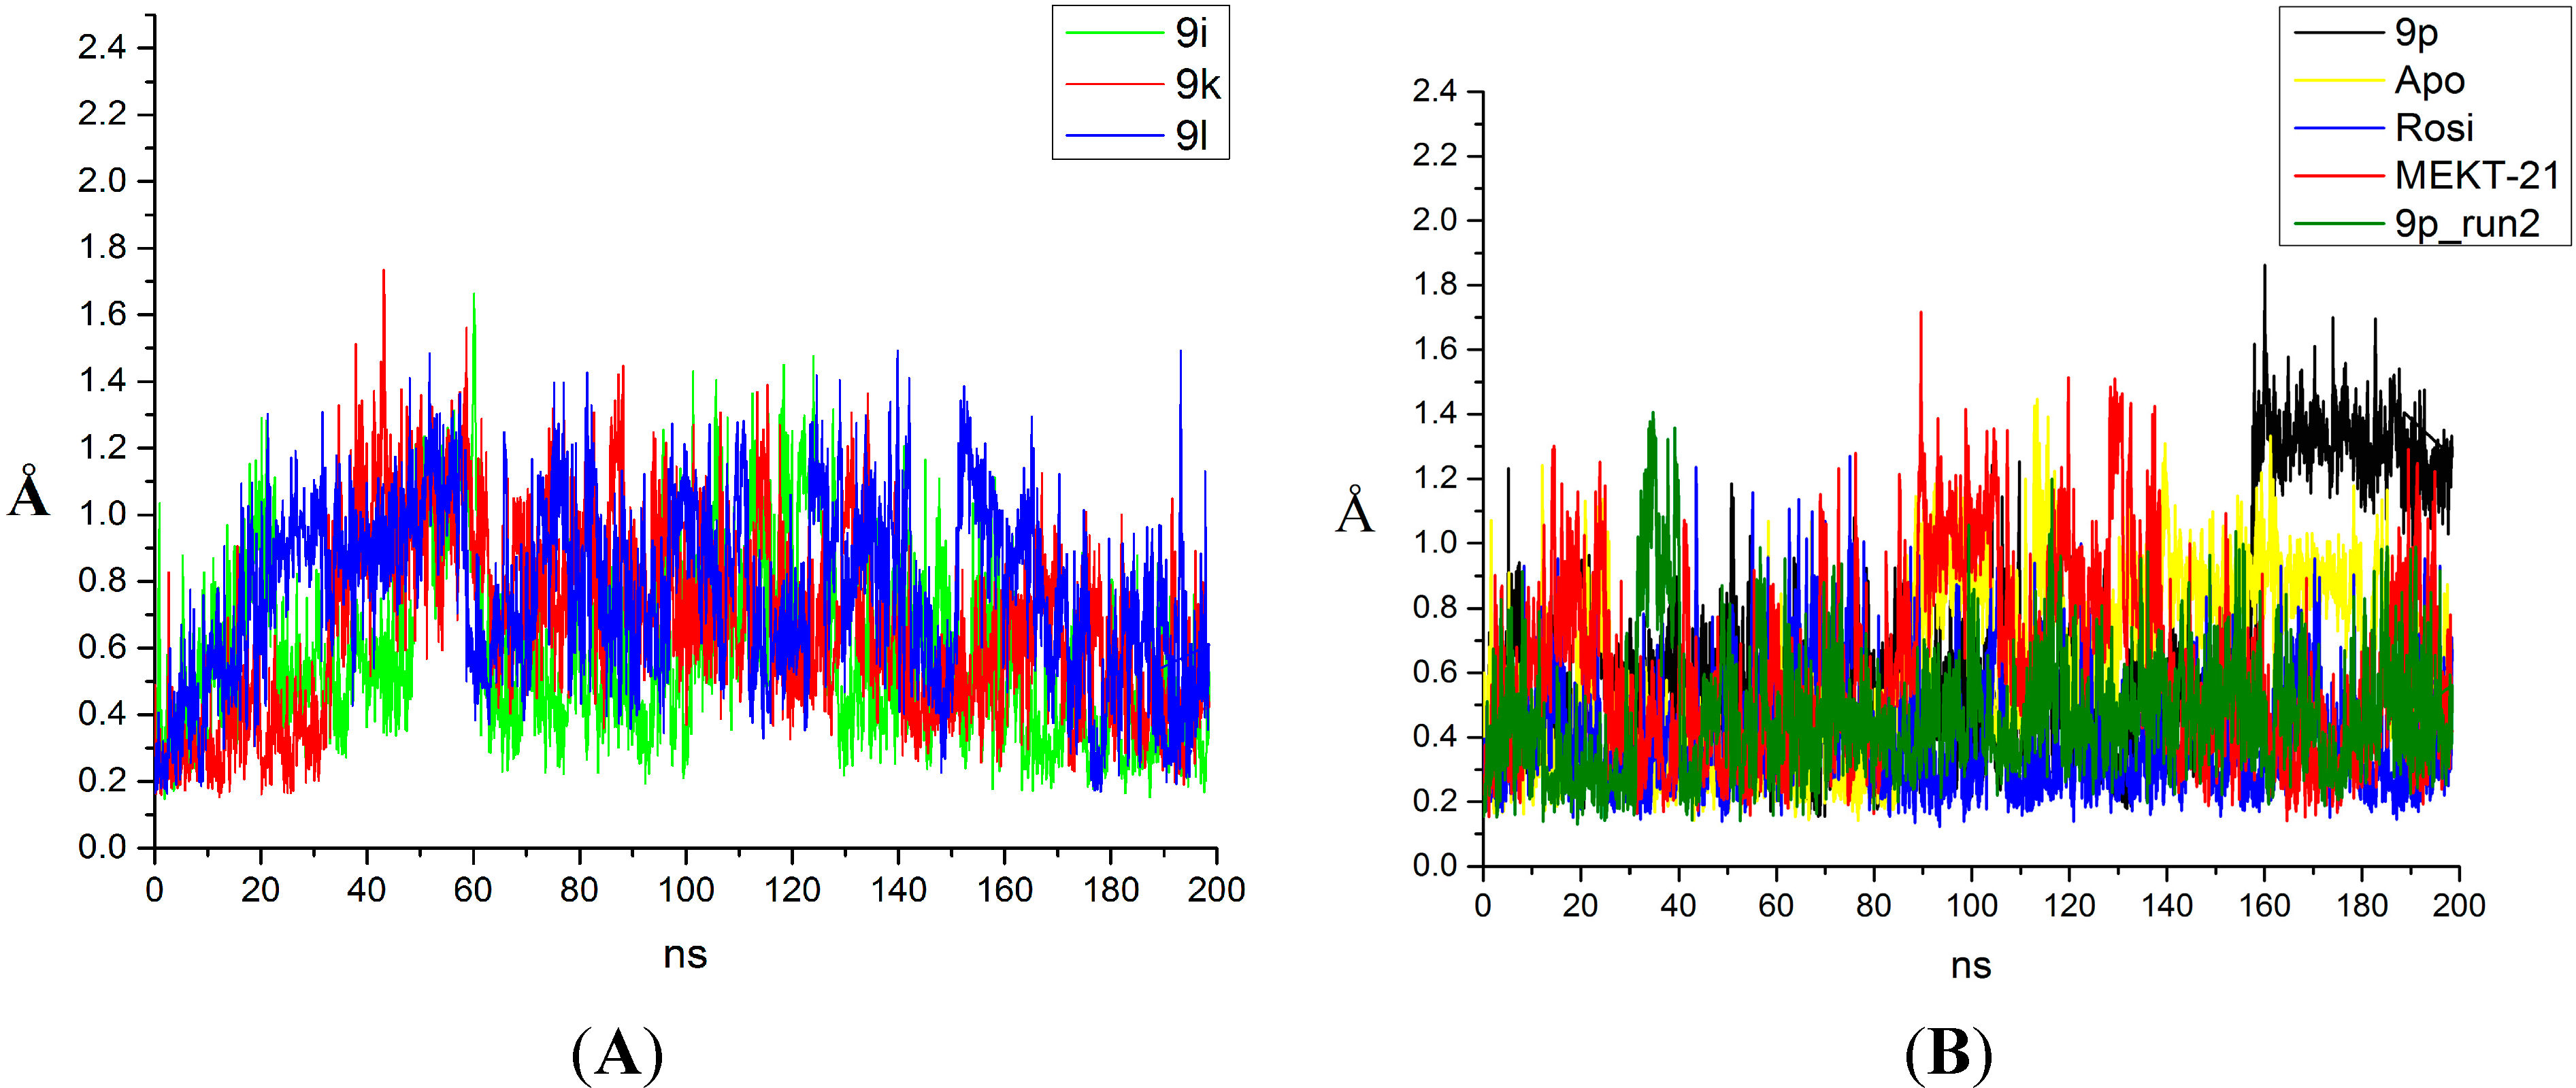
3.4. Molecular Dynamics
3.5. Free Energy Estimation
4. Conclusions
Supplementary Materials
Acknowledgments
Author Contributions
Conflicts of Interest
References
- Bruning, J.B.; Chalmers, M.J.; Prasad, S.; Busby, S.A.; Kamenecka, T.M.; He, Y.; Nettles, K.W.; Griffin, P.R. Partial agonists activate PPARγ using a helix 12 independent mechanism. Structure 2007, 15, 1258–1271. [Google Scholar] [PubMed]
- Hamuro, Y.; Coales, S.J.; Morrow, J.A.; Molnar, K.S.; Tuske, S.J.; Southern, M.R.; Griffin, P.R. Hydrogen/deuterium-exchange (H/D-Ex) of PPARγ LBD in the presence of various modulators. Protein Sci. 2006, 15, 1883–1892. [Google Scholar]
- Hughes, T.S.; Chalmers, M.J.; Novick, S.; Kuruvilla, D.S.; Chang, M.R.; Kamenecka, T.M.; Rance, M.; Johnson, B.A.; Burris, T.P.; Griffin, P.R.; et al. Ligand and receptor dynamics contribute to the mechanism of graded PPARγ agonism. Structure 2012, 20, 139–150. [Google Scholar] [PubMed]
- Batista, M.R.; Martínez, L. Dynamics of nuclear receptor Helix-12 switch of transcription activation by modeling time-resolved fluorescence anisotropy decays. Biophys. J. 2013, 105, 1670–1680. [Google Scholar] [PubMed]
- Dixit, V.A.; Bharatam, P.V. SAR and computer-aided drug design approaches in the discovery of peroxisome proliferator-activated receptor γ activators: A perspective. J. Comput. Med. 2013, 2013, 406049. [Google Scholar] [CrossRef]
- Berman, H.M.; Westbrook, J.; Feng, Z.; Gilliland, G.; Bhat, T.N.; Weissig, H.; Shindyalov, I.N.; Bourne, P.E. The protein data bank. Nucleic Acids Res. 2000, 28, 235–242. [Google Scholar] [CrossRef] [PubMed]
- Ohashi, M.; Gamo, K.; Tanaka, Y.; Waki, M.; Beniyama, Y.; Matsuno, K.; Wada, J.; Tenta, M.; Eguchi, J.; Makishima, M.; et al. Structural design and synthesis of arylalkynyl amide-type peroxisome proliferator-activated receptor γ (PPARγ)-selective antagonists based on the helix12-folding inhibition hypothesis. Eur. J. Med. Chem. 2015, 90, 53–67. [Google Scholar] [CrossRef] [PubMed]
- Ye, F.; Zhang, Z.S.; Luo, H.B.; Shen, J.H.; Chen, K.X.; Shen, X.; Jiang, H.L. The dipeptide H-Trp-Glu-OH shows highly antagonistic activity against PPARγ: Bioassay with molecular modeling simulation. Chembiochem: Eur. J. Chem. Biol. 2006, 7, 74–82. [Google Scholar] [CrossRef] [PubMed]
- Heidis, S.C.; Archana, C.; Todd, L. A novel potent antagonist of peroxisome proliferator-activated receptor g blocks adipocyte differentiation but does not revert the phenotype of terminally differentiated adipocytes. Endocrinology 2001, 142, 3207–3213. [Google Scholar]
- Nolte, R.T.; Wisely, G.B.; Westin, S.; Cobb, J.E.; Lambert, M.H.; Kurokawa, R.; Rosenfeld, M.G.; Willson, T.M.; Glass, C.K.; Milburn, M.V. Ligand binding and co-activator assembly of the peroxisome proliferator-activated receptor-γ. Nature 1998, 395, 137–143. [Google Scholar] [PubMed]
- Tanenbaum, D.M.; Wang, Y.; Williams, S.P.; Sigler, P.B. Crystallographic comparison of the estrogen and progesterone receptor’s ligand binding domains. Proc. Natl. Acad. Sci. USA 1998, 95, 5998–6003. [Google Scholar] [CrossRef] [PubMed]
- Fratev, F. Activation helix orientation of the estrogen receptor is mediated by receptor dimerization: Evidence from molecular dynamics simulations. Phys. Chem. Chem. Phys. 2015, 17, 13403–13420. [Google Scholar] [CrossRef] [PubMed]
- Hughes, T.S.; Giri, P.K.; de Vera, I.M.; Marciano, D.P.; Kuruvilla, D.S.; Shin, Y.; Blayo, A.L.; Kamenecka, T.M.; Burris, T.P.; Griffin, P.R.; et al. An alternate binding site for PPARγ ligands. Nat. Commun. 2014, 5, 3571. [Google Scholar] [CrossRef] [PubMed]
- Gampe, R.T., Jr.; Montana, V.G.; Lambert, M.H.; Miller, A.B.; Bledsoe, R.K.; Milburn, M.V.; Kliewer, S.A.; Willson, T.M.; Xu, H.E. Asymmetry in the PPARγ/RXRα crystal structure reveals the molecular basis of heterodimerization among nuclear receptors. Mol. Cell 2000, 5, 545–555. [Google Scholar] [CrossRef] [PubMed]
- Ohashi, M.; Oyama, T.; Putranto, E.W.; Waku, T.; Nobusada, H.; Kataoka, K.; Matsuno, K.; Yashiro, M.; Morikawa, K.; Huh, N.H.; et al. Design and synthesis of a series of α-benzyl phenylpropanoic acid-type peroxisome proliferator-activated receptor (PPAR) γ partial agonists with improved aqueous solubility. Bioorg. Med. Chem. 2013, 21, 2319–2332. [Google Scholar] [CrossRef] [PubMed]
- Oyama, T.; Ohashi, M.; Miyachi, H.; Kusunoki, M. Human PPRR γ ligand binding domain in complex with a γ selective synthetic partial agonist MEKT75. Unpublished work. 2015. [Google Scholar]
- Galindo-Murillo, R.; Roe, D.R.; Cheatham, T.E., III. Convergence and reproducibility in molecular dynamics simulations of the DNA duplex d(GCACGAACGAACGAACGC). Biochim. Biophys. Acta 2015, 1850, 1041–1058. [Google Scholar] [CrossRef] [PubMed]
- Bergonzo, C.; Henriksen, N.M.; Roe, D.R.; Swails, J.M.; Roitberg, A.E.; Cheatham, T.E., III. Multidimensional replica exchange molecular dynamics yields a converged ensemble of an RNA tetranucleotide. J. Chem. Theory Comput. 2014, 10, 492–499. [Google Scholar] [CrossRef] [PubMed]
- Hou, T.; Wang, J.; Li, Y.; Wang, W. Assessing the performance of the MM/PBSA and MM/GBSA methods. 1. The accuracy of binding free energy calculations based on molecular dynamics simulations. J. Chem. Inf. Model. 2011, 51, 69–82. [Google Scholar] [CrossRef] [PubMed]
- Dai, S.Y.; Chalmers, M.J.; Bruning, J.; Bramlett, K.S.; Osborne, H.E.; Montrose-Rafizadeh, C.; Barr, R.J.; Wang, Y.; Wang, M.; Burris, T.P.; et al. Prediction of the tissue-specificity of selective estrogen receptor modulators by using a single biochemical method. Proc. Natl. Acad. Sci. USA 2008, 105, 7171–7176. [Google Scholar] [CrossRef] [PubMed]
- Sarraf, P.; Mueller, E.; Smith, W.M.; Wright, H.M.; Kum, J.B.; Aaltonen, L.A.; de la Chapelle, A.; Spiegelman, B.M.; Eng, C. Loss-of-function mutations in PPARγ associated with human colon cancer. Mol. Cell 1999, 3, 799–804. [Google Scholar] [CrossRef]
- Molnár, F.; Matilainen, M.; Carlberg, C. Structural determinants of the agonist-independent association of human peroxisome proliferator-activated receptors with coactivators. J. Biol. Chem. 2005, 280, 26543–26556. [Google Scholar] [CrossRef] [PubMed]
- Gurnell, M.; Wentworth, J.M.; Agostini, M.; Adams, M.; Collingwood, T.N.; Provenzano, C.; Browne, P.O.; Rajanayagam, O.; Burris, T.P.; Schwabe, J.W.; et al. A dominant-negative peroxisome proliferator-activated receptor γ (PPARγ) mutant is a constitutive repressor and inhibits PPARγ-mediated adipogenesis. J. Biol. Chem. 2000, 275, 5754–5759. [Google Scholar] [CrossRef] [PubMed]
- Yu, Y.; Correll, P.H.; Vanden Heuvel, J.P. Conjugated linoleic acid decreases production of pro-inflammatory products in macrophages: Evidence for a PPAR γ-dependent mechanism. Biochim. Biophys. Acta 2002, 1581, 89–99. [Google Scholar] [CrossRef]
- Pochetti, G.; Mitro, N.; Lavecchia, A.; Gilardi, F.; Besker, N.; Scotti, E.; Aschi, M.; Re, N.; Fracchiolla, G.; Laghezza, A.; et al. Structural insight into peroxisome proliferator-activated receptor γ binding of two ureidofibrate-like enantiomers by molecular dynamics, cofactor interaction analysis, and site-directed mutagenesis. J. Med. Chem. 2010, 53, 4354–4366. [Google Scholar] [CrossRef] [PubMed]
- Molecular Operating Environment (MOE). 2014.091; Chemical Computing Group Inc.: Montreal, QC, Canada, 2015.
- Verdonk, M.L.; Chessari, G.; Cole, J.C.; Hartshorn, M.J.; Murray, C.W.; Nissink, J.W.; Taylor, R.D.; Taylor, R. Modeling water molecules in protein-ligand docking using GOLD. J. Med. Chem. 2005, 48, 6504–6515. [Google Scholar] [CrossRef] [PubMed]
- Schrödinger Release 2015–1: Maestro, version 10.1, Schrödinger; LLC: New York, NY, USA, 2015.
- Case, D.A.; Darden, T.A.; Cheatham, T.E., III; Simmerling, C.L.; Wang, J.; Duke, R.E.; Luo, R.; Walker, R.C.; Zhang, W.; Merz, K.M.; et al. AMBER 14; University of California: San Francisco, CA, USA, 2014. [Google Scholar]
- Salomon-Ferrer, R.; Goetz, V.; Poole, D.; le Grand, S.; Walker, R.C. Routine microsecond molecular dynamics simulations with AMBER on GPUs. 2. Explicit solvent particle mesh Ewald. J. Chem. Theory Comput. 2013, 9, 3878–3888. [Google Scholar] [CrossRef]
- Le Grand, S.; Goetz, A.W.; Walker, R.C. SPFP: Speed without compromise—A mixed precision model for GPU accelerated molecular dynamics simulations. Comput. Phys. Commun. 2013, 184, 374–380. [Google Scholar] [CrossRef]
- Tsakovska, I.; Al Sharif, M.; Alov, P.; Diukendjieva, A.; Fioravanzo, E.; Cronin, M.T.; Pajeva, I. Molecular modelling study of the PPARγ receptor in relation to the mode of action/adverse outcome pathway framework for liver steatosis. Int. J. Mol. Sci. 2014, 15, 7651–7666. [Google Scholar] [CrossRef] [PubMed]
- Ryckaert, J.P.; Ciccotti, G.; Berendsen, H.J.C. Numerical integration of the cartesian equations of motion of a system with constraints: molecular dynamics of n-alkanes. J. Comput. Phys. 1977, 23, 327–341. [Google Scholar] [CrossRef]
- Petersen, H.G. Accuracy and efficiency of the particle mesh Ewald method. J. Chem. Phys. 1995, 103, 3668–3679. [Google Scholar] [CrossRef]
- Roe, D.R.; Bergonzo, C.; Cheatham, T.E., III. Evaluation of enhanced sampling provided by accelerated molecular dynamics with Hamiltonian replica exchange methods. J. Phys. Chem. B 2014, 118, 3543–3552. [Google Scholar] [CrossRef] [PubMed]
- Miller, B.R., III; McGee, T.D.; Swails, J.M.; Homeyer, N.; Gohlke, H.; Roitberg, A.E. MMPBSA.py: An efficient program for end-state free energy calculations. J. Chem. Theory Comput. 2012, 8, 3314–3321. [Google Scholar] [CrossRef]
- Kouskoumvekaki, I.; Petersen, R.K.; Fratev, F.; Taboureau, O.; Nielsen, T.E.; Oprea, T.I.; Sonne, S.B.; Flindt, E.N.; Jónsdóttir, S.Ó.; Kristiansen, K. Discovery of a novel selective PPARγ ligand with partial agonist binding properties by integrated in silico/in vitro workflow. J. Chem. Inf. Model. 2013, 53, 923–937. [Google Scholar] [CrossRef] [PubMed]
- Fratev, F.; Jónsdóttir , S.Ó.; Pajeva, I. Structural insight into the UNC-45-myosin complex. Proteins 2013, 81, 1212–1221. [Google Scholar] [CrossRef] [PubMed]
- Fratev, F.; Mihaylova, E.; Pajeva, I. Combination of genetic screening and molecular dynamics as a useful tool for identification of disease-related mutations: ZASP PDZ domain G54S mutation case. J. Chem. Inf. Model. 2014, 54, 1524–1536. [Google Scholar] [CrossRef] [PubMed]
© 2015 by the authors; licensee MDPI, Basel, Switzerland. This article is an open access article distributed under the terms and conditions of the Creative Commons Attribution license (http://creativecommons.org/licenses/by/4.0/).
Share and Cite
Fratev, F.; Tsakovska, I.; Al Sharif, M.; Mihaylova, E.; Pajeva, I. Structural and Dynamical Insight into PPARγ Antagonism: In Silico Study of the Ligand-Receptor Interactions of Non-Covalent Antagonists. Int. J. Mol. Sci. 2015, 16, 15405-15424. https://doi.org/10.3390/ijms160715405
Fratev F, Tsakovska I, Al Sharif M, Mihaylova E, Pajeva I. Structural and Dynamical Insight into PPARγ Antagonism: In Silico Study of the Ligand-Receptor Interactions of Non-Covalent Antagonists. International Journal of Molecular Sciences. 2015; 16(7):15405-15424. https://doi.org/10.3390/ijms160715405
Chicago/Turabian StyleFratev, Filip, Ivanka Tsakovska, Merilin Al Sharif, Elina Mihaylova, and Ilza Pajeva. 2015. "Structural and Dynamical Insight into PPARγ Antagonism: In Silico Study of the Ligand-Receptor Interactions of Non-Covalent Antagonists" International Journal of Molecular Sciences 16, no. 7: 15405-15424. https://doi.org/10.3390/ijms160715405