Article

Casein Kinase 1 Epsilon Expression Predicts Poorer Prognosis in Low T-Stage Oral Cancer Patients

1
Institute of Medicine, Chung Shan Medical University, Taichung 402, Taiwan
2
Department of Surgical Pathology, Changhua Christian Hospital, Changhua 500, Taiwan
3
Department of Medical Technology, Jen-Teh Junior College of Medicine, Nursing and Management, Miaoli 356, Taiwan
4
School of Medicine, Chung Shan Medical University, Taichung 402, Taiwan
5
Tumor Center, Changhua Christian Hospital, Changhua 500, Taiwan
6
Department of Information Management, Chien kuo Technology University, Changhua 500, Taiwan
7
Department of Medical Research, Chung Shan Medical University Hospital, Taichung 402, Taiwan
*
Authors to whom correspondence should be addressed.
These authors contributed equally to this work.
Int. J. Mol. Sci. 2014, 15(2), 2876-2891; https://doi.org/10.3390/ijms15022876
Submission received: 24 December 2013 / Revised: 13 February 2014 / Accepted: 17 February 2014 / Published: 19 February 2014

Abstract

:
Casein kinase 1 is a group of ubiquitous serine/threonine kinases that are involved in normal cellular functions and several pathological conditions, such as DNA repair, cell cycle progression, cytokinesis, differentiation, and apoptosis. Recent studies have indicated that casein kinase 1-epsilon (CK1ɛ) and casein kinase 1-delta (CK1δ) expression has a role in human cancers. We investigated the associations between CK1ɛ and CK1δ expression and the clinical parameters of oral cancer using immunohistochemical study methods on oral squamous cell carcinoma specimens. The results of our immunohistochemical analysis showed that the loss of CK1ɛ expression was greatly associated with a poor four-year survival rate in oral cancer patients (p = 0.002). A Kaplan-Meier analysis showed that patients who had a loss of CK1ɛ expression had a considerably poorer overall survival rate than patients who had positive CK1ɛ expressions (p = 0.022). A univariate analysis revealed that patients who had a loss of CK1ɛ expression had considerably poorer overall survival (OS) than patients who had positive expression (p = 0.024, hazard ratio (HR) = 1.7). In conclusion, our data indicated that the loss of cytoplasmic CK1ɛ expression is greatly associated with poor survival and might be an adverse survival factor.

1. Introduction

Oral squamous cell carcinoma (OSCC) is the fifth most common malignancy in Taiwan; it is also the leading cause of cancer-related deaths worldwide [1,2]. Data that the Bureau of Health Promotion, Department of Health collected in 2012 indicated that patients with oral cancer are more susceptible to develop a secondary cancer than most people [1]. Moreover, patients with oral cancer have a 2.4-fold risk to get secondary cancer than patients with non-oral cancers. Men with oral cancer have a 13.6-fold recurrence rate, which is higher than that of other men with non-oral cancers. Betel chewing, cigarette smoking, and alcohol consumption have been identified as major etiological factors in oral cancer [2,3]. OSCC represents more than 90% of all oral carcinomas. Surgery, radiation therapy and chemotherapy remain the main treatments for OSCC patients, but the therapeutic effects remain unsatisfactory, and the treatment has a poor 5-year-survival rate [4]. The unequivocal prognostic and/or predictive significance of the molecular markers of oral cancer are still not established [510]. A prognostic marker could be used as a therapeutic target to develop effective treatment guidelines for oral cancer.
In recent years, more and more protein kinases and phosphatases have become targets for drug development, and recently, interest in specifically targeting members of the casein kinase 1 (CK1) family has increased [11]. CK1 is one of the family of serine/threonine protein kinases. CK1 kinases exist in at least seven isoforms (α, β, γ1–3, δ, and ɛ) in mammals [12,13] and CK1 kinases phosphorylate various substrates to play vital roles in diverse physiological processes such as DNA repair, cell cycle progression, cytokinesis, differentiation, and apoptosis [1214]. CK1-epsilon (CK1ɛ) is a protein product of the CSNK1E gene and has been shown to be essential in regulating cell division and tumor growth in human pancreatic adenocarcinoma and salivary gland cancer by phosphorylating key proteins in the Wnt signaling pathway [1518]. Changes in CK1ɛ expression and activity as well as the occurrence of mutations within the coding region of CK1ɛ have been reported in various cancers including mammary ductal carcinoma, ovary cancer, and breast cancer [19,20]. Moreover, CK1 epsilon molecules could be used as potential therapeutic targets in the treatment of digestive cancers [20]. However, the potential role of expression levels as a prognostic biomarker in oral cancer has not been investigated. In this study, we examined the expression of CK1ɛ in a large collection of oral cancer tissue samples to assess if CK1ɛ might serve as a predictor of outcomes. We also attempted to assess associations between CK1ɛ expression and clinicopathological parameters of oral cancer patients and the relationship to outcomes.

2. Results and Discussion

2.1. Patient Characteristics

A total of 195 patients, including 159 men and 36 women were analyzed in this retrospective study. The patients’ characteristics, including the patients’ sex, age, cancer stage, lymph node status, histological grade, tumor status, smoking habits, betel nut chewing habits, and overall survival are listed in Table 1. The mean age of the 195 patients was 55.9 years (a range of 31–88 years). There were 60 patients with stage I, 56 with stage II, 38 with stage III, and 41 with stage IV oral tumors. Twenty-seven tumors were well-differentiated, 161 were moderately differentiated, and only 1 was poorly differentiated. In this study, we analyzed low T-stage (T1, T2 and T3) oral cancer patients; there were 80 cases with T1 status, 93 with T2 status, and 22 with T3 status. The mean of overall survival was 4.1 years and the median survival time was 3.9 years. The overall survival time ranged from 0.1 to 9.6 years. Adjuvant therapy was administered according to individual considerations.

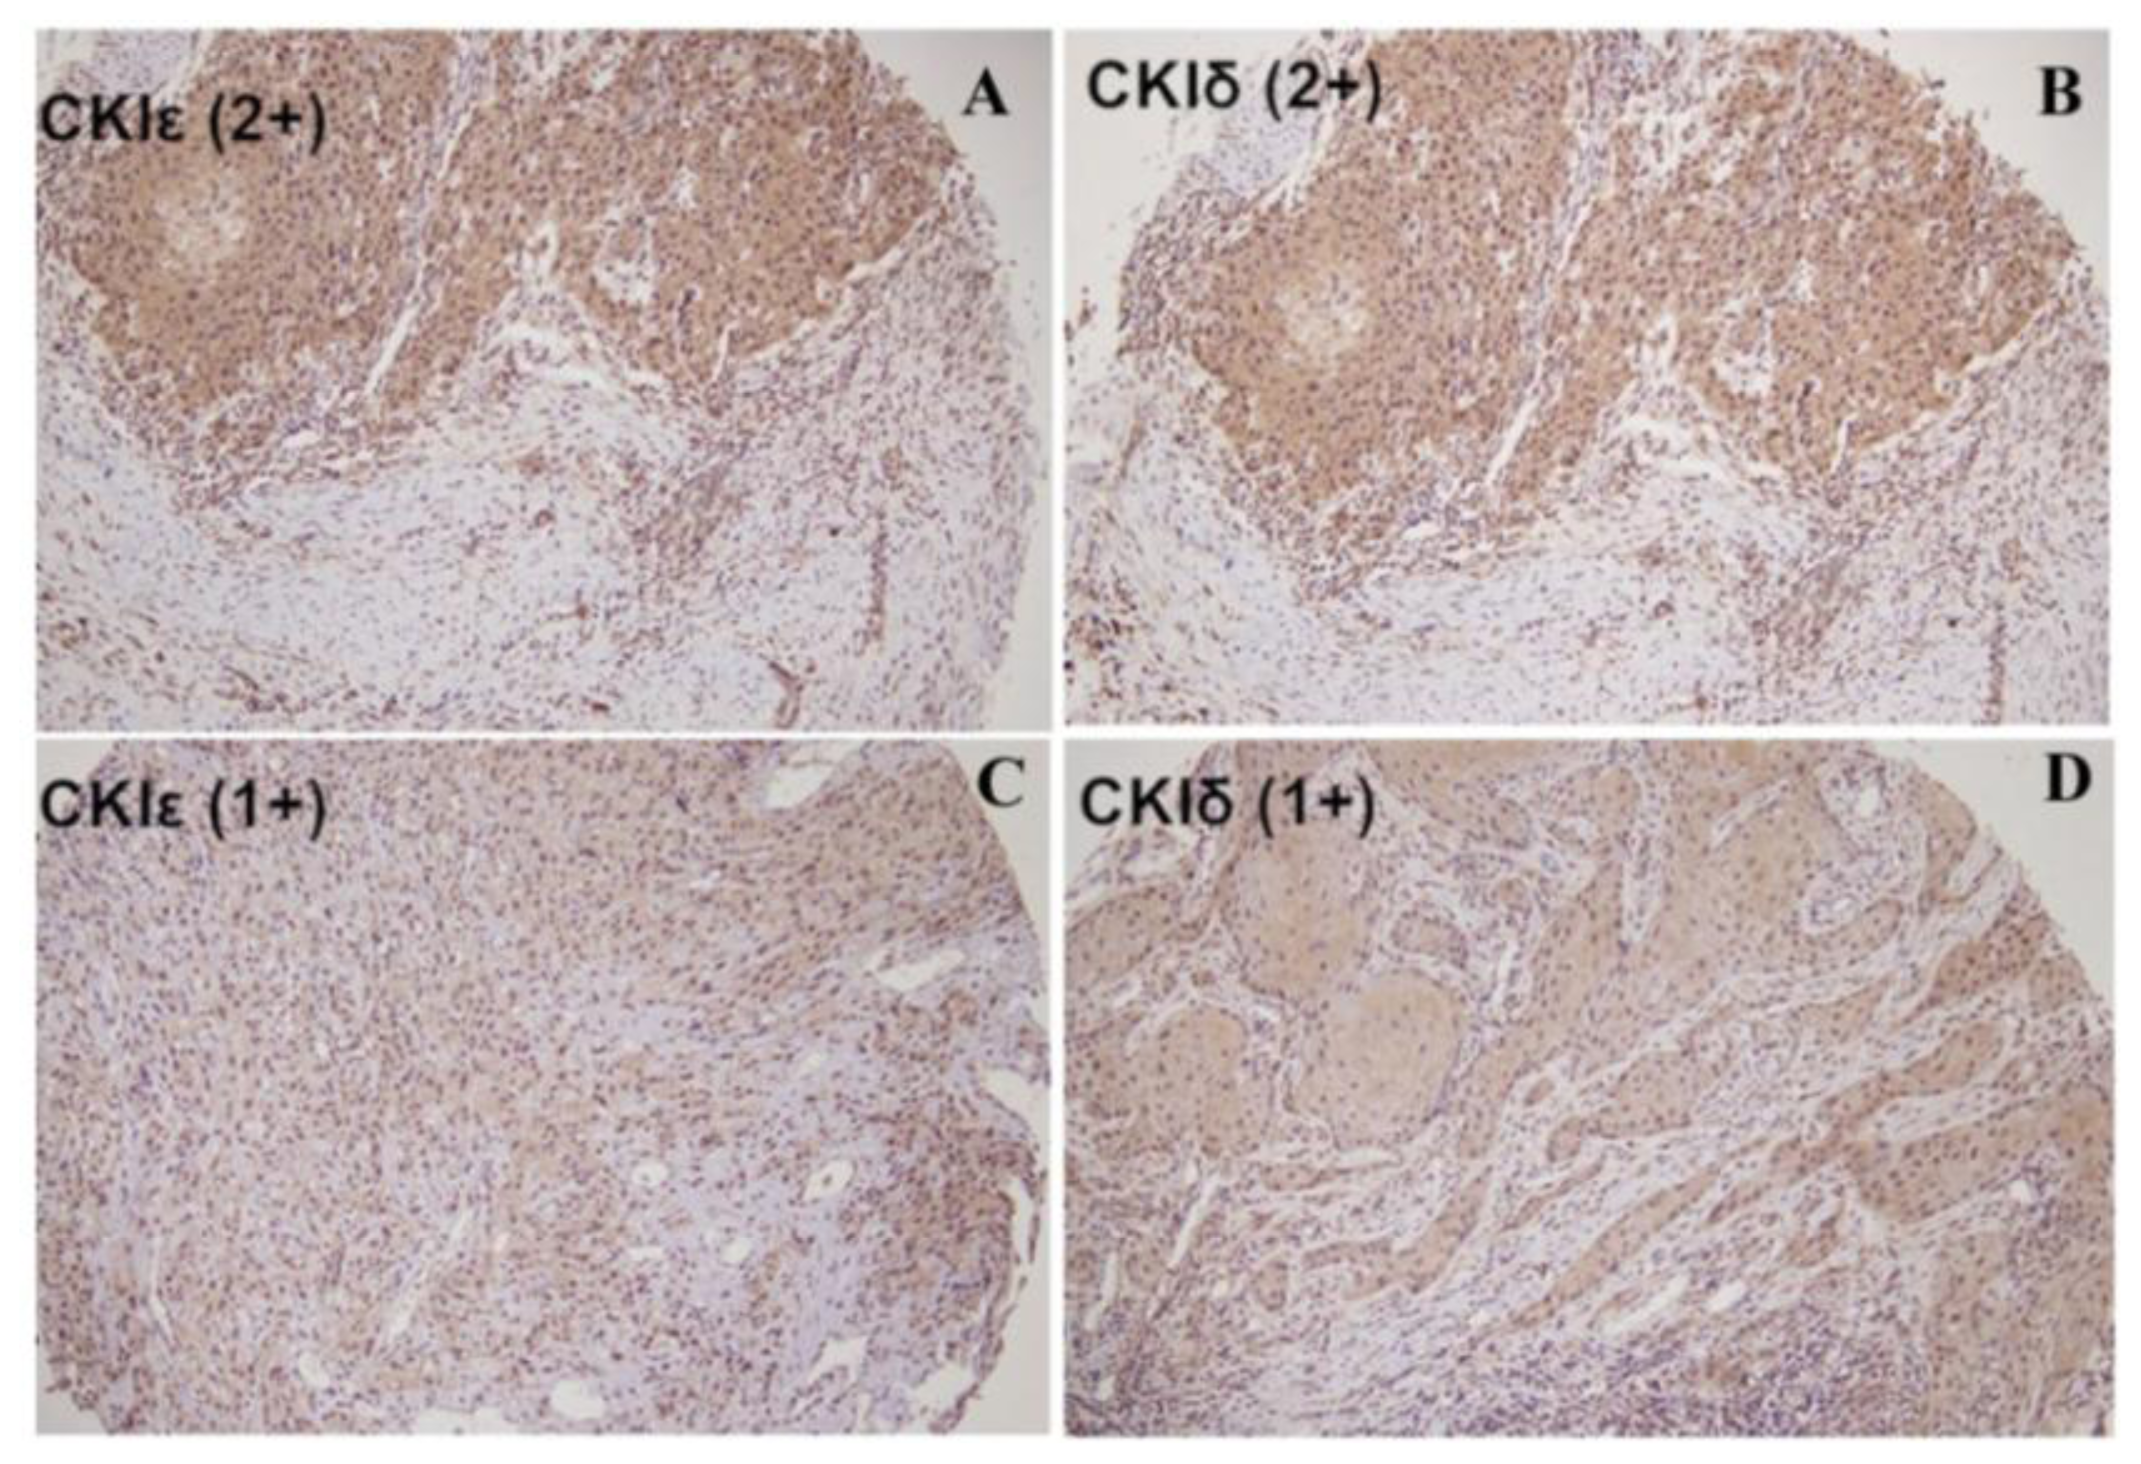
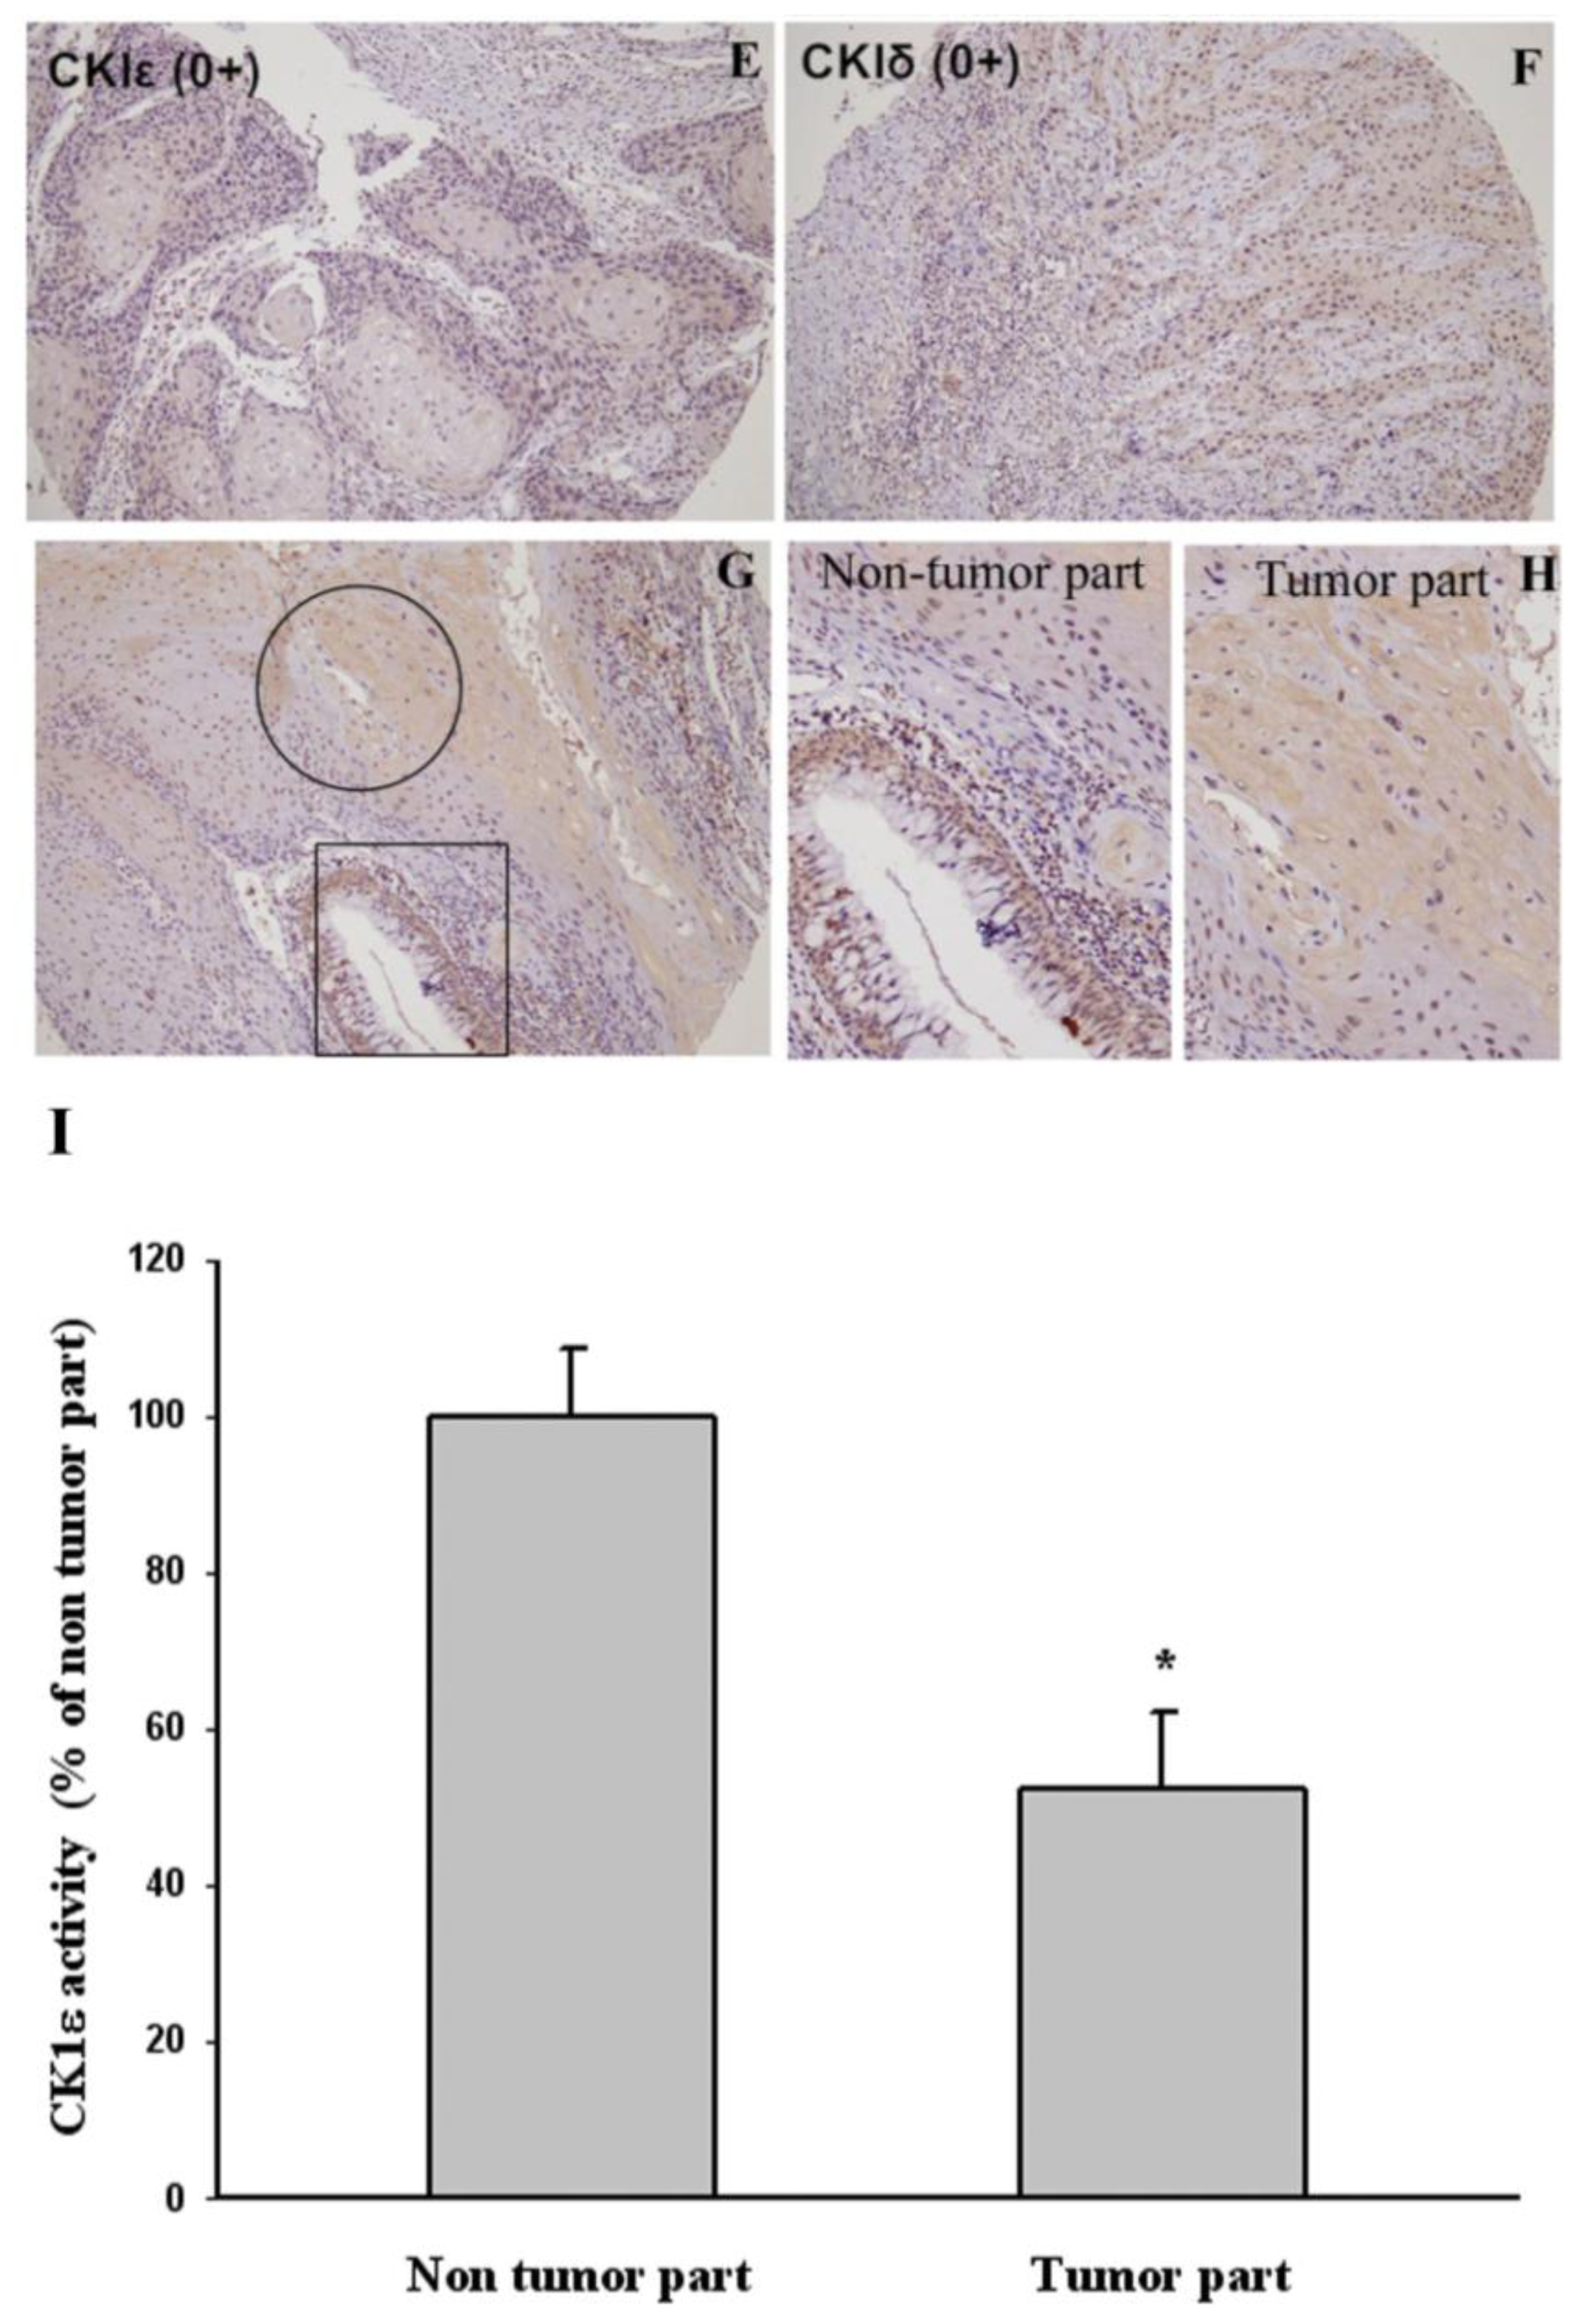
2.2. The Correlation between Cytoplasmic CK1ɛ and CK1δ Expressions in Oral Cancers and Various Clinicopathologic Characteristics

Figure 1A–F shows the different CK1ɛ and CK1δ cytoplasmic expression in oral cancer obtained by immunohistochemical analysis. In this study, 35 cases showed a score of 2+ (17.9%), 98 cases received a score of 1+ (50.3%), and 62 cases received a score of 0+ (31.1%) in the CK1ɛ expression. Figure 1G,H shows a strong CK1ɛ expression in non-tumor part by immunohistochemical analysis. We also examined the CK1ɛ kinase activity in the non-tumor part and of tumor part by CK1ɛ kinase activity assay (Figure 1I). The levels of CK1ɛ kinase activity in the tumor part were significantly lower than that in non-tumor parts (p < 0.05).
We divided the CK1ɛ and CK1δ immunohistological stains into positive (1+/2+) and negative (0) stain subgroups. The correlation between the expression level of CK1ɛ and clinical parameters is summarized in Table 2. The chi-square analyses for the clinicopathologic characteristics of 195 patients with OSCC in relation to cytoplasmic CK1ɛ expression showed that a negative CK1ɛ expression was considerably correlated with a short four-year survival (p = 0.002). However, no significant association of CK1δ expression was achieved with gender, age and the clinical parameters. Furthermore, we also test CK1ɛ expression in normal epithelial cells and four different OSCC cells lines. Western blot analysis indicated CK1ɛ expression in all oral cancer cells as well as normal squamous epithelial cells (Figure 2). The expression of CK1ɛ in normal epithelial cells (SG cells) was higher than that in OECM1 and TW206 oral cancer cells (Figure 2).

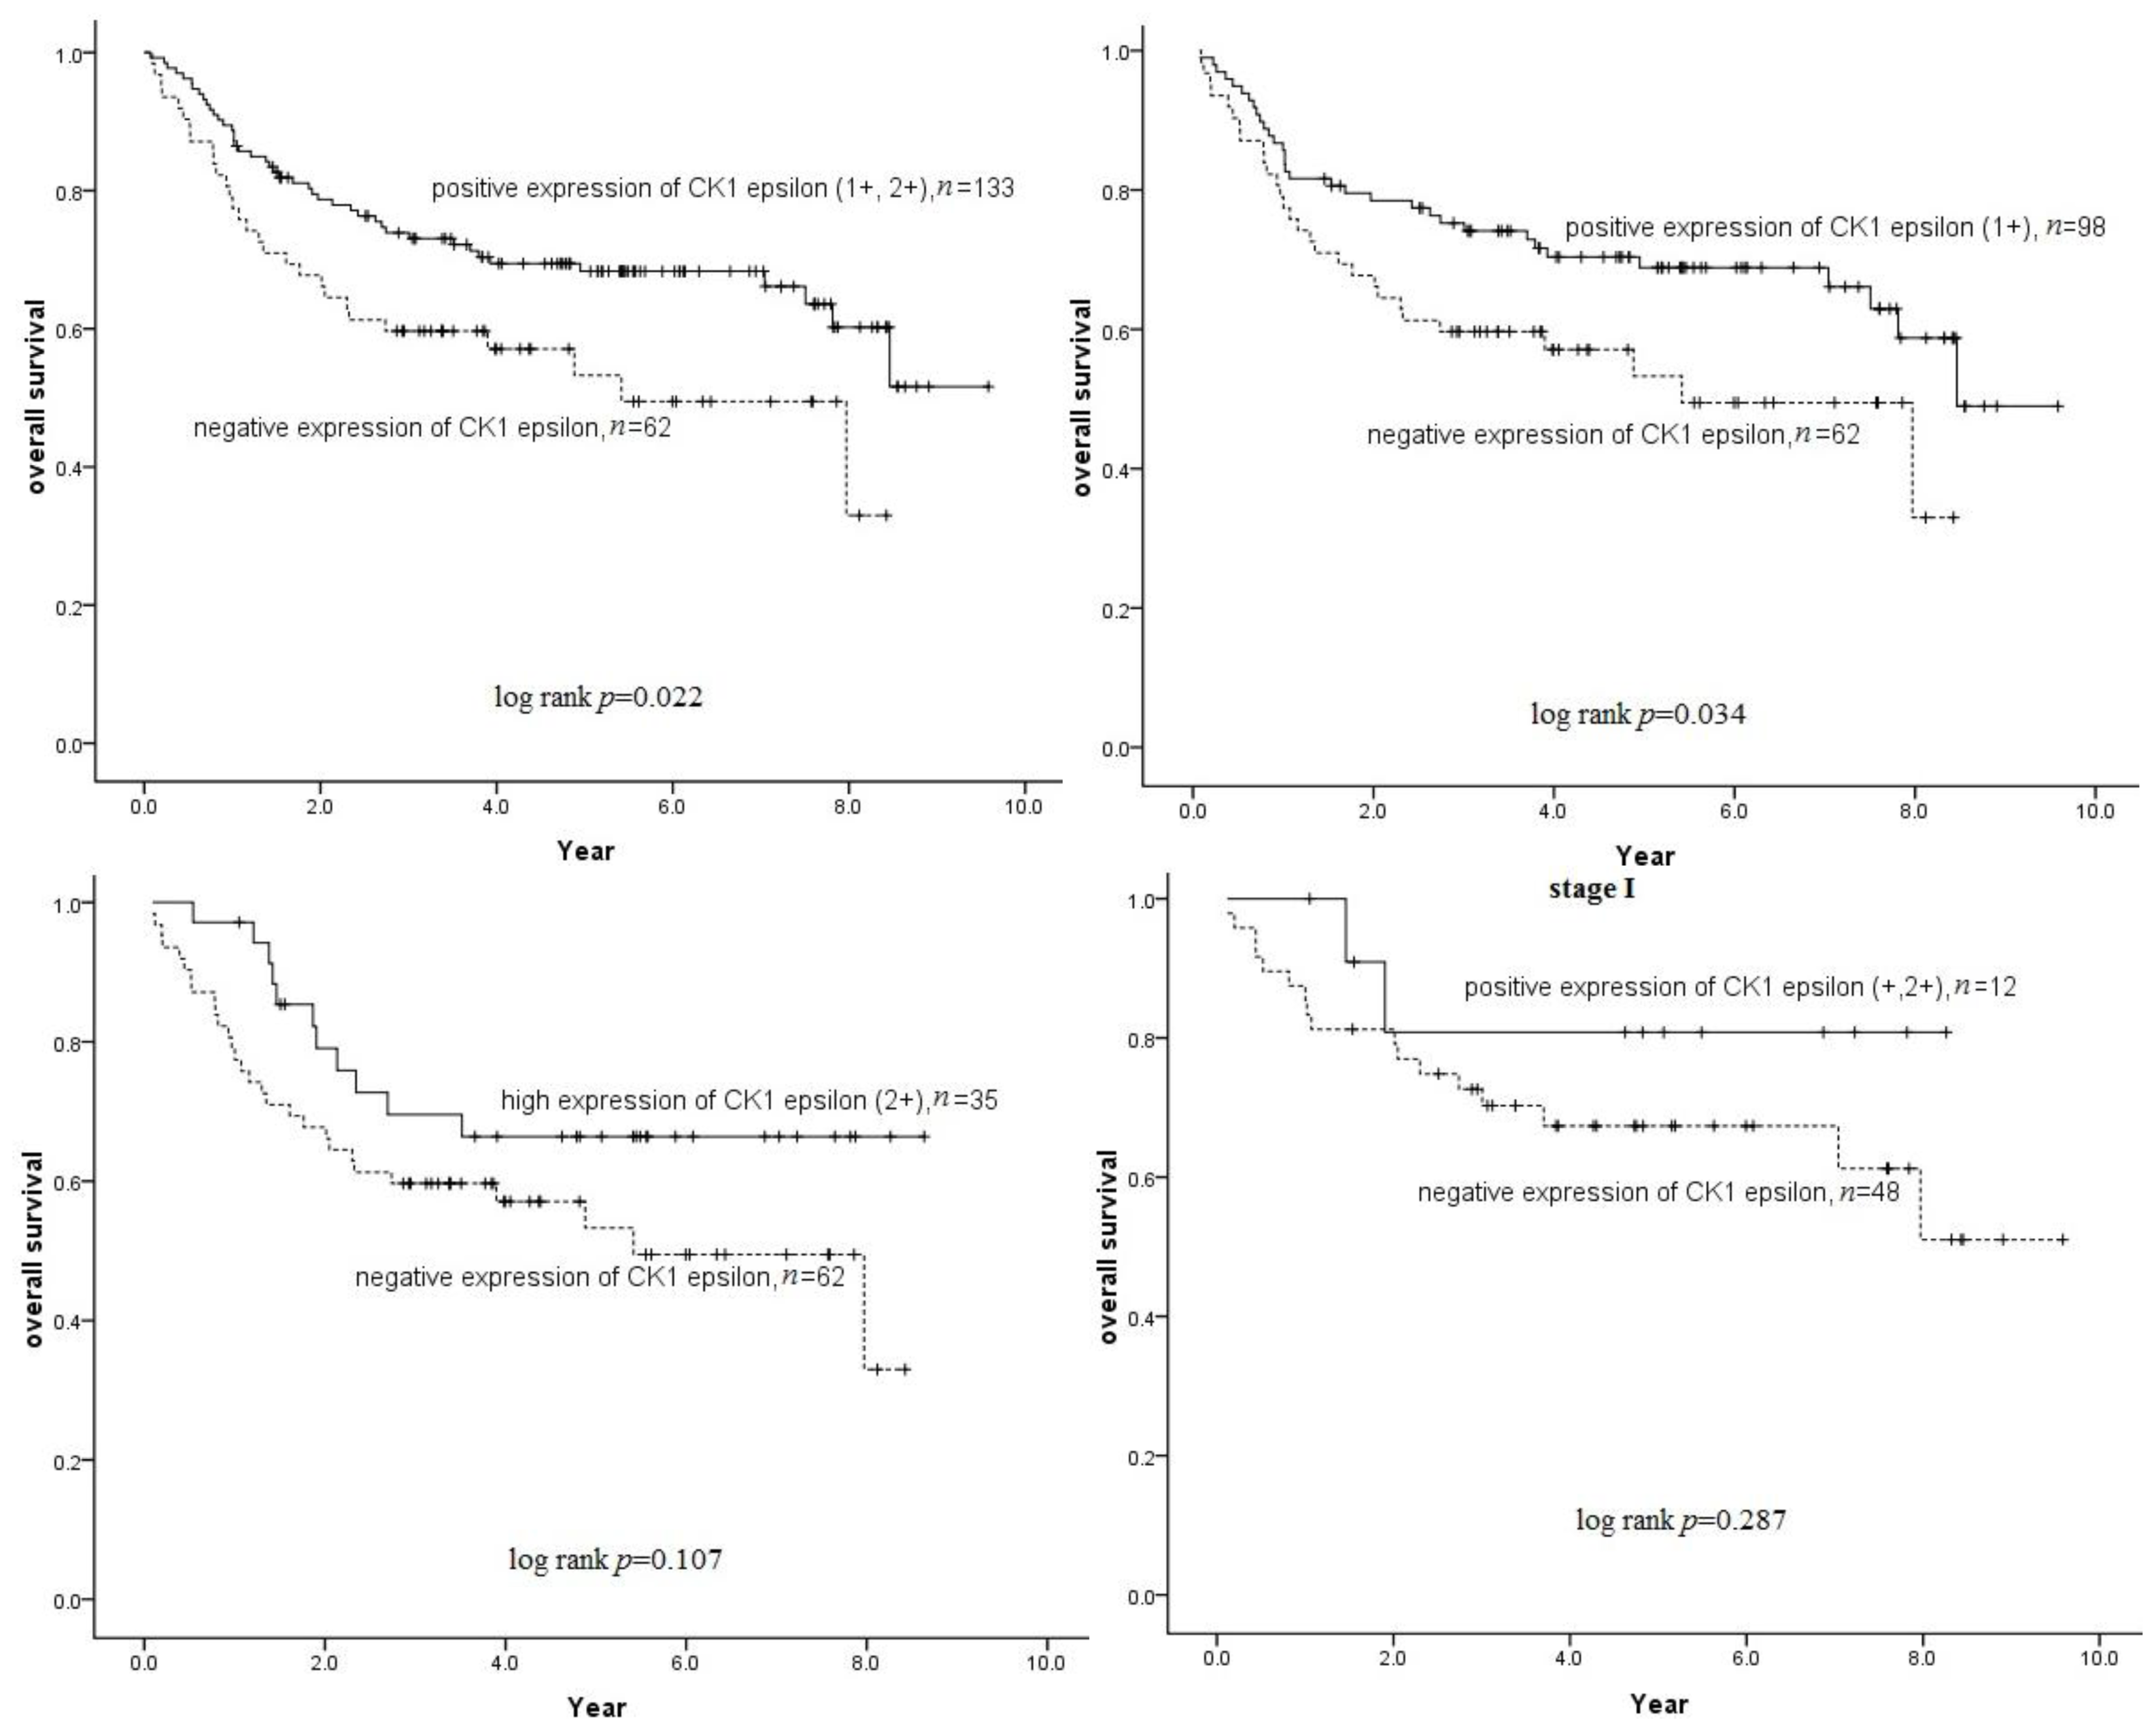
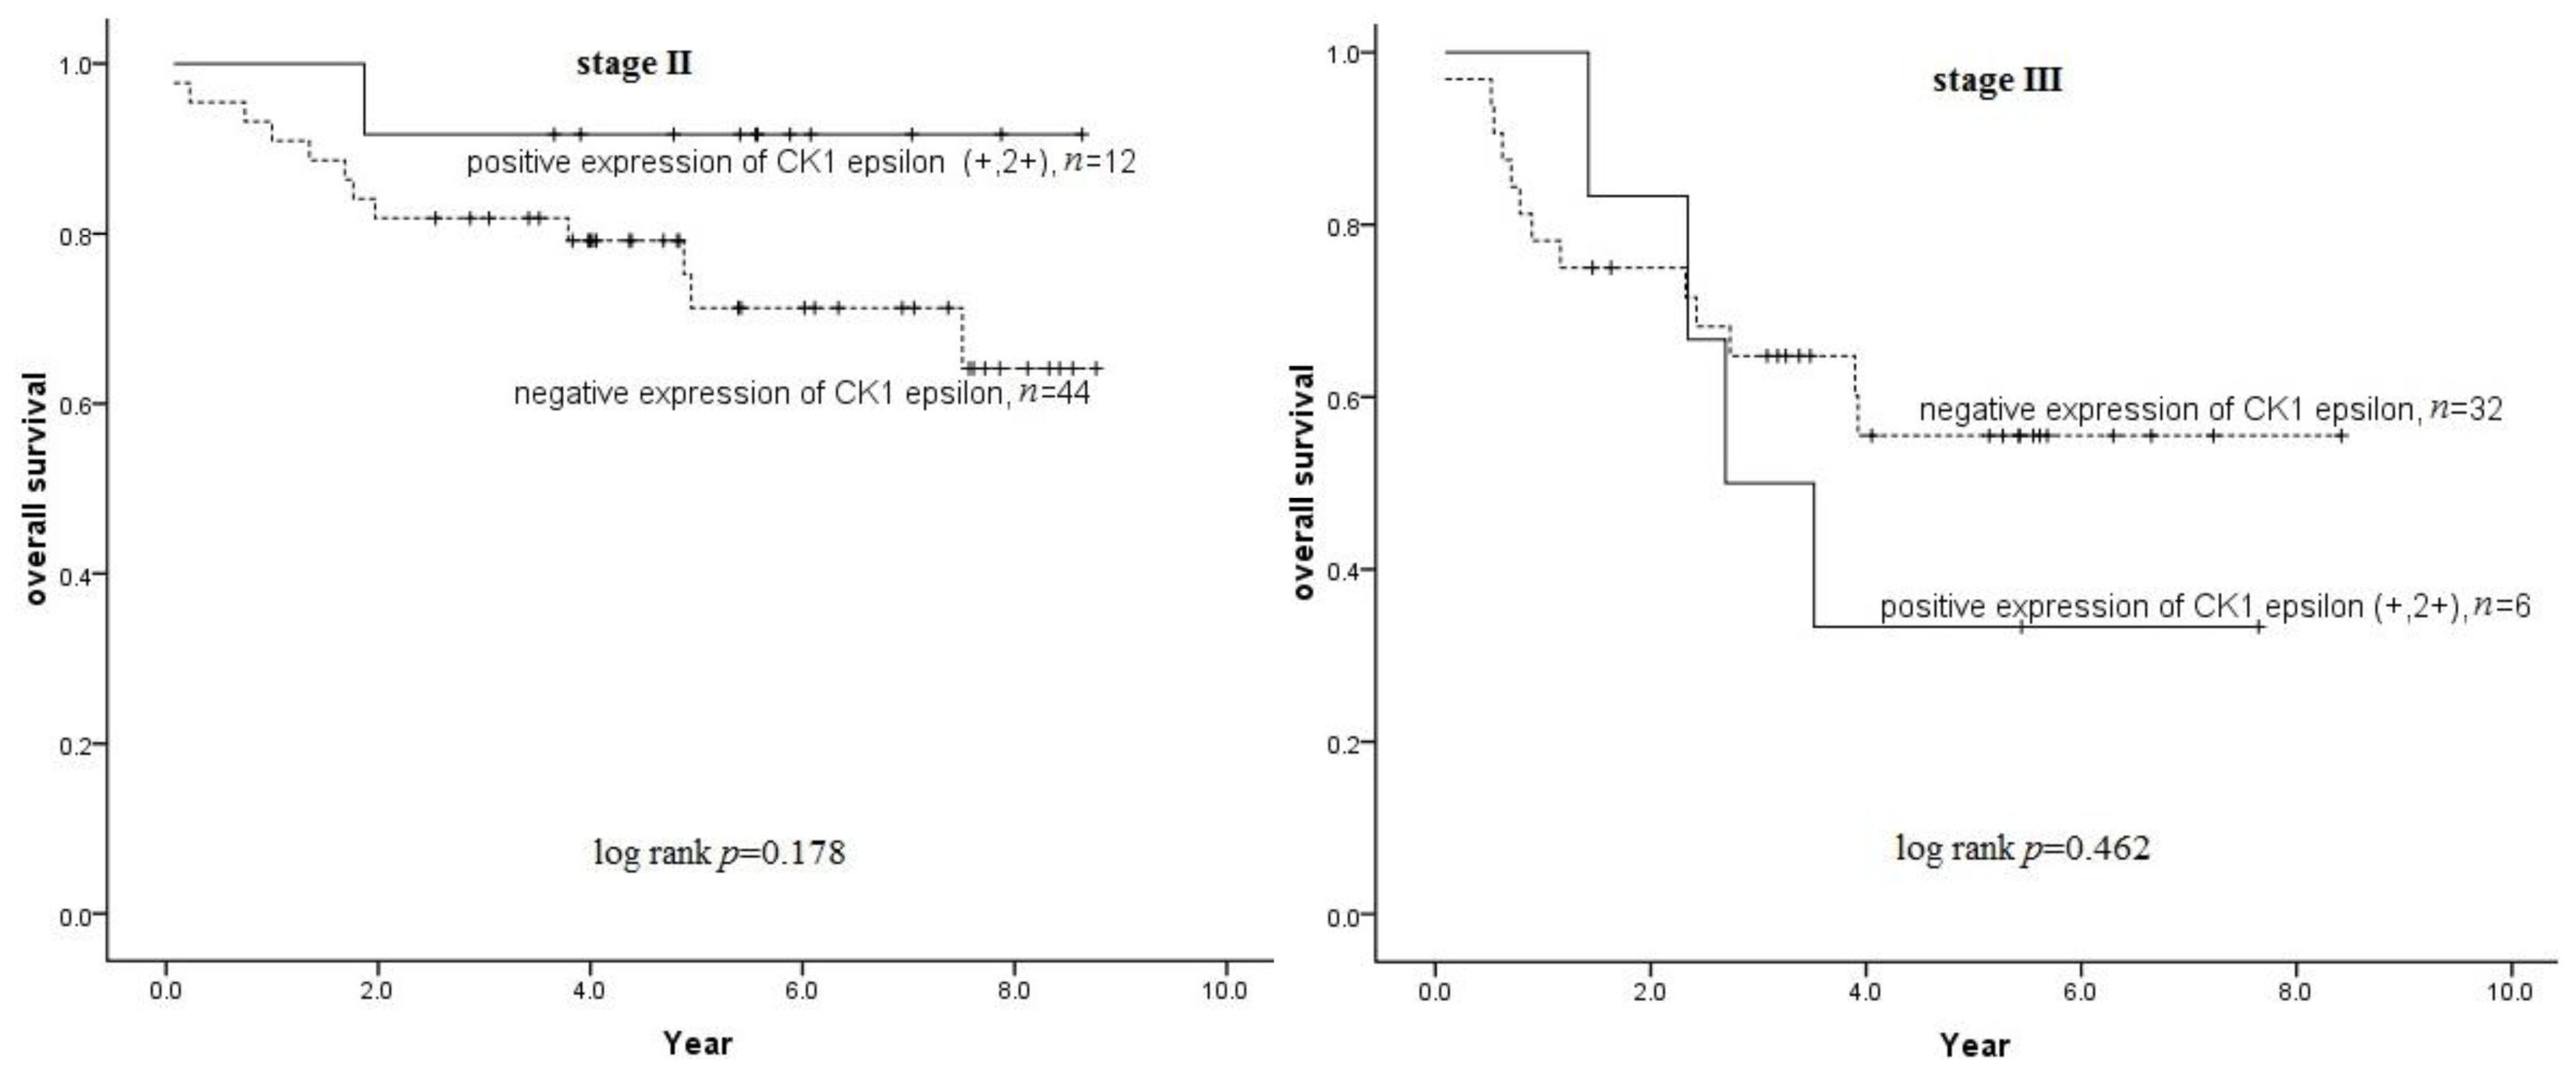
2.3. Correlations between Cytoplasmic CK1ɛ Expression and Patient Survival

In our study, the patients were subdivided into two groups (the negative cytoplasmic CK1ɛ expression group and the positive cytoplasmic CK1ɛ expression group) because cytoplasmic CK1ɛ expression was considerably correlated with patient survival. Survival analysis demonstrated that the probability of survival was considerably lower (p = 0.022) in the patients with negative cytoplasmic CK1ɛ expression (Figure 3) than in those who had positive ones. In the subgroup, there are statistical significant association in the negative cytoplasmic CK1ɛ expression group and CK1ɛ expression (score 1+) group. However, no significant association was found in the stage I, stage II and stage III subgroup (Figure 3). Cox proportional regression analysis was used to assess the effect of negative cytoplasmic CK1ɛ expression on overall survival (OS) independently of other clinical variables. In the univariate Cox regression analysis, the results showed that negative cytoplasmic CK1ɛ expression, when adjusted for grade, tumor stage, and lymph node metastasis, retained a statistically significant association with overall survival (p = 0.024, hazard ratio (HR) = 1.7). The results of the survival analysis showed that the median survival rate in negative cytoplasmic CK1ɛ expression cases was 39.6 months, whereas in positive cytoplasmic CK1ɛ expression cases, it was 57.6 months. The mean survival rate was 40.4 and 54.0 months in negative and positive cytoplasmic CK1ɛ expression cases, respectively. However, CK1δ expression, when adjusted for grade, tumor stage, and lymph node metastasis, had no statistically significant association with overall survival (p = 0.475).
In addition, the univariate Cox regression analysis, tumor grade (p = 0.009, HR = 6.5), disease stage (p <0.001, HR = 2.3) and lymph node metastasis status (p < 0.001, HR = 2.8) were independent predictors of poor survival (Table 3). In the multivariate Cox regression analysis (Table 4), tumor grade (p = 0.012, HR = 6.1) and lymph node metastasis status (p = 0.002, HR = 2.5) were independent predictors of poor survival. Negative cytoplasmic CK1ɛ expression might be an independent prognostic factor (p = 0.052, HR = 1.9) for oral cancer patients. These findings suggest that negative cytoplasmic CK1ɛ expression has a major impact on the overall survival of oral cancer patients.
In Taiwan, one of the most prominent cancers affecting people is OSCC. The incidence of this disease in the younger male population has markedly increased during recent years [5]. The prognosis for patients with OSCC remains poor, especially if the disease is not diagnosed at early stages [21,22]. Treatment modalities for oral cancer usually involve surgery and radiation, with or without chemotherapy. Therefore, discovering a method for targeting agents that cause molecular or cellular changes that are specific to oral cancer may have therapeutic potential.
Several studies have demonstrated that CK1ɛ is associated with various cancers and have indicated that CK1ɛ plays a role in carcinogenesis [15,2330]; contrarily, Fuja et al. [22] and Hsu et al. [23] reported that CK1ɛ could be a tumor suppressor. Even in the same cancer, CK1ɛ seems to display different functions; it could be an oncoprotein or a tumor suppressor [23,30,31]. In this study, our data showed that there was higher CK1ɛ expression in normal oral squamous mucosa than in tumors. We also discovered that a loss of cytoplasmic expression of CK1ɛ in oral cancer patients is significantly associated with poor overall survival. In the univariate Cox regression analysis, the results showed that the median survival rate in negative cytoplasmic CK1ɛ expression cases was 39.6 months, whereas in positive cytoplasmic CK1ɛ expression cases, it was 57.6 months. The mean survival rate was 40.4 and 54.0 months in negative and positive cytoplasmic CK1ɛ expression cases, respectively. These results indicated that CK1ɛ might be a tumor suppressor in OSCC. Our data is similar to those of Fuja et al. [22] and Hsu et al. [23]. Fuja and coworkers revealed that CK1ɛ was reduced in poorly differentiated tumors and CK1ɛ showed over-expression in mammary ductal cell carcinoma in situ as observed by using an immunohistochemical study [22]. The expression of CK1ɛ showed considerable down-regulation in the cancer tissues (p < 0.005) [22]. Hsu et al. demonstrated that CK1ɛ expression showed major down-regulation in the cancer tissue in head and neck squamous cell carcinoma by using a real-time quantitative RT-PCR analysis [23]. These studies did not correlate CK1ɛ expression with the patient’s clinical parameters or the patient’s survival statement [24]. However, our data is different from that of Brockschmidt et al. [13] because they indicated that there is a high expression of CK1ɛ in cases of ductal adenocarcinoma of the pancreas and that CK1ɛ contributes to aggressive tumor growth. Rodriguez et al. [17] also showed that CK1ɛ is considerably over-expressed in ovarian cancer tissues and is associated with poor survival. The differences between our observations and those of Brockschmidt et al. [13] and Rodriguez et al. [18] could be due to variations in different cancer types. The tumor cell type in their investigations was adenocarcinoma, whereas ours was squamous cell carcinoma. Moreover, we used 195 cancer tissues to conduct our analysis, whereas Brockschmidt et al. [13] experimented with only 27 cases of ductal adenocarcinoma of the pancreas, and Rodriguez et al. [18] studied only 76 ovarian tumors. The number of specimens we used in our research is greater than that of the other studies; therefore, we believe that this could be a major reason leading to our different results.
It has been suggested that CK1ɛ represents a potential therapeutic target in many types of human cancers. The inhibition of CK1ɛ by IC261 could effectively resensitize cells to apoptosis in vitro and reduce tumor growth [15,19,25]. Rodriguez et al. [18] also demonstrated that the inhibition of CK1ɛ resulted in decreased cell growth rates and tumor burden, and acted as a potent sensitizer to chemotherapeutic agents. Foldynová-Trantírková et al. [30] discovered that the CK1ɛ mutations in breast cancer suppresses Wnt/β-catenin and promotes Wnt/Rac-1-mediated and NFAT-mediated pathways. They indicated that CK1ɛ has the potential to play a role as a tumor suppressor in breast cancer through its negative effect on the Wnt/Rac1/JNK and NFAT pathways.

3. Experimental Section

3.1. Patients and Samples

In this study, we collected 195 OSCC samples from patients who underwent treatment at Changhua Christian Hospital, Changhua, Taiwan between January 2000 and December 2006. These samples were used to construct a tissue microarray. All of the patients were staged and grades defined by the 2007 American Joint Committee on Cancer staging system. Histopathological and clinical data including patients’ age and sex, tumor status, lymph node metastasis, distance metastasis, betel nut chewing, alcohol drinking, grade, stage and survival were obtained from the cancer registry of Changhua Christian Hospital, Taiwan. Before commencement of this study, approval was obtained from the Institutional Review Board of Changhua Christian Hospital, and informed written consent to participate in the study was obtained from each person.

3.2. Tissue Microarrays (TMAs)

Punch of the tumor specimens and non-tumor specimens from hematoxylin and eosin-stained sections: One tissue cylinders with a diameter of 2 mm were made from each OSCC paraffin block using a fine steel needle to produce the tissue microarrays (TMAs). The punches of the tumor specimens were arrayed into new paraffin blocks. A 4-μm hematoxylin and eosin stained section was reviewed by pathologists to confirm the presence of morphologically representative lesions of the original cancers.

3.3. Immunohistochemistry

Paraffin embedded squamous cell carcinoma and paired non-cancerous tissue sections (4-μm) on poly- l-lysine-coated slides were deparaffinized in xylene and rehydrated in alcohol. Endogenous peroxidase activity was blocked with 3% H2O2. The antigen was retrieved by heating at 100 °C for 20 min in 10 mM citrate buffer (pH 6.0). After antigen retrieval, slides were incubated with an affinity-purified goat polyclonal anti-CK1ɛ (C-20) raised against a COOH-terminal peptide of CK1ɛ (Santa Cruz Biotechnology, Santa Cruz, CA, USA) or anti-CK1δ (Abcam; ab10877) for 30 min at room temperature, and washed three times with phosphate buffered saline (PBS). Slides were incubated with an horseradish peroxidase (HRP)/Fab polymer conjugate for another 30 min. The sites of peroxidase activity were visualized using 3,3′-diamino-benzidine tetrahydrochloride as a substrate. Gill Hematoxylin Solution II (MERCK, Darmstadt, Germany) was utilized as the counterstain. Negative controls had the primary antibody omitted and replaced by PBS. Oral mucosa epithelium with homogeneous CK1ɛ cytoplasmic staining was included as the positive controls. A compararative scale from 0 to 2 was used to score staining intensity: “2+” if the staining intensity in the tumor part matched the staining intensity of the normal oral squamous mucosa. The staining was scored as “1+” if the staining intensity in the tumor part was lower than the staining intensity of the normal oral squamous mucosa. A score of “0” reflected a lack of CK1ɛ immunoreactivity compared with the staining pattern of normal oral squamous mucosa. Negative/loss of expression of CK1ɛ was defined as “0”; “1+ and 2+” as positive expression. All immunohistochemical staining cases were examined by two pathologists (Chih-Jung Chen and Kun-Tu Yeh, Department of Surgical Pathology, Changhua Christian Hospital, Changhua, Taiwan), and a final agreement was obtained for each score at a discussion microscope.

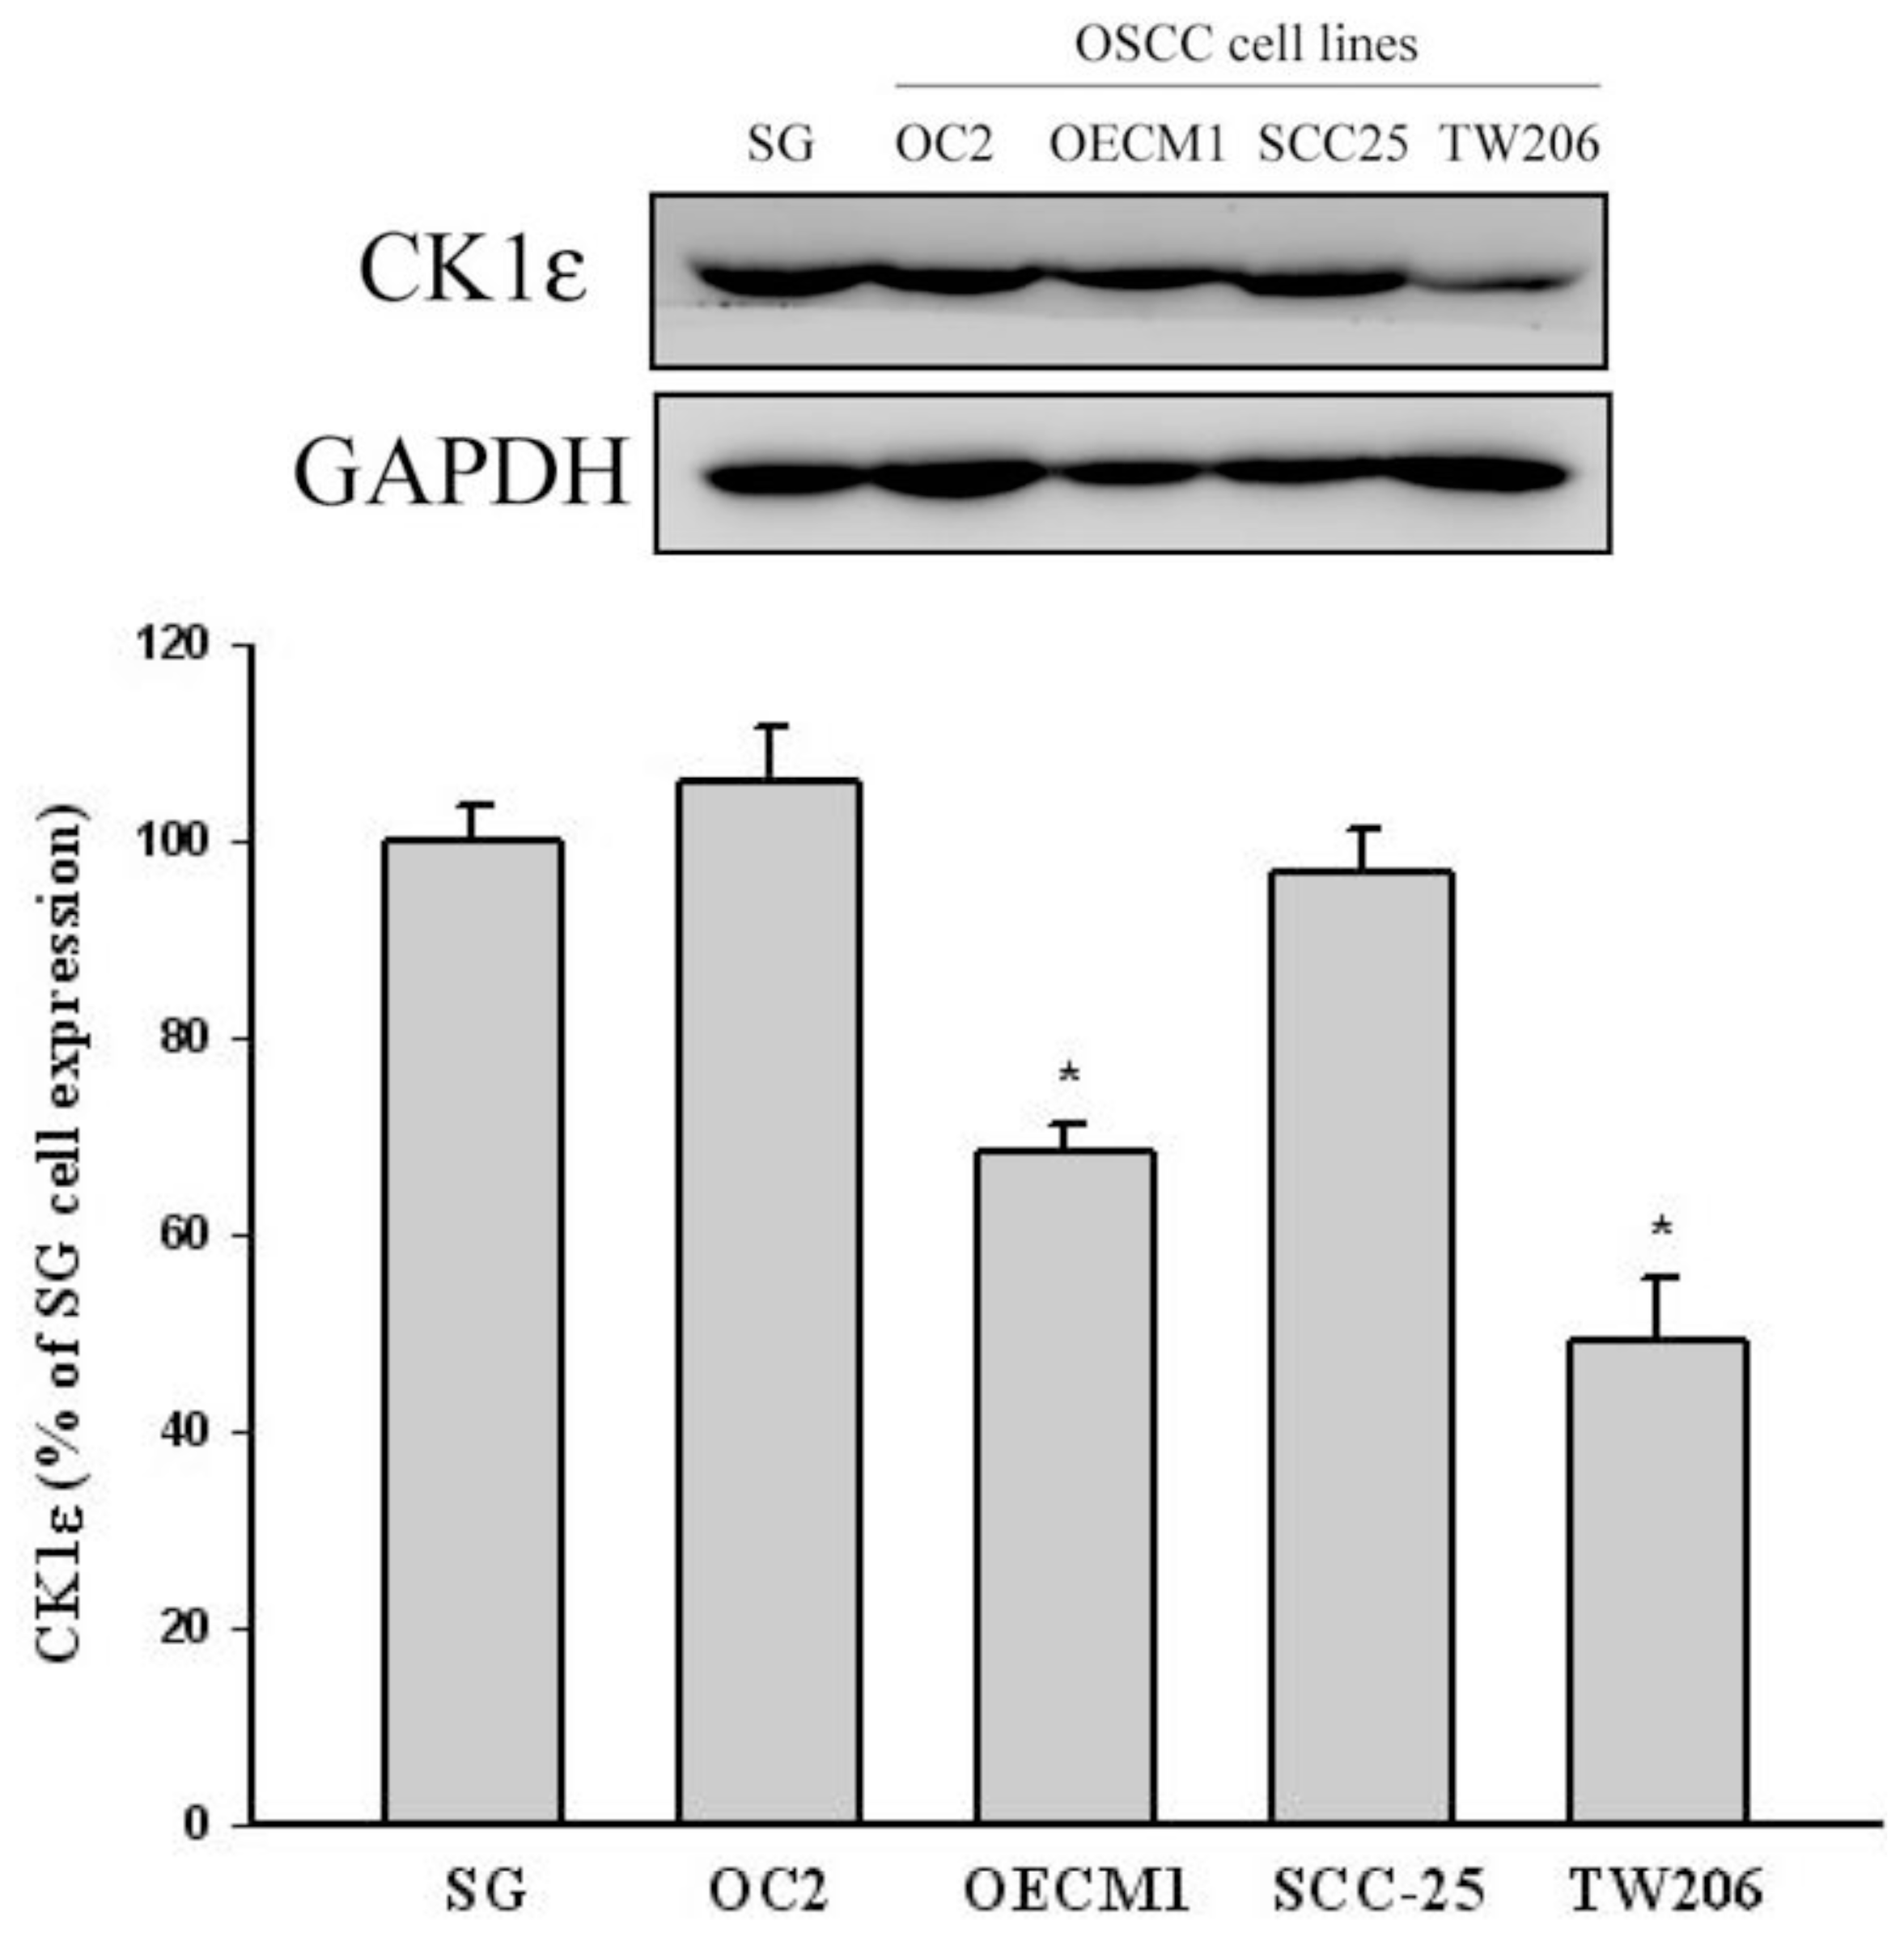
3.4. Cell and Cell Culture

SG and OC2 cells were cultured in Dulbecco’s modified Eagle’s medium (Life Technologies, Grand Island, NY, USA). OECM1 cells were cultured in RPMI medium. SCC25 and TW206 cells were cultured in Dulbecco’s modified Eagle’s medium supplemented with an equal volume of a nutrient mixture, F-12 Ham’s medium (Life Technologies, Grand Island, NY, USA). All cell cultures were maintained at 37 °C in a humidified atmosphere of 5% CO2.

3.5. Western Blot Analysis

Cellular lysates were prepared by suspending 2 × 10⁶/10 cm dish in 200 μL of RIPA buffer containing protease inhibitors cocktail. Cell lysates were subjected to a centrifugation of 10,000 rpm for 10 min at 4 °C, and the insoluble pellet was discarded. The 20 μg samples of total cell lysates were separated by SDS-PAGE on 10% polyacrylamide gels and transferred onto a nitrocellulose membrane using the Mini-Protean Tetra Electrophoresis System as described previously [31]. The blot was subsequently incubated with 5% non-fat milk in Tris-buffered saline (20 mM Tris, 137 mM NaCl, pH 7.6) for 1 h to block non-specific binding and then overnight with polyclonal antibodies against CK1ɛ were then incubated with a horseradish peroxidase goat anti-rabbit IgG for 1 h. Afterwards, signal was detected by using enhanced chemiluminescence (ECL) commercial kit (Amersham Biosciences, Piscataway, NJ, USA).

3.6. CK1ɛ Kinase Activity

Surgical specimens of human oral cancer and the corresponding paired adjacent normal tissue were obtained right after the surgery, fresh tissue was snap-frozen in liquid nitrogen and stored at −80 °C until processing to determinate CK1ɛ kinase activity by ADP-Glo™ Kinase Assay (Promega, Madison, WI, USA). Briefly, CK1ɛ kinase reactions were carried out for 60 min at room temperature in a 50 μL volume of CK1ɛ kinase-assay buffer (40 mM Tris, pH 7.5; 20 mM MgCl2; 0.1 mg/mL BSA; 50 μM DTT) supplemented with dilute enzyme, substrate, ATP, inhibitors and ADP-Glo™ reagent buffer. After incubation at room temperature for 40 min, 10 μL of Kinase detection reagent was added. After 30 min of incubation, luminescence activities were assayed; data are shown as relative light units (RLU) that directly correlate to the amount of ADP produced.

3.7. Statistical Analysis

CK1ɛ expression patterns and correlations of CK1ɛ and clinicopathologic parameters of OSCC were examined by chi-squared test. The distribution of overall survival was estimated using a Kaplan-Meier plot and the log-rank test. Overall survival (OS) was defined as the time between the date of diagnosis and the date of death. Independent prognostic factors were analyzed by the Cox proportional hazards regression model (SPSS, Version 17.0; SPSS, Inc., Chicago, IL, USA). The analyses were performed using the Statistical Package for Social Sciences, Version 17.0 (SPSS, Version 17.0; SPSS, Inc., Chicago, IL, USA), and p value of less than 0.05 (2-tailed test) was considered to indicate statistical significance.

4. Conclusions

In conclusion, our experimental results demonstrated that a loss of cytoplasmic CK1ɛ expression correlates with poor survival rates in oral cancer patients. Our findings suggest that CK1ɛ could not only function as a prognostic predictor for oral cancer, but could also act as a tumor suppressor. Since current viable treatment options are limited for OSCC, continued studies must be conducted to further explore this area and to determine whether CK1ɛ can be used as a pharmacological target for treatments.

Acknowledgments

This study was supported by a research grant from National Science Council, Taiwan (NSC 102-2314-B-040-008-MY3).

Conflicts of Interest

The authors declare no conflict of interest.

References

  1. Cancer Registration System Annual Report; Bureau of Health Promotion, Department of Health: New Taipei City, Taiwan, 2010.
  2. Leite, I.C.; Koifman, S. Survival analysis in a sample of oral cancer patients at a reference hospital in Rio de Janeiro, Brazil. Oral Oncol 1998, 34, 347–352. [Google Scholar]
  3. Lo, W.L.; Kao, S.Y.; Chi, L.Y.; Wong, Y.K.; Chang, R.C. Outcomes of oral squamous cell carcinoma in Taiwan after surgical therapy: Factors affecting survival. J. Oral Maxillofac. Surg 2003, 61, 751–758. [Google Scholar]
  4. Argiris, A.; Karamouzis, M.V.; Raben, D.; Ferris, R.L. Head and neck cancer. Lancet 2008, 371, 1695–1709. [Google Scholar]
  5. Chiesa, F.; Mauri, S.; Tradati, N.; Calabrese, L.; Giugliano, G.; Ansarin, M.; Andrle, J.; Zurrida, S.; Orecchia, R.; Scully, C. Surfing prognostic factors in head and neck cancer at the millennium. Oral Oncol 1999, 35, 590–596. [Google Scholar]
  6. Helliwell, T.R. Molecular markers of metastasis in squamous carcinomas. J. Pathol 2001, 194, 289–293. [Google Scholar]
  7. Lopes, M.A.; Nikitakis, N.G.; Reynolds, M.A.; Ord, R.A.; Sauk, J., Jr. Biomarkers predictive of lymph node metastases in oral squamous cell carcinoma. J. Oral Maxillofac. Surg 2002, 60, 142–147. [Google Scholar]
  8. Rodrigo, J.P.; Suarez, C.; Ferlito, A.; Devaney, K.O.; Petruzzelli, G.J.; Rinaldo, A. Potential molecular prognostic markers for lymph node metastasis in head and neck squamous cell carcinoma. Acta Otolaryngol 2003, 123, 100–105. [Google Scholar]
  9. Lallemant, B.; Evrard, A.; Combescure, C.; Chapuis, H.; Chambon, G.; Raynal, C.; Reynaud, C.; Sabra, O.; Joubert, D.; Hollande, F.; et al. Clinical relevance of nine transcriptional molecular markers for the diagnosis of head and neck squamous cell carcinoma in tissue and saliva rinse. BMC Cancer 2009, 9, 370:1–370:10. [Google Scholar]
  10. Shah, N.G.; Trivedi, T.I.; Tankshali, R.A.; Goswami, J.V.; Jetly, D.H.; Shukla, S.N.; Shah, P.M.; Verma, R.J. Prognostic significance of molecular markers in oral squamous cell carcinoma: A multivariate analysis. Head Neck 2009, 31, 1544–1556. [Google Scholar]
  11. Gross, S.D.; Anderson, R.A. Casein kinase I: Spatial organization and positioning of a multifunctional protein kinase family. Cell Signal 1998, 10, 699–711. [Google Scholar]
  12. Knippschild, U.; Gocht, A.; Wolff, S.; Huber, N.; Löhler, J.; Stöter, M. The casein kinase I family: Participation in multiple cellular processes in eukaryotes. Cell Signal 2005, 17, 675–689. [Google Scholar]
  13. Price, M.A. CKI: There’s more than one: Casein kinase I family members in Wnt and Hedgehog signaling. Genes Dev 2006, 20, 399–410. [Google Scholar]
  14. Brockschmidt, C.; Hirner, H.; Huber, N.; Eismann, T.; Hillenbrand, A.; Giamas, G.; Radunsky, B.; Ammerpohl, O.; Bohm, B.; Henne-Bruns, D.; et al. Anti-apoptotic and growth-stimulatory functions of CKI delta and epsilon in ductal adenocarcinoma of the pancreas are inhibited by IC261 in vitro and in vivo. Gut 2008, 57, 799–806. [Google Scholar]
  15. Frierson, H.F., Jr.; El-Naggar, A.K.; Welsh, J.B.; Sapinoso, L.M.; Su, A.I.; Cheng, J.; Saku, T.; Moskaluk, C.A.; Hampton, G.M. Large scale molecular analysis identifies genes with altered expression in salivary adenoid cystic carcinoma. Am. J. Pathol 2002, 161, 1315–1323. [Google Scholar]
  16. Peters, J.M.; McKay, R.M.; McKay, J.P.; Graff, J.M. Casein kinase I transduces Wnt signals. Nature 1999, 401, 345–350. [Google Scholar]
  17. Polakis, P. The many ways of Wnt in cancer. Curr. Opin. Genet. Dev 2007, 17, 45–51. [Google Scholar]
  18. Rodriguez, N.; Yang, J.; Hasselblatt, K.; Liu, S.; Zhou, Y.; Rauh-Hain, J.A.; Ng, S.K.; Choi, P.W.; Fong, W.P.; Agar, N.Y.; et al. Casein kinase I epsilon interacts with mitochondrial proteins for the growth and survival of human ovarian cancer cells. EMBO Mol. Med 2012, 4, 952–963. [Google Scholar]
  19. Modak, C.; Chai, J. Potential of casein kinase I in digestive cancer screening. World J. Gastrointest. Oncol 2009, 1, 26–33. [Google Scholar]
  20. Yang, Y.H.; Chen, C.H.; Chang, J.S.; Lin, C.C.; Cheng, T.C.; Shieh, T.Y. Incidence rates of oral cancer and oral pre-cancerous lesions in a 6-year follow-up study of a Taiwanese aboriginal community. J. Oral Pathol. Med 2005, 34, 596–601. [Google Scholar]
  21. Fedele, S. Diagnostic aids in the screening of oral cancer. Head Neck Oncol 2009, 1, 5:1–5:6. [Google Scholar]
  22. Fuja, T.J.; Lin, F.; Osann, K.E.; Bryant, P.J. Somatic mutations and altered expression of the candidate tumor suppressors CSNK1; DLG1; and EDD/hHYDin mammary ductal carcinoma. Cancer Res 2004, 64, 942–951. [Google Scholar]
  23. Hsu, C.M.; Lin, S.F.; Lu, C.T.; Lin, P.M.; Yang, M.Y. Altered expression of circadian clock genes in head and neck squamous cell carcinoma. Tumour Biol 2012, 33, 149–155. [Google Scholar]
  24. Flajolet, M.; He, G.; Heiman, M.; Lin, A.; Nairn, A.C.; Greengard, P. Regulation of Alzheimer’s disease amyloid-beta formation by casein kinase I. Proc. Natl. Acad. Sci. USA 2007, 104, 4159–4164. [Google Scholar]
  25. Umar, S.; Wang, Y.; Morris, A.P.; Sellin, J.H. Dual alterations in casein kinase I-epsilon and GSK-3beta modulate beta-catenin stability in hyperproliferating colonic epithelia. Am. J. Physiol. Gastrointest. Liver Physiol 2007, 292, G599–G607. [Google Scholar]
  26. Tsai, I.C.; Amack, J.D.; Gao, Z.H.; Band, V.; Yost, H.J.; Virshup, D.M. A Wnt-CKIvarepsilon-Rap1 pathway regulates gastrulation by modulating SIPA1L1: A Rap GTPase activating protein. Dev. Cell 2007, 12, 335–347. [Google Scholar]
  27. Cegielska, A.; Gietzen, K.F.; Rivers, A.; Virshup, D.M. Autoinhibition of casein kinase I epsilon (CKI epsilon) is relieved by protein phosphatases and limited proteolysis. J. Biol. Chem 1998, 273, 1357–1364. [Google Scholar]
  28. Michl, P.; Downward, J. Mechanisms of disease: PI3K/AKT signaling in gastrointestinal cancers. Z. Gastroenterol 2005, 43, 1133–1139. [Google Scholar]
  29. Foldynová-Trantírková, S.; Sekyrová, P.; Tmejová, K.; Brumovská, E.; Bernatík, O.; Blankenfeldt, W. Breast cancer-specific mutations in CK1ɛ inhibit Wnt/β-catenin and activate the Wnt/Rac1/JNK and NFAT pathways to decrease cell adhesion and promote cell migration. Breast Cancer Res 2010, 12, R30:1–R30:14. [Google Scholar]
  30. Kim, S.Y.; Dunn, I.F.; Firestein, R.; Gupta, P.; Wardwell, L.; Repich, K.; Schinzel, A.C.; Wittner, B.; Silver, S.J.; Root, D.E.; et al. CK1ɛ is required for breast cancers dependent on β-catenin activity. PLoS One 2010, 5, e8979. [Google Scholar]
  31. Lin, C.W.; Chen, P.N.; Chen, M.K.; Yang, W.E.; Tang, C.H.; Yang, S.F.; Hsieh, Y.S. Kaempferol reduces matrix metalloproteinase-2 expression by down-regulating ERK1/2 and the activator protein-1 signaling pathways in oral cancer cells. PLoS One 2013, 8, e80883. [Google Scholar]
Figure 1. CK1ɛ and CK1δ immunoreactivity and CK1ɛ kinase activity in non-tumor oral squamous mucosa and SCC. (A) Strong cytoplasmic CK1ɛ expression in SCC (score 2+); (B) Strong cytoplasmic CK1δ expression in SCC (score 2+); (C) Weak cytoplasmic CK1ɛ expression in SCC (score 1+); (D) Weak cytoplasmic CK1δ expression in SCC (score 1+); (E) Negative CK1ɛ expression in SCC (score 0); (F) Negative CK1δ expression in SCC (score 0); (G,H) Strong cytoplasmic CK1ɛ expression in the non-tumor part than that of tumor part. Circle indicated the tumor part. Frame indicated the non-tumor part; and (I) Lower CK1ɛ kinase activity in the tumor part then that of non-tumor part. * Significant differences from control values with p < 0.05.
Ijms 15 02876f1aIjms 15 02876f1b
Figure 2. CK1ɛ expression in normal epithelial cell (SG cell) and four different OSCC cells lines (OC2, OECM1, SCC25 and TW206). Western blot analysis, indicating the high expression of CK1ɛ in normal epithelial cells and the low expression in OECM1 and TW206 oral cancer cells. * Significant differences from control values with p < 0.05.
Ijms 15 02876f2
Figure 3. Kaplan-Meier survival curves for oral SCC patients who were classified with either negative or positive cytoplasmic CK1ɛ expression. Loss of CK1ɛ expression was strongly associated (log-rank, p = 0.022) with patient survival. However, no significant association was found in the stage I, stage II and stage III subgroups.
Ijms 15 02876f3aIjms 15 02876f3b
Table 1. Patient characteristics.
VariableOral squamous cell carcinoma

n = 195%
GenderFemale3618.5
Male15981.5

CK1ɛ expression06231.8
1+9850.3
2+3517.9

Smoke or Betel nutsNo7136.4
Yes8945.6
Unknown3517.9

StageI6030.8
II5628.7
III3819.5
IV4121.0

Lymph Node MetastasisNo13368.2
Yes6231.8

GradeWell2713.8
Moderate16182.6
Poor13.6

Tumor statusT18041.0
T29347.7
T32211.3

AgeMean55.9 years
Median55.0 years
Range31−88 years

Overall-survivalMean4.1 years
Median3.9 years
Range0.1−9.6 years

Follow upMean5.4 years
Median6.0 years
Range0.1−13.2 years
Table 2. Correlation of CK1ɛ expression with clinicopathologic indicators of oral cancer.
CharacteristicsCytoplasmic staining of CK1ɛ (n = 195)p valueCytoplasmic staining of CK1δ (n = 173)p value


Negative (%)Positive (%)Negative (%)Positive (%)
Gender
F11 (17.7)25 (18.8)0.8608 (6.8)3 (5.4)1.000 a
M51 (82.3)108 (81.2)109 (93.2)53 (94.6)

Age
≤55 years33 (53.2)69 (51.9)0.86158 (49.6)30 (53.6)0.623
>55 years29 (46.8)64 (48.1)59 (50.4)26 (46.4)

Grade
well10 (16.1)17 (12.8)0.52917 (14.5)8 (14.3)0.966
moderate, poor52 (83.9)116 (87.2)100 (85.5)48 (85.7)

T status
T129 (46.8)51 (38.3)0.21146 (39.3)21 (37.5)0.586
T224 (38.7)69 (51.9)55 (47.0)30 (53.6)
T39 (14.5)13 (9.8)16 (13.7)5 (8.9)

Lymph Node Metastasis
no38 (61.3)95 (71.4)0.15775 (64.1)41 (73.2)0.233
yes24 (38.7)38 (28.6)42 (35.9)15 (26.8)

Distance Metastasis
no61 (98.4)133 (100)0.413 a116 (99.1)56 (100)1.000 a
yes1 (1.6)0 (0)1 (0.9)0 (0)

Stage
I19 (30.6)41 (30.8)0.07933 (28.2)17 (30.4)0.365
II12 (19.4)44 (33.1)36 (30.8)20 (35.7)
III12 (19.4)26 (19.6)20 (17.1)12 (21.4)
IV19 (30.6)22 (16.5)28 (23.9)7 (12.5)

Survival
≤4 years42 (67.7)58 (43.6)0.00245 (38.5)17 (30.4)0.298
>4 years20 (32.3)75 (56.4)72 (61.5)39 (69.6)

Smoking or Betel Nuts
no22 (44)49 (44.5)0.94936 (40.4)18 (46.2)0.548
yes28 (56)61 (55.5)53 (59.6)21 (53.8)
p-value by Fisher’s Exact Test a or chi-square Test.
Table 3. Univariate analysis (Cox regression) of several clinicopathologic indicators of oral cancer.
VariableHazard ratio95% CIp value
Expression of CK1ɛ (n = 195)
negative1.70.361–0.9300.024
positive1.0

Grade
well1.01.601–26.6280.009
moderate/poor6.5

Stage
I + II1.01.470–3.717<0.001
III + IV2.3

Lymph Node Metastasis
no1.01.740–4.379<0.001
yes2.8

Expression of CK1δ (n = 173)
negative1.20.462–1.4320.475
positive1.0
Grade
well1.01.328–13.4580.015
moderate/poor4.2

Stage
I + II1.01.560–4.101<0.001
III + IV2.5

Lymph Node Metastasis
no1.01.549–4.060<0.001
yes2.5
Table 4. Multivariate analysis (Cox regression) of several clinicopathologic indicators of oral cancer.
VariableHazard ratio95% CIp value
Expression of CK1ɛ (n = 195)
negative1.60.382–1.0040.052
positive1.0

Grade
well1.01.490–25.0800.012
moderate/poor6.1

Stage
I + II1.10.364–2.4240.897
III + IV1.0

Lymph Node Metastasis
no1.01.390–4.6650.002
yes2.5

Expression of CK1δ (n = 173)
negative1.10.495–1.5400.638
positive1.0

Grade
well1.01.180–19.9920.029
moderate/poor4.9

Stage
I + II1.00.828–4.1060.134
III + IV1.8

Lymph Node Metastasis
no1.00.771–3.7710.188
yes1.7

