Exploring the Glycosylation of Serum CA125

 and
and
Abstract
:
1. Introduction
2. Results
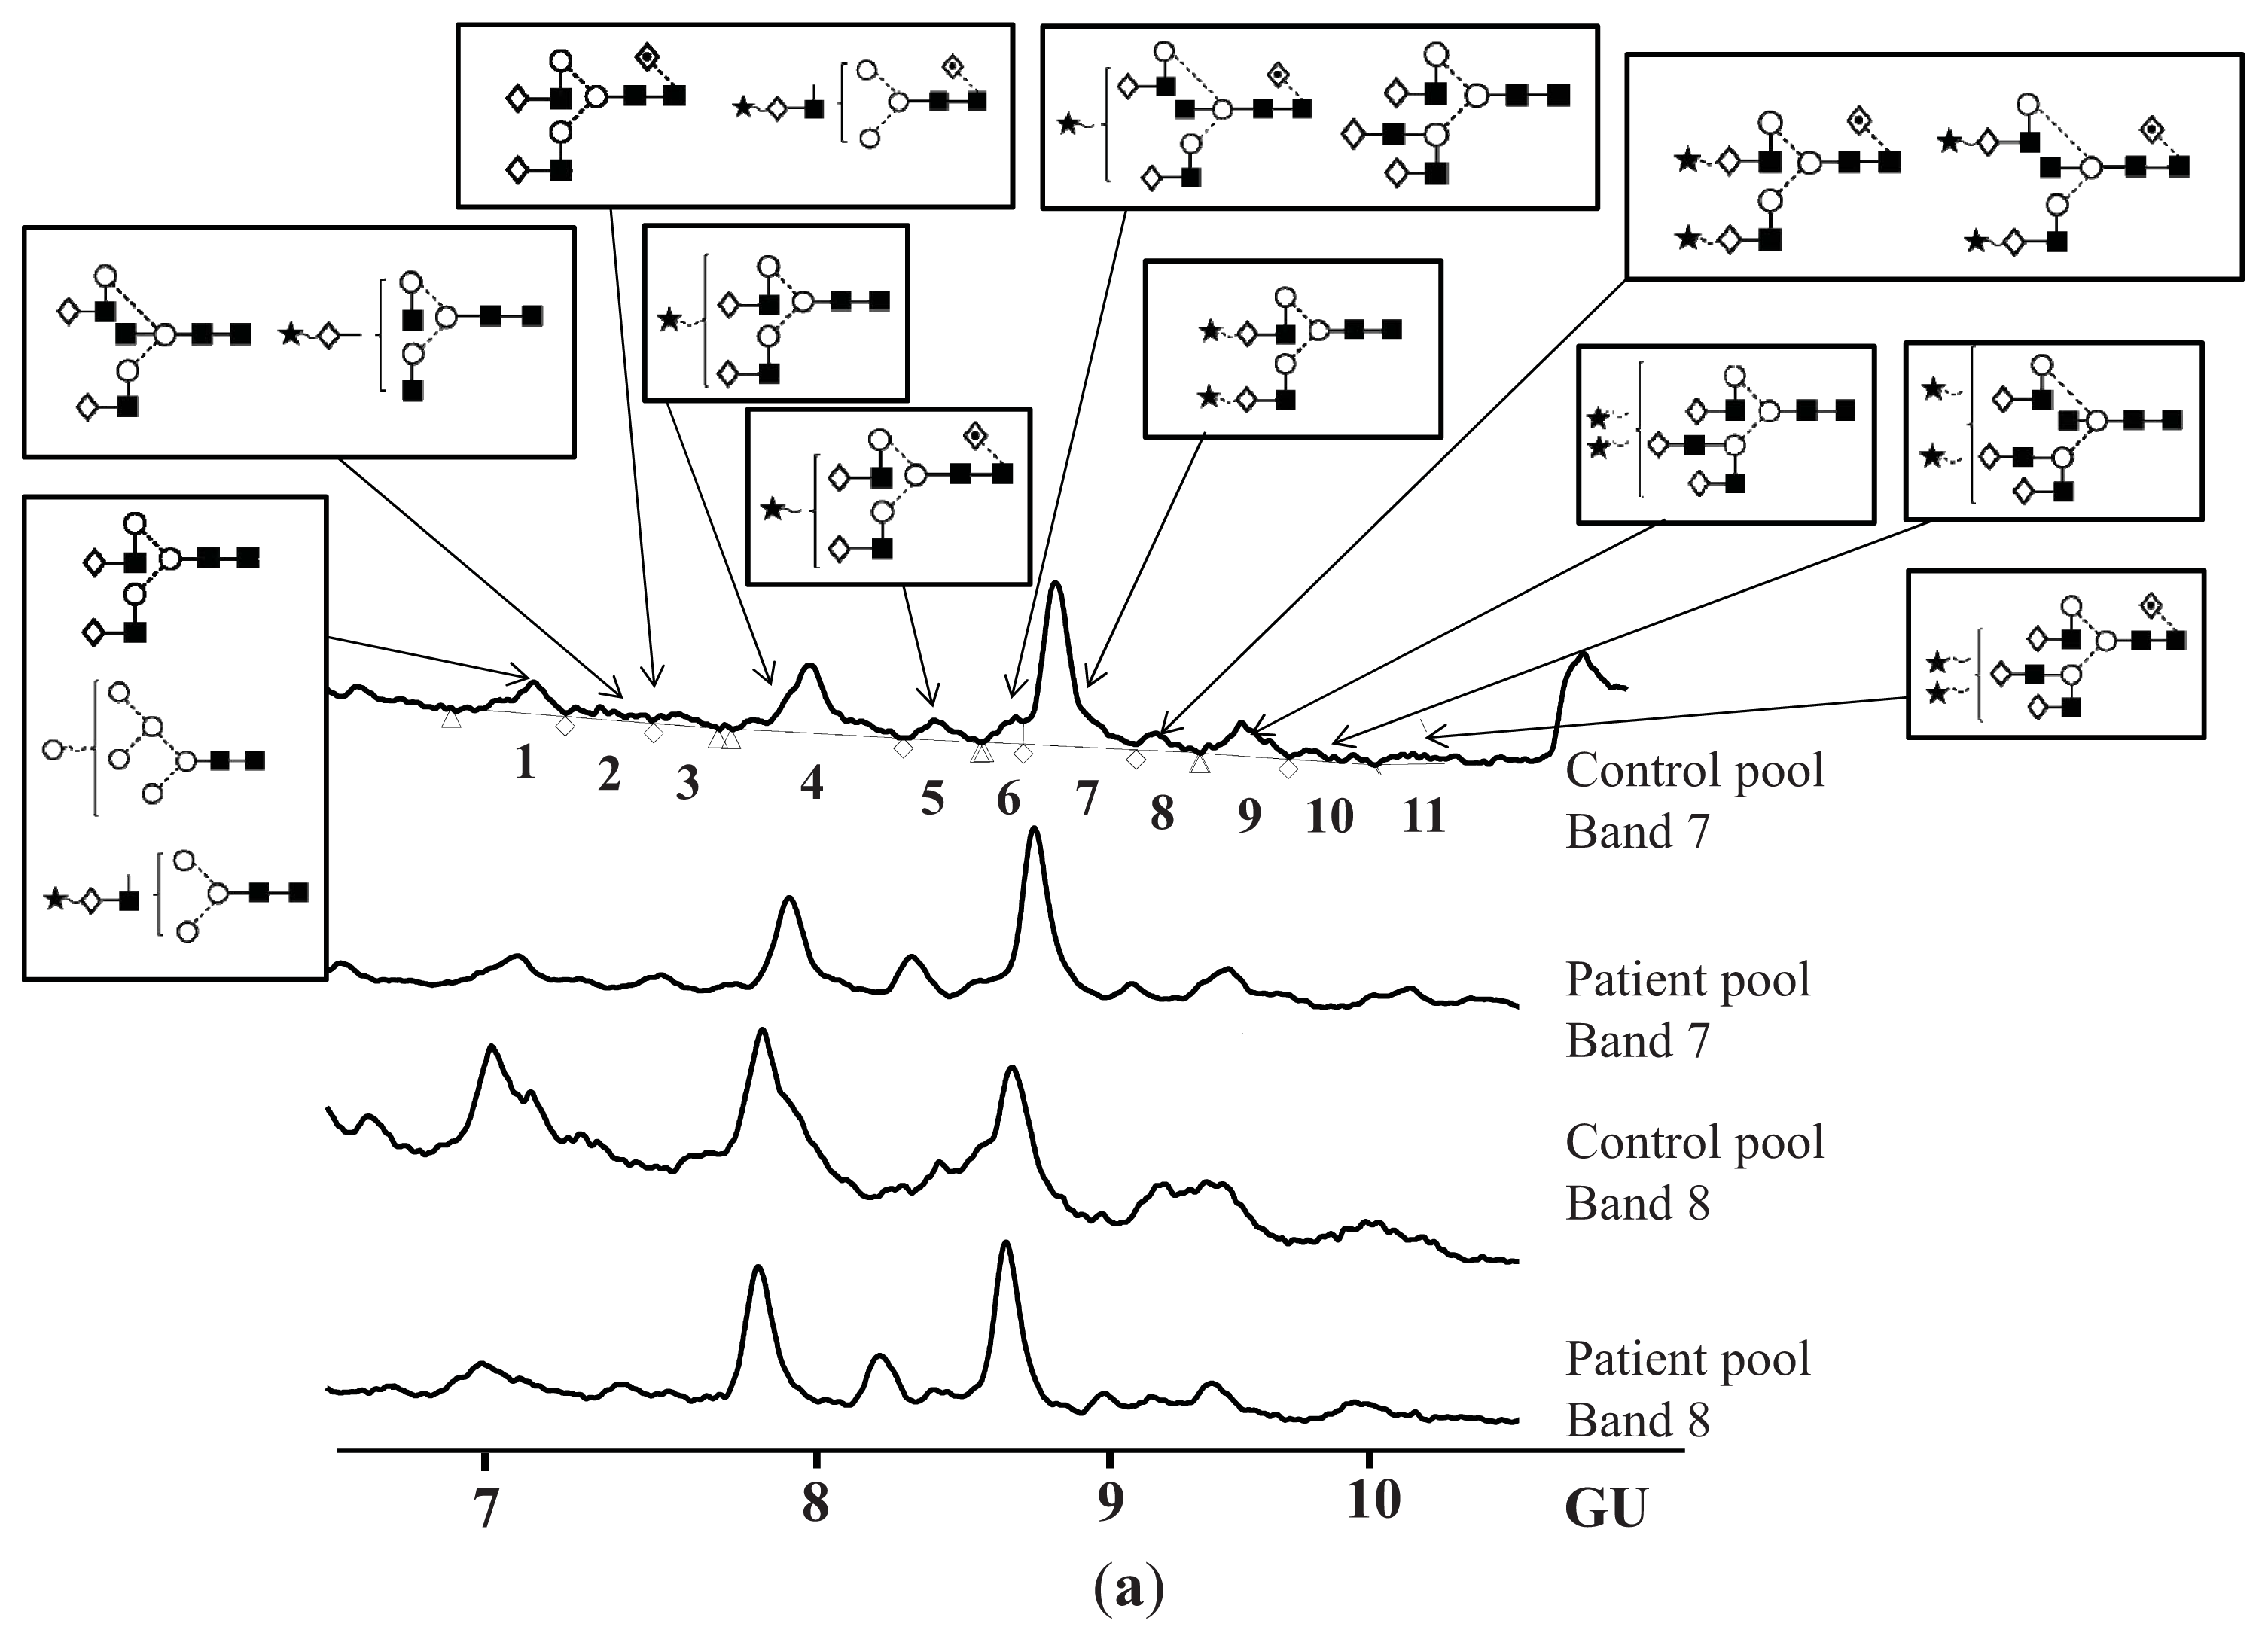
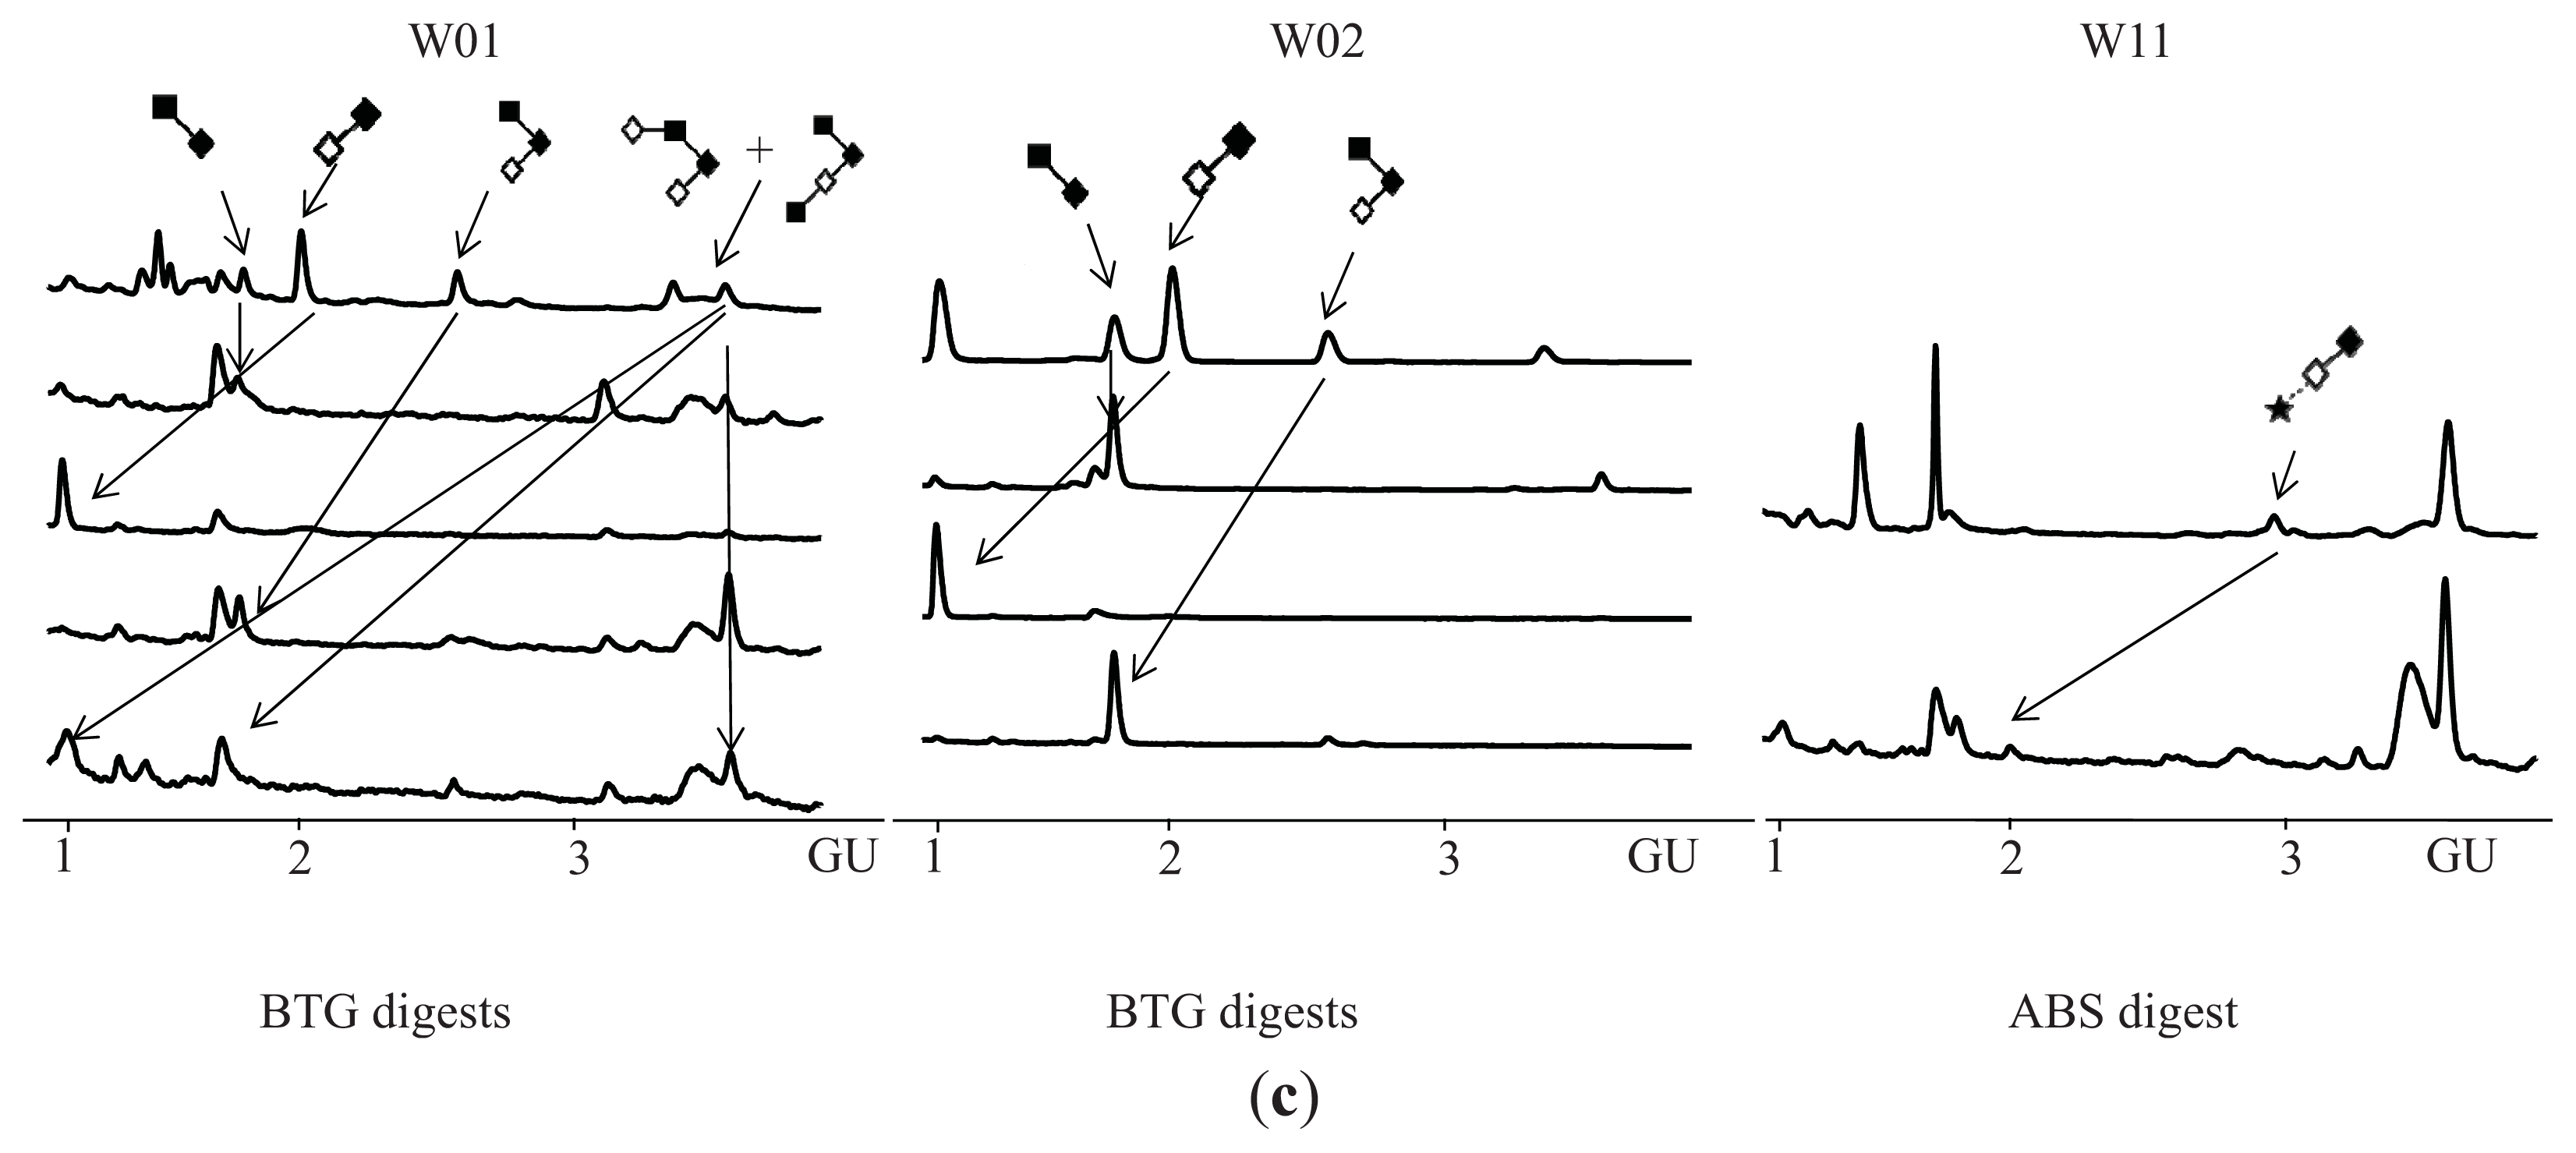
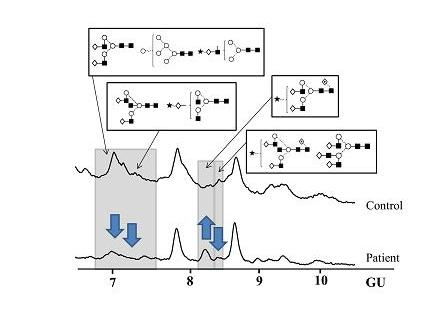
N-Glycosylation of CA125 Reveals Differences between Healthy Controls and Patients with Ovarian Cancer
3. Discussion
Glycosylation of CA125 from Serum Reveals Differences in N-glycans between Controls and Ovarian Cancer Patients
4. Experimental Section
4.1. Serum Samples
4.2. CA125 Isolation from Serum Samples
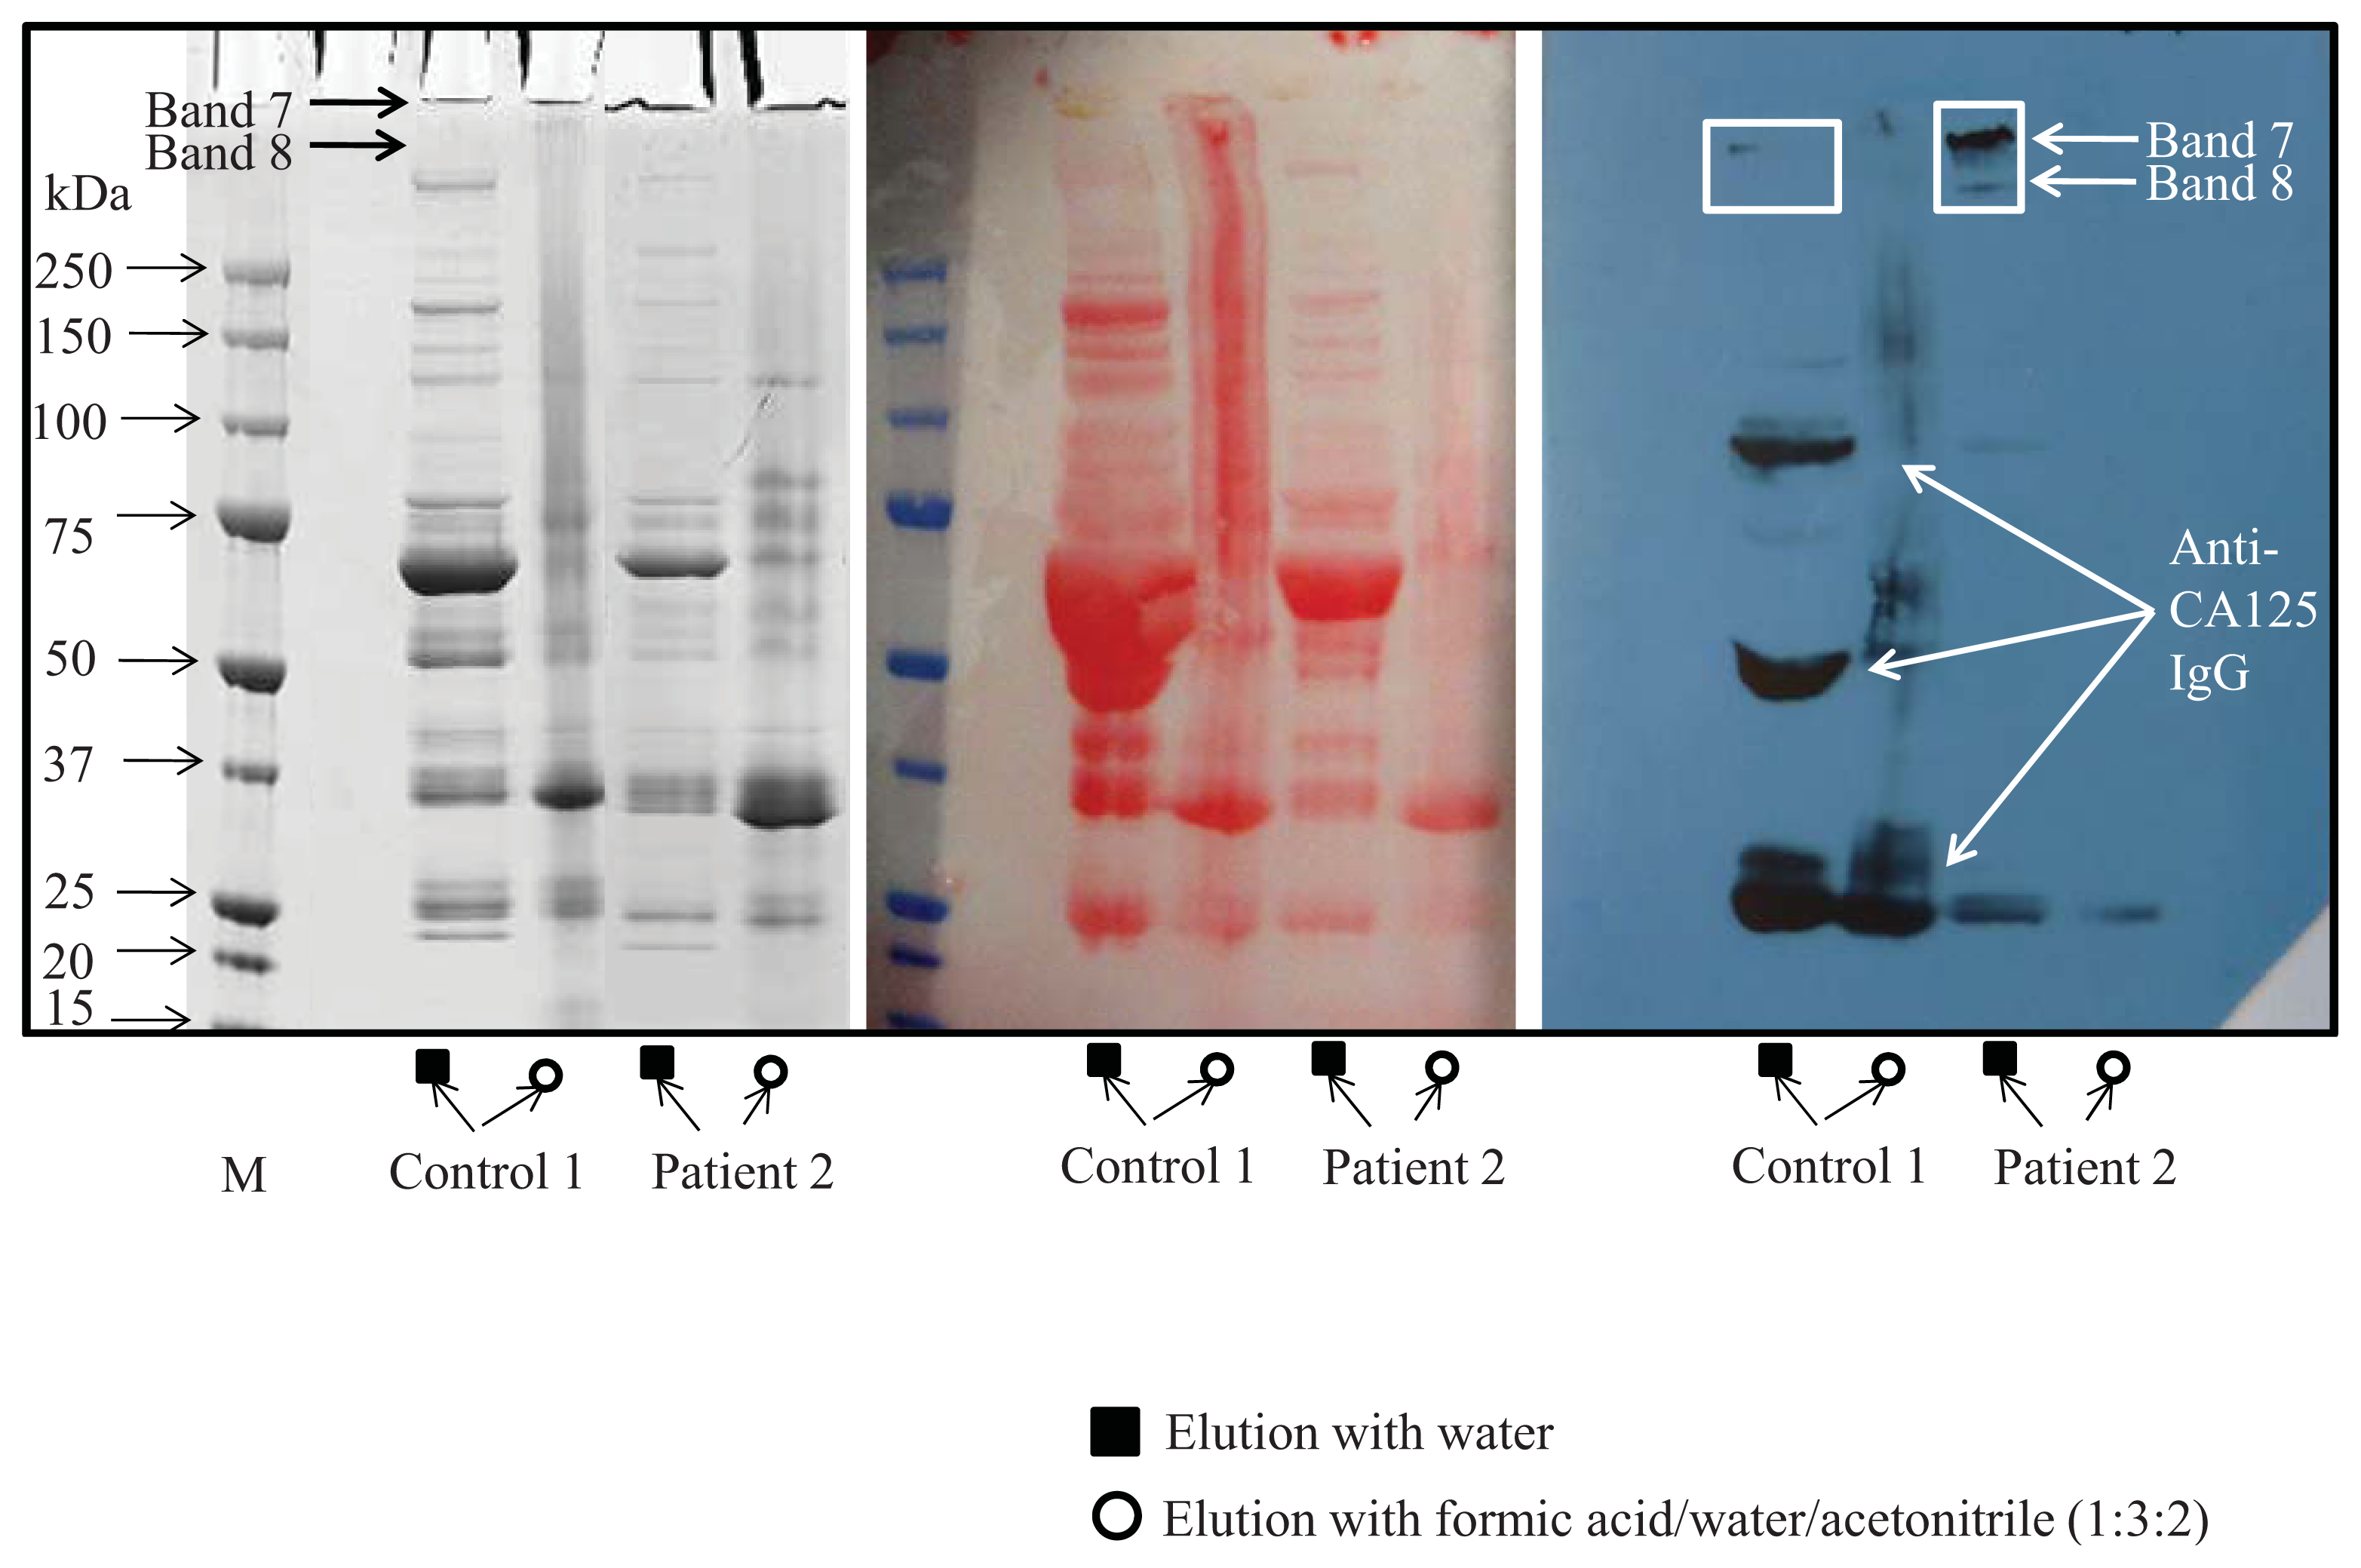
4.3. SDS-PAGE Electrophoresis
4.4. Western Blot
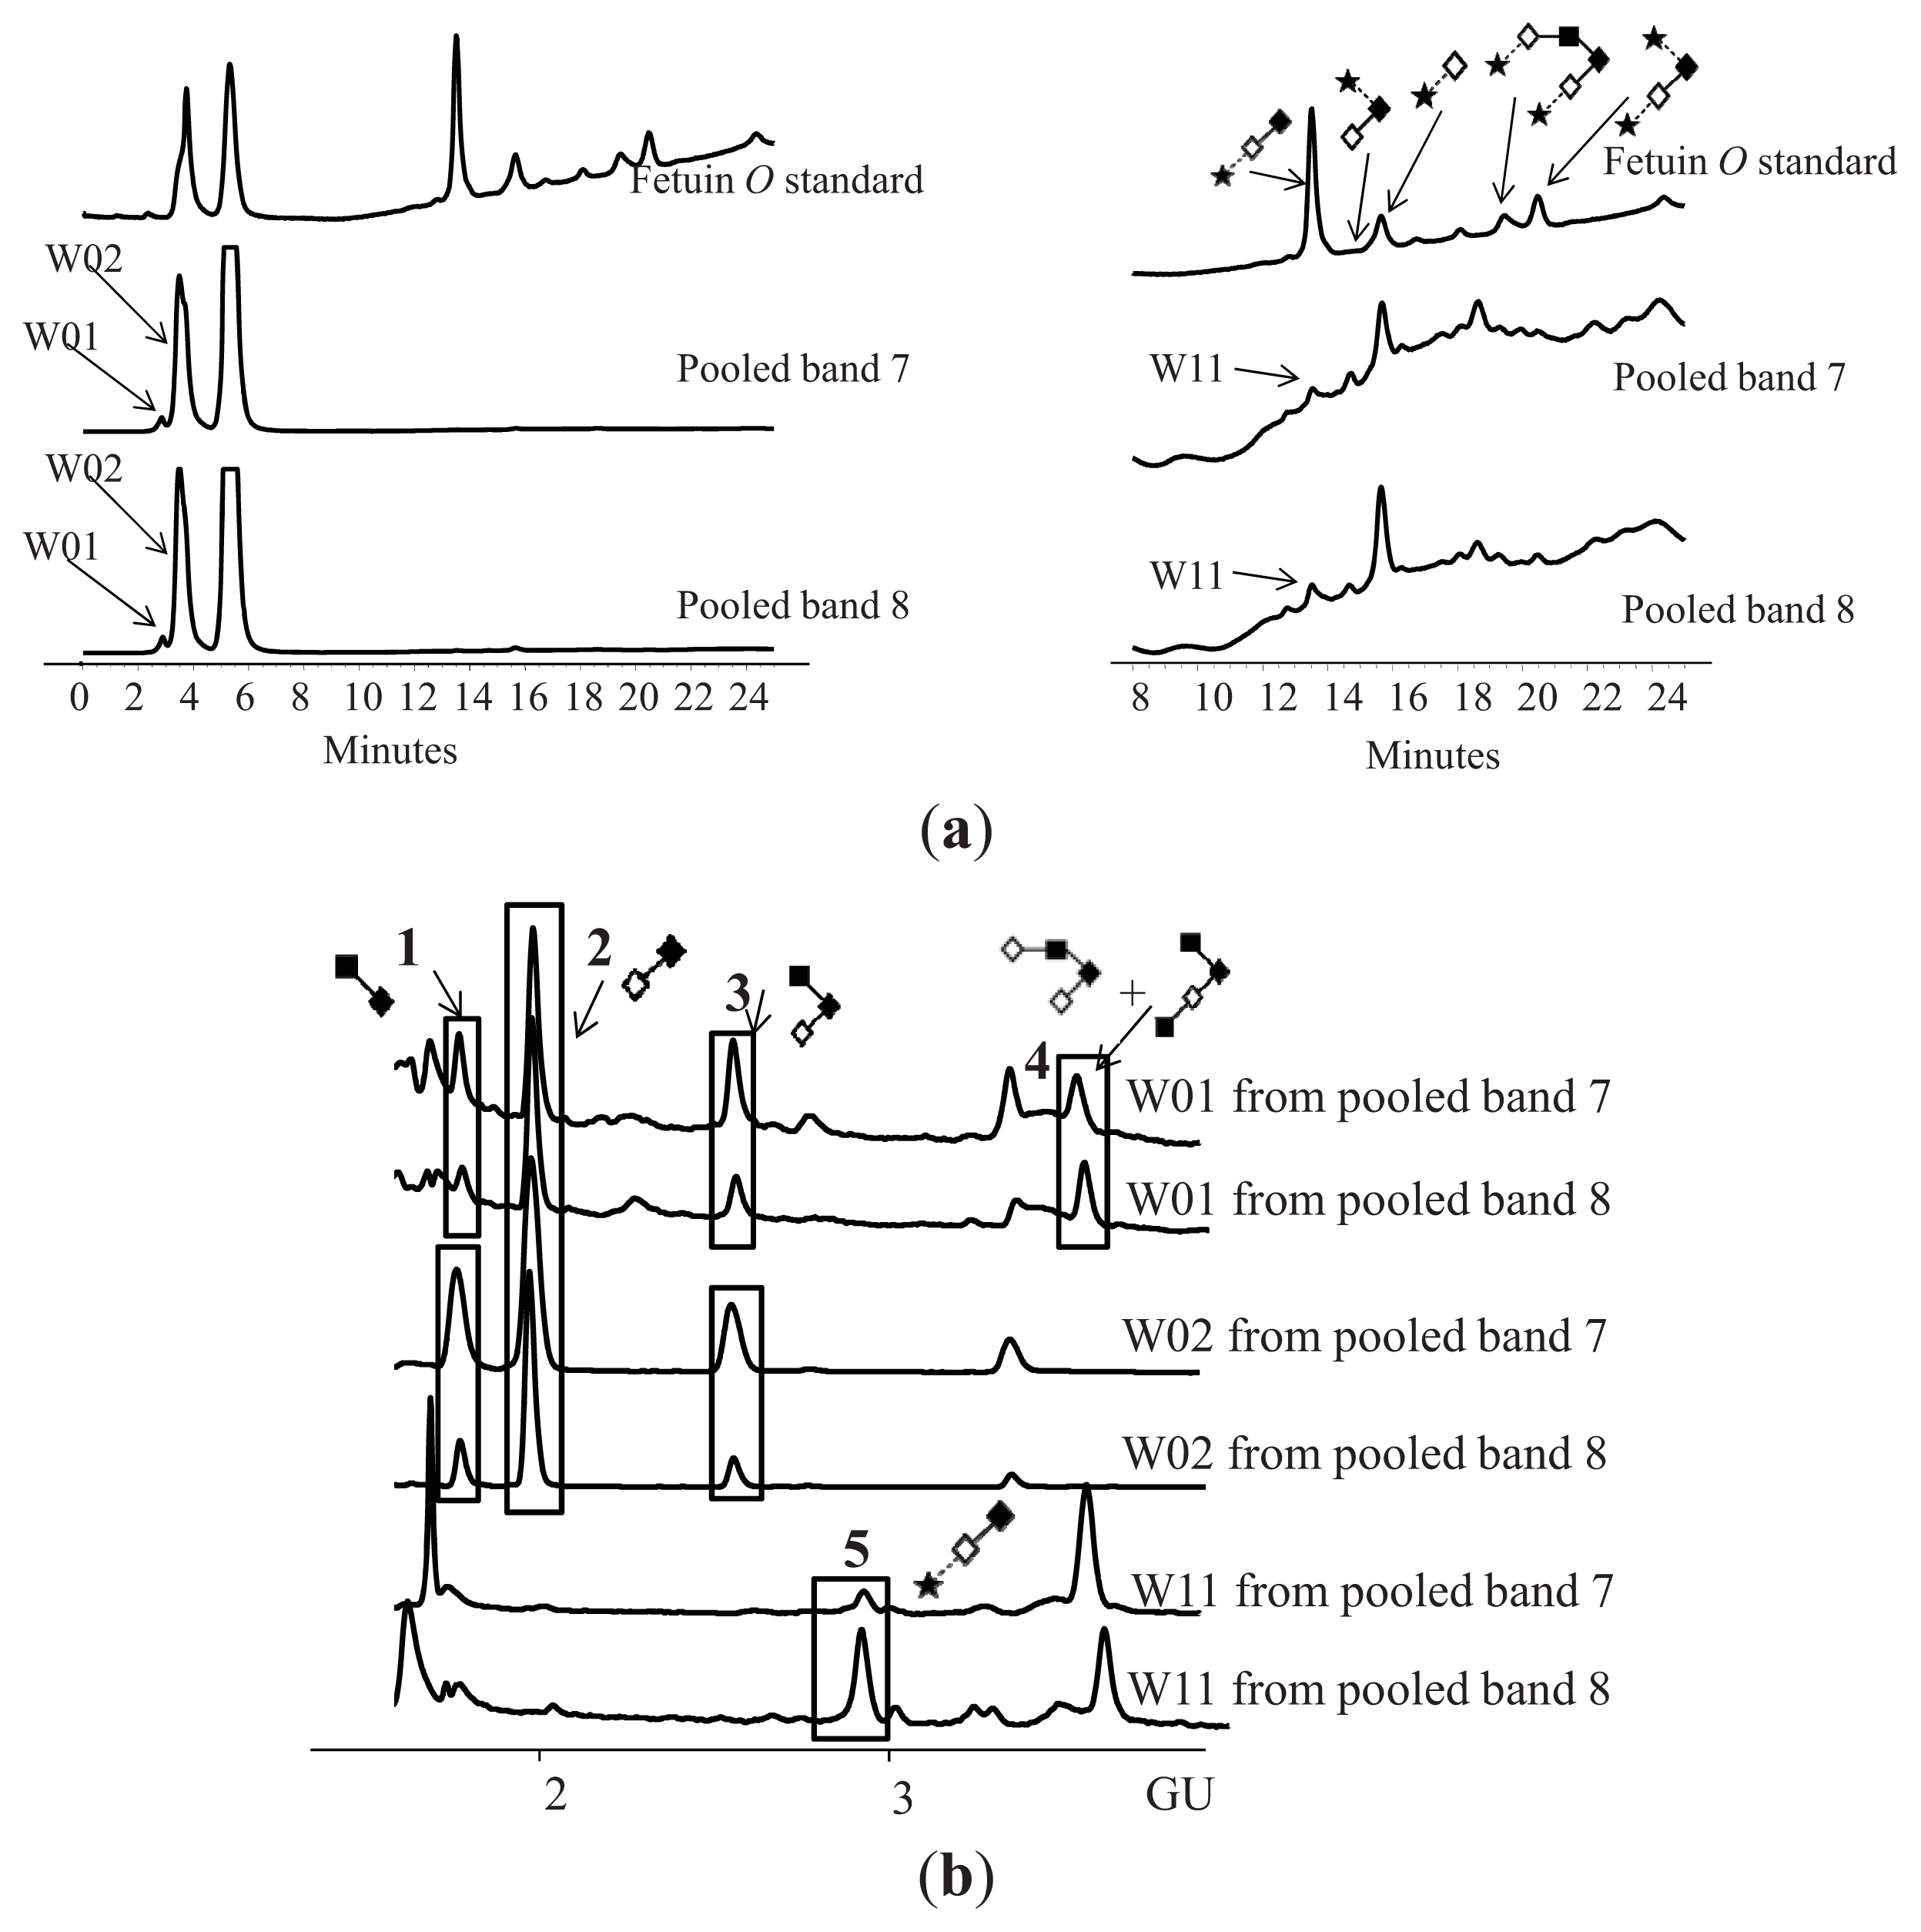
4.5. Release and Purification of N- and O-Glycans from Human Serum CA125 in Gel Block
4.6. Fluorescent Labelling of the Reducing Terminus of N-Glycans
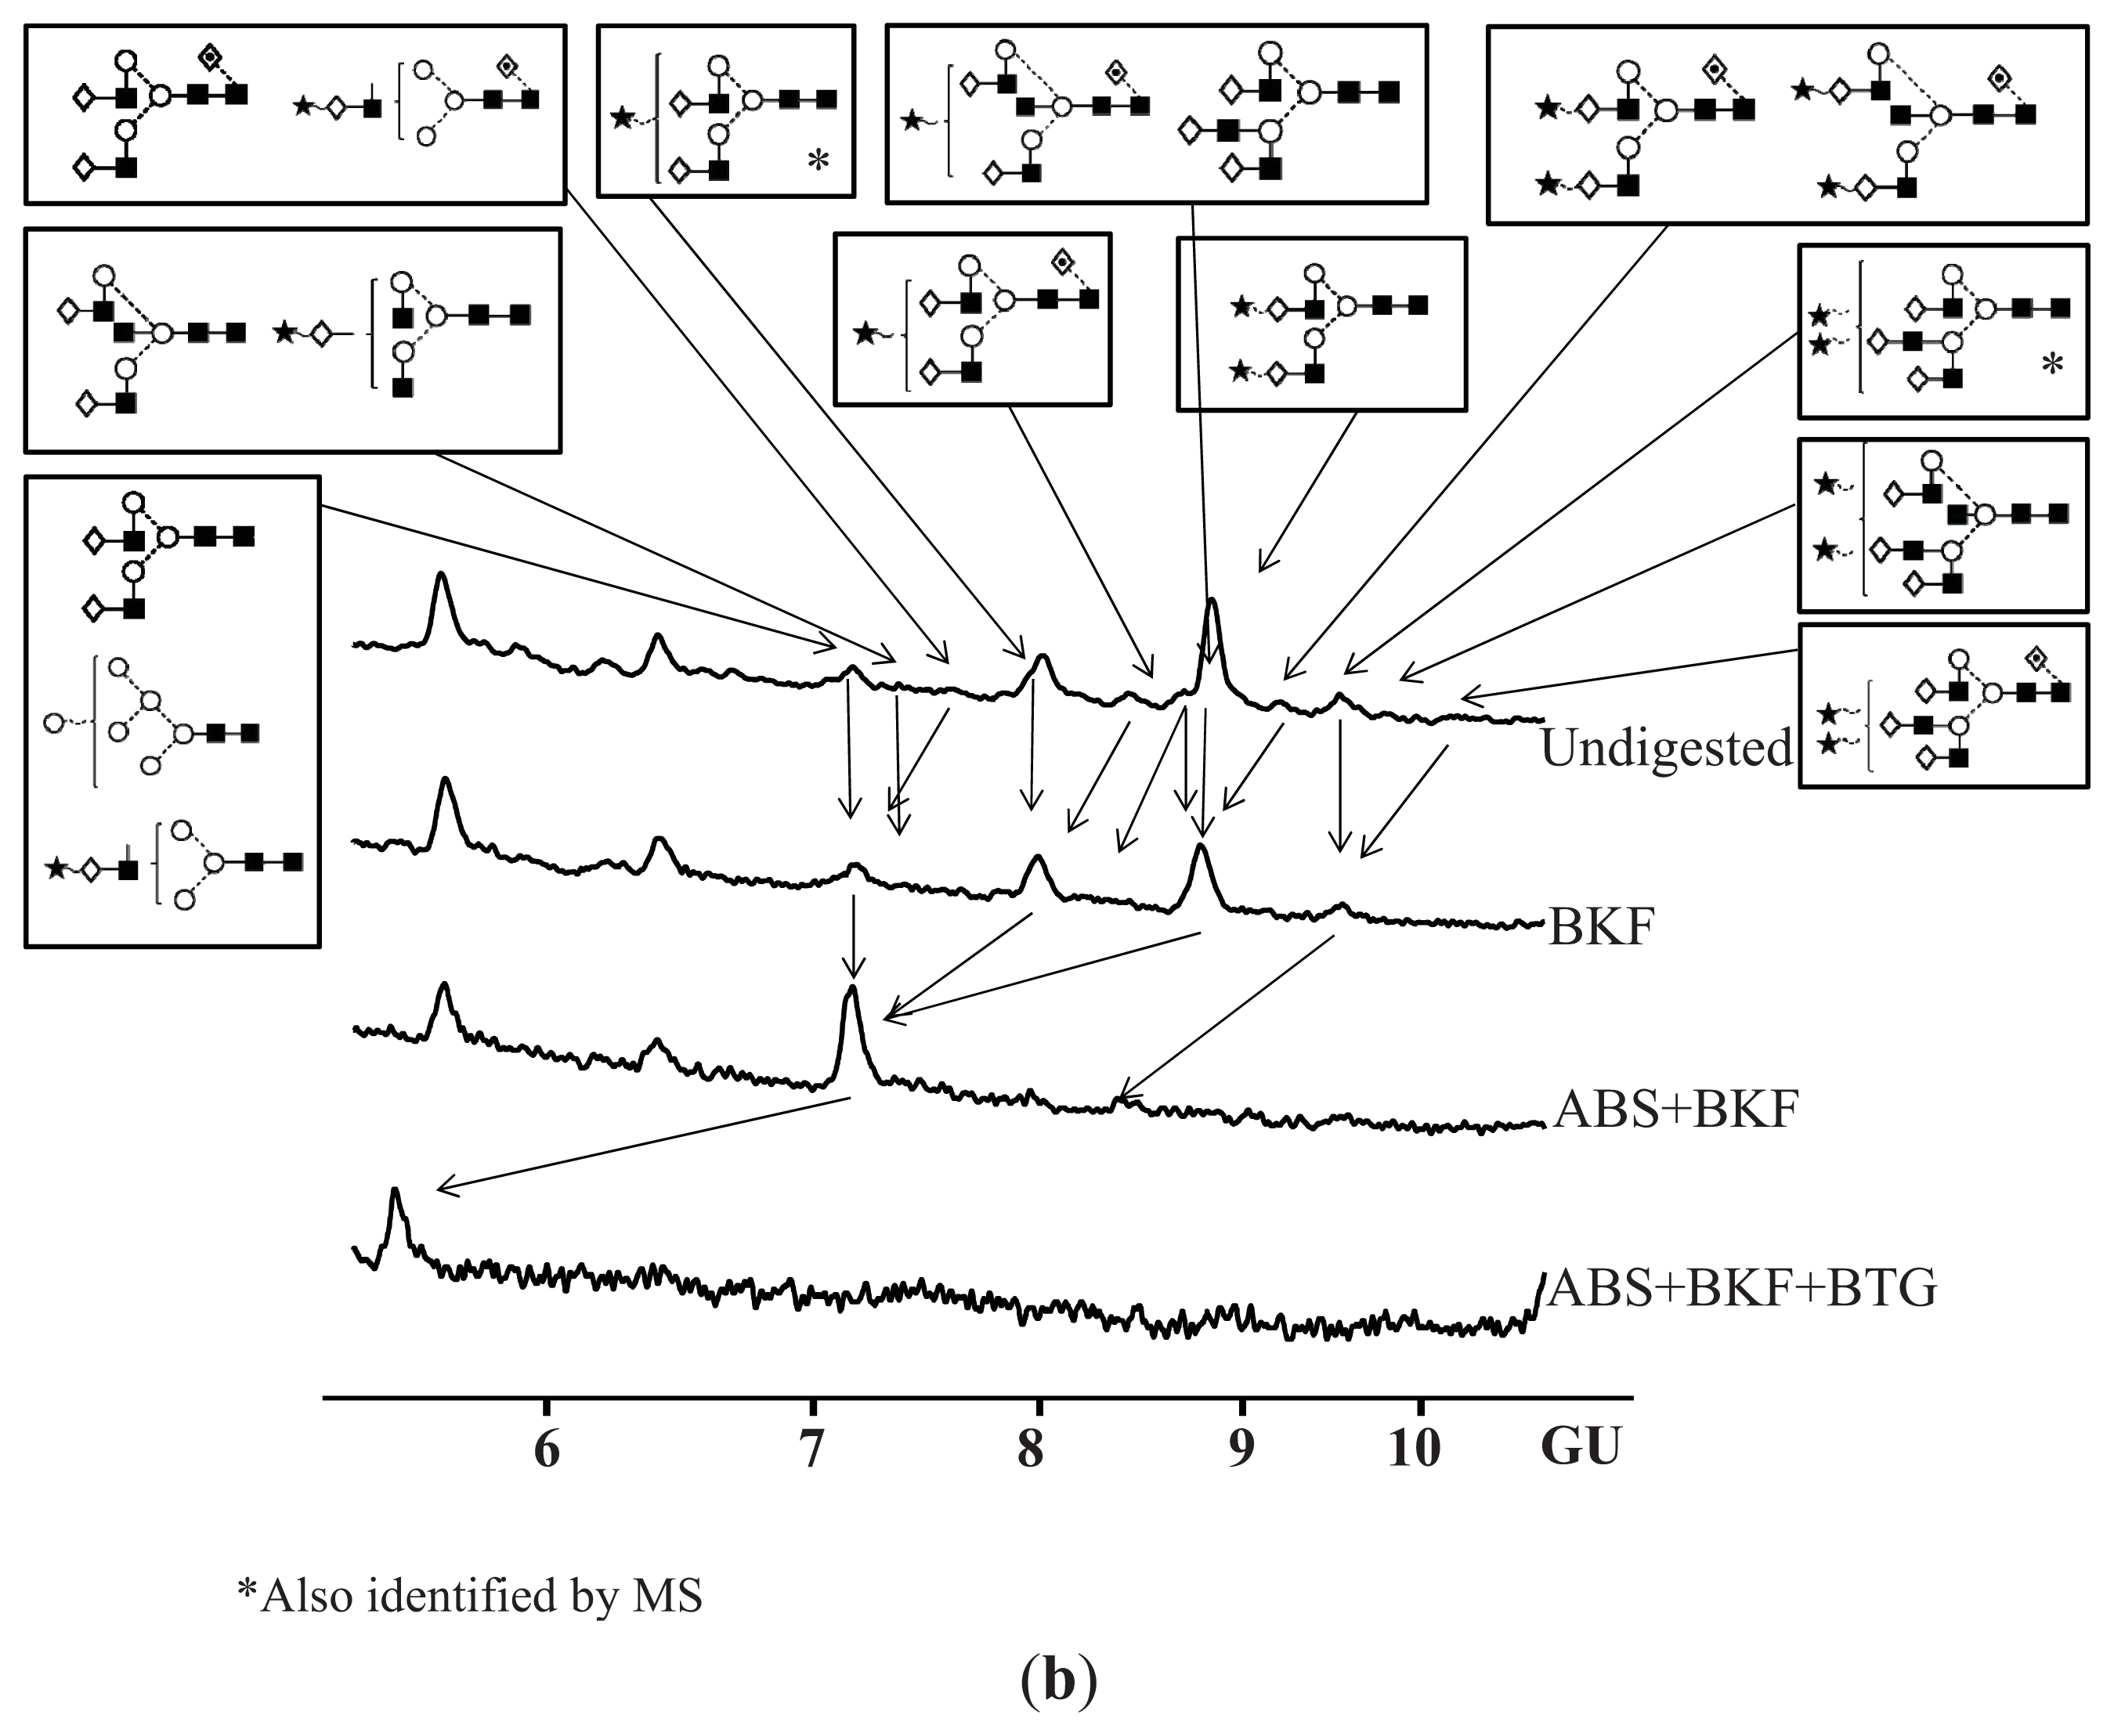
4.7. Exoglycosidase Digestion of 2AB Labelled N-Linked Glycans
4.8. Hydrophilic Interaction Liquid Chromatography (HILIC)
4.9. Weak Anion Exchange Chromatography (WAX)—High Performance Liquid Chromatography (HPLC)
4.10. Negative Ion Electrospray Ionisation Mass Spectrometry ESI-MS and ESI MS/MS
4.11. Protein Identification by Mass Spectrometry (MS)
4.12. CA125 ELISA
5. Conclusions
Supplementary Information
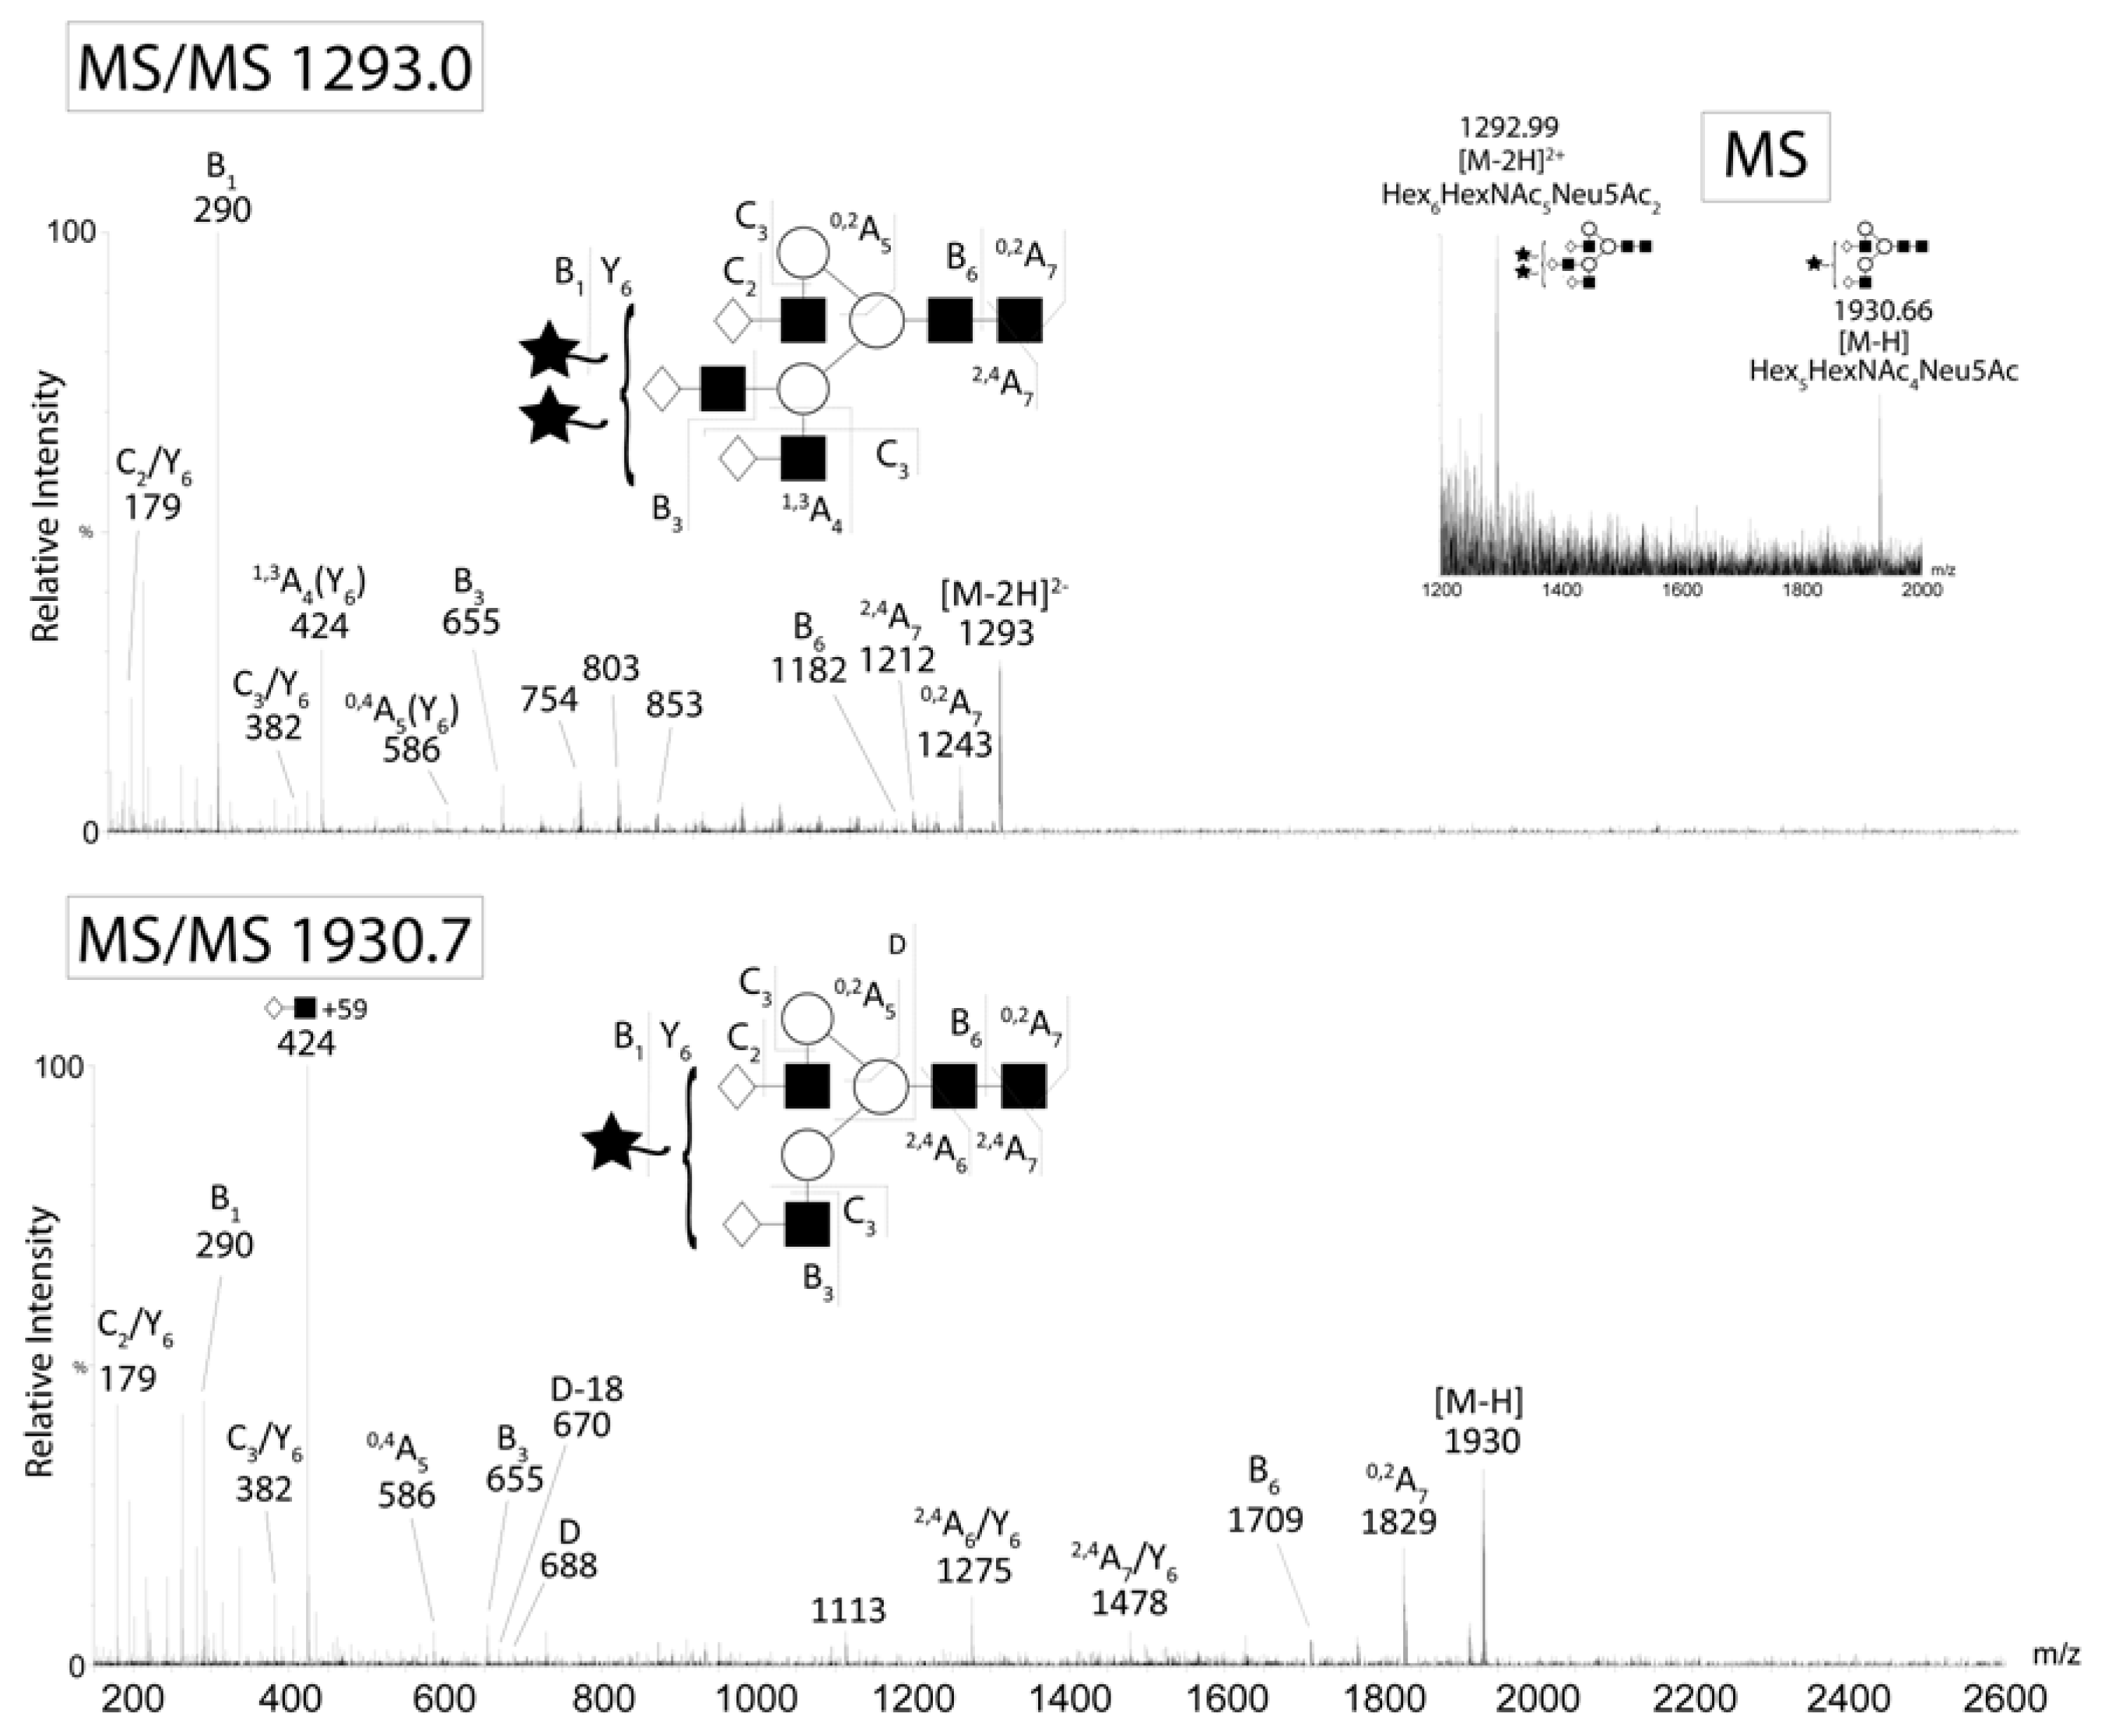
The major N-glycans from CA125 were detected as singly and doubly charged ions. CID of the A2G2S1 (m/z 1930 M-H-) and A3G3S2 (m/z 1293 M-2H2-) ions from CA125. Negative ion fragments confirmed the presence of the most abundant structures identified by HPLC. Fragment ion nomenclature was as proposed by Domon and Costello [43].
Acknowledgments
Conflict of Interest
References
- Zhang, B.; Cai, F.F.; Zhong, X.Y. An overview of biomarkers for the ovarian cancer diagnosis. Eur. J. Obstet. Gynecol. Reprod. Biol 2011, 158, 119–123. [Google Scholar]
- Scholler, N.; Urban, N. CA125 in ovarian cancer. Biomark Med 2007, 1, 513–523. [Google Scholar]
- Storr, S.J.; Royle, L.; Chapman, C.J.; Hamid, U.M.; Robertson, J.F.; Murray, A.; Dwek, R.A.; Rudd, P.M. The O-linked glycosylation of secretory/shed MUC1 from an advanced breast cancer patient’s serum. Glycobiology 2008, 18, 456–462. [Google Scholar]
- Gilgunn, S.; Conroy, P.J.; Saldova, R.; Rudd, P.M.; O’Kennedy, R.J. Aberrant PSA glycosylation-a sweet predictor of prostate cancer. Nat. Rev. Urol 2012, 10, 99–107. [Google Scholar]
- Bast, R.C., Jr; Feeney, M.; Lazarus, H.; Nadler, L.M.; Colvin, R.B.; Knapp, R.C. Reactivity of a monoclonal antibody with human ovarian carcinoma. J. Clin. Invest. 1981, 68, 1331–1337. [Google Scholar]
- Yin, B.W.; Lloyd, K.O. Molecular cloning of the CA125 ovarian cancer antigen: Identification as a new mucin, MUC16. J. Biol. Chem 2001, 276, 27371–27375. [Google Scholar]
- Rump, A.; Morikawa, Y.; Tanaka, M.; Minami, S.; Umesaki, N.; Takeuchi, M.; Miyajima, A. Binding of ovarian cancer antigen CA125/MUC16 to mesothelin mediates cell adhesion. J. Biol. Chem 2004, 279, 9190–9198. [Google Scholar]
- O’Brien, T.J.; Beard, J.B.; Underwood, L.J.; Dennis, R.A.; Santin, A.D.; York, L. The CA 125 gene: An extracellular superstructure dominated by repeat sequences. Tumour Biol 2001, 22, 348–366. [Google Scholar]
- Kui Wong, N.; Easton, R.L.; Panico, M.; Sutton-Smith, M.; Morrison, J.C.; Lattanzio, F.A.; Morris, H.R.; Clark, G.F.; Dell, A.; Patankar, M.S. Characterization of the oligosaccharides associated with the human ovarian tumor marker CA125. J. Biol. Chem 2003, 278, 28619–28634. [Google Scholar]
- Weiland, F.; Martin, K.; Oehler, M.K.; Hoffmann, P. Deciphering the Molecular Nature of Ovarian Cancer Biomarker CA125. Int. J. Mol. Sci 2012, 13, 10568–10582. [Google Scholar]
- Seelenmeyer, C.; Wegehingel, S.; Lechner, J.; Nickel, W. The cancer antigen CA125 represents a novel counter receptor for galectin-1. J. Cell Sci 2003, 116, 1305–1318. [Google Scholar]
- Gaetje, R.; Winnekendonk, D.W.; Scharl, A.; Kaufmann, M. Ovarian cancer antigen CA 125 enhances the invasiveness of the endometriotic cell line EEC 145. J. Soc. Gynecol. Investig 1999, 6, 278–281. [Google Scholar]
- Milutinovic, B.; Jankovic, M. Analysis of the protein and glycan parts of CA125 antigen from human amniotic fluid. Arch. Biol. Sci 2007, 59, 97–103. [Google Scholar]
- Jankovic, M.M.; Tapuskovic, B.S. Molecular forms and microheterogeneity of the oligosaccharide chains of pregnancy-associated CA125 antigen. Hum. Reprod 2005, 20, 2632–2638. [Google Scholar]
- Barrabes, S.; Pages-Pons, L.; Radcliffe, C.M.; Tabares, G.; Fort, E.; Royle, L.; Harvey, D.J.; Moenner, M.; Dwek, R.A.; Rudd, P.M.; et al. Glycosylation of serum ribonuclease 1 indicates a major endothelial origin and reveals an increase in core fucosylation in pancreatic cancer. Glycobiology 2007, 17, 388–400. [Google Scholar]
- Tabares, G.; Radcliffe, C.M.; Barrabes, S.; Ramirez, M.; Aleixandre, R.N.; Hoesel, W.; Dwek, R.A.; Rudd, P.M.; Peracaula, R.; de Llorens, R. Different glycan structures in prostate-specific antigen from prostate cancer sera in relation to seminal plasma PSA. Glycobiology 2006, 16, 132–145. [Google Scholar]
- Peter, J.; Unverzagt, C.; Lenz, H.; Hoesel, W. Purification of prostate-specific antigen from human serum by indirect immunosorption and elution with a hapten. Anal. Biochem 1999, 273, 98–104. [Google Scholar]
- Royle, L.; Campbell, M.P.; Radcliffe, C.M.; White, D.M.; Harvey, D.J.; Abrahams, J.L.; Kim, Y.G.; Henry, G.W.; Shadick, N.A.; Weinblatt, M.E.; et al. HPLC-based analysis of serum N-glycans on a 96-well plate platform with dedicated database software. Anal. Biochem 2008, 376, 1–12. [Google Scholar]
- Harvey, D.J.; Merry, A.H.; Royle, L.; Campbell, M.P.; Dwek, R.A.; Rudd, P.M. Proposal for a standard system for drawing structural diagrams of N- and O-linked carbohydrates and related compounds. Proteomics 2009, 9, 3796–3801. [Google Scholar]
- Peracaula, R.; Tabares, G.; Royle, L.; Harvey, D.J.; Dwek, R.A.; Rudd, P.M.; de Llorens, R. Altered glycosylation pattern allows the distinction between prostate-specific antigen (PSA) from normal and tumor origins. Glycobiology 2003, 13, 457–470. [Google Scholar]
- Peracaula, R.; Royle, L.; Tabares, G.; Mallorqui-Fernandez, G.; Barrabes, S.; Harvey, D.J.; Dwek, R.A.; Rudd, P.M.; de Llorens, R. Glycosylation of human pancreatic ribonuclease: differences between normal and tumor states. Glycobiology 2003, 13, 227–244. [Google Scholar]
- Varki, A.; Lowe, J.B. Exploring the Biological Roles of Glycans. In Essentials of Glycobiology; Varki, A., Cummings, R.D., Esko, J.D., Freeze, H.H., Stanley, P., Bertozzi, C.R., Hart, G.W., Etzler, M.E., Eds.; Cold Spring Laboratory Press: Cold Spring Harbor, NY, USA, 2009; pp. 57–68. [Google Scholar]
- Marino, K.; Bones, J.; Kattla, J.J.; Rudd, P.M. A systematic approach to protein glycosylation analysis: A path through the maze. Nat. Chem. Biol 2010, 6, 713–723. [Google Scholar]
- Yue, T.; Haab, B.B. Microarrays in glycoproteomics research. Clin. Lab. Med 2009, 29, 15–29. [Google Scholar]
- Saldova, R.; Wormald, M.R.; Dwek, R.A.; Rudd, P.M. Glycosylation changes on serum glycoproteins in ovarian cancer may contribute to disease pathogenesis. Dis. Markers 2008, 25, 219–232. [Google Scholar]
- Saldova, R.; Royle, L.; Radcliffe, C.M.; Abd Hamid, U.M.; Evans, R.; Arnold, J.N.; Banks, R.E.; Hutson, R.; Harvey, D.J.; Antrobus, R.; et al. Ovarian cancer is associated with changes in glycosylation in both acute-phase proteins and IgG. Glycobiology 2007, 17, 1344–1356. [Google Scholar]
- Brockhausen, I. Pathways of O-glycan biosynthesis in cancer cells. Biochim. Biophys. Acta 1999, 1473, 67–95. [Google Scholar]
- Tsuboi, S.; Hatakeyama, S.; Ohyama, C.; Fukuda, M. Two opposing roles of O-glycans in tumor metastasis. Trends Mol. Med 2012, 18, 224–232. [Google Scholar]
- Laemmli, U.K. Cleavage of structural proteins during the assembly of the head of bacteriophage T4. Nature 1970, 227, 680–685. [Google Scholar]
- Huang, Y.; Mechref, Y.; Novotny, M.V. Microscale nonreductive release of O-linked glycans for subsequent analysis through MALDI mass spectrometry and capillary electrophoresis. Anal. Chem 2001, 73, 6063–6069. [Google Scholar]
- Bigge, J.C.; Patel, T.P.; Bruce, J.A.; Goulding, P.N.; Charles, S.M.; Parekh, R.B. Nonselective and efficient fluorescent labeling of glycans using 2-amino benzamide and anthranilic acid. Anal. Biochem 1995, 230, 229–238. [Google Scholar]
- Royle, L.; Radcliffe, C.M.; Dwek, R.A.; Rudd, P.M. Detailed structural analysis of N-glycans released from glycoproteins in SDS-PAGE gel bands using HPLC combined with exoglycosidase array digestions. Methods Mol. Biol 2006, 347, 125–143. [Google Scholar]
- Royle, L.; Mattu, T.S.; Hart, E.; Langridge, J.I.; Merry, A.H.; Murphy, N.; Harvey, D.J.; Dwek, R.A.; Rudd, P.M. An analytical and structural database provides a strategy for sequencing O-glycans from microgram quantities of glycoproteins. Anal. Biochem 2002, 304, 70–90. [Google Scholar]
- Harvey, D.J. Fragmentation of negative ions from carbohydrates: Part 2. Fragmentation of high-mannose N-linked glycans. J. Am. Soc. Mass Spectrom 2005, 16, 631–646. [Google Scholar]
- Harvey, D.J. Fragmentation of negative ions from carbohydrates: Part 1. Use of nitrate and other anionic adducts for the production of negative ion electrospray spectra from N-linked carbohydrates. J. Am. Soc. Mass Spectrom 2005, 16, 622–630. [Google Scholar]
- Harvey, D.J. Fragmentation of negative ions from carbohydrates: Part 3. Fragmentation of hybrid and complex N-linked glycans. J. Am. Soc. Mass Spectrom 2005, 16, 647–659. [Google Scholar]
- Harvey, D.J.; Royle, L.; Radcliffe, C.M.; Rudd, P.M.; Dwek, R.A. Structural and quantitative analysis of N-linked glycans by matrix-assisted laser desorption ionization and negative ion nanospray mass spectrometry. Anal. Biochem 2008, 376, 44–60. [Google Scholar]
- Marino, K.; Saldova, R.; Adamczyk, B.; Rudd, P.M. Changes in serum N-glycosylation profiles: Functional significance and potential for diagnostics. Carbohydr. Chem 2012, 37, 57–93. [Google Scholar]
- Arnold, J.N.; Saldova, R.; Galligan, M.C.; Murphy, T.B.; Mimura-Kimura, Y.; Telford, J.E.; Godwin, A.K.; Rudd, P.M. Novel biomarkers for the detection of lung cancer. J. Proteome Res 2011, 10, 1755–1764. [Google Scholar]
- Miyoshi, E.; Shinzaki, S.; Moriwaki, K.; Matsumoto, H.; Minoru, F. Identification of fucosylated haptoglobin as a novel tumor marker for pancreatic cancer and its possible application for a clinical diagnostic test. Methods Enzymol 2010, 478, 153–164. [Google Scholar]
- Pierce, A.; Saldova, R.; Abd Hamid, U.M.; Abrahams, J.L.; McDermott, E.W.; Evoy, D.; Duffy, M.J.; Rudd, P.M. Levels of specific glycans significantly distinguish lymph node-positive from lymph node-negative breast cancer patients. Glycobiology 2010, 20, 1283–1288. [Google Scholar]
- Chen, K.; Gentry-Maharaj, A.; Burnell, M.; Steentoft, C.; Marcos-Silva, L.; Mandel, U.; Jacobs, I.; Dawnay, A.; Menon, U.; Blixt, O. microarray Glycoprofiling of CA125 improves differential diagnosis of ovarian cancer. J. Proteome Res 2013, 12, 1408–1418. [Google Scholar]
- Domon, B.; Costello, C.E. A systematic nomenclature for carbohydrate fragmentations in FAB-MS/MS spectra of glycoconjugates. Glycoconj. J 1988, 5, 397–409. [Google Scholar]


| Peak number | GU | 1 Abbreviation | 2 Structures |
|---|---|---|---|
| 1 | 7.08 | M6 |  |
| A2G2 |  | ||
| A1G1S1 | 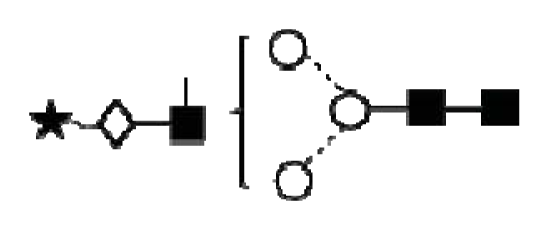 | ||
| 2 | 7.23 | A2BG2 | 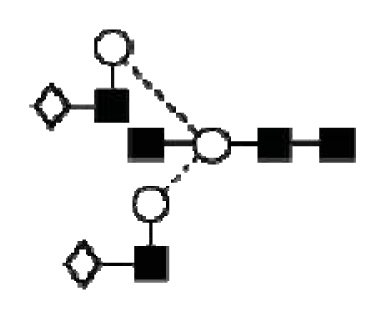 |
| A2G1S1 | 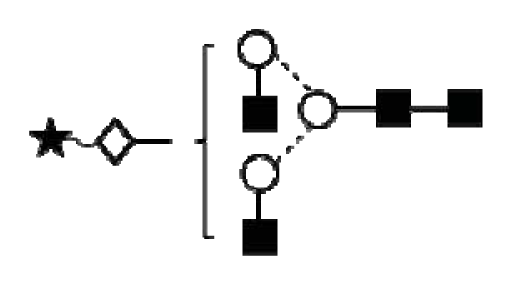 | ||
| 3 | 7.47 | FA2G2 | 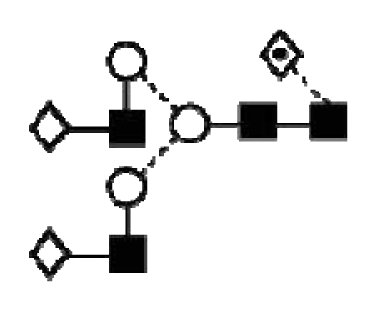 |
| FA1G1S1 | 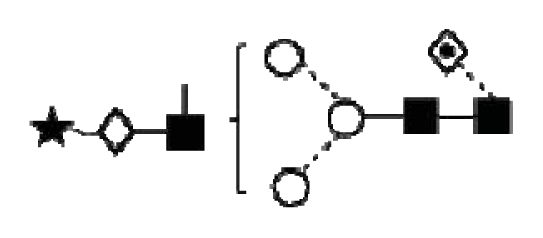 | ||
| 4 | 7.92 | 3A2G2S1 | 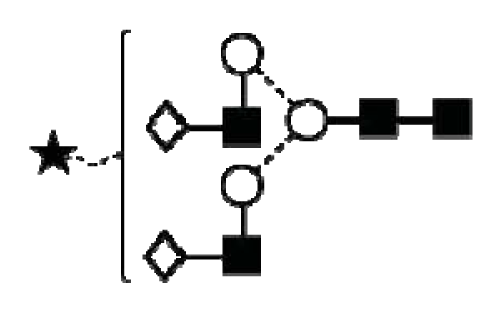 |
| 5 | 8.34 | FA2G2S1 | 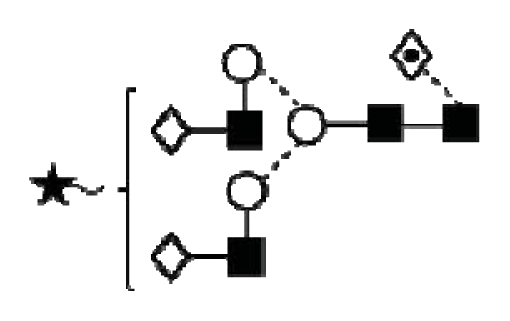 |
| 6 | 8.55 | FA2BG2S1 | 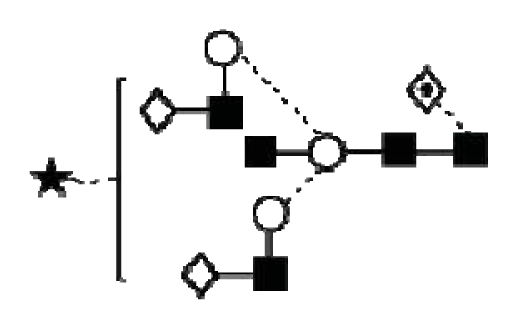 |
| A3G3 | 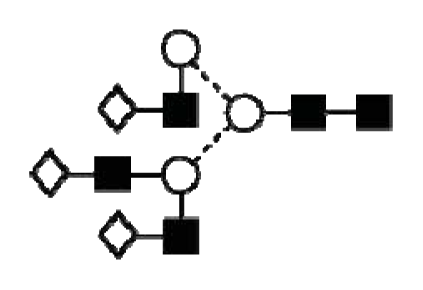 | ||
| 7 | 8.75 | A2G2S2 | 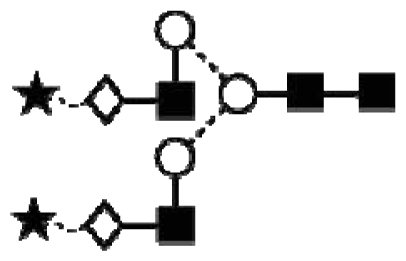 |
| 8 | 9.10 | FA2G2S2 | 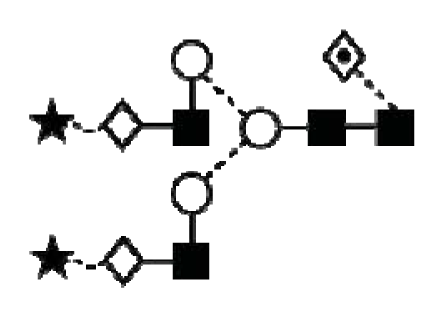 |
| FA2BG2S2 | 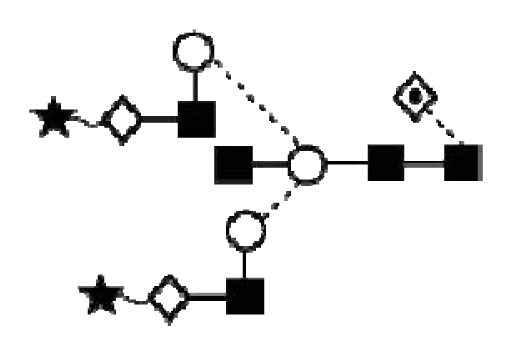 | ||
| 9 | 9.37 | 3A3G3S2 | 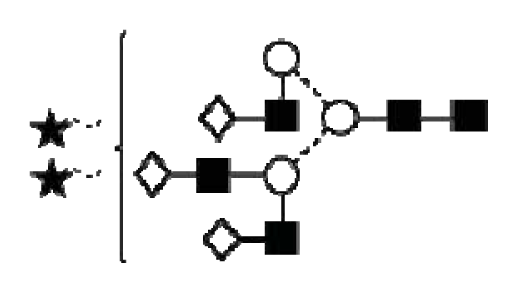 |
| 10 | 9.58 | A3BG3S2 | 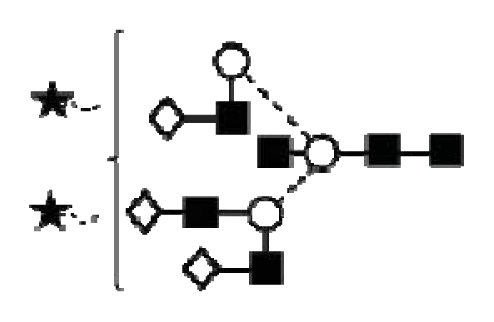 |
| 11 | 10.11 | FA3G3S2 | 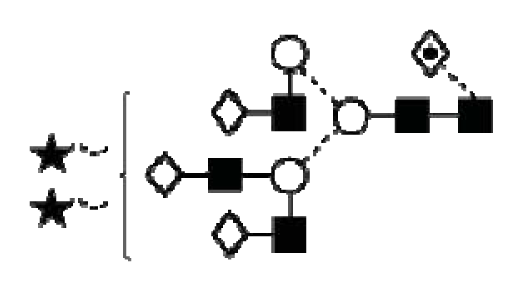 |
| Band | 7 Glycan(s) | Controls | Patients | Fold difference |
|---|---|---|---|---|
| % Area 1 | ||||
| Peak 2 | A2BG2+A2G1S1 | 4.08 ± 0.57 | 2.16 ± 1.09 | 1.9 |
| Peak 5 | FA2G2S1 | 10.02 ± 3.78 | 18.64 ± 10.40 | 1.9 |
| Peak 6 | FA2BG2S1+A3G3 | 10.02 ± 0.07 | 4.10 ± 2.03 | 2.4 |
| Band 8 | Glycan(s) | Controls | Patients | Fold difference |
| % Area1 | ||||
| Peak 1 | A2G2+M6+A1G1S1 | 19.87 ± 6.24 | 4.90 ± 4.11 | 4.1 |
| Peak 2 | A2BG2+A2G1S1 | 10.28 ± 2.75 | 6.06 ± 3.68 | 1.7 |
| Peak 5 | FA2G2S1 | 3.15 ± 2.18 | 8.96 ± 1.30 | 2.8 |
| Peak number | GU | Abbreviation | Structures 1 | |
|---|---|---|---|---|
| 1 | 1.72 | GlcNAcß1–6GalNAc |  | Core 1 |
| 2 | 1.96 | Galß1–3GalNAc |  | Core 1 |
| 3 | 2.59 | Galß1–3[GlcNAcß1–6]GalNAc |  | Core 2 |
| 4 | 3.60 | Galß1–4GlcNAcß1–6[Galß1–3]GalNAc | 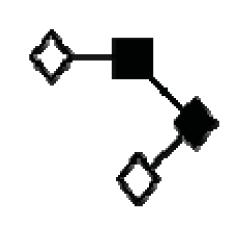 | Core 2 |
| GlcNAcß1–6[GlcNAcß1–3Galß1–3]GalNAc |  | Core 2 | ||
| 5 | 2.94 | NeuNAca2–3Galß1–3GalNAc |  | Core 2 |
© 2013 by the authors; licensee MDPI, Basel, Switzerland This article is an open access article distributed under the terms and conditions of the Creative Commons Attribution license (http://creativecommons.org/licenses/by/3.0/).
Share and Cite
Saldova, R.; Struwe, W.B.; Wynne, K.; Elia, G.; Duffy, M.J.; Rudd, P.M. Exploring the Glycosylation of Serum CA125. Int. J. Mol. Sci. 2013, 14, 15636-15654. https://doi.org/10.3390/ijms140815636
Saldova R, Struwe WB, Wynne K, Elia G, Duffy MJ, Rudd PM. Exploring the Glycosylation of Serum CA125. International Journal of Molecular Sciences. 2013; 14(8):15636-15654. https://doi.org/10.3390/ijms140815636
Chicago/Turabian StyleSaldova, Radka, Weston B. Struwe, Kieran Wynne, Giuliano Elia, Michael J. Duffy, and Pauline M. Rudd. 2013. "Exploring the Glycosylation of Serum CA125" International Journal of Molecular Sciences 14, no. 8: 15636-15654. https://doi.org/10.3390/ijms140815636
APA StyleSaldova, R., Struwe, W. B., Wynne, K., Elia, G., Duffy, M. J., & Rudd, P. M. (2013). Exploring the Glycosylation of Serum CA125. International Journal of Molecular Sciences, 14(8), 15636-15654. https://doi.org/10.3390/ijms140815636