Transcriptional Profiling of Swine Lung Tissue after Experimental Infection with Actinobacillus pleuropneumoniae

 ,
,
Abstract
:1. Introduction
2. Results
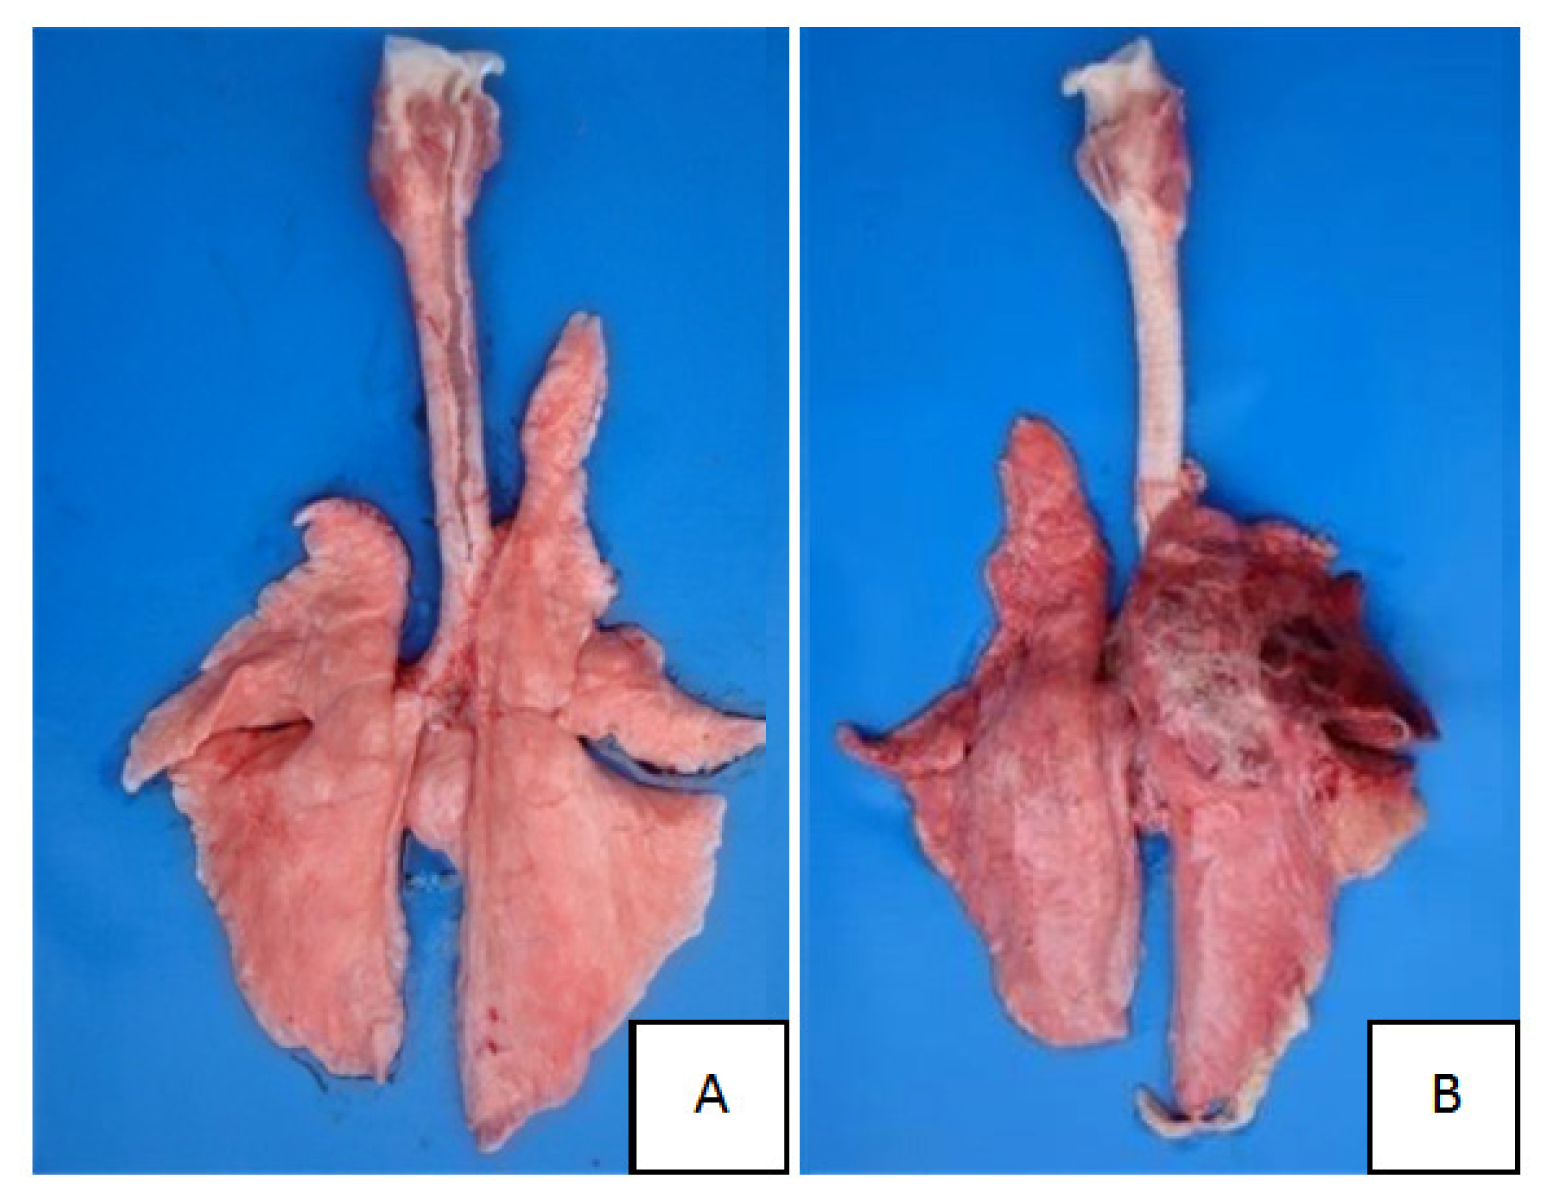
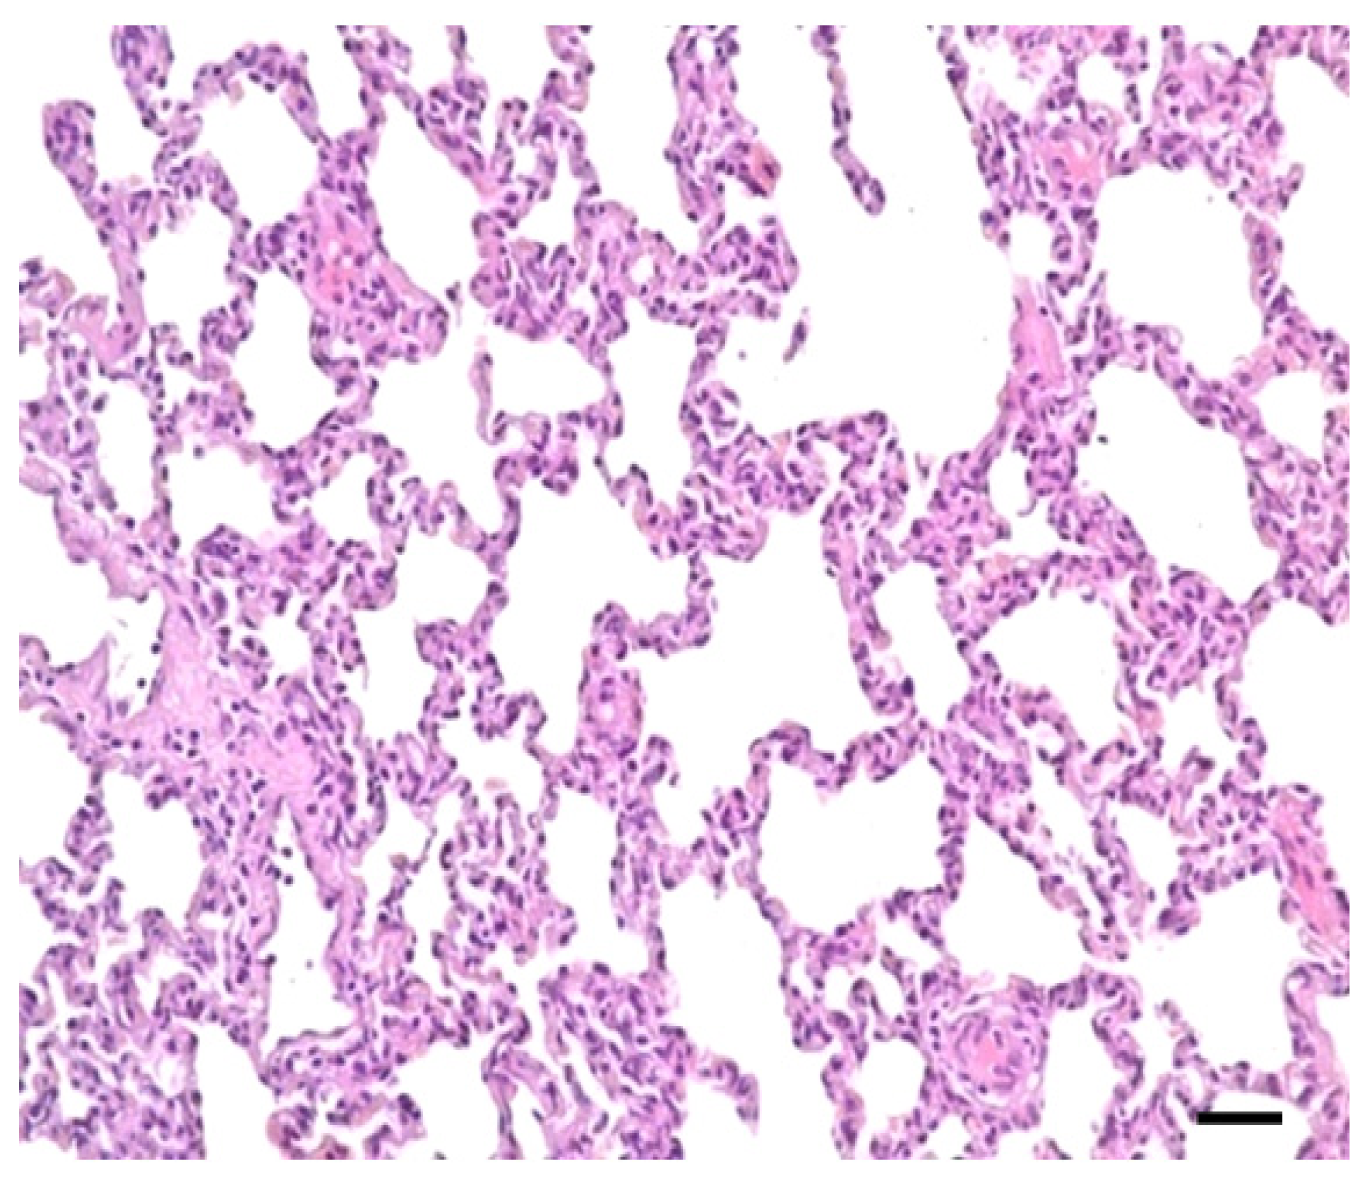
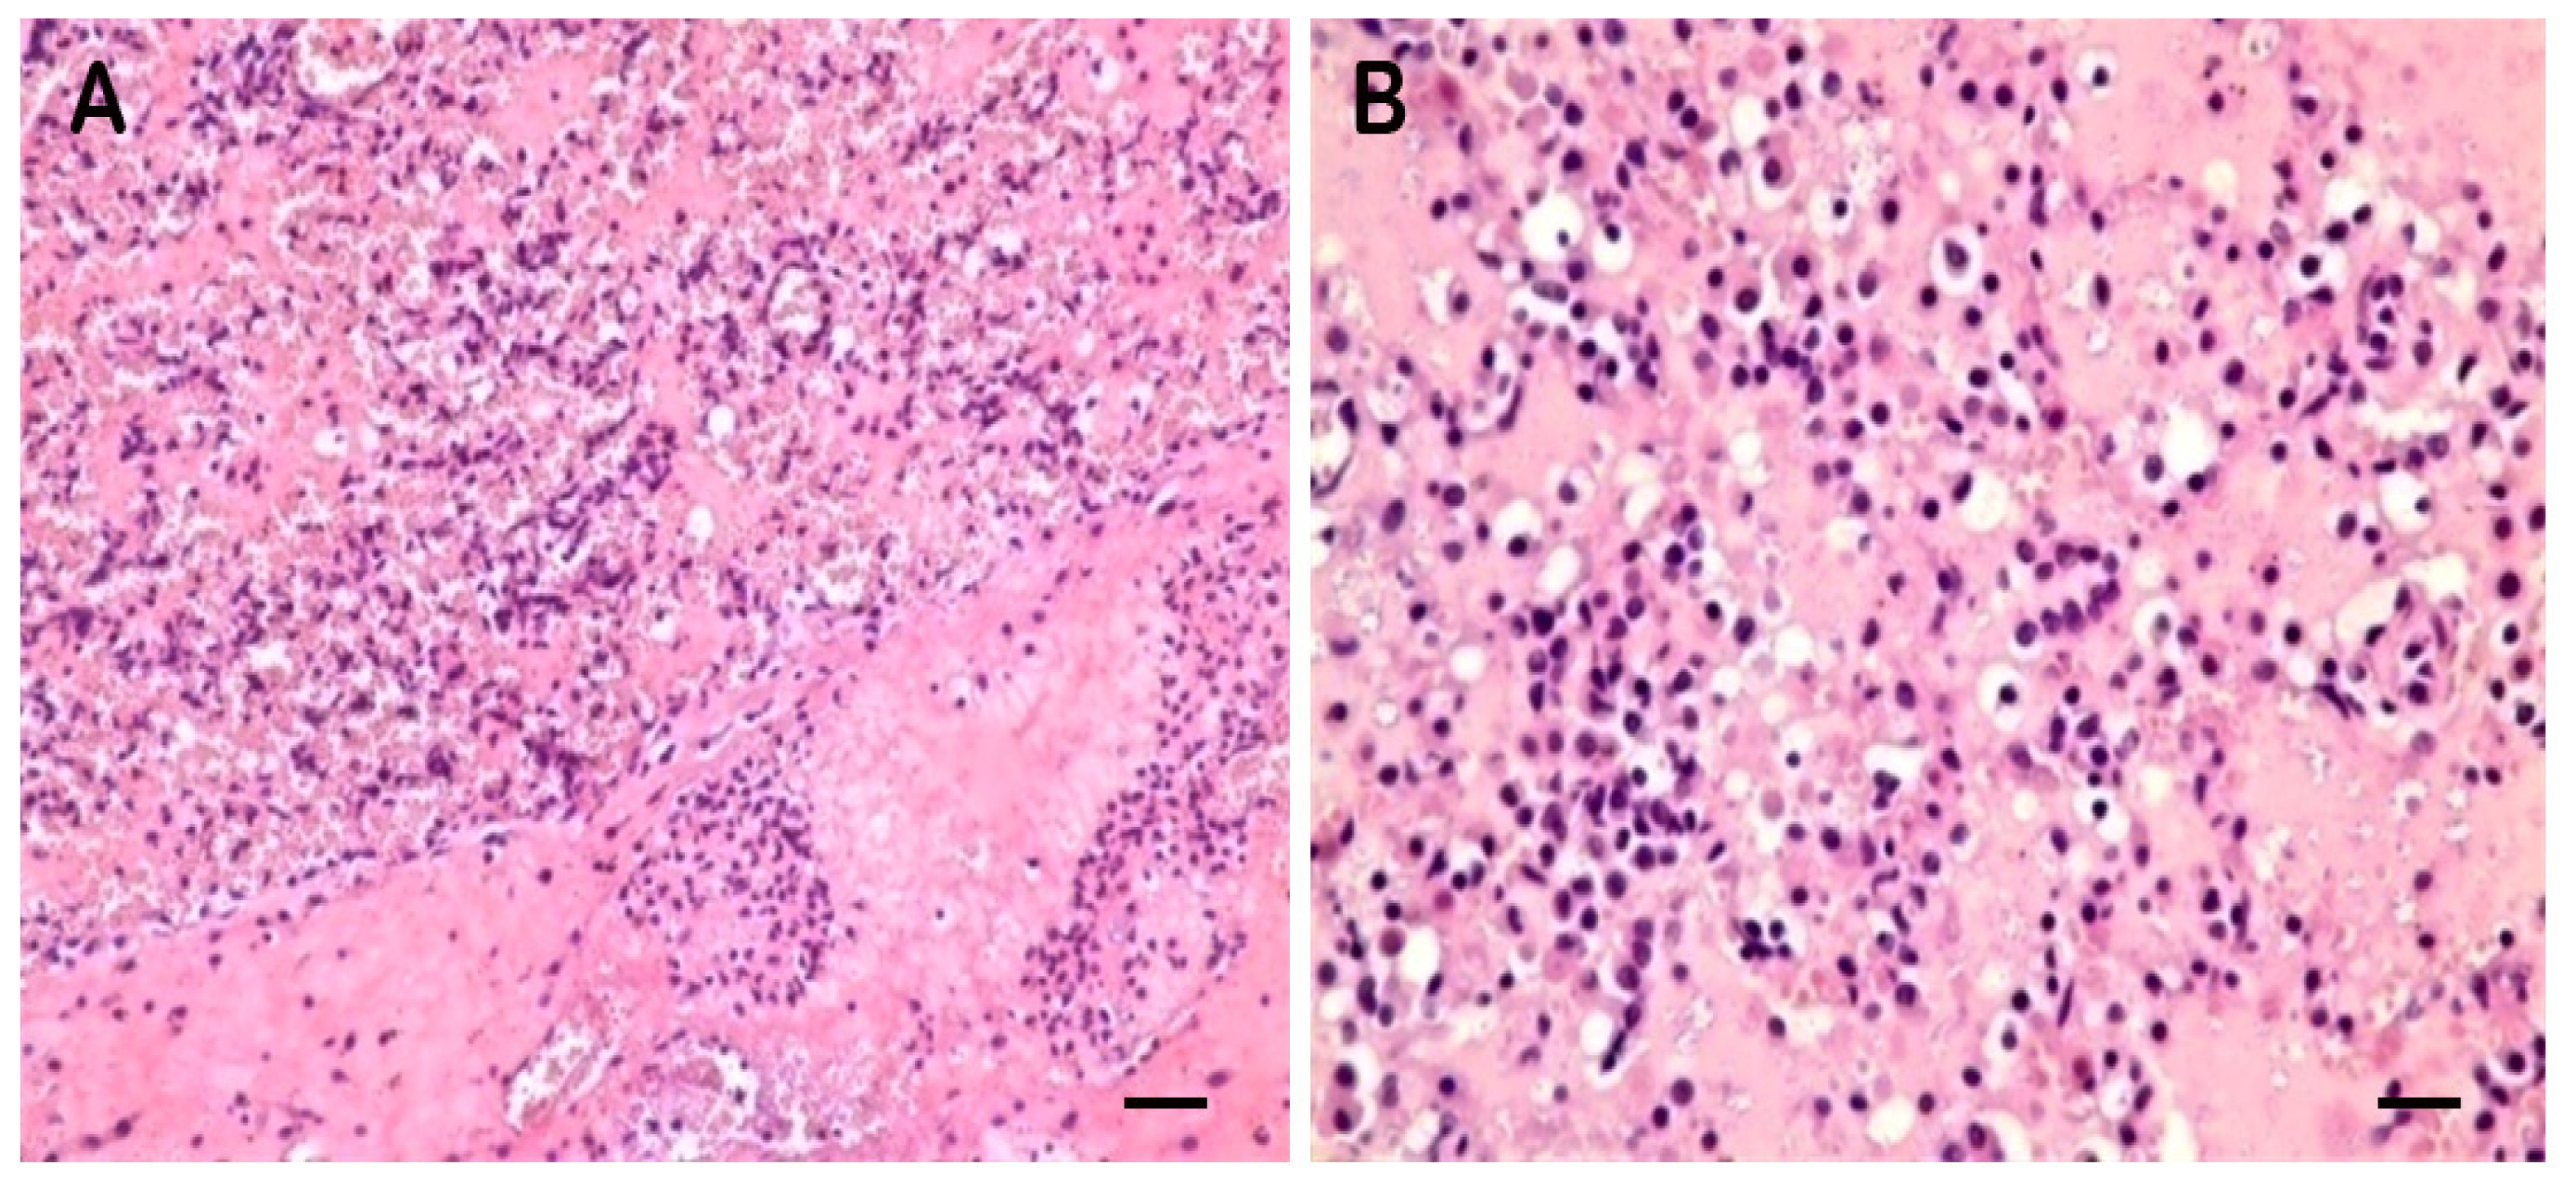
2.1. Clinical Symptoms and Necropsy Findings
2.2. Microarray Profiling
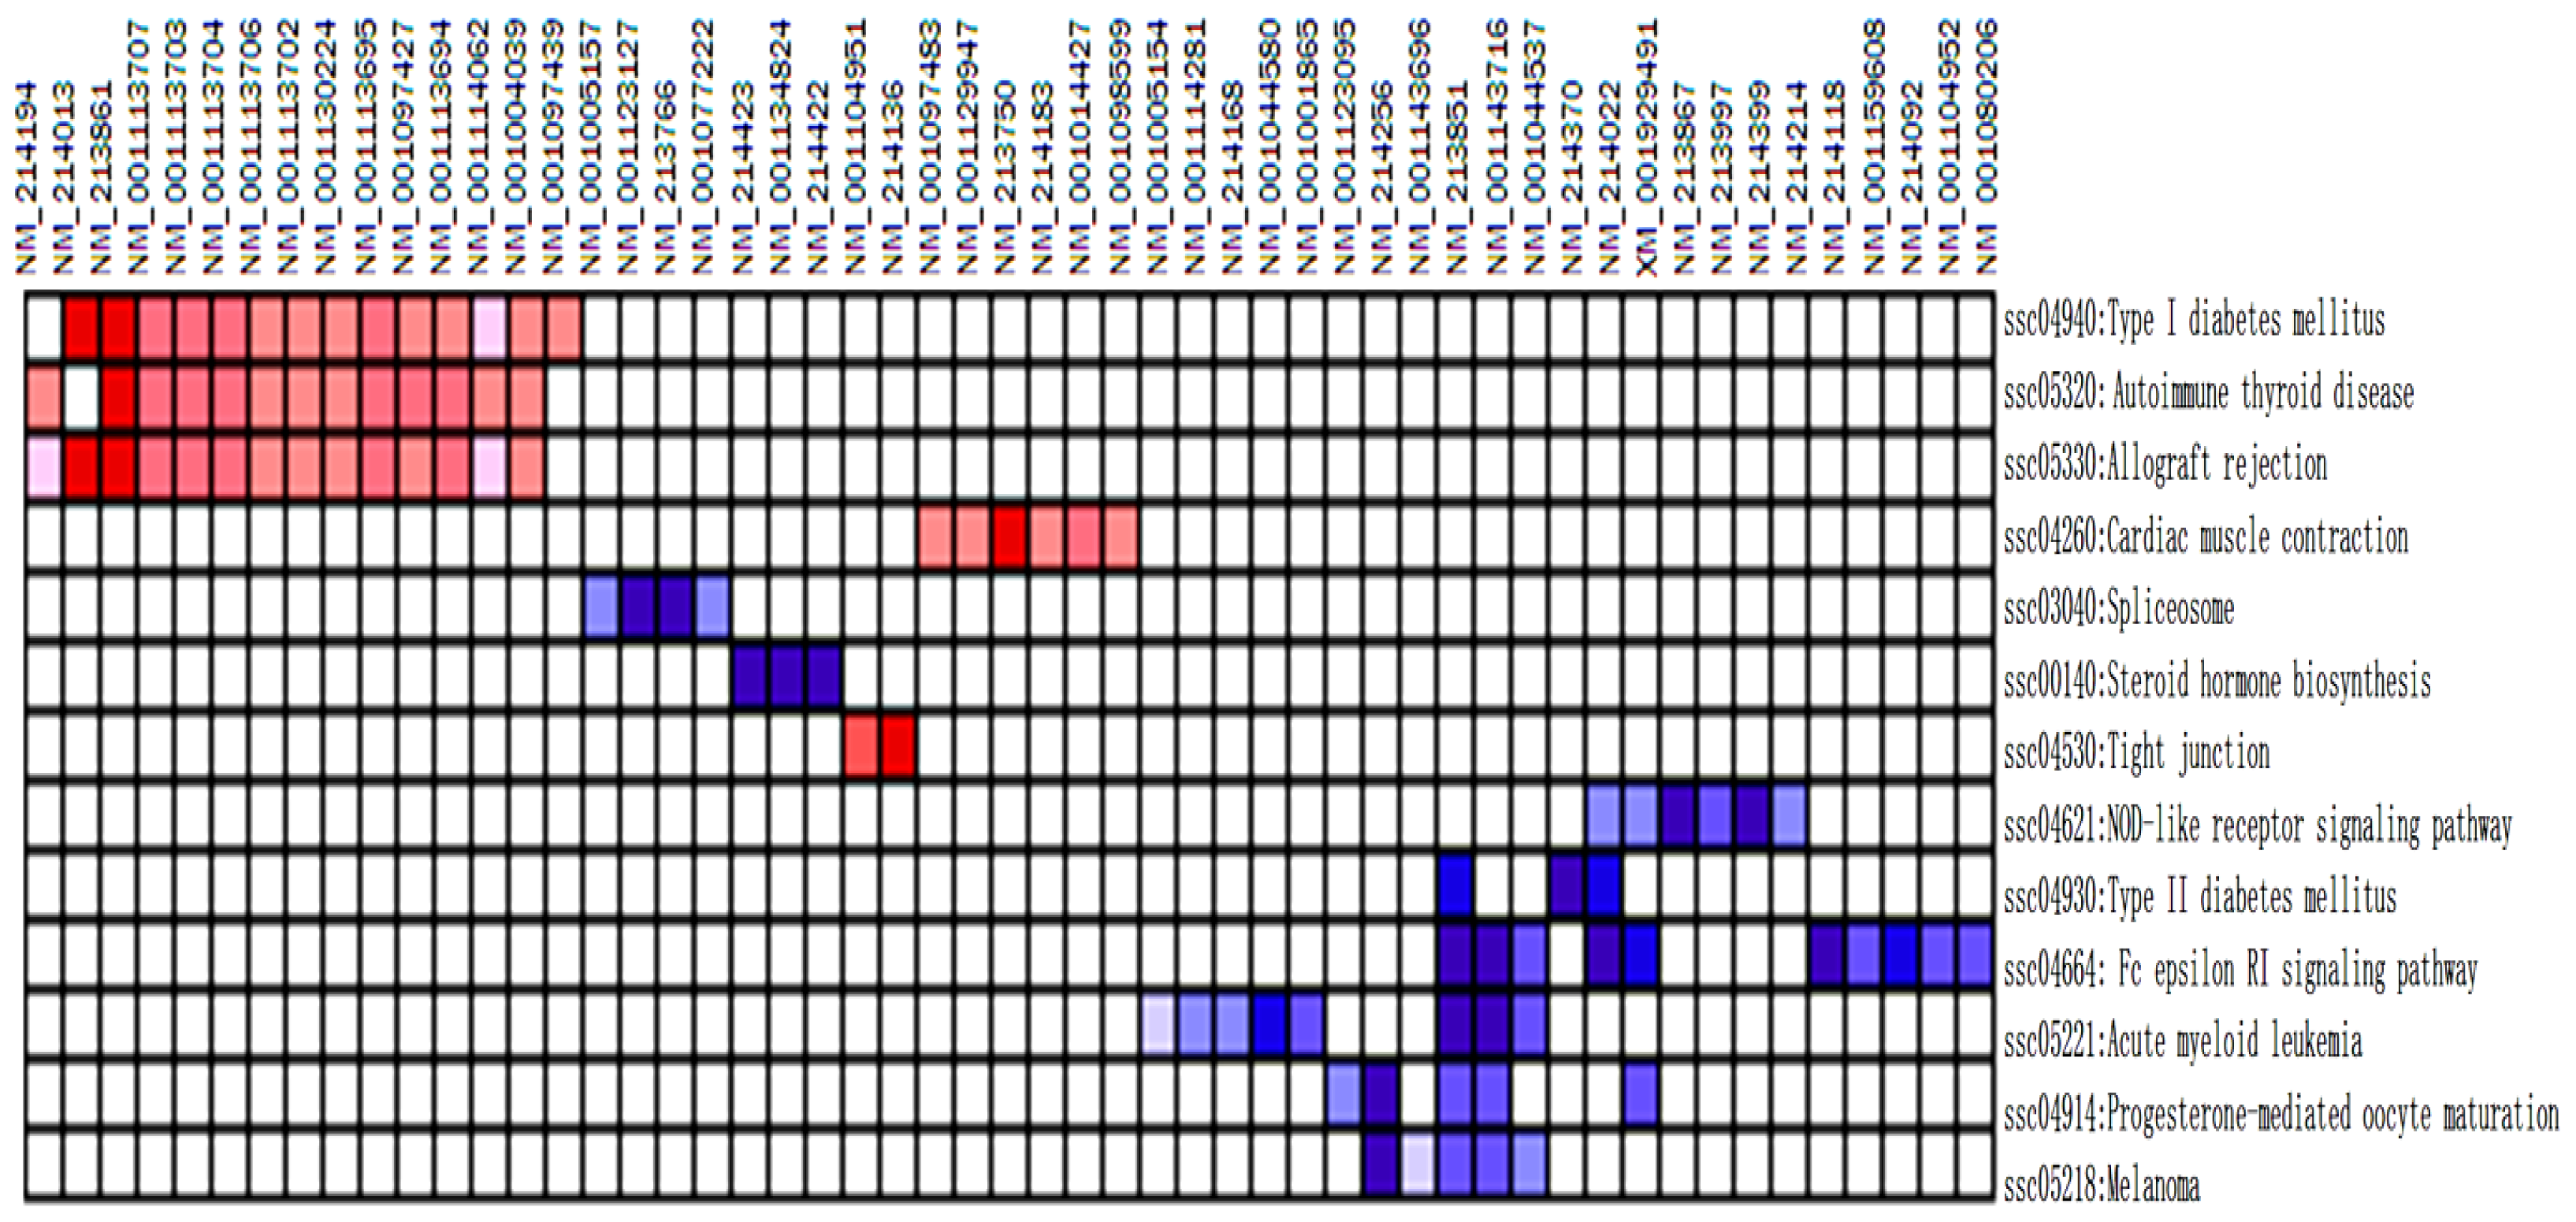
2.3. DE Genes Profiling
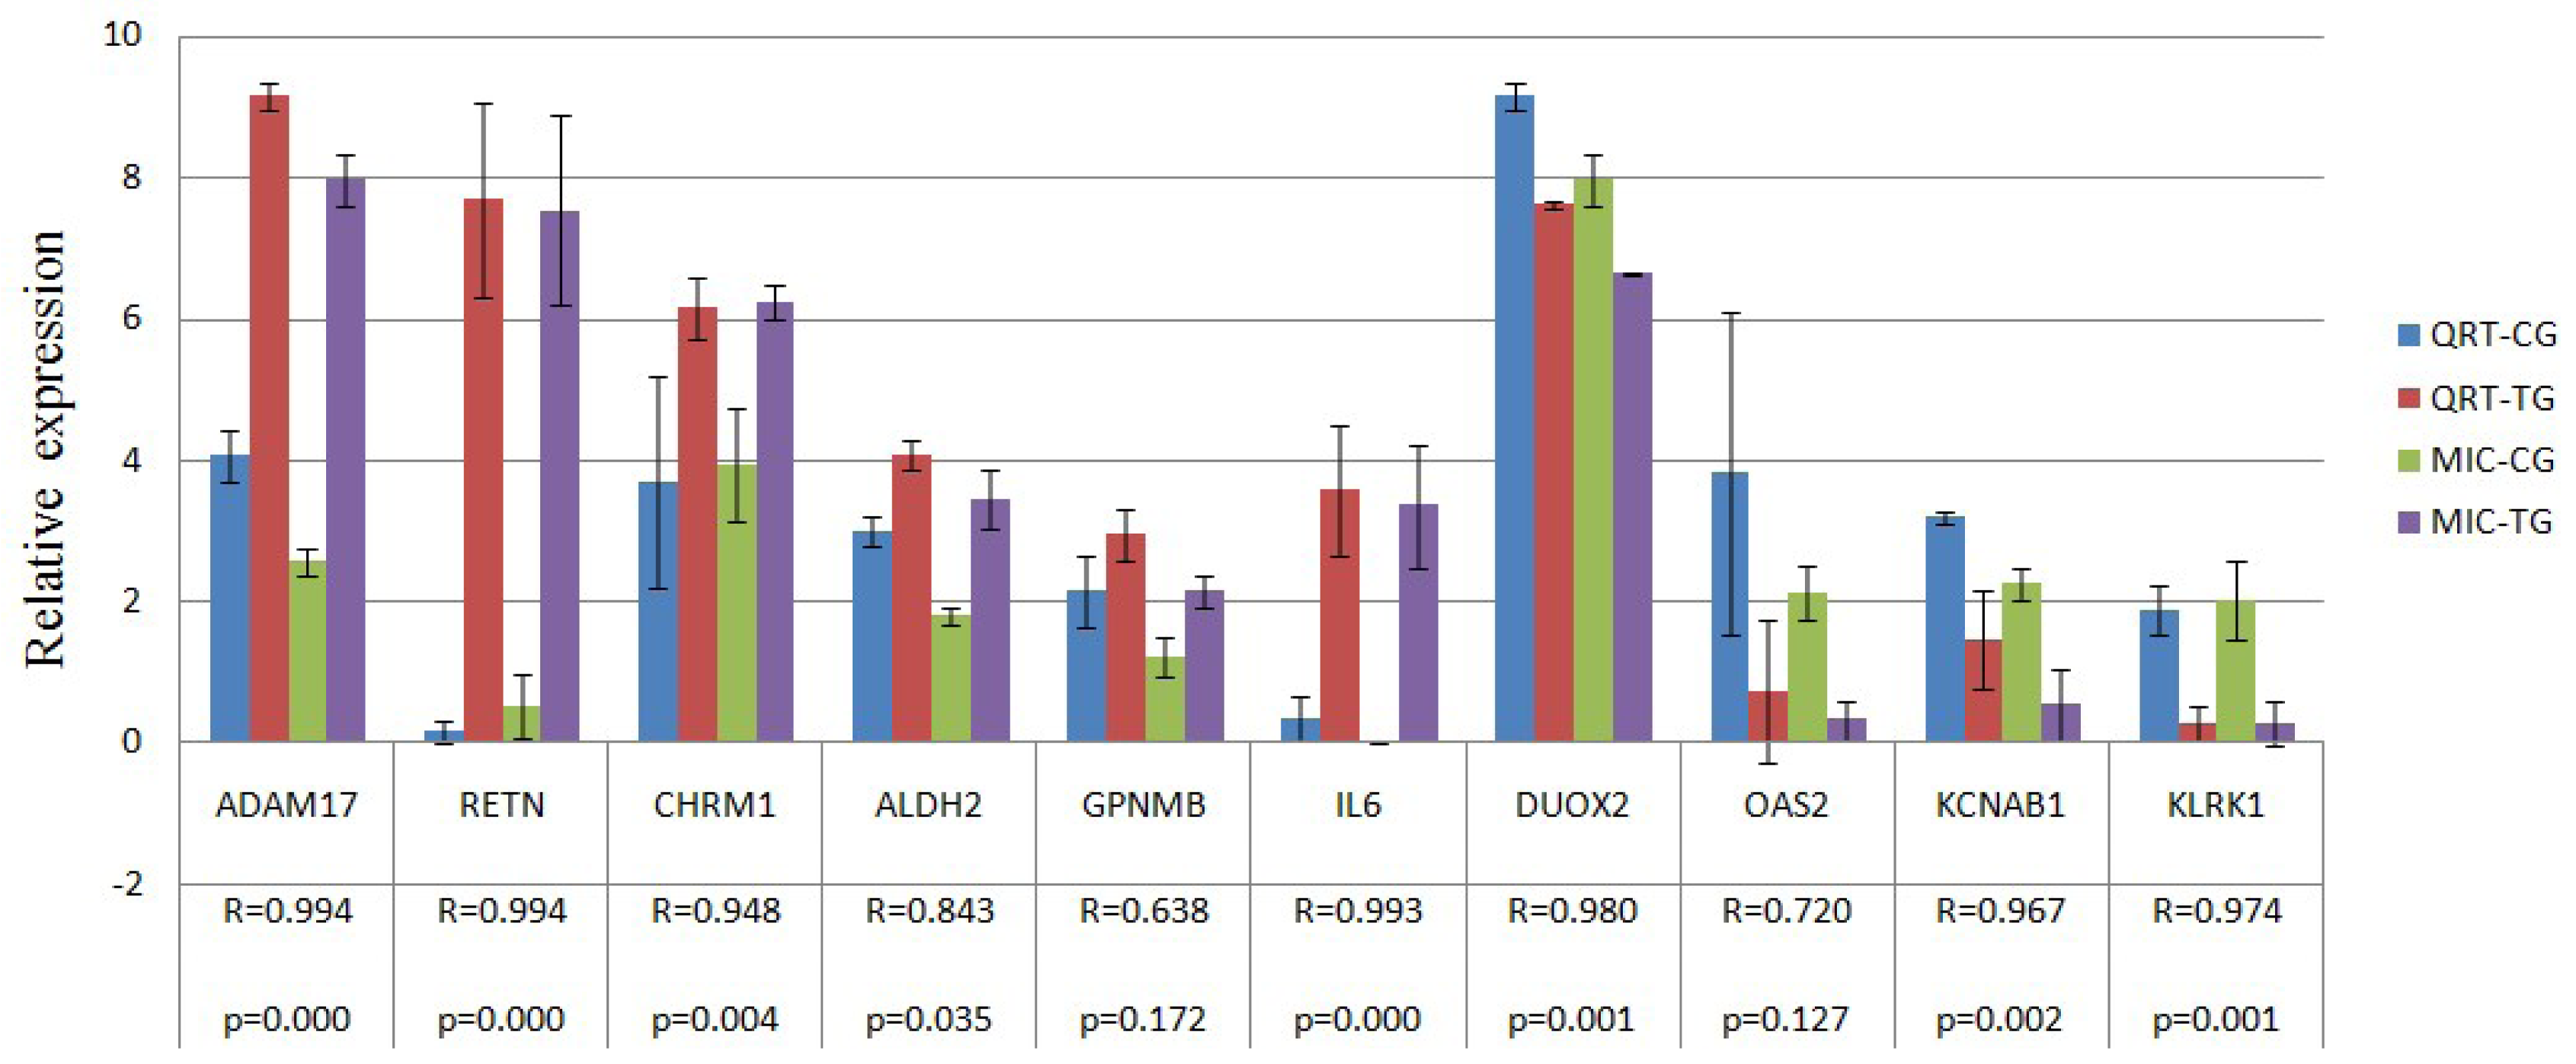
2.4. Verification of Gene Expression Pattern from Microarray Data Using Real-Time QRT-PCR
3. Discussion
4. Experimental Section
4.1. Animals, Bacterial Inoculation and Samples
4.2. Microarray Hybridizations and Data Analysis
4.3. Real-Time QRT-PCR
5. Conclusions
Acknowledgments
Conflict of Interest
References
- Taylor, D.J. Actinobacillus Pleuropneumoniae. In Diseases of Swine; Straw, B.E., d’Allaire, S., Mengeling, W.L., Taylor, D.J., Eds.; Iowa State University Press: Ames, IA, USA, 1999; Volume 26, pp. 343–354. [Google Scholar]
- Baarsch, M.J.; Foss, D.L.; Murtaugh, M.P. Pathophysiologic correlates of acute porcine pleuropneumonia. Am. J. Vet. Res 2000, 61, 684–690. [Google Scholar]
- Cho, W.S.; Chae, C. Expression of nitric oxide synthase 2 and tumor necrosis factor alpha in swine naturally infected with Actinobacillus. pleuropneumoniae. Vet. Pathol 2002, 39, 27–32. [Google Scholar]
- Cho, W.S.; Jung, K.; Kim, J.; Ha, Y.; Chae, C. Expression of mRNA encoding interleukin (IL)-10, IL-12p35 and IL-12p40 in lungs from swines experimentally infected with Actinobacillus pleuropneumoniae. Vet. Res. Commun 2005, 29, 111–122. [Google Scholar]
- Moser, R.J.; Reverter, A.; Kerr, C.A.; Beh, K.J.; Lehnert, S.A. A mixedmodel approach for the analysis of cDNA microarray gene expression data from extreme-performing swines after infection with Actinobacillus pleuropneumoniae. J. Anim. Sci 2004, 82, 1261–1271. [Google Scholar]
- Hedegaard, J.; Skovgaard, K.; Mortensen, S.; Sorensen, P.; Jensen, T.; Hornshoj, H.; Bendixen, C.; Heegaard, P.M.H. Molecular characterisation of the early response in pigs to experimental infection with Actinobacillus pleuropneumoniae using cDNA microarrays. Acta Vet. Scand 2007, 49, 11. [Google Scholar]
- Mortensen, S.; Skovgaard, K.; Hedegaard, J.; Bendixen, C.; Heegaard, P.M. Transcriptional profiling at different sites in lungs of pigs during acute bacterial respiratory infection. Innate Immun 2011, 17, 41–53. [Google Scholar]
- Shaw, M.H.; Reimer, T.; Kim, Y.G.; Nunez, G. NOD-like receptors (NLRs): Bona fide intracellular microbial sensors. Curr. Opin. Immunol 2008, 20, 377–382. [Google Scholar]
- Kanneganti, T.D.; Lamkanfi, M.; Nunez, G. Intracellular NOD-like receptors in host defense and disease. Immunity 2007, 27, 549–559. [Google Scholar]
- Aoki-Kinoshita, K.F.; Kanehisa, M. Gene annotation and pathway mapping in KEGG. Methods Mol. Biol 2007, 396, 71–91. [Google Scholar]
- Tattoli, I.; Travassos, L.H.; Carneiro, L.A.; Magalhaes, J.G.; Girardin, S.E. The Nodosome: Nod1 and Nod2 control bacterial infections and inflammation. Semin. Immunopathol 2007, 29, 289–301. [Google Scholar]
- Kawakami, T.; Galli, S.J. Regulation of mast-cell and basophil function and survival by IgE. Nat. Rev. Immunol 2002, 2, 773–786. [Google Scholar]
- Siraganian, R.P. Mast cell signal transduction from the high-affinity IgE receptor. Curr. Opin. Immunol 2003, 15, 639–646. [Google Scholar]
- Turner, H.; Kinet, J.P. Signalling through the high-affinity IgE receptor Fc epsilonRI. Nature 1999, 402, B24–B30. [Google Scholar]
- Gilfillan, A.M.; Tkaczyk, C. Integrated signalling pathways for mast-cell activation. Nat. Rev. Immunol 2006, 6, 218–230. [Google Scholar]
- Nadler, M.J.; Matthews, S.A.; Turner, H.; Kinet, J.P. Signal transduction by the high-affinity immunoglobulin E receptor Fc epsilon RI: Coupling form to function. Adv. Immunol 2000, 76, 325–355. [Google Scholar]
- Steffen, B.; Muller-Tidow, C.; Schwable, J.; Berdel, W.E.; Serve, H. The molecular pathogenesis of acute myeloid leukemia. Crit. Rev. Oncol. Hematol 2005, 56, 195–221. [Google Scholar]
- Tenen, D.G. Disruption of differentiation in human cancer: AML shows the way. Nat. Rev. Cancer 2003, 3, 89–101. [Google Scholar]
- Martelli, A.M.; Nyakern, M.; Tabellini, G.; Bortul, R.; Tazzari, P.L.; Evangelisti, C.; Cocco, L. Phosphoinositide 3-kinase/Akt signaling pathway and its therapeutical implications for human acute myeloid leukemia. Leukemia 2006, 20, 911–928. [Google Scholar]
- Lennartsson, J.; Jelacic, T.; Linnekin, D.; Shivakrupa, R. Normal and oncogenic forms of the receptor tyrosine kinase kit. Stem Cells 2005, 23, 16–43. [Google Scholar]
- Lorsbach, R.B.; Downing, J.R. The role of the AML1 transcription factor in leukemogenesis. Int. J. Hematol 2001, 74, 258–265. [Google Scholar]
- Mizuki, M.; Schwäble, J.; Steur, C.; Choudhary, C.; Agrawal, S.; Sargin, B.; Steffen, B.; Matsumura, I.; Kanakura, Y.; Böhmer, F.D. Suppression of myeloid transcription factors and induction of STAT response genes by AML-specific Flt3 mutations. Blood 2003, 101, 3164–73. [Google Scholar]
- Nebreda, A.R.; Ferby, I. Regulation of the meiotic cell cycle in oocytes. Curr. Opin. Cell. Biol 2000, 12, 666–675. [Google Scholar]
- Andersen, C.B.; Sakaue, H.; Nedachi, T.; Kovacina, K.S.; Clayberger, C.; Conti, M.; Roth, R.A. Protein kinase B/Akt is essential for the insulin- but not progesterone-stimulated resumption of meiosis in Xenopus oocytes. Biochem. J 2003, 369, 227–238. [Google Scholar]
- Abrieu, A.; Doree, M.; Fisher, D. The interplay between cyclin-B-Cdc2 kinase (MPF) and MAP kinase during maturation of oocytes. J. Cell. Sci 2001, 114, 257–267. [Google Scholar]
- Ghayee, H.K.; Auchus, R.J. Basic concepts and recent developments in human steroid hormone biosynthesis. Rev. Endocr. Metab. Disord 2007, 8, 289–300. [Google Scholar]
- Holmes, M.C.; Seckl, J.R. The role of 11beta-hydroxysteroid dehydrogenases in the brain. Mol. Cell. Endocrinol 2006, 248, 9–14. [Google Scholar]
- Thomas, J.L.; Duax, W.L.; Addlagatta, A.; Brandt, S.; Fuller, R.R.; Norris, W. Structure/function relationships responsible for coenzyme specificity and the isomerase activity of human type 13 beta-hydroxysteroid dehydrogenase/isomerase. J. Biol. Chem 2003, 278, 35483–35490. [Google Scholar]
- Tomlinson, J.W.; Stewart, P.M. Cortisol metabolism and the role of 11beta-hydroxysteroid dehydrogenase. Best Pract. Res. Clin. Endocrinol. Metab 2001, 15, 61–78. [Google Scholar]
- Gual, P.; le Marchand-Brustel, Y.; Tanti, J.F. Positive and negative regulation of insulin signaling through IRS-1 phosphorylation. Biochimie 2005, 87, 99–109. [Google Scholar]
- Kaneto, H.; Matsuoka, T.-a.; Nakatani, Y.; Kawamori, D.; Miyatsuka, T.; Matsuhisa, M.; Yamasaki, Y. Oxidative stress, ER stress, and the JNK pathway in type 2 diabetes. J. Mol. Med 2005, 83, 429–439. [Google Scholar]
- Sakai, K.; Matsumoto, K.; Nishikawa, T.; Suefuji, M.; Nakamaru, K.; Hirashima, Y.; Kawashima, J.; Shirotani, T.; Ichinose, K.; Brownlee, M. Mitochondrial reactive oxygen species reduce insulin secretion by pancreatic beta-cells. Biochem. Biophys. Res. Commun 2003, 300, 216–222. [Google Scholar]
- Robertson, R.P. Chronic oxidative stress as a central mechanism for glucose toxicity in pancreatic islet beta cells in diabetes. J. Biol. Chem 2004, 279, 42351–42354. [Google Scholar]
- Wahl, M.C.; Will, C.L.; Luhrmann, R. The spliceosome: Design principles of a dynamic RNP machine. Cell 2009, 136, 701–718. [Google Scholar]
- Chen, Y.-I.G.; Moore, R.E.; Helen, Y.G.; Young, M.K.; Lee, T.D.; Stevens, S.W. Proteomic analysis of in vivo-assembled pre-mRNA splicing complexes expands the catalog of participating factors. Nucleic Acids Res 2007, 35, 3928–3944. [Google Scholar]
- Ritchie, D.B.; Schellenberg, M.J.; Macmillan, A.M. Spliceosome structure: Piece by piece. Biochim. Biophys. Acta 2009, 1789, 624–633. [Google Scholar]
- Levy, C.; Khaled, M.; Fisher, D.E. MITF: Master regulator of melanocyte development and melanoma oncogene. Trends Mol. Med 2006, 12, 406–414. [Google Scholar]
- Tsao, H.; Goel, V.; Wu, H.; Yang, G.; Haluska, F.G. Genetic interaction between NRAS and BRAF mutations and PTEN/MMAC1 inactivation in melanoma. J. Invest. Dermatol 2004, 122, 337–341. [Google Scholar]
- Gruss, C.; Herlyn, M. Role of cadherins and matrixins in melanoma. Curr. Opin. Oncol 2001, 13, 117–123. [Google Scholar]
- Lázár-Molnár, E.; Hegyesi, H.; Tóth, S.; Falus, A. Autocrine and paracrine regulation by cytokines and growth factors in melanoma. Cytokine 2000, 12, 547–554. [Google Scholar]
- Tanoue, T.; Nishida, E. Docking interactions in the mitogen-activated protein kinase cascades. Pharmacol. Ther 2002, 93, 193–202. [Google Scholar]
- Yang, S.H.; Sharrocks, A.D.; Whitmarsh, A.J. Transcriptional regulation by the MAP kinase signaling cascades. Gene 2003, 320, 3–21. [Google Scholar]
- Zhu, X.; Lee, H.G.; Raina, A.K.; Perry, G.; Smith, M.A. The role of mitogen-activated protein kinase pathways in Alzheimer’s disease. Neurosignals 2002, 11, 270–281. [Google Scholar]
- Smith, M.L.; Chen, I.T.; Zhan, Q.; Bae, I.; Chen, C.Y.; Gilmer, T.M.; Kastan, M.B.; O’Connor, P.M.; Fornace, A.J., Jr. Interaction of the p53-regulated protein Gadd45 with proliferating cell nuclear antigen. Science 1994, 266, 1376–1380. [Google Scholar]
- Diehl, J.A.; Cheng, M.; Roussel, M.F.; Sherr, C.J. Glycogen synthase kinase-3beta regulates cyclin D1 proteolysis and subcellular localization. Genes Dev 1998, 12, 3499–3511. [Google Scholar]
- Klein, E.A.; Assoian, R.K. Transcriptional regulation of the cyclin D1 gene at a glance. J. Cell. Sci 2008, 121, 3853–3857. [Google Scholar]
- Sprick, M.R.; Walczak, H. The interplay between the Bcl-2 family and death receptor-mediated apoptosis. Biochim. Biophys. Acta 2004, 1644, 125–132. [Google Scholar]
- Steelman, L.S.; Pohnert, S.C.; Shelton, J.G.; Franklin, R.A.; Bertrand, F.E.; McCubrey, J.A. JAK/STAT, Raf/MEK/ERK, PI3K/Akt and BCR-ABL in cell cycle progression and leukemogenesis. Leukemia 2004, 18, 189–218. [Google Scholar]
- Martinon, F.; Holler, N.; Richard, C.; Tschopp, J. Activation of a pro-apoptotic amplification loop through inhibition of NF-κB-dependent survival signals by caspase-mediated inactivation of RIP. FEBS Lett 2000, 468, 134–136. [Google Scholar]
- Wolff, B.; Burns, A.R.; Middleton, J.; Rot, A. Endothelial cell “memory” of inflammatory stimulation: Human venular endothelial cells store interleukin 8 in Weibel-Palade bodies. J. Exp. Med 1998, 188, 1757–1762. [Google Scholar]
- Utgaard, J.O.; Jahnsen, F.L.; Bakka, A.; Brandtzaeg, P.; Haraldsen, G. Rapid secretion of prestored interleukin 8 from Weibel-Palade bodies of microvascular endothelial cells. J. Exp. Med 1998, 188, 1751–1756. [Google Scholar]
- Baarsch, M.J.; Scamurra, R.W.; Burger, K.; Foss, D.L.; Maheswaran, S.K.; Murtaugh, M.P. Inflammatory cytokine expression in swine experimentally infected with Actinobacillus pleuropneumoniae. Infect. Immun 1995, 63, 3587–3594. [Google Scholar]
- Myers, M.J.; Baarsch, M.J.; Murtaugh, M.P. Effects of pentoxifylline on inflammatory cytokine expression and acute pleuropneumonia in swine. Immunobiology 2002, 205, 17–34. [Google Scholar]
- Nakanishi, K.; Yoshimoto, T.; Tsutsui, H.; Okamura, H. Interleukin-18 regulates both Th1 and Th2 responses. Annu. Rev. Immunol 2001, 19, 423–474. [Google Scholar]
- Carr, M.W.; Roth, S.J.; Luther, E.; Rose, S.S.; Springer, T.A. Monocyte chemoattractant protein 1 acts as a T-lymphocyte chemoattractant. Proc. Natl. Acad. Sci. USA 1994, 91, 3652–3656. [Google Scholar]
- Xu, L.L.; Warren, M.K.; Rose, W.L.; Gong, W.; Wang, J.M. Human recombinant monocyte chemotactic protein and other C–C chemokines bind and induce directional migration of dendritic cells in vitro. J. Leukoc. Biol 1996, 60, 365–371. [Google Scholar]
- Toews, G.B. Cytokines and the lung. Eur. Respir. J 2001, 34, S3–S17. [Google Scholar]
- Krönke, M.; Schütze, S.; Scheurich, P.; Pfizenmaier, K. TNF signal transduction and TNF-responsive genes. Immunol. Ser 1992, 56, 189–216. [Google Scholar]
- Schütze, S.; Potthoff, K.; Machleidt, T.; Berkovic, D.; Wiegmann, K.; Kronke, M. TNF activates NF-kappa B by phosphatidylcholine-specific phospholipase C-induced “acidic” sphingomyelin breakdown. Cell 1992, 71, 765–776. [Google Scholar]
- Brock, C.; Schaefer, M.; Reusch, H.P.; Czupalla, C.; Michalke, M.; Spicher, K.; Schultz, G.; Nürnberg, B. Roles of G beta gamma in membrane recruitment and activation of p110 gamma/p101 phosphoinositide 3-kinase gamma. J. Cell. Biol 2003, 160, 89–99. [Google Scholar]
- Voigt, P.; Brock, C.; Nürnberg, B.; Schaefer, M. Assigning functional domains within the p101 regulatory subunit of phosphoinositide 3-kinase γ. J. Biol. Chem 2005, 280, 5121–5127. [Google Scholar]
- Wymann, M.P.; Zvelebil, M.; Laffargue, M. Phosphoinositide 3-kinase signalling—Which way to target? Trends Pharmacol. Sci 2003, 24, 366–376. [Google Scholar]
- Crackower, M.A.; Oudit, G.Y.; Kozieradzki, I.; Sarao, R.; Sun, H.; Sasaki, T.; Hirsch, E.; Suzuki, A.; Shioi, T.; Irie-Sasaki, J.; et al. Regulation of myocardial contractibility and cell size by distinct PI3K-PTEN signaling pathways. Cell 2002, 110, 737–749. [Google Scholar]
- Peelman, L.J.; Chardon, P.; Nunes, M.; Renard, C.; Geffrotin, C.; Vaiman, M.; Zeveren, A.V.; Coppieters, W.; Weghe, A.V.; Bouquet, Y.; et al. The BAT1 gene in the MHC encodes an evolutionarily conserved putative nuclear RNA helicase of the DEAD family. Genomics 1995, 26, 210–218. [Google Scholar]
- Spies, T.; Blanck, G.; Bresnahan, M.; Sands, J.; Strominger, J.L. A new cluster of genes within the human major histocompatibility complex. Science 1989, 243, 214–217. [Google Scholar]
- Von Bubnoff, D.; Novak, N.; Kraft, S.; Bieber, T. The central role of FcɛRI in allergy. Clin. Exp. Dermatol 2003, 28, 184–187. [Google Scholar]
- Gounni, A.; Lamkhioued, B.; Ochiai, K.; Tanaka, Y.; Delaporte, E.; Capron, A.; Kinet, J.P.; Capron, M. High-affinity IgE receptor on eosinophils is involved in defence against parasites. Nature 1994, 367, 183–186. [Google Scholar]
- Gesslein, B.; Hakansson, G.; Carpio, R.; Gustafsson, L.; Perez, M.T.; Malmsjo, M. Mitogen-activated protein kinases in the porcine retinal arteries and neuroretina following retinal ischemia-reperfusion. Mol. Vis 2010, 16, 392–407. [Google Scholar]
- Kubota, Y.; O’Grady, P.; Saito, H.; Takekawa, M. Oncogenic Ras abrogates MEK SUMO ylation that suppresses the ERK pathway and cell transformation. Nat. Cell. Biol 2011, 13, 282–291. [Google Scholar]
- Reuther, G.W.; Der, C.J. The Ras branch of small GTPases: Ras family members don’t fall far from the tree. Curr. Opin. Cell. Biol 2000, 12, 157–165. [Google Scholar]
- Malumbres, M.; Pellicer, A. RAS pathways to cell cycle control and cell transformation. Front. Biosci 1998, 3, 887–912. [Google Scholar]
- Yilmaz, A.; Davis, M.E.; Simmen, R.C. Reproductive performance of bulls divergently selected on the basis of blood serum insulin-like growth factor I concentration. J. Anim. Sci 1999, 77, 835–839. [Google Scholar]
- Kisseleva, T.; Bhattacharya, S.; Braunstein, J.; Schindler, C.W. Signaling through the JAK/STAT pathway, recent advances and future challenges. Gene 2002, 285, 1–24. [Google Scholar]
- Mootha, V.K.; Lindgren, C.M.; Eriksson, K.-F.; Subramanian, A.; Sihag, S.; Lehar, J.; Puigserver, P.; Carlsson, E.; Ridderstråle, M.; Laurila, E. PGC-1alpha-responsive genes involved in oxidative phosphorylation are coordinately downregulated in human diabetes. Nat. Genet 2003, 34, 267–273. [Google Scholar]
- Cantrell, D.A.; Smith, K.A. The interleukin-2 T-cell system: A new cell growth model. Science 1984, 224, 1312–1316. [Google Scholar]
- Smith, K.A. Interleukin-2: Inception, impact, and implications. Science 1988, 240, 1169–1176. [Google Scholar]
- Steinman, R.M.; Inaba, K.; Turley, S.; Pierre, P.; Mellman, I. Antigen capture, processing, and presentation by dendritic cells: recent cell biological studies. Human immunol 1999, 60, 562–567. [Google Scholar]
- Entrez Gene: CD40 CD40 molecule, TNF receptor superfamily member 5. Available online: http://www.ncbi.nlm.nih.gov/gene/958 (Accessed on 14 May 2013).
- Tojo, T.; Aoki, T.; Kobayashi, N.; Ohishi, T.; Watanabe, T.; Yamamoto, T.; Inoue, J. TRAF5, a novel tumor necrosis factor receptor-associated factor family protein, mediates CD40 signaling. Proc. Natl. Acad. Sci. USA 1996, 93, 9437–9442. [Google Scholar]
- Cheng, G.; Schoenberger, S.P. CD40 signaling and autoimmunity. Curr. Dir. Autoimmun 2002, 5, 51–61. [Google Scholar]
- Dallman, C.; Johnson, P.W.; Packham, G. Differential regulation of cell survival by CD40. Apoptosis 2003, 8, 45–53. [Google Scholar]
- O’Sullivan, B.; Thomas, R. Recent advances on the role of CD40 and dendritic cells in immunity and tolerance. Curr. Opin. Hematol 2004, 10, 272–278. [Google Scholar]
- Oppmann, B.; Lesley, R.; Blom, B.; Timans, J.C.; Xu, Y.M.; Hunte, B.; Vega, F.; Yu, N.; Wang, J.; Singh, K.; et al. Novel p19 protein engages IL-12p40 to form a cytokine, IL-23, with biological activities similar as well as distinct from IL-12. Immunity 2000, 13, 715–725. [Google Scholar]
- Jover, R.; Bort, R.; Gomez-Lechon, M.J.; Castell, J.V. Down-regulation of human CYP3A4 by the inflammatory signal interleukin 6: Molecular mechanism and transcription factors involved. FASEB. J 2002, 16, 1799–1801. [Google Scholar]
- Kile, B.T.; Schulman, B.A.; Alexander, W.S.; Nicola, N.A.; Martin, H.M.E.; Hiton, D.J. The SOCS box: A tale of destruction and degradation. Trends Biochem. Sci 2002, 27, 235–241. [Google Scholar]
- Krebs, D.L.; Hilton, D.J. SOCS proteins: Negative regulators of cytokine signaling. Stem Cells 2001, 19, 378–387. [Google Scholar]
- Morrison, D.F.; Foss, D.L.; Murtaugh, M.P. Interleukin-10 gene therapy-mediated amelioration of bacterial pneumonia. Infect. Immun 2000, 68, 4752–4758. [Google Scholar]
- Palma, M.; DeLuca, D.; Worgall, S.; Quadri, L.E.N. Transcriptome analysis of the response of Pseudomonas aeruginosa to hydrogen peroxide. J. Bacteriol 2004, 186, 248–252. [Google Scholar]
- Series GSE42317. Available online: http://www.ncbi.nlm.nih.gov/geo/query/acc.cgi?acc=GSE42317 (Accessed on 15 November 2012).
- Hu, J.; He, X. Enhanced quantile normalization of microarray data to reduce loss of information in gene expression profiles. Biometrics 2007, 63, 50–59. [Google Scholar]
- Xia, X.; McClelland, M.; Wang, Y. WebArray: An online platform for microarray data analysis. BMC Bioinf 2005, 6, 306. [Google Scholar]
- Romualdi, C.; Vitulo, N.; Favero, M.D.; Lanfranchi, G. MIDAW: A web tool for statistical analysis of microarray data. Nucleic Acids Res 2005, 33, W644–W649. [Google Scholar]
- Troyanskaya, O.; Cantor, M.; Sherlock, G.; Brown, P.; Hastie, T.; Tibshiran, R.; Bostein, D.; Altman, R.B. Missing value estimation methods for DNA microarrays. Bioinformatics 2001, 17, 520–525. [Google Scholar]
- Saeed, A.; Sharov, V.; White, J.; Li, J.; Liang, W.; Bhagabati, N.; Braisted, J.; Klapa, M.; Currier, T.; Thiagarajan, M. TM4: A free, open-source system for microarray data management and analysis. Biotechniques 2003, 34, 374–378. [Google Scholar]
- Bild, A.; Febbo, P.G. Application of a priori established gene sets to discover biologically important differential expression in microarray data. Proc. Natl. Acad. Sci. USA 2005, 102, 15278–15279. [Google Scholar]
- Dennis, G.; Sherman, B.T.; Hosack, D.A.; Yang, J.; Gao, W.; Lane, H.C.; Lempicki, R.A. DAVID: Database for annotation, visualization, and integrated discovery. Genome Biol 2003, 4, 1–11. [Google Scholar]
- Lee, H.K.; Braynen, W.; Keshav, K.; Pavlidis, P. ErmineJ: Tool for functional analysis of gene expression data sets. BMC Bioinf 2005, 6, 269. [Google Scholar]
- Subramanian, A.; Tamayo, P.; Mootha, V.K.; Mukherjee, S.; Ebert, B.L.; Gilette, M.A.; Paulovich, A.; Pomeroy, S.L.; Golub, T.R.; Lander, E.S. Gene set enrichment analysis: A knowledge-based approach for interpreting genome-wide expression profiles. Proc. Natl. Acad. Sci. USA 2005, 102, 15545–15550. [Google Scholar]
- Dopazo, J. Functional interpretation of microarray experiments. OMICS 2006, 10, 398–410. [Google Scholar]
- Davis, S.; Meltzer, P.S. GEOquery: A bridge between the Gene Expression Omnibus (GEO) and BioConductor. Bioinformatics 2007, 23, 1846–1847. [Google Scholar]
- Barrett, T.; Suzek, T.O.; Troup, D.B.; Wilhite, S.E.; Ngau, W.-C.; Ledoux, P.; Rudnev, D.; Lash, A.E.; Fujibuchi, W.; Edgar, R. NCBI GEO: Mining millionsof expression profiles-database and tools. Nucleic Acids Res 2005, 33, 562–566. [Google Scholar]
- Edgar, R.; Domrachev, M.; Lash, A.E. Gene expression omnibus: NCBI gene expression and hybridization array data repository. Nucleic Acids Res 2002, 30, 207–210. [Google Scholar]
- Livak, K.J.; Schmittgen, T.D. Analysis of relative gene expression data using real-time quantitative PCR and the 2(-Delta Delta C(T)) method. Methods 2001, 25, 402–408. [Google Scholar]


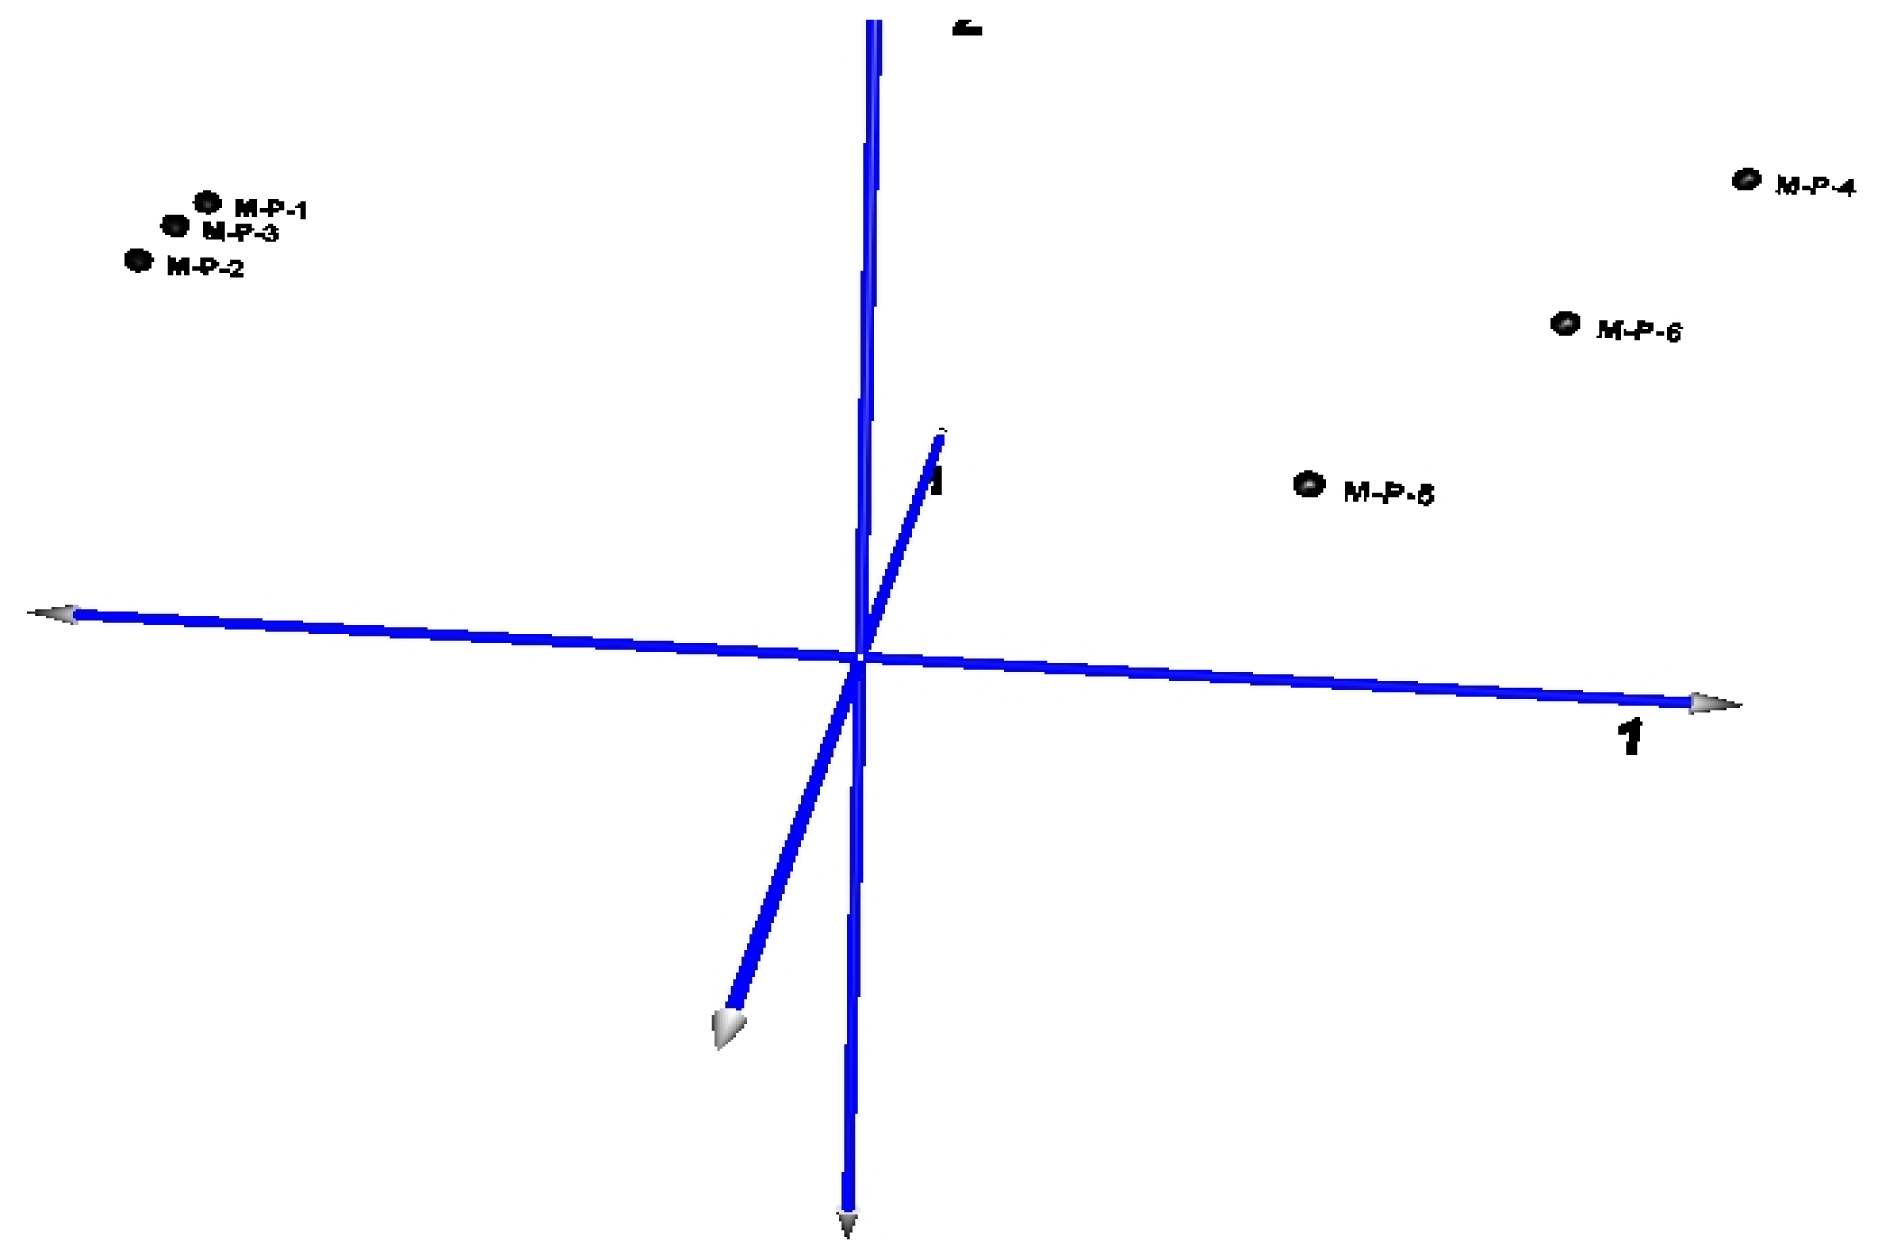
| Principal component | Eigenvalues | Contribution ratio |
|---|---|---|
| 1 | 50.17 | 96.95% |
| 2 | 1.339 | 2.59% |
| 3 | 0.111 | 0.21% |
| 4 | 0.088 | 0.17% |
| 5 | 0.027 | 0.05% |
| 6 | 0.013 | 0.02% |
| Name | Description | Probe | Genes |
|---|---|---|---|
| [GO:0050896] | response to stimulus | 96 | 96 |
| [GO:0051179] | Localization | 92 | 92 |
| [GO:0006810] | Transport | 88 | 88 |
| [GO:0006807] | nitrogen compound metabolic process | 84 | 84 |
| [GO:0019222] | regulation of metabolic process | 67 | 67 |
| [GO:0002376] | immune system process | 56 | 56 |
| [GO:0055114] | oxidation reduction | 53 | 53 |
| [GO:0006955] | immune response | 53 | 53 |
| [GO:0032501] | multicellular organismal process | 52 | 52 |
| [GO:0006950] | response to stress | 51 | 51 |
| [GO:0009056] | catabolic process | 50 | 50 |
| [GO:0032502] | developmental process | 38 | 38 |
| [GO:0065008] | regulation of biological quality | 35 | 35 |
| [GO:0007275] | multicellular organismal development | 35 | 35 |
| [GO:0022610] | biological adhesion | 29 | 29 |
| [GO:0048518] | positive regulation of biological process | 28 | 28 |
| [GO:0016043] | cellular component organization | 27 | 27 |
| [GO:0009605] | response to external stimulus | 25 | 25 |
| [GO:0048856] | anatomical structure development | 22 | 22 |
| [GO:0008219] | cell death | 22 | 22 |
| [GO:0048519] | negative regulation of biological process | 21 | 21 |
| [GO:0033036] | macromolecule localization | 21 | 21 |
| [GO:0048523] | negative regulation of cellular process | 19 | 19 |
| [GO:0048522] | positive regulation of cellular process | 19 | 19 |
| [GO:0044281] | small molecule metabolic process | 18 | 18 |
| [GO:0048869] | cellular developmental process | 17 | 17 |
| [GO:0042221] | response to chemical stimulus | 17 | 17 |
| [GO:0006066] | alcohol metabolic process | 17 | 17 |
| [GO:0006996] | organelle organization | 16 | 16 |
| [GO:0051641] | cellular localization | 15 | 15 |
| [GO:0019882] | antigen processing and presentation | 15 | 15 |
| [GO:0008104] | protein localization | 15 | 15 |
| [GO:0048583] | regulation of response to stimulus | 13 | 13 |
| [GO:0042592] | homeostatic process | 12 | 12 |
| [GO:0032879] | regulation of localization | 12 | 12 |
| [GO:0007049] | cell cycle | 12 | 12 |
| [GO:0048584] | positive regulation of response to stimulus | 11 | 11 |
| [GO:0009893] | positive regulation of metabolic process | 11 | 11 |
| [GO:0002682] | regulation of immune system process | 11 | 11 |
| [GO:0051716] | cellular response to stimulus | 10 | 10 |
| [GO:0019725] | cellular homeostasis | 10 | 10 |
| [GO:0016192] | vesicle-mediated transport | 10 | 10 |
| [GO:0009653] | anatomical structure morphogenesis | 10 | 10 |
| [GO:0002252] | immune effector process | 10 | 10 |
| [GO:0051239] | regulation of multicellular organismal process | 9 | 9 |
| [GO:0048731] | system development | 9 | 9 |
| [GO:0065009] | regulation of molecular function | 8 | 8 |
| [GO:0051704] | multi-organism process | 8 | 8 |
| [GO:0051128] | regulation of cellular component organization | 8 | 8 |
| [GO:0050778] | positive regulation of immune response | 8 | 8 |
| [GO:0044085] | cellular component biogenesis | 8 | 8 |
| [GO:0007610] | behavior | 8 | 8 |
| [GO:0003008] | system process | 8 | 8 |
| [GO:0051301] | cell division | 7 | 7 |
| [GO:0030029] | actin filament-based process | 7 | 7 |
| [GO:0022607] | cellular component assembly | 7 | 7 |
| [GO:0009607] | response to biotic stimulus | 7 | 7 |
| [GO:0000003] | reproduction | 7 | 7 |
| [GO:0055085] | transmembrane transport | 6 | 6 |
| [GO:0051707] | response to other organism | 6 | 6 |
| [GO:0051129] | negative regulation of cellular component organization | 6 | 6 |
| [GO:0050878] | regulation of body fluid levels | 6 | 6 |
| [GO:0050793] | regulation of developmental process | 6 | 6 |
| [GO:0023052] | signaling | 6 | 6 |
| [GO:0022414] | reproductive process | 6 | 6 |
| [GO:0016044] | cellular membrane organization | 6 | 6 |
| [GO:0048646] | anatomical structure formation involved in morphogenesis | 5 | 5 |
| [GO:0040011] | locomotion | 5 | 5 |
| [GO:0019953] | sexual reproduction | 5 | 5 |
| [GO:0019637] | organophosphate metabolic process | 5 | 5 |
| [GO:0010817] | regulation of hormone levels | 5 | 5 |
| [GO:0009892] | negative regulation of metabolic process | 5 | 5 |
| [GO:0060348] | bone development | 4 | 4 |
| [GO:0044087] | regulation of cellular component biogenesis | 4 | 4 |
| [GO:0043933] | macromolecular complex subunit organization | 4 | 4 |
| [GO:0042330] | taxis | 4 | 4 |
| [GO:0040008] | regulation of growth | 4 | 4 |
| [GO:0022402] | cell cycle process | 4 | 4 |
| [GO:0070271] | protein complex biogenesis | 3 | 3 |
| [GO:0048609] | reproductive process in a multicellular organism | 3 | 3 |
| [GO:0046903] | secretion | 3 | 3 |
| [GO:0040012] | regulation of locomotion | 3 | 3 |
| [GO:0034621] | cellular macromolecular complex subunit organization | 3 | 3 |
| [GO:0019748] | secondary metabolic process | 3 | 3 |
| [GO:0010605] | negative regulation of macromolecule metabolic process | 3 | 3 |
| [GO:0009719] | response to endogenous stimulus | 3 | 3 |
| [GO:0009628] | response to abiotic stimulus | 3 | 3 |
| [GO:0007017] | microtubule-based process | 3 | 3 |
| [GO:0002520] | immune system development | 3 | 3 |
| Name | Description | Probe | Genes |
|---|---|---|---|
| [GO:0005886] | plasma membrane | 98 | 98 |
| [GO:0005634] | nucleus | 86 | 86 |
| [GO:0032991] | macromolecular complex | 86 | 86 |
| [GO:0044422] | organelle part | 84 | 84 |
| [GO:0043234] | protein complex | 62 | 62 |
| [GO:0043228] | non-membrane-bounded organelle | 46 | 46 |
| [GO:0044421] | extracellular region part | 45 | 45 |
| [GO:0044459] | plasma membrane part | 44 | 44 |
| [GO:0031090] | organelle membrane | 41 | 41 |
| [GO:0005739] | mitochondrion | 37 | 37 |
| [GO:0005783] | endoplasmic reticulum | 35 | 35 |
| [GO:0005794] | Golgi apparatus | 33 | 33 |
| [GO:0005615] | extracellular space | 29 | 29 |
| [GO:0012505] | endomembrane system | 25 | 25 |
| [GO:0044429] | mitochondrial part | 23 | 23 |
| [GO:0016023] | cytoplasmic membrane-bounded vesicle | 23 | 23 |
| [GO:0005856] | cytoskeleton | 23 | 23 |
| [GO:0031974] | membrane-enclosed lumen | 22 | 22 |
| [GO:0031975] | envelope | 21 | 21 |
| [GO:0005840] | ribosome | 19 | 19 |
| [GO:0044428] | nuclear part | 18 | 18 |
| [GO:0005578] | proteinaceous extracellular matrix | 17 | 17 |
| [GO:0044430] | cytoskeletal part | 15 | 15 |
| [GO:0071212] | subsynaptic reticulum | 15 | 15 |
| [GO:0005740] | mitochondrial envelope | 15 | 15 |
| [GO:0005829] | cytosol | 14 | 14 |
| [GO:0031966] | mitochondrial membrane | 14 | 14 |
| [GO:0019898] | extrinsic to membrane | 14 | 14 |
| [GO:0042611] | MHC protein complex | 13 | 13 |
| [GO:0048770] | pigment granule | 12 | 12 |
| [GO:0044431] | Golgi apparatus part | 12 | 12 |
| [GO:0005773] | vacuole | 11 | 11 |
| [GO:0005764] | lysosome | 10 | 10 |
| [GO:0044432] | endoplasmic reticulum part | 10 | 10 |
| [GO:0005792] | microsome | 9 | 9 |
| [GO:0009898] | internal side of plasma membrane | 9 | 9 |
| [GO:0005743] | mitochondrial inner membrane | 9 | 9 |
| [GO:0005887] | integral to plasma membrane | 8 | 8 |
| [GO:0005789] | endoplasmic reticulum membrane | 8 | 8 |
| [GO:0005768] | endosome | 8 | 8 |
| [GO:0005759] | mitochondrial matrix | 8 | 8 |
| [GO:0005654] | nucleoplasm | 8 | 8 |
| [GO:0015630] | microtubule cytoskeleton | 8 | 8 |
| [GO:0030054] | cell junction | 7 | 7 |
| [GO:0031300] | intrinsic to organelle membrane | 7 | 7 |
| [GO:0042613] | MHC class II protein complex | 7 | 7 |
| [GO:0044451] | nucleoplasm part | 7 | 7 |
| [GO:0031301] | integral to organelle membrane | 6 | 6 |
| [GO:0005635] | nuclear envelope | 6 | 6 |
| [GO:0042612] | MHC class I protein complex | 6 | 6 |
| [GO:0015629] | actin cytoskeleton | 6 | 6 |
| [GO:0016469] | proton-transporting two-sector ATPase complex | 6 | 6 |
| [GO:0031225] | anchored to membrane | 5 | 5 |
| [GO:0031968] | organelle outer membrane | 5 | 5 |
| [GO:0031965] | nuclear membrane | 5 | 5 |
| [GO:0043235] | receptor complex | 5 | 5 |
| [GO:0033279] | ribosomal subunit | 5 | 5 |
| [GO:0005819] | spindle | 4 | 4 |
| [GO:0030173] | integral to Golgi membrane | 4 | 4 |
| [GO:0048471] | perinuclear region of cytoplasm | 4 | 4 |
| [GO:0005911] | cell-cell junction | 4 | 4 |
| [GO:0043292] | contractile fiber | 4 | 4 |
| [GO:0000502] | proteasome complex | 4 | 4 |
| [GO:0030135] | coated vesicle | 4 | 4 |
| [GO:0016459] | myosin complex | 4 | 4 |
| [GO:0005874] | microtubule | 4 | 4 |
| [GO:0042995] | cell projection | 3 | 3 |
| [GO:0045259] | proton-transporting ATP synthase complex | 3 | 3 |
| [GO:0044420] | extracellular matrix part | 3 | 3 |
| [GO:0015935] | small ribosomal subunit | 3 | 3 |
| [GO:0005777] | peroxisome | 3 | 3 |
| [GO:0034702] | ion channel complex | 3 | 3 |
| [GO:0005901] | caveola | 3 | 3 |
| [GO:0045202] | synapse | 3 | 3 |
| [GO:0031227] | intrinsic to endoplasmic reticulum membrane | 3 | 3 |
| [GO:0016323] | basolateral plasma membrane | 3 | 3 |
| [GO:0005681] | spliceosomal complex | 3 | 3 |
| [GO:0030141] | secretory granule | 3 | 3 |
| [GO:0005667] | transcription factor complex | 3 | 3 |
| [GO:0033176] | proton-transporting V-type ATPase complex | 3 | 3 |
| [GO:0033177] | proton-transporting two-sector ATPase complex, proton-transporting domain | 3 | 3 |
| [GO:0005730] | nucleolus | 3 | 3 |
| Name | Description | Probe | Genes |
|---|---|---|---|
| [GO:0017076] | purine nucleotide binding | 91 | 91 |
| [GO:0003676] | nucleic acid binding | 88 | 88 |
| [GO:0032555] | purine ribonucleotide binding | 81 | 81 |
| [GO:0004872] | receptor activity | 75 | 75 |
| [GO:0004690] | cyclic nucleotide-dependent protein kinase activity | 68 | 68 |
| [GO:0004691] | cAMP-dependent protein kinase activity | 67 | 67 |
| [GO:0016491] | oxidoreductase activity | 67 | 67 |
| [GO:0008270] | zinc ion binding | 64 | 64 |
| [GO:0030554] | adenyl nucleotide binding | 63 | 63 |
| [GO:0005102] | receptor binding | 57 | 57 |
| [GO:0032559] | adenyl ribonucleotide binding | 53 | 53 |
| [GO:0005215] | transporter activity | 52 | 52 |
| [GO:0008233] | peptidase activity | 46 | 46 |
| [GO:0070011] | peptidase activity, acting on l-amino acid peptides | 43 | 43 |
| [GO:0003677] | DNA binding | 43 | 43 |
| [GO:0004888] | transmembrane receptor activity | 40 | 40 |
| [GO:0005509] | calcium ion binding | 39 | 39 |
| [GO:0022892] | substrate-specific transporter activity | 39 | 39 |
| [GO:0004687] | myosin light chain kinase activity | 38 | 38 |
| [GO:0030528] | transcription regulator activity | 37 | 37 |
| [GO:0022857] | transmembrane transporter activity | 36 | 36 |
| [GO:0022891] | substrate-specific transmembrane transporter activity | 35 | 35 |
| [GO:0030234] | enzyme regulator activity | 35 | 35 |
| [GO:0005506] | iron ion binding | 33 | 33 |
| [GO:0004175] | endopeptidase activity | 33 | 33 |
| [GO:0003700] | transcription factor activity | 32 | 32 |
| [GO:0015075] | ion transmembrane transporter activity | 30 | 30 |
| [GO:0019001] | guanyl nucleotide binding | 28 | 28 |
| [GO:0005198] | structural molecule activity | 28 | 28 |
| [GO:0004857] | enzyme inhibitor activity | 26 | 26 |
| [GO:0016788] | hydrolase activity, acting on ester bonds | 26 | 26 |
| [GO:0008324] | cation transmembrane transporter activity | 25 | 25 |
| [GO:0009055] | electron carrier activity | 24 | 24 |
| [GO:0004930] | G-protein coupled receptor activity | 24 | 24 |
| [GO:0003723] | RNA binding | 23 | 23 |
| [GO:0005126] | cytokine receptor binding | 22 | 22 |
| [GO:0016874] | ligase activity | 22 | 22 |
| [GO:0048037] | cofactor binding | 20 | 20 |
| [GO:0016817] | hydrolase activity, acting on acid anhydrides | 19 | 19 |
| [GO:0003735] | structural constituent of ribosome | 19 | 19 |
| [GO:0005125] | cytokine activity | 18 | 18 |
| [GO:0030414] | peptidase inhibitor activity | 18 | 18 |
| [GO:0050662] | coenzyme binding | 17 | 17 |
| [GO:0016757] | transferase activity, transferring glycosyl groups | 17 | 17 |
| [GO:0030246] | carbohydrate binding | 17 | 17 |
| [GO:0008092] | cytoskeletal protein binding | 16 | 16 |
| [GO:0022890] | inorganic cation transmembrane transporter activity | 16 | 16 |
| [GO:0016746] | transferase activity, transferring acyl groups | 16 | 16 |
| [GO:0016879] | ligase activity, forming carbon-nitrogen bonds | 16 | 16 |
| [GO:0000287] | magnesium ion binding | 15 | 15 |
| [GO:0008237] | metallopeptidase activity | 15 | 15 |
| [GO:0016614] | oxidoreductase activity, acting on CH–OH group of donors | 15 | 15 |
| [GO:0022804] | active transmembrane transporter activity | 15 | 15 |
| [GO:0019955] | cytokine binding | 14 | 14 |
| [GO:0017171] | serine hydrolase activity | 14 | 14 |
| [GO:0046906] | tetrapyrrole binding | 14 | 14 |
| [GO:0016616] | oxidoreductase activity, acting on the CH–OH group of donors, NAD or NADP as acceptor | 14 | 14 |
| [GO:0016747] | transferase activity, transferring acyl groups other than amino-acyl groups | 14 | 14 |
| [GO:0008528] | peptide receptor activity, G-protein coupled | 14 | 14 |
| [GO:0003779] | actin binding | 14 | 14 |
| [GO:0004252] | serine-type endopeptidase activity | 13 | 13 |
| [GO:0016705] | oxidoreductase activity, acting on paired donors, with incorporation or reduction of molecular oxygen | 13 | 13 |
| [GO:0004497] | monooxygenase activity | 12 | 12 |
| [GO:0042578] | phosphoric ester hydrolase activity | 12 | 12 |
| [GO:0008234] | cysteine-type peptidase activity | 11 | 11 |
| [GO:0046873] | metal ion transmembrane transporter activity | 11 | 11 |
| [GO:0008289] | lipid binding | 11 | 11 |
| [GO:0016791] | phosphatase activity | 11 | 11 |
| [GO:0050660] | FAD binding | 10 | 10 |
| [GO:0015078] | hydrogen ion transmembrane transporter activity | 10 | 10 |
| [GO:0016758] | transferase activity, transferring hexosyl groups | 10 | 10 |
| [GO:0004867] | serine-type endopeptidase inhibitor activity | 10 | 10 |
| [GO:0004428] | inositol or phosphatidylinositol kinase activity | 10 | 10 |
| [GO:0016798] | hydrolase activity, acting on glycosyl bonds | 10 | 10 |
| [GO:0005516] | calmodulin binding | 9 | 9 |
| [GO:0016810] | hydrolase activity, acting on carbon-nitrogen (but not peptide) bonds | 9 | 9 |
| [GO:0042623] | ATPase activity, coupled | 9 | 9 |
| [GO:0001871] | pattern binding | 9 | 9 |
| [GO:0016776] | phosphotransferase activity, phosphate group as acceptor | 9 | 9 |
| [GO:0005179] | hormone activity | 9 | 9 |
| [GO:0070851] | growth factor receptor binding | 9 | 9 |
| [GO:0004197] | cysteine-type endopeptidase activity | 9 | 9 |
| [GO:0005057] | receptor signaling protein activity | 9 | 9 |
| [GO:0004950] | chemokine receptor activity | 9 | 9 |
| [GO:0004222] | metalloendopeptidase activity | 9 | 9 |
| [GO:0043565] | sequence-specific DNA binding | 9 | 9 |
| [GO:0005216] | ion channel activity | 8 | 8 |
| [GO:0016853] | isomerase activity | 8 | 8 |
| [GO:0000826] | inositol pyrophosphate synthase activity | 8 | 8 |
| [GO:0019842] | vitamin binding | 8 | 8 |
| [GO:0005539] | glycosaminoglycan binding | 8 | 8 |
| [GO:0005529] | sugar binding | 8 | 8 |
| [GO:0005066] | transmembrane receptor protein tyrosine kinase signaling protein activity | 8 | 8 |
| [GO:0020037] | heme binding | 8 | 8 |
| [GO:0004356] | glutamate-ammonia ligase activity | 8 | 8 |
| [GO:0005507] | copper ion binding | 7 | 7 |
| [GO:0016209] | antioxidant activity | 7 | 7 |
| [GO:0008238] | exopeptidase activity | 7 | 7 |
| [GO:0008009] | chemokine activity | 7 | 7 |
| [GO:0016860] | intramolecular oxidoreductase activity | 7 | 7 |
| [GO:0004721] | phosphoprotein phosphatase activity | 7 | 7 |
| [GO:0015291] | secondary active transmembrane transporter activity | 7 | 7 |
| [GO:0016563] | transcription activator activity | 6 | 6 |
| [GO:0005244] | voltage-gated ion channel activity | 6 | 6 |
| [GO:0008201] | heparin binding | 6 | 6 |
| [GO:0031420] | alkali metal ion binding | 6 | 6 |
| [GO:0046983] | protein dimerization activity | 6 | 6 |
| [GO:0015082] | di-, tri-valent inorganic cation transmembrane transporter activity | 6 | 6 |
| [GO:0004312] | fatty-acid synthase activity | 6 | 6 |
| [GO:0042802] | identical protein binding | 6 | 6 |
| [GO:0016684] | oxidoreductase activity, acting on peroxide as acceptor | 6 | 6 |
| [GO:0016829] | lyase activity | 5 | 5 |
| [GO:0008047] | enzyme activator activity | 5 | 5 |
| [GO:0003924] | GTPase activity | 5 | 5 |
| [GO:0004091] | carboxylesterase activity | 5 | 5 |
| [GO:0015399] | primary active transmembrane transporter activity | 5 | 5 |
| [GO:0005261] | cation channel activity | 5 | 5 |
| [GO:0019904] | protein domain specific binding | 5 | 5 |
| [GO:0004694] | eukaryotic translation initiation factor 2alpha kinase activity | 5 | 5 |
| [GO:0016627] | oxidoreductase activity, acting on the CH–CH group of donors | 5 | 5 |
| [GO:0031406] | carboxylic acid binding | 5 | 5 |
| [GO:0042803] | protein homodimerization activity | 5 | 5 |
| [GO:0004518] | nuclease activity | 5 | 5 |
| [GO:0019899] | enzyme binding | 5 | 5 |
| [GO:0003774] | motor activity | 5 | 5 |
| [GO:0008430] | selenium binding | 5 | 5 |
| [GO:0004725] | protein tyrosine phosphatase activity | 5 | 5 |
| [GO:0015293] | symporter activity | 5 | 5 |
| [GO:0004713] | protein tyrosine kinase activity | 5 | 5 |
| [GO:0046915] | transition metal ion transmembrane transporter activity | 4 | 4 |
| [GO:0008135] | translation factor activity, nucleic acid binding | 4 | 4 |
| [GO:0008134] | transcription factor binding | 4 | 4 |
| [GO:0010857] | calcium-dependent protein kinase activity | 4 | 4 |
| [GO:0050661] | NADP or NADPH binding | 4 | 4 |
| [GO:0060589] | nucleoside-triphosphatase regulator activity | 4 | 4 |
| [GO:0008373] | sialyltransferase activity | 4 | 4 |
| [GO:0004896] | cytokine receptor activity | 4 | 4 |
| [GO:0008083] | growth factor activity | 4 | 4 |
| [GO:0016709] | oxidoreductase activity, acting on paired donors, with incorporation or reduction of molecular oxygen, NADH or NADPH as one donor, and incorporation of one atom of oxygen | 4 | 4 |
| [GO:0004576] | oligosaccharyl transferase activity | 4 | 4 |
| [GO:0008509] | anion transmembrane transporter activity | 4 | 4 |
| [GO:0051540] | metal cluster binding | 4 | 4 |
| [GO:0004177] | aminopeptidase activity | 4 | 4 |
| [GO:0016765] | transferase activity, transferring alkyl or aryl (other than methyl) groups | 4 | 4 |
| [GO:0015929] | hexosaminidase activity | 4 | 4 |
| [GO:0016741] | transferase activity, transferring one-carbon groups | 4 | 4 |
| [GO:0004129] | cytochrome-c oxidase activity | 4 | 4 |
| [GO:0004521] | endoribonuclease activity | 4 | 4 |
| [GO:0051287] | NAD or NADH binding | 3 | 3 |
| [GO:0005385] | zinc ion transmembrane transporter activity | 3 | 3 |
| [GO:0004774] | succinate-CoA ligase activity | 3 | 3 |
| [GO:0004090] | carbonyl reductase (NADPH) activity | 3 | 3 |
| [GO:0005249] | voltage-gated potassium channel activity | 3 | 3 |
| [GO:0008757] | S-adenosylmethionine-dependent methyltransferase activity | 3 | 3 |
| [GO:0005160] | transforming growth factor beta receptor binding | 3 | 3 |
| [GO:0008235] | metalloexopeptidase activity | 3 | 3 |
| [GO:0005275] | amine transmembrane transporter activity | 3 | 3 |
| [GO:0019840] | isoprenoid binding | 3 | 3 |
| [GO:0019838] | growth factor binding | 3 | 3 |
| [GO:0005128] | erythropoietin receptor binding | 3 | 3 |
| [GO:0016801] | hydrolase activity, acting on ether bonds | 3 | 3 |
| [GO:0016701] | oxidoreductase activity, acting on single donors with incorporation of molecular oxygen | 3 | 3 |
| [GO:0003712] | transcription cofactor activity | 3 | 3 |
| [GO:0015144] | carbohydrate transmembrane transporter activity | 3 | 3 |
| [GO:0003995] | acyl-CoA dehydrogenase activity | 3 | 3 |
| [GO:0004869] | cysteine-type endopeptidase inhibitor activity | 3 | 3 |
| [GO:0031402] | sodium ion binding | 3 | 3 |
| [GO:0019888] | protein phosphatase regulator activity | 3 | 3 |
| [GO:0016651] | oxidoreductase activity, acting on NADH or NADPH | 3 | 3 |
| [GO:0004180] | carboxypeptidase activity | 3 | 3 |
| [GO:0030695] | GTPase regulator activity | 3 | 3 |
| [GO:0010181] | FMN binding | 3 | 3 |
| [GO:0003743] | translation initiation factor activity | 3 | 3 |
| [GO:0016861] | intramolecular oxidoreductase activity, interconverting aldoses and ketoses | 3 | 3 |
| [GO:0004522] | pancreatic ribonuclease activity | 3 | 3 |
| [GO:0015294] | solute:cation symporter activity | 3 | 3 |
| [GO:0016790] | thiolester hydrolase activity | 3 | 3 |
| [GO:0008026] | ATP-dependent helicase activity | 3 | 3 |
| [GO:0030145] | manganese ion binding | 3 | 3 |
| [GO:0008417] | fucosyltransferase activity | 3 | 3 |
| [GO:0008194] | UDP-glycosyltransferase activity | 3 | 3 |
| [GO:0008199] | ferric iron binding | 3 | 3 |
| NO | GO term | Biological process | Number PermineJ | |
|---|---|---|---|---|
| 1 | GO:0050896 | response to stimulus | 96 | 0 |
| 2 | GO:0051179 | Localization | 92 | 0 |
| 3 | GO:0002376 | immune system process | 56 | 0 |
| 4 | GO:0006955 | immune response | 53 | 0 |
| 5 | GO:0055114 | oxidation reduction | 53 | 0 |
| 1 | GO:0050896 | response to stimulus | 96 | 0 |
| 6 | GO:0006950 | response to stress | 51 | 0 |
| 7 | GO:0022610 | biological adhesion | 29 | 0 |
| 8 | GO:0009605 | response to external stimulus | 25 | 0 |
| 9 | GO:0008219 | cell death | 22 | 0 |
| 10 | GO:0033036 | macromolecule localization | 21 | 0 |
| 11 | GO:0042221 | response to chemical stimulus | 17 | 0 |
| 12 | GO:0019882 | antigen processing and presentation | 15 | 0 |
| 13 | GO:0048583 | regulation of response to stimulus | 13 | 0 |
| 14 | GO:0032879 | regulation of localization | 12 | 0 |
| 15 | GO:0042592 | homeostatic process | 12 | 0 |
| 16 | GO:0048584 | positive regulation of response to stimulus | 11 | 0 |
| 17 | GO:0002682 | regulation of immune system process | 11 | 0 |
| 18 | GO:0051716 | cellular response to stimulus | 10 | 0 |
| 19 | GO:0002252 | immune effector process | 10 | 0 |
| 20 | GO:0050778 | positive regulation of immune response | 8 | 0 |
| 21 | GO:0009607 | response to biotic stimulus | 7 | 0 |
| 22 | GO:0023052 | signaling | 6 | 0 |
| 23 | GO:0040011 | locomotion | 5 | 0 |
| 24 | GO:0042330 | taxis | 4 | 0 |
| 25 | GO:0002520 | immune system development | 3 | 0 |
| 26 | GO:0009628 | response to abiotic stimulus | 3 | 0 |
| 27 | GO:0009719 | response to endogenous stimulus | 3 | 0 |
| NO. | Pathway | Size | ES | NES | NOM p-val | FDR q-val | FWER p-val | Rank at max | Leading edge |
|---|---|---|---|---|---|---|---|---|---|
| 1 | ssc04664: Fc epsilon RI signaling pathway | 13 | −0.74 | −1.83 | 0.001 | 0.084 | 0.064 | 89 | Tags = 77%, list = 17%, signal = 91% |
| 2 | ssc04930: Type II diabetes mellitus | 5 | −0.82 | −1.62 | 0.017 | 0.715 | 0.685 | 42 | Tags = 60%, list = 8%, signal = 65% |
| 3 | ssc04914: Progesterone-mediated oocyte maturation | 12 | −0.66 | −1.61 | 0.012 | 0.508 | 0.701 | 56 | Tags = 42%, list = 11%, signal = 46% |
| 4 | ssc00140: Steroid hormone biosynthesis | 4 | −0.85 | −1.58 | 0.012 | 0.529 | 0.814 | 44 | Tags = 75%, list = 9%, signal = 81% |
| 5 | ssc04621: NOD-like receptor signaling pathway | 13 | −0.62 | −1.56 | 0.019 | 0.49 | 0.861 | 49 | tags = 46%, list = 10%, signal = 50% |
| 6 | ssc05221: Acute myeloid leukemia | 11 | −0.63 | −1.54 | 0.034 | 0.478 | 0.901 | 133 | tags = 73%, list = 26%, signal = 96% |
| 7 | ssc05218: Melanoma | 10 | −0.64 | −1.51 | 0.049 | 0.562 | 0.955 | 100 | tags = 50%, list = 19%, signal = 61% |
| 8 | ssc03040: Spliceosome | 9 | −0.67 | −1.5 | 0.039 | 0.524 | 0.961 | 101 | tags = 44%, list = 20%, signal = 54% |
| 9 | ssc04640: Hematopoietic cell lineage | 19 | −0.53 | −1.48 | 0.055 | 0.55 | 0.982 | 120 | tags = 58%, list = 23%, signal = 73% |
| 10 | ssc04210: Apoptosis | 10 | −0.61 | −1.48 | 0.066 | 0.504 | 0.984 | 158 | tags = 70%, list = 31%, signal = 99% |
| 11 | Ssc05214: Glioma | 11 | −0.61 | −1.47 | 0.052 | 0.467 | 0.985 | 100 | tags = 45%, list = 19%, signal = 55% |
| 12 | ssc04012: ErbB signaling pathway | 13 | −0.56 | −1.45 | 0.076 | 0.539 | 0.999 | 102 | tags = 38%, list = 20%, signal = 47% |
| 13 | ssc05020: Prion diseases | 8 | −0.64 | −1.44 | 0.07 | 0.533 | 1 | 65 | tags = 50%, list = 13%, signal = 56% |
| 14 | ssc04666: Fc gamma R-mediated phagocytosis | 12 | −0.56 | −1.4 | 0.098 | 0.641 | 1 | 135 | tags = 67%, list = 26%, signal = 88% |
| 15 | ssc04650: Natural killer cell mediated cytotoxicity | 19 | −0.52 | −1.4 | 0.087 | 0.605 | 1 | 89 | tags = 42%, list = 17%, signal = 49% |
| 16 | ssc00650: Butanoate metabolism | 5 | −0.72 | −1.39 | 0.088 | 0.581 | 1 | 6 | tags = 20%, list = 1%, signal = 20% |
| 17 | ssc00410: Beta-Alanine metabolism | 5 | −0.71 | −1.38 | 0.076 | 0.603 | 1 | 6 | tags = 20%, list = 1%, signal = 20% |
| 18 | ssc04660: T cell receptor signaling pathway | 18 | −0.49 | −1.35 | 0.112 | 0.689 | 1 | 122 | tags = 56%, list = 24%, signal = 70% |
| 19 | ssc04370: VEGF signaling pathway | 8 | −0.61 | −1.35 | 0.152 | 0.664 | 1 | 122 | tags = 63%, list = 24%, signal = 81% |
| 20 | ssc05219: Bladder cancer | 10 | −0.56 | −1.34 | 0.132 | 0.648 | 1 | 147 | tags = 60%, list = 29%, signal = 82% |
| 21 | ssc04920: Adipocytokine signaling pathway | 12 | −0.53 | −1.34 | 0.146 | 0.634 | 1 | 78 | tags = 42%, list = 15%, signal = 48% |
| 22 | ssc04114: Oocyte meiosis | 12 | −0.54 | −1.34 | 0.132 | 0.608 | 1 | 56 | tags = 25%, list = 11%, signal = 27% |
| 23 | ssc00750: Vitamin B6 metabolism | 2 | −0.86 | −1.33 | 0.09 | 0.6 | 1 | 72 | tags = 100%, list = 14%, signal = 116% |
| 24 | ssc00260: Glycine, serine and threonine metabolism | 4 | −0.71 | −1.32 | 0.131 | 0.597 | 1 | 128 | tags = 75%, list = 25%, signal = 99% |
| 25 | ssc04960: Aldosterone-regulated sodium reabsorption | 5 | −0.69 | −1.32 | 0.139 | 0.579 | 1 | 106 | tags = 60%, list = 21%, signal = 75% |
| 26 | ssc00910: Nitrogen metabolism | 3 | −0.76 | −1.29 | 0.164 | 0.646 | 1 | 91 | tags = 67%, list = 18%, signal = 81% |
| 27 | ssc05220: Chronic myeloid leukemia | 14 | −0.5 | −1.27 | 0.206 | 0.69 | 1 | 172 | tags = 57%, list = 34%, signal = 84% |
| 28 | ssc04115: P53 signaling pathway | 12 | −0.51 | −1.27 | 0.197 | 0.687 | 1 | 156 | tags = 75%, list = 30%, signal = 105% |
| 29 | ssc04630: Jak-STAT signaling pathway | 19 | −0.44 | −1.22 | 0.234 | 0.813 | 1 | 105 | tags = 42%, list = 20%, signal = 51% |
| 30 | ssc00640: Propanoate metabolism | 9 | −0.53 | −1.22 | 0.23 | 0.798 | 1 | 61 | tags = 22%, list = 12%, signal = 25% |
| 31 | ssc05213: Endometrial cancer | 10 | −0.51 | −1.21 | 0.248 | 0.787 | 1 | 133 | tags = 50%, list = 26%, signal = 66% |
| 32 | ssc00591: Linoleic acid metabolism | 4 | −0.66 | −1.19 | 0.27 | 0.829 | 1 | 44 | tags = 75%, list = 9%, signal = 81% |
| 33 | ssc05215: Prostate cancer | 17 | −0.44 | −1.19 | 0.243 | 0.811 | 1 | 115 | tags = 35%, list = 22%, signal = 44% |
| 34 | ssc00280: Valine, leucine and isoleucine degradation | 11 | −0.49 | −1.18 | 0.269 | 0.826 | 1 | 157 | tags = 45%, list = 31%, signal = 64% |
| 35 | ssc00620: Pyruvate metabolism | 7 | −0.54 | −1.17 | 0.285 | 0.818 | 1 | 239 | tags = 100%, list = 47%, signal = 185% |
| 36 | ssc00010: Glycolysis/Gluconeogenesis | 12 | −0.47 | −1.17 | 0.26 | 0.796 | 1 | 243 | tags = 83%, list = 47%, signal = 155% |
| 37 | ssc04150: MTOR signaling pathway | 7 | −0.56 | −1.17 | 0.291 | 0.78 | 1 | 42 | tags = 29%, list = 8%, signal = 31% |
| 38 | ssc00250: Alanine, aspartate and glutamate metabolism | 5 | −0.6 | −1.16 | 0.302 | 0.79 | 1 | 6 | tags = 20%, list = 1%, signal = 20% |
| 39 | ssc00511: Other glycan degradation | 4 | −0.63 | −1.16 | 0.312 | 0.772 | 1 | 195 | tags = 100%, list = 38%, signal = 160% |
| 40 | ssc05212: Pancreatic cancer | 13 | −0.45 | −1.16 | 0.304 | 0.754 | 1 | 172 | tags = 54%, list = 34%, signal = 79% |
| 41 | ssc00604: Glycosphingolipid biosynthesis | 4 | −0.63 | −1.15 | 0.299 | 0.755 | 1 | 195 | tags = 100%, list = 38%, signal = 160% |
| 42 | ssc00052: Galactose metabolism | 3 | −0.66 | −1.12 | 0.338 | 0.835 | 1 | 52 | tags = 33%, list = 10%, signal = 37% |
| 43 | ssc00520: Amino sugar and nucleotide sugar metabolism | 6 | −0.54 | −1.11 | 0.353 | 0.831 | 1 | 116 | tags = 50%, list = 23%, signal = 64% |
| 44 | ssc04070: Phosphatidylinositol signaling system | 6 | −0.55 | −1.11 | 0.358 | 0.813 | 1 | 100 | tags = 67%, list = 19%, signal = 82% |
| 45 | ssc04662: B cell receptor signaling pathway | 12 | −0.45 | −1.11 | 0.336 | 0.798 | 1 | 120 | tags = 58%, list = 23%, signal = 74% |
| 46 | ssc00500: Starch and sucrose metabolism | 4 | −0.6 | −1.1 | 0.37 | 0.809 | 1 | 57 | tags = 50%, list = 11%, signal = 56% |
| 47 | ssc05014: Amyotrophic lateral sclerosis (ALS) | 5 | −0.57 | −1.09 | 0.404 | 0.812 | 1 | 49 | tags = 40%, list = 10%, signal = 44% |
| 48 | ssc00310: Lysine degradation | 4 | −0.59 | −1.09 | 0.381 | 0.795 | 1 | 149 | tags = 75%, list = 29%, signal = 105% |
| 49 | ssc04144: Endocytosis | 18 | −0.41 | −1.08 | 0.384 | 0.814 | 1 | 26 | tags = 17%, list = 5%, signal = 17% |
| 50 | ssc00533: Keratan sulfate biosynthesis | 2 | −0.69 | −1.07 | 0.389 | 0.801 | 1 | 162 | tags = 100%, list = 32%, signal = 146% |
| 51 | ssc04623: Cytosolic DNA-sensing pathway | 8 | −0.47 | −1.07 | 0.4 | 0.791 | 1 | 30 | tags = 25%, list = 6%, signal = 26% |
| 52 | ssc00340: Histidine metabolism | 5 | −0.55 | −1.06 | 0.397 | 0.806 | 1 | 149 | tags = 60%, list = 29%, signal = 84% |
| 53 | ssc00980: Metabolism of xenobiotics by cytochrome P450 | 9 | −0.45 | −1.04 | 0.442 | 0.835 | 1 | 44 | tags = 33%, list = 9%, signal = 36% |
| 54 | ssc00270: Cysteine and methionine metabolism | 5 | −0.53 | −1.04 | 0.478 | 0.824 | 1 | 245 | tags = 100%, list = 48%, signal = 190% |
| 55 | ssc04330: Notch signaling pathway | 6 | −0.5 | −1.03 | 0.473 | 0.833 | 1 | 4 | tags = 17%, list = 1%, signal = 17% |
| 56 | ssc00330: Arginine and proline metabolism | 10 | −0.43 | −1.03 | 0.447 | 0.824 | 1 | 174 | tags = 50%, list = 34%, signal = 74% |
| 57 | ssc05223: Non-small cell lung cancer | 7 | −0.47 | −1.01 | 0.487 | 0.844 | 1 | 89 | tags = 43%, list = 17%, signal = 51% |
| 58 | ssc04720: Long-term potentiation | 8 | −0.46 | −1.01 | 0.48 | 0.84 | 1 | 89 | tags = 25%, list = 17%, signal = 30% |
| 59 | ssc04110: Cell cycle | 19 | −0.36 | −1 | 0.472 | 0.832 | 1 | 220 | tags = 58%, list = 43%, signal = 98% |
| 60 | ssc04730: Long-term depression | 13 | −0.39 | −1 | 0.464 | 0.822 | 1 | 34 | tags = 15%, list = 7%, signal = 16% |
| 61 | ssc05211: Renal cell carcinoma | 13 | −0.4 | −1 | 0.467 | 0.812 | 1 | 193 | tags = 62%, list = 38%, signal = 96% |
| 62 | ssc04912: GnRH signaling pathway | 13 | −0.38 | −0.98 | 0.507 | 0.842 | 1 | 122 | tags = 31%, list = 24%, signal = 39% |
| 63 | ssc00983: Drug metabolism | 5 | −0.5 | −0.97 | 0.515 | 0.838 | 1 | 44 | tags = 60%, list = 9%, signal = 65% |
| 64 | ssc00450: Selenoamino acid metabolism | 3 | −0.58 | −0.97 | 0.547 | 0.84 | 1 | 176 | tags = 67%, list = 34%, signal = 101% |
| 65 | ssc00071: Fatty acid metabolism | 8 | −0.43 | −0.95 | 0.556 | 0.856 | 1 | 244 | tags = 75%, list = 48%, signal = 141% |
| 66 | ssc00020: Citrate cycle (TCA cycle) | 9 | −0.41 | −0.95 | 0.533 | 0.845 | 1 | 309 | tags = 100%, list = 60%, signal = 247% |
| 67 | ssc03018: RNA degradation | 2 | −0.6 | −0.93 | 0.583 | 0.866 | 1 | 206 | tags = 100%, list = 40%, signal = 166% |
| 68 | ssc00603: Glycosphingolipid biosynthesis | 6 | −0.44 | −0.93 | 0.58 | 0.866 | 1 | 195 | tags = 83%, list = 38%, signal = 133% |
| 69 | ssc00053: Ascorbate and aldarate metabolism | 3 | −0.54 | −0.92 | 0.599 | 0.86 | 1 | 239 | tags = 100%, list = 47%, signal = 186% |
| 70 | ssc04020: Calcium signaling pathway | 20 | −0.33 | −0.92 | 0.578 | 0.85 | 1 | 29 | tags = 10%, list = 6%, signal = 10% |
| 71 | ssc00510: N-Glycan biosynthesis | 8 | −0.41 | −0.91 | 0.607 | 0.863 | 1 | 306 | tags = 100%, list = 60%, signal = 244% |
| 72 | ssc00903: Limonene and pinene degradation | 3 | −0.54 | −0.91 | 0.631 | 0.851 | 1 | 239 | tags = 100%, list = 47%, signal = 186% |
| 73 | ssc03320: PPAR signaling pathway | 13 | −0.36 | −0.91 | 0.598 | 0.843 | 1 | 78 | tags = 31%, list = 15%, signal = 35% |
| 74 | ssc04142: Lysosome | 16 | −0.34 | −0.89 | 0.623 | 0.867 | 1 | 195 | tags = 75%, list = 38%, signal = 117% |
| 75 | ssc05210: Colorectal cancer | 13 | −0.35 | −0.89 | 0.599 | 0.857 | 1 | 42 | tags = 15%, list = 8%, signal = 16% |
| 76 | ssc04622: RIG-I-like receptor signaling pathway | 12 | −0.35 | −0.87 | 0.626 | 0.867 | 1 | 49 | tags = 25%, list = 10%, signal = 27% |
| 77 | ssc04320: Dorso-ventral axis formation | 2 | −0.57 | −0.87 | 0.674 | 0.86 | 1 | 34 | tags = 50%, list = 7%, signal = 53% |
| 78 | ssc04130: SNARE interactions in vesicular transport | 2 | −0.57 | −0.87 | 0.676 | 0.857 | 1 | 123 | tags = 50%, list = 24%, signal = 66% |
| 79 | ssc00230: Purine metabolism | 6 | −0.42 | −0.85 | 0.68 | 0.869 | 1 | 21 | tags = 17%, list = 4%, signal = 17% |
| 80 | ssc00380: Tryptophan metabolism | 4 | −0.46 | −0.85 | 0.699 | 0.865 | 1 | 239 | tags = 75%, list = 47%, signal = 139% |
| 81 | ssc04910:Insulin signaling pathway | 16 | −0.32 | −0.84 | 0.688 | 0.859 | 1 | 104 | tags = 25%, list = 20%, signal = 30% |
| 82 | ssc00190: Oxidative phosphorylation | 17 | −0.31 | −0.84 | 0.666 | 0.85 | 1 | 317 | tags = 94%, list = 62%, signal = 238% |
| 83 | ssc00051: Fructose and mannose metabolism | 4 | −0.46 | −0.84 | 0.697 | 0.848 | 1 | 69 | tags = 25%, list = 13%, signal = 29% |
| 84 | ssc04614: Renin-angiotensin system | 3 | −0.5 | −0.84 | 0.715 | 0.839 | 1 | 143 | tags = 33%, list = 28%, signal = 46% |
| 85 | ssc00860: Porphyrin and chlorophyll metabolism | 3 | −0.49 | −0.83 | 0.709 | 0.836 | 1 | 238 | tags = 67%, list = 46%, signal = 124% |
| 86 | ssc00350: Tyrosine metabolism | 5 | −0.43 | −0.83 | 0.692 | 0.833 | 1 | 263 | tags = 80%, list = 51%, signal = 163% |
| 87 | ssc00561: Glycerolipid metabolism | 6 | −0.38 | −0.79 | 0.733 | 0.87 | 1 | 239 | tags = 83%, list = 47%, signal = 154% |
| 88 | ssc00030: Pentose phosphate pathway | 5 | −0.41 | −0.79 | 0.744 | 0.868 | 1 | 57 | tags = 20%, list = 11%, signal = 22% |
| 89 | ssc04540: Gap junction | 11 | −0.32 | −0.77 | 0.764 | 0.884 | 1 | 134 | tags = 27%, list = 26%, signal = 36% |
| 90 | ssc04916: Melanogenesis | 14 | −0.29 | −0.75 | 0.787 | 0.892 | 1 | 145 | tags = 29%, list = 28%, signal = 39% |
| 91 | ssc00562: Inositol phosphate metabolism | 7 | −0.35 | −0.75 | 0.775 | 0.884 | 1 | 100 | tags = 43%, list = 19%, signal = 53% |
| 92 | ssc03050 Proteasome: | 4 | −0.4 | −0.74 | 0.814 | 0.887 | 1 | 97 | tags = 25%, list = 19%, signal = 31% |
| 93 | ssc00600: Sphingolipid metabolism | 5 | −0.36 | −0.71 | 0.821 | 0.919 | 1 | 107 | tags = 40%, list = 21%, signal = 50% |
| 94 | ssc00630: Glyoxylate and dicarboxylate metabolism | 2 | −0.46 | −0.7 | 0.907 | 0.916 | 1 | 142 | tags = 50%, list = 28%, signal = 69% |
| 95 | ssc04512: ECM-receptor interaction | 11 | −0.29 | −0.69 | 0.853 | 0.916 | 1 | 8 | tags = 9%, list = 2%, signal = 9% |
| 96 | ssc00531: Glycosaminoglycan degradation | 4 | −0.35 | −0.65 | 0.899 | 0.946 | 1 | 240 | tags = 75%, list = 47%, signal = 140% |
| 97 | ssc05216: Thyroid cancer | 8 | −0.29 | −0.63 | 0.904 | 0.948 | 1 | 133 | tags = 38%, list = 26%, signal = 50% |
| 98 | ssc04520: Adherens junction | 10 | −0.26 | −0.61 | 0.902 | 0.957 | 1 | 170 | tags = 40%, list = 33%, signal = 59% |
| 99 | ssc00564: Glycerophospholipid metabolism | 5 | −0.3 | −0.58 | 0.94 | 0.969 | 1 | 219 | tags = 60%, list = 43%, signal = 104% |
| 100 | ssc00360: Phenylalanine metabolism | 5 | −0.26 | −0.51 | 0.972 | 0.992 | 1 | 219 | tags = 60%, list = 43%, signal = 104% |
| 101 | ssc04270: Vascular smooth muscle contraction | 14 | −0.18 | −0.46 | 0.988 | 0.998 | 1 | 34 | tags = 7%, list = 7%, signal = 7% |
| 102 | ssc04350: TGF-beta signaling pathway | 14 | −0.18 | −0.45 | 0.982 | 0.99 | 1 | 172 | tags = 36%, list = 34%, signal = 52% |
| No. | Pathway | Size | ES | NES | NOM p-val | FDR q-val | FWER p-val | Rank at Max | Leading edge |
|---|---|---|---|---|---|---|---|---|---|
| 1 | ssc05320: Autoimmune thyroid disease | 15 | 0.64 | 1.97 | 0.003 | 0.034 | 0.058 | 139 | tags = 87%, list = 27%, signal = 115% |
| 2 | ssc04940: Type I diabetes mellitus | 16 | 0.59 | 1.86 | 0.003 | 0.053 | 0.165 | 139 | tags = 88%, list = 27%, signal = 116% |
| 3 | ssc05330: Allograft rejection | 17 | 0.54 | 1.72 | 0.015 | 0.116 | 0.458 | 139 | tags = 82%, list = 27%, signal = 109% |
| 4 | Ssc04530: Tight junction | 17 | 0.52 | 1.67 | 0.013 | 0.141 | 0.628 | 2 | tags = 12%, list = 0%, signal = 11% |
| 5 | ssc04260: Cardiac muscle contraction | 13 | 0.55 | 1.65 | 0.03 | 0.132 | 0.683 | 107 | tags = 46%, list = 21%, signal = 57% |
| 6 | ssc05412: Arrhythmogenic right ventricular cardiomyopathy | 12 | 0.56 | 1.57 | 0.051 | 0.196 | 0.853 | 155 | tags = 75%, list = 30%, signal = 105% |
| 7 | ssc02010: ABC transporters | 2 | 0.83 | 1.34 | 0.136 | 0.6 | 0.998 | 89 | tags = 100%, list = 17%, signal = 121% |
| 8 | ssc05340: Primary immunodeficiency | 7 | 0.54 | 1.3 | 0.179 | 0.619 | 0.999 | 61 | tags = 43%, list = 12%, signal = 48% |
| 9 | ssc05217: Basal cell carcinoma | 5 | 0.56 | 1.25 | 0.241 | 0.668 | 1 | 114 | tags = 60%, list = 22%, signal = 76% |
| 10 | ssc04740: Olfactory transduction | 3 | 0.67 | 1.22 | 0.259 | 0.664 | 1 | 172 | Tags = 100%, list = 34%, signal = 150% |
| 11 | ssc04120: Ubiquitin mediated proteolysis | 8 | 0.47 | 1.18 | 0.271 | 0.683 | 1 | 32 | Tags = 25%, list = 6%, signal = 26% |
| 12 | ssc03010: Ribosome | 17 | 0.37 | 1.17 | 0.257 | 0.657 | 1 | 328 | Tags = 100%, list = 64%, signal = 268% |
| 13 | ssc01040: Biosynthesis of unsaturated fatty acids | 2 | 0.73 | 1.15 | 0.336 | 0.634 | 1 | 11 | Tags = 50%, list = 2%, signal = 51% |
| 14 | ssc05012: Parkinson’s disease | 17 | 0.35 | 1.13 | 0.302 | 0.633 | 1 | 337 | Tags = 100%, list = 66%, signal = 282% |
| 15 | ssc05332: Graft-versus-host disease | 15 | 0.36 | 1.1 | 0.367 | 0.646 | 1 | 139 | Tags = 80%, list = 27%, signal = 107% |
| 16 | ssc00590: Arachidonic acid metabolism | 11 | 0.39 | 1.08 | 0.352 | 0.634 | 1 | 55 | Tags = 36%, list = 11%, signal = 40% |
| 17 | ssc04360: Axon guidance | 12 | 0.36 | 1.05 | 0.393 | 0.653 | 1 | 56 | Tags = 33%, list = 11%, signal = 37% |
| 18 | ssc04310: Wnt signaling pathway | 14 | 0.35 | 1.03 | 0.462 | 0.66 | 1 | 132 | Tags = 43%, list = 26%, signal = 56% |
| 19 | ssc04340: Hedgehog signaling pathway | 3 | 0.55 | 1 | 0.479 | 0.671 | 1 | 114 | Tags = 67%, list = 22%, signal = 85% |
| 20 | ssc00982: Drug metabolism | 12 | 0.35 | 0.99 | 0.455 | 0.651 | 1 | 40 | Tags = 25%, list = 8%, signal = 26% |
| 21 | ssc04080: Neuroactive ligand-receptor interaction | 17 | 0.29 | 0.94 | 0.525 | 0.706 | 1 | 43 | tags = 29%, list = 8%, signal = 31% |
| 22 | ssc00830: Retinol metabolism | 7 | 0.39 | 0.94 | 0.524 | 0.682 | 1 | 16 | Tags = 29%, list = 3%, signal = 29% |
| 23 | ssc00565: Ether lipid metabolism | 4 | 0.43 | 0.84 | 0.686 | 0.811 | 1 | 295 | Tags = 100%, list = 58%, signal = 233% |
| 24 | ssc05222: Small cell lung cancer | 14 | 0.26 | 0.79 | 0.718 | 0.848 | 1 | 51 | Tags = 21%, list = 10%, signal = 23% |
| 25 | ssc00480: Glutathione metabolism | 6 | 0.34 | 0.78 | 0.746 | 0.832 | 1 | 339 | Tags = 100%, list = 66%, signal = 291% |
| 26 | ssc05310: Asthma | 11 | 0.27 | 0.77 | 0.741 | 0.806 | 1 | 139 | Tags = 73%, list = 27%, signal = 98% |
| 27 | ssc00563: Glycosylphosphatidylinositol (GPI)-anchor biosynthesis | 2 | 0.49 | 0.77 | 0.769 | 0.776 | 1 | 263 | Tags = 100%, list = 51%, signal = 204% |
| 28 | ssc00601: Glycosphingolipid biosynthesis | 4 | 0.33 | 0.68 | 0.846 | 0.857 | 1 | 164 | Tags = 75%, list = 32%, signal = 109% |
| Confirmation objects | Gene symbol | Primer sequence (5′→3′) | Amplicon length (bp) | Ta (°C) | GenBank No. |
|---|---|---|---|---|---|
| Reference gene | ACTB | TCTGGCACCACACCTTCT | 114 | 60 | DQ178122 |
| TGATCTGGGTCATCTTCTCAC | |||||
| TBP | GATGGACGTTCGGTTTAGG | 124 | 60 | DQ178129 | |
| AGCAGCACAGTACGAGCAA | |||||
| TOP2B | AACTGGATGATGCTAATGATGCT | 137 | 60 | AF222921 | |
| TGGAAAAACTCCGTATCTGTCTC | |||||
| Up gene | RETN | AGTGCGCTGGCATAGACTGG | 197 | 60 | NM_213783 |
| CATCCTCTTCTCAAGGTTTATTTCC | |||||
| ADAM17 | TTGAGGAAGGGGAAGCC | 158 | 56 | NM_001099926 | |
| ACGGAGCCCACGATGTT | |||||
| GPNMB | GAGACCCAGCCTTCCTT | 130 | 51.2 | NM_001098584 | |
| TTGCTTTCTATCGCTTTGTA | |||||
| CHRM1 | CGCTGGTCAAGGAGAAGAA | 185 | 56 | NM_214034 | |
| GCACATGGGGTTGATGGT | |||||
| ALDH2 | AAACTGCTCTGCGGTGGA | 181 | 56 | NM_001044611 | |
| CGTACTTGGAATTGTTGGCTC | |||||
| IL6 | GTCGAGGCTGTGCAGATTAG | 101 | 56 | NM_214399 | |
| GCATTTGTGGTGGGGTTAG | |||||
| Down gene | KLRK1 | TGATGTGATAAACCGTGGTG | 107 | 56 | NM_213813 |
| TGGATCGGGCAAGGAAA | |||||
| DUOX2 | CCCTTCTTCAACTCCCTG | 158 | 51.2 | NM_213999 | |
| CAAAAGTTCTCATAGTGGTGC | |||||
| OAS2 | GACACGGCTGAAGGTTT | 291 | 51.2 | NM_001031796 | |
| TGGCACGTCCCAAGACT | |||||
| KCNAB1 | AAGGGAGAAAACAGCAAAAC | 176 | 56 | NM_001105294 | |
| AACCTGAATGGCACCGA | |||||
© 2013 by the authors; licensee MDPI, Basel, Switzerland This article is an open access article distributed under the terms and conditions of the Creative Commons Attribution license (http://creativecommons.org/licenses/by/3.0/).
Share and Cite
Zuo, Z.; Cui, H.; Li, M.; Peng, X.; Zhu, L.; Zhang, M.; Ma, J.; Xu, Z.; Gan, M.; Deng, J.; et al. Transcriptional Profiling of Swine Lung Tissue after Experimental Infection with Actinobacillus pleuropneumoniae. Int. J. Mol. Sci. 2013, 14, 10626-10660. https://doi.org/10.3390/ijms140510626
Zuo Z, Cui H, Li M, Peng X, Zhu L, Zhang M, Ma J, Xu Z, Gan M, Deng J, et al. Transcriptional Profiling of Swine Lung Tissue after Experimental Infection with Actinobacillus pleuropneumoniae. International Journal of Molecular Sciences. 2013; 14(5):10626-10660. https://doi.org/10.3390/ijms140510626
Chicago/Turabian StyleZuo, Zhicai, Hengmin Cui, Mingzhou Li, Xi Peng, Ling Zhu, Ming Zhang, Jideng Ma, Zhiwen Xu, Meng Gan, Junliang Deng, and et al. 2013. "Transcriptional Profiling of Swine Lung Tissue after Experimental Infection with Actinobacillus pleuropneumoniae" International Journal of Molecular Sciences 14, no. 5: 10626-10660. https://doi.org/10.3390/ijms140510626