Article

Transcriptomic Analysis of Phenotypic Changes in Birch (Betula platyphylla) Autotetraploids

State Key Laboratory of Forest Genetics and Tree Breeding, Northeast Forestry University, 26 Hexing Road, Harbin 150040, China
*
Author to whom correspondence should be addressed.
Int. J. Mol. Sci. 2012, 13(10), 13012-13029; https://doi.org/10.3390/ijms131013012
Submission received: 19 August 2012 / Revised: 30 September 2012 / Accepted: 30 September 2012 / Published: 11 October 2012
(This article belongs to the Special Issue Advances in Molecular Plant Biology)

Abstract

:
Plant breeders have focused much attention on polyploid trees because of their importance to forestry. To evaluate the impact of intraspecies genome duplication on the transcriptome, a series of Betula platyphylla autotetraploids and diploids were generated from four full-sib families. The phenotypes and transcriptomes of these autotetraploid individuals were compared with those of diploid trees. Autotetraploids were generally superior in breast-height diameter, volume, leaf, fruit and stoma and were generally inferior in height compared to diploids. Transcriptome data revealed numerous changes in gene expression attributable to autotetraploidization, which resulted in the upregulation of 7052 unigenes and the downregulation of 3658 unigenes. Pathway analysis revealed that the biosynthesis and signal transduction of indoleacetate (IAA) and ethylene were altered after genome duplication, which may have contributed to phenotypic changes. These results shed light on variations in birch autotetraploidization and help identify important genes for the genetic engineering of birch trees.

1. Introduction

Polyploidization has played an important role in plant evolution. Many of the phenotypes commonly observed in polyploid derivatives of flowering plants can be grouped together into the “giga” category, which includes increased sizes of floral organs and fruits, larger leaves and often an overall fleshy appearance, making polyploids quite interesting to both agriculture and horticulture [13]. In forestry, a greater understanding of the formation and characterization of tree polyploidy has led to well-developed polyploid cultivars. Polyploids in Populus, Robinia, Broussonetia and Edgeworthia have been shown to exhibit such characteristics as greater yield, longer fibers and higher resistance compared to their diploid counterparts [410].
The members of the genus Betula form a particularly significant group of broad-leaved trees in Eurasia and North America. Certain birch species, such as Betula platyphylla, Betula pendula, Betula pubescens and Betula papyrifera, are valuable sources of wood, and great importance is attached to breeding work aimed at their economic improvement [11]. A natural European birch (B. verrucosa) triploid, discovered by Löve, displayed “gigantism” in its morphological organs [12]. Since then, tree-breeding scientists have performed a great deal of work with polyploids in Betula [1320]. Pieninkeroinen reported that tetraploids in B. pendula and B. pubescens bear long fibers and vessels [17]. No other studies about artificial polyploid breeding in Betula have been reported, however, and polyploid cultivars in Betula have had not been employed in production. In 2004, 99 B. platyphylla autotetraploids were obtained using colchicine treatment. These autotetraploids exhibited phenotypic changes compared to diploids, but information concerning transcriptomic changes after genome duplication in Betula has been scant. In a previous study, researchers often obtained transcriptome profiles of polyploid plants using microarray analysis, which requires whole-genome data [2123]. Nevertheless, birch is an outbreeding species with a high degree of heterozygosity, the prohibitive costs associated with sequencing and assembling such a complex genome make it unfeasible to consider whole-genome sequencing in the near future. Fortunately, newly developed high-throughput sequencing technology, i.e., next generation sequencing (NGS), including sequencing employing the Roche/454 Genome Sequencer FLX, the ABI SOLiD System and the Illumina Genome Analyzer, is a powerful and cost-efficient tool for advanced research in many areas, especially de novo transcriptome sequencing for polyploid plants containing unknown genome information [24,25]. In the present study, we compared differences between transcriptomes of diploid and autotetraploid B. platyphylla plants using Illumina paired-end sequencing technology. By investigating changes in the expression of genes attributable to genome duplication, our study deepens our understanding of variations in birch autotetraploidization and identifies important genes for the genetic engineering of birch trees.

2. Results

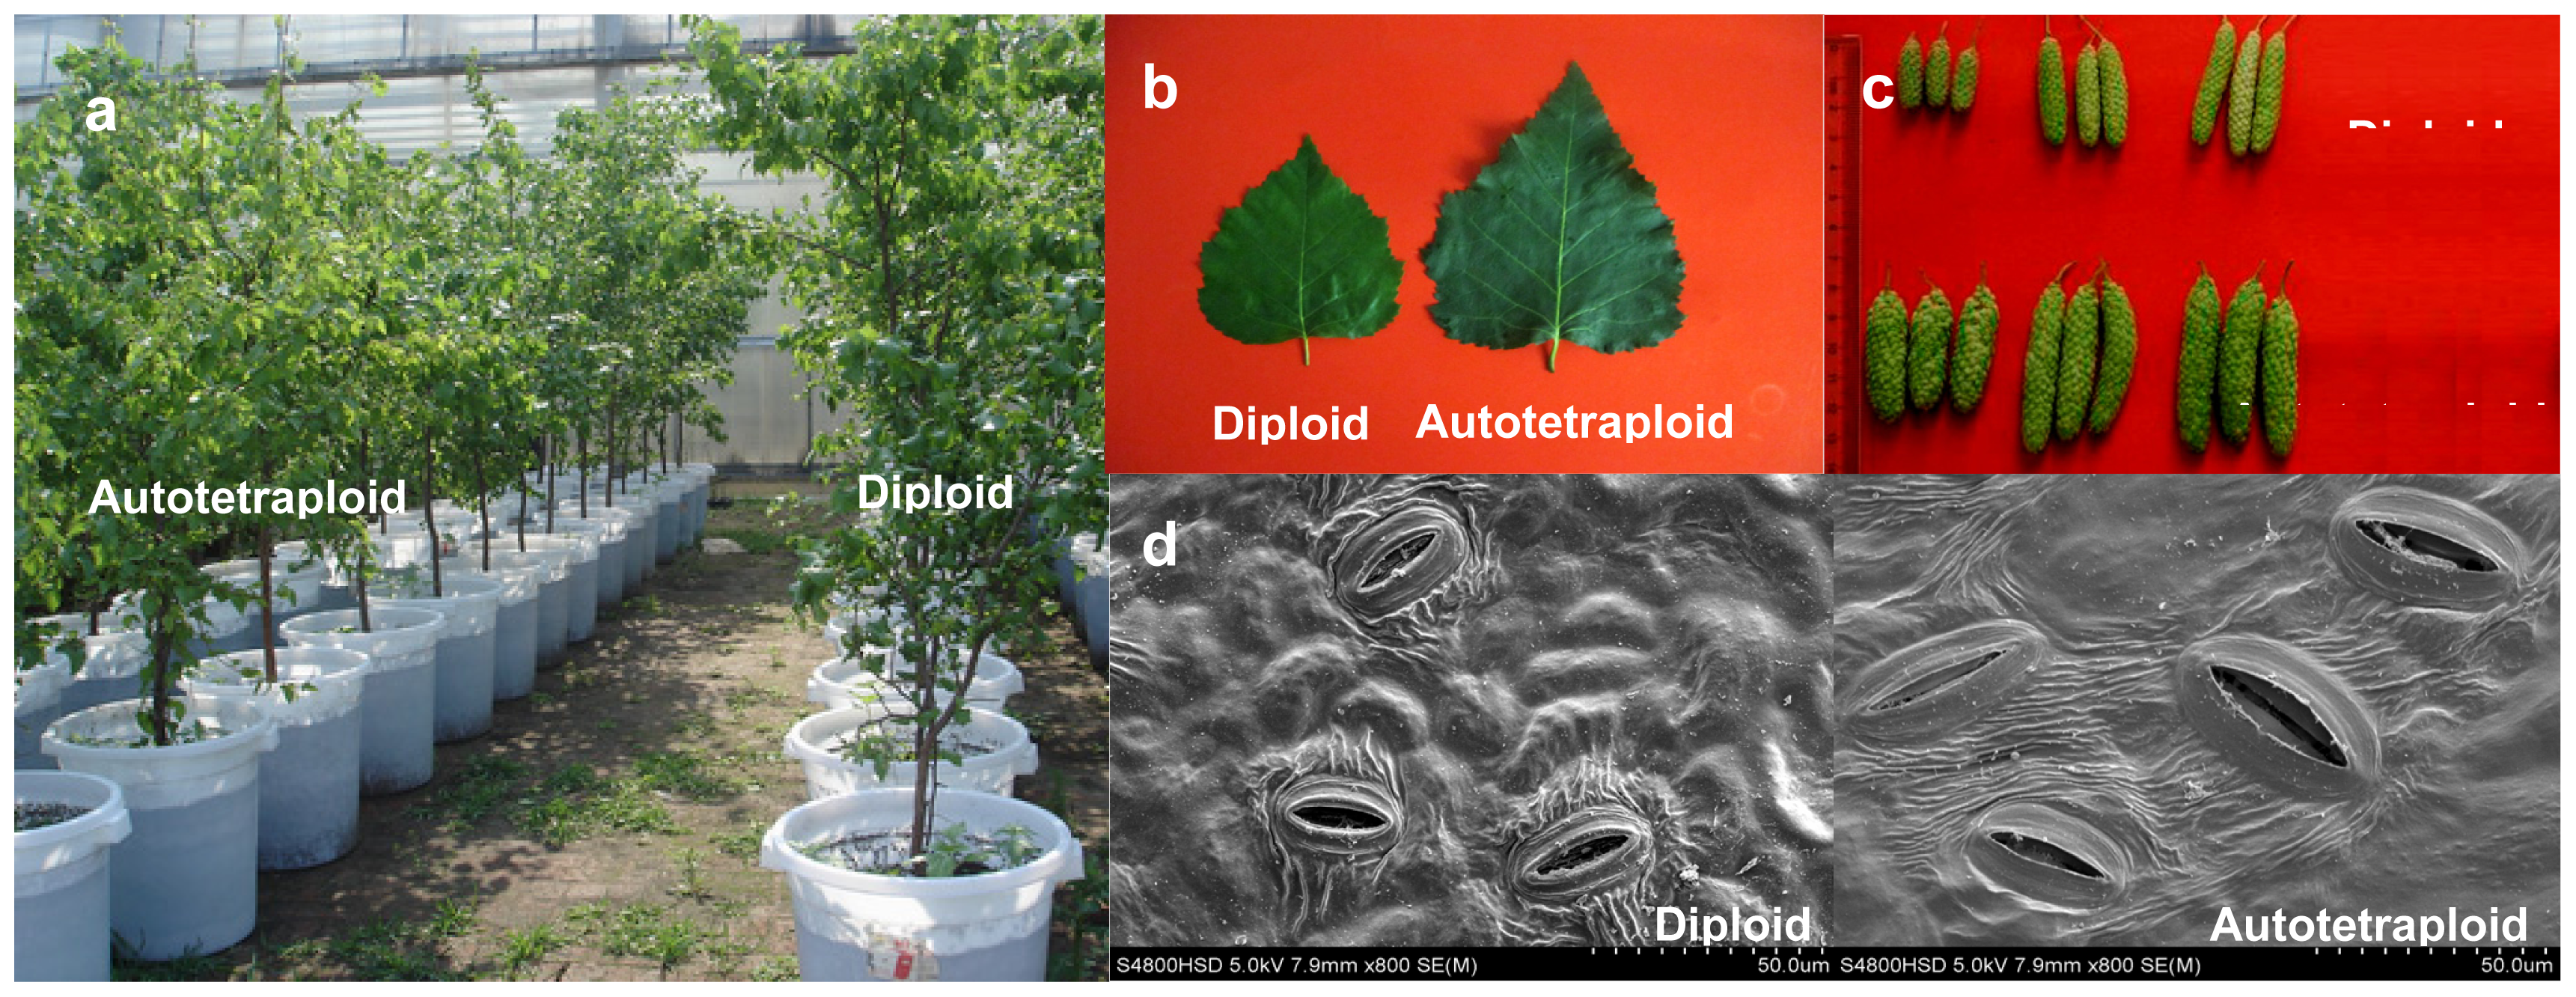
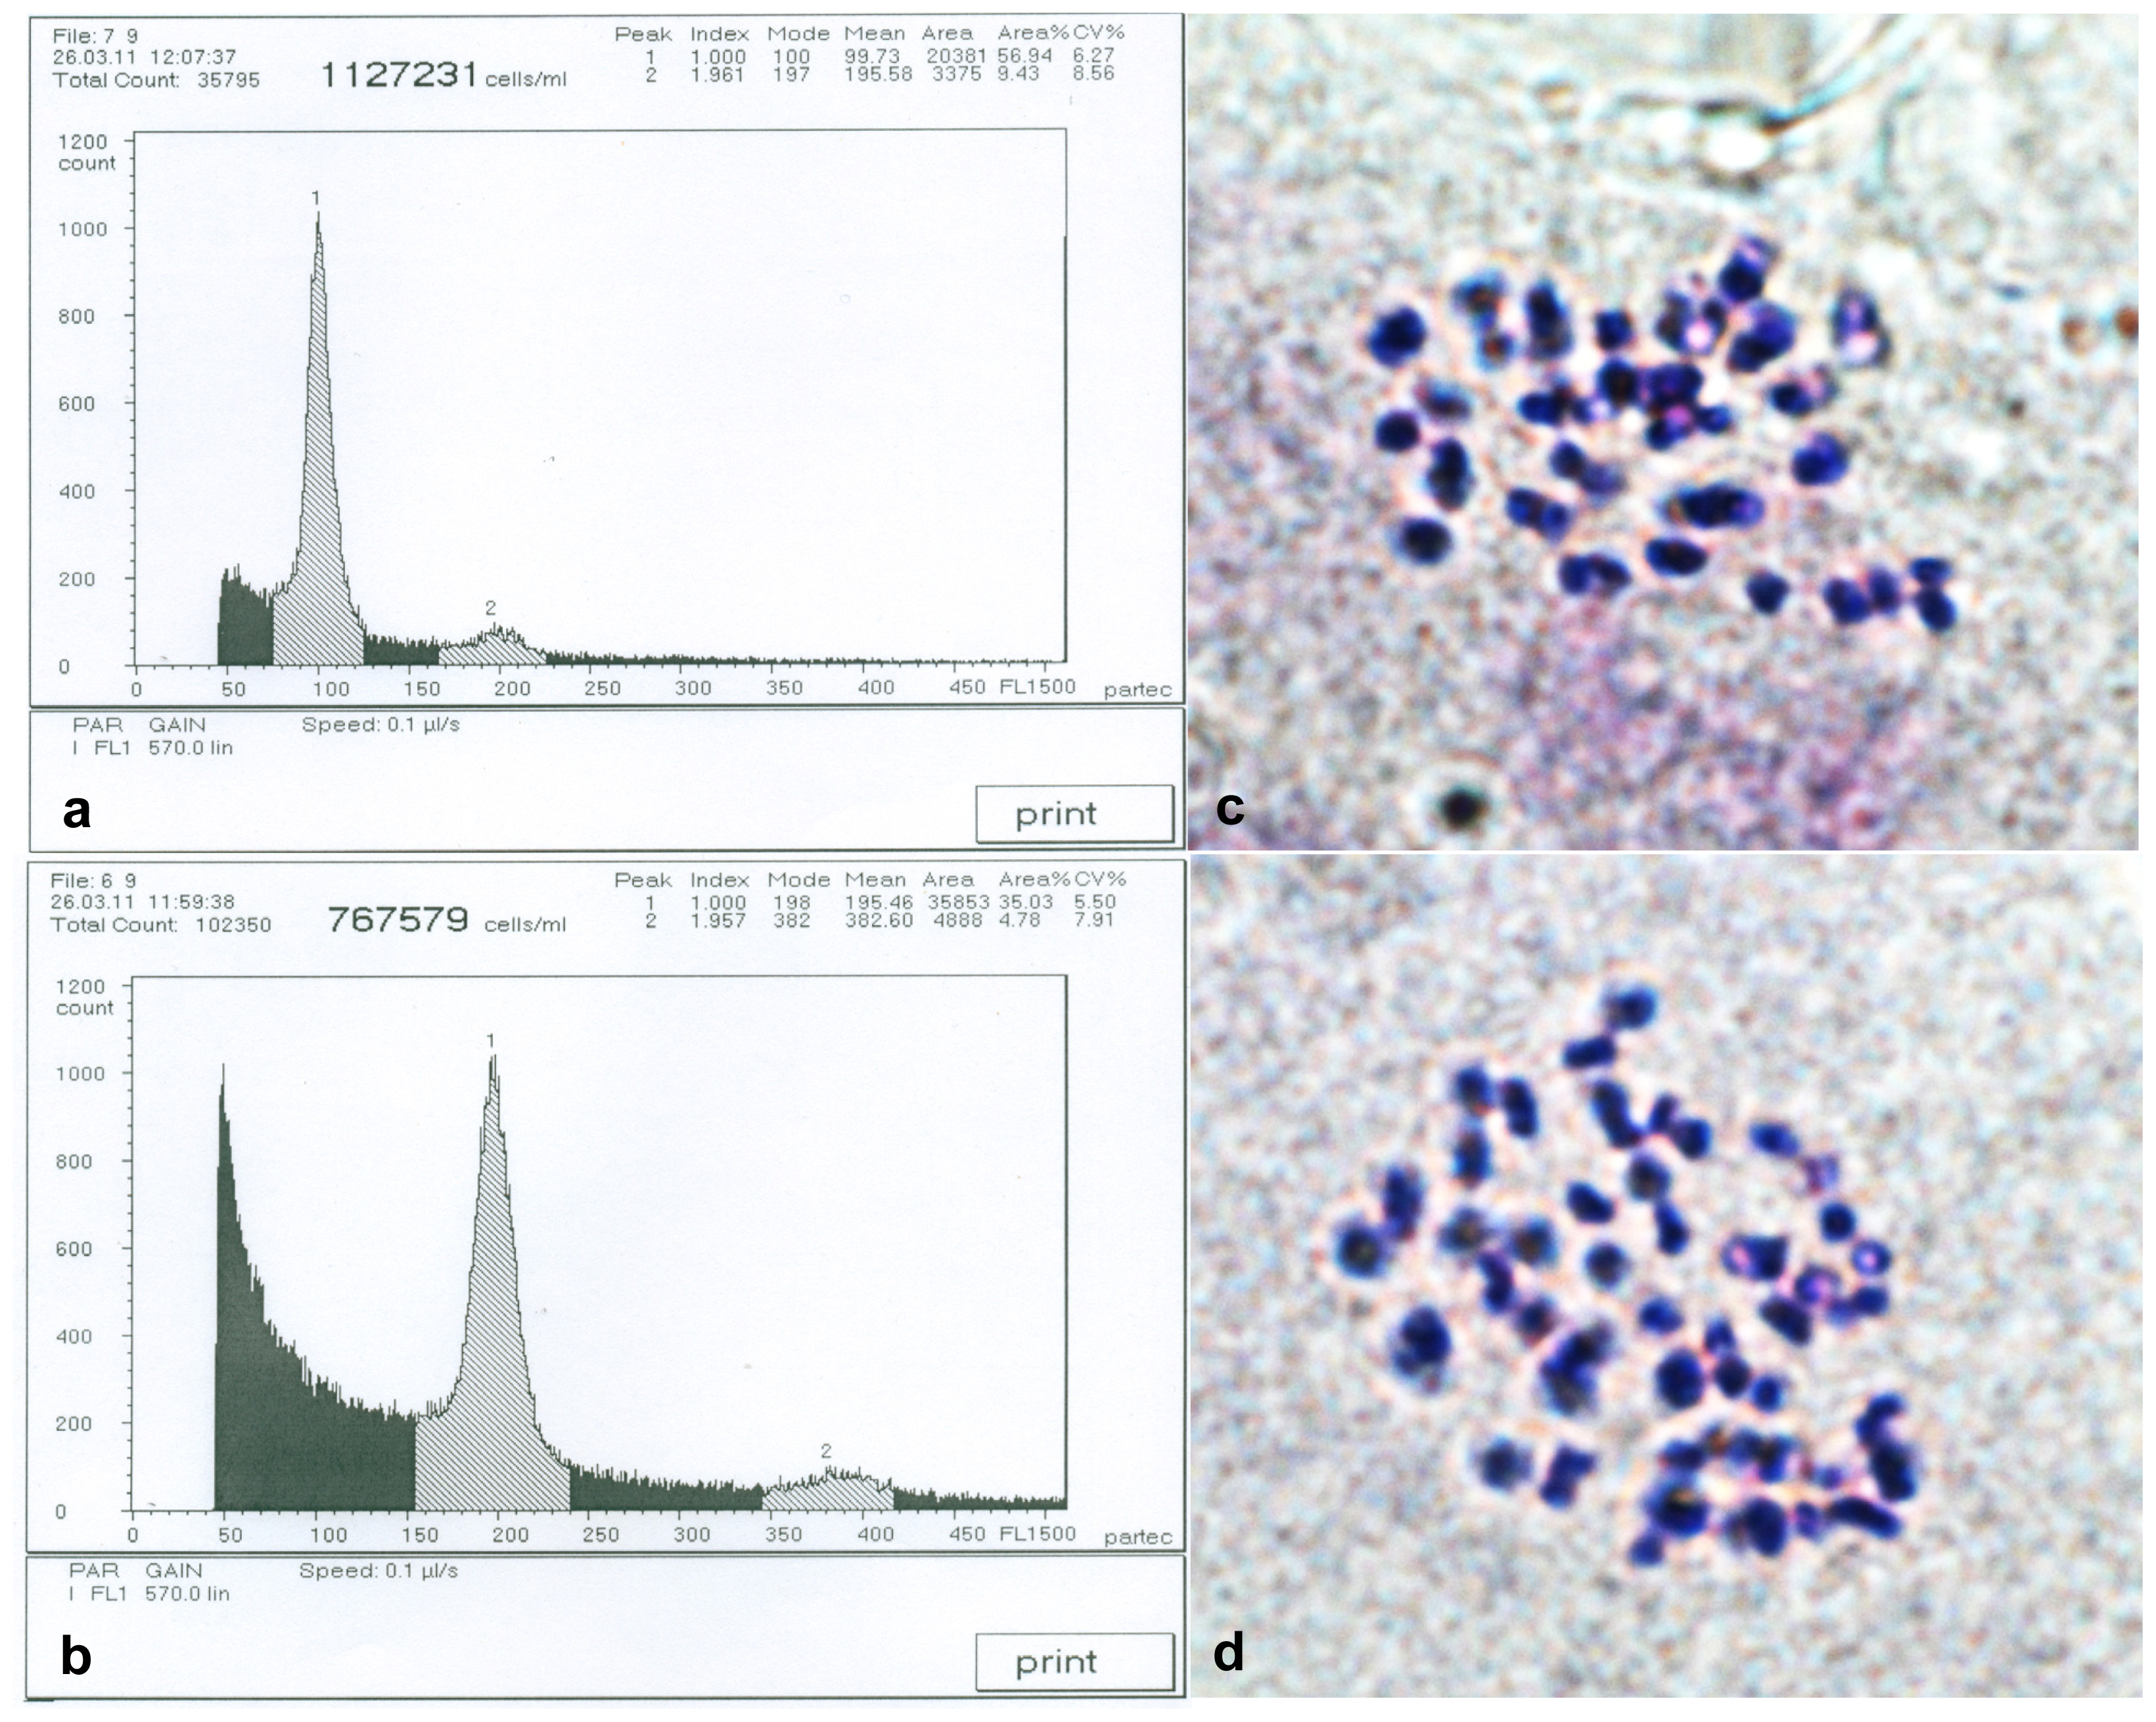
2.1. Detection of Birch Autotetraploids

Ploidy analysis of novel saplings and control diploid saplings was performed using flow cytometry analysis and chromosome counts. Results from flow cytometry analysis are shown in Figure 1a,b. Figure 1a represents the DNA content of the control diploids, with a main peak at channel 100. Consequently, the saplings with DNA content peaks only at channel 200 were defined as autotetraploids (Figure 1b). The numbers of autotetraploid in the 5 × 3, 5 × 9, 5 × 11 and 6 × 5 families were 31, 22, 23 and 23, respectively, and the total number of autotetraploids was 99.

2.2. Phenotypic Changes versus Ploidy in Birch

The phenotypes of autotetraploid trees differed significantly from diploids in four full-sib families (Figure 2 and Table 1). The breast-height diameter, volume, leaf, fruit and stoma of autotetraploid individuals were significantly larger than those observed in the diploids of each family. The mean breast-height diameter, volume, leaf area, fruit length, fruit diameter and stoma lengths of autotetraploids were 25.09%, 37.31%, 81.43%, 12.37%, 36.97% and 89.72% larger than those of the diploids, respectively. Nevertheless, the heights of the autotetraploid individuals were significantly lower than those observed for the diploids in each family. The mean height of the autotetraploids was only 5.58 m, which was 18.61% lower than that of diploids. The maximal height of the autotetraploid in four families was only 6.51 m, which was 4.96% lower than the mean height observed for the diploids. These results indicate that the vertical growth of the autotetraploids was inferior to that of diploids, but the increase in breast-height diameter and volume and the leaf, fruit and stoma sizes of autotetraploids were superior to those of diploids. Consequently, the autotetraploid trees were stouter, and the diploid trees were more slender.

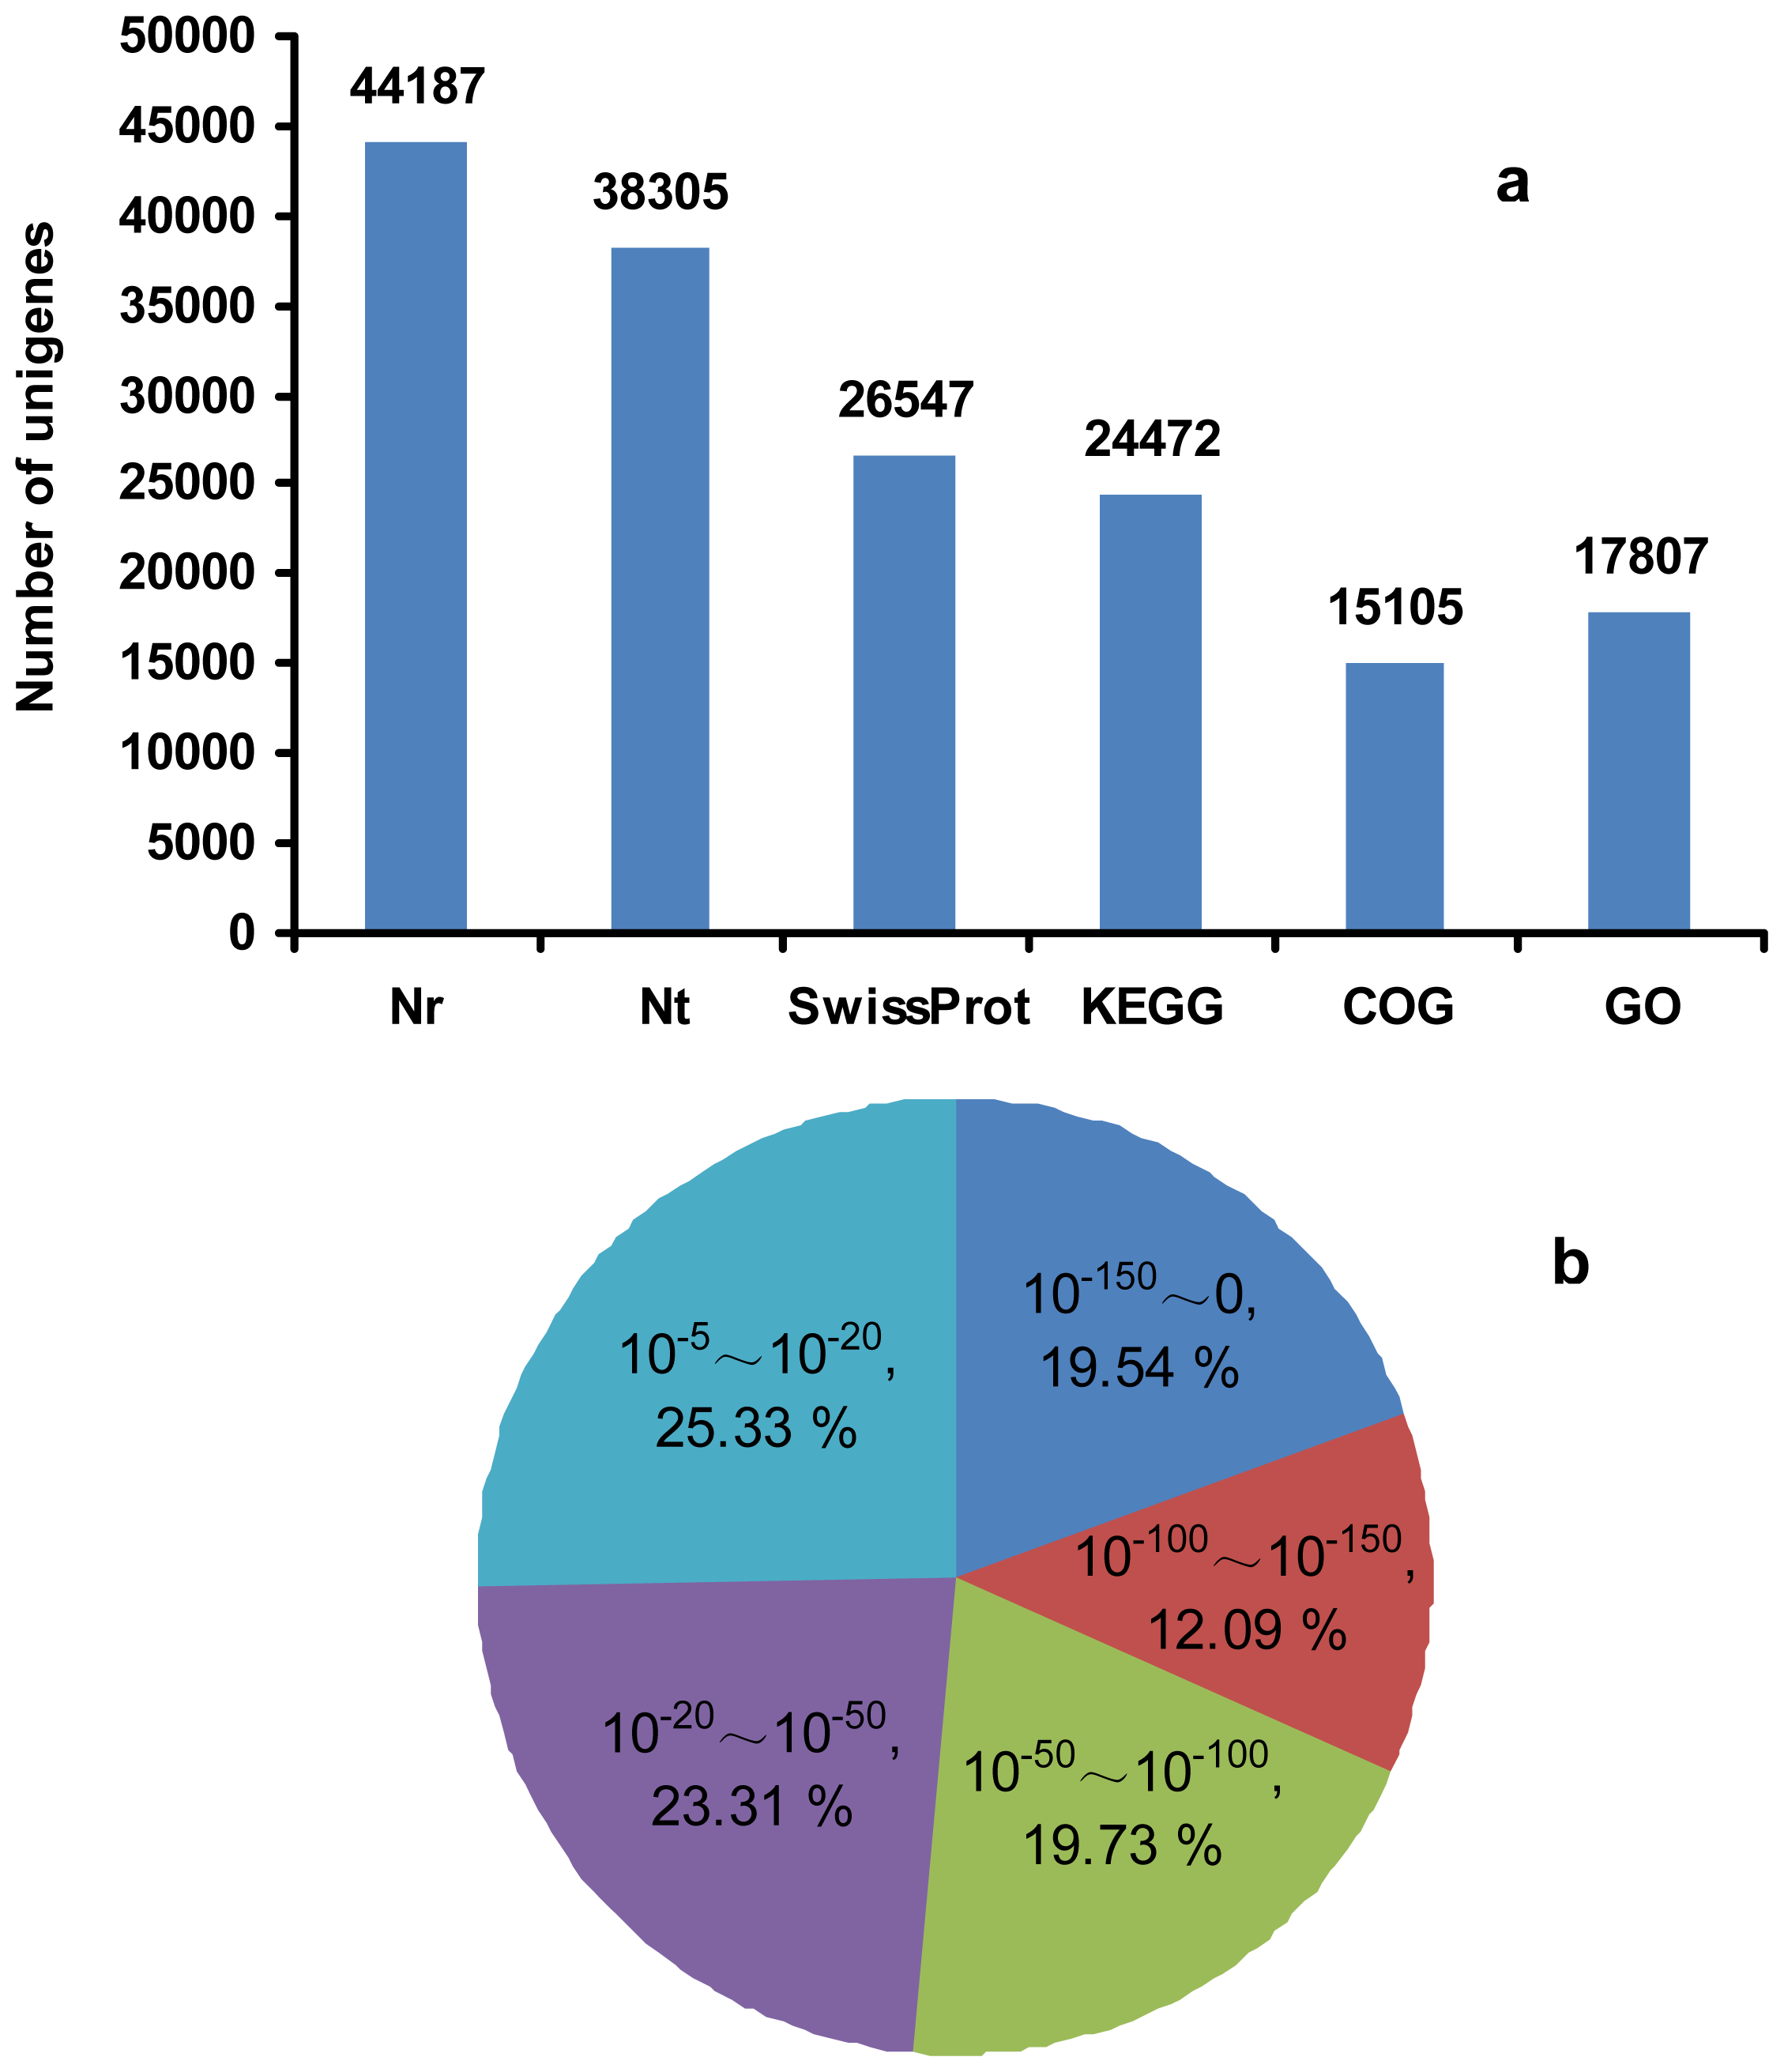
2.3. RNA-Seq, de Novo Assembly and Functional Annotation

The apical meristems in plant shoot tips contain a pool of pluripotent stem cells that can self-maintain and produce cells that can differentiate into different cell and tissue types [26], making this tissue a key target for the investigation of plant development and organ formation. Consequently, we constructed a transcriptome from the tender shoot tips of an individual autotetraploid tree and one from its diploid sister from the 6 × 5 family using Illumina paired-end sequencing technology. The transcriptomes of the diploid and autotetraploid produced 4,612,611,600 nt and 4,944,254,580 nt raw data, respectively, and the Q20 percentages were both over 96% (Table 2).
Short reads from two transcriptomic libraries were assembled into unigenes, taking the distance of pair-end reads into account. A library produced from the diploid contained 78,213 unigenes, while a library produced from the autotetraploid contained 88,607 unigenes. The mean lengths of the diploid and autotetraploid unigenes were 625 nt and 622 nt, respectively. All of the sequences were assembled, yielding 84,788 non-redundant unigenes with a mean length of 762 nt, and the N50 was 1294 nt (Table 3).
Approximately 56% of the unigenes (47,324) were annotated by Blastx and Blastn, with a threshold of 10−5, to six public databases (Nr, Nt, Swiss-Prot, KEGG, COG and GO). Among them, Unigenes 44,187, 38,305, 26,574, 24,472, 15,105 and 17,807 could be annotated to the Nr, Nt, Swiss-Prot, KEGG, COG and GO database, respectively (Figure 3a). Based on Nr annotation and E-value distribution, 74.67% of the mapped sequences showed strong homology (E-value ≤ 10−20), and 51.36% showed very strong homology (E-value ≤ 10−50) to available plant sequences (Figure 3b).

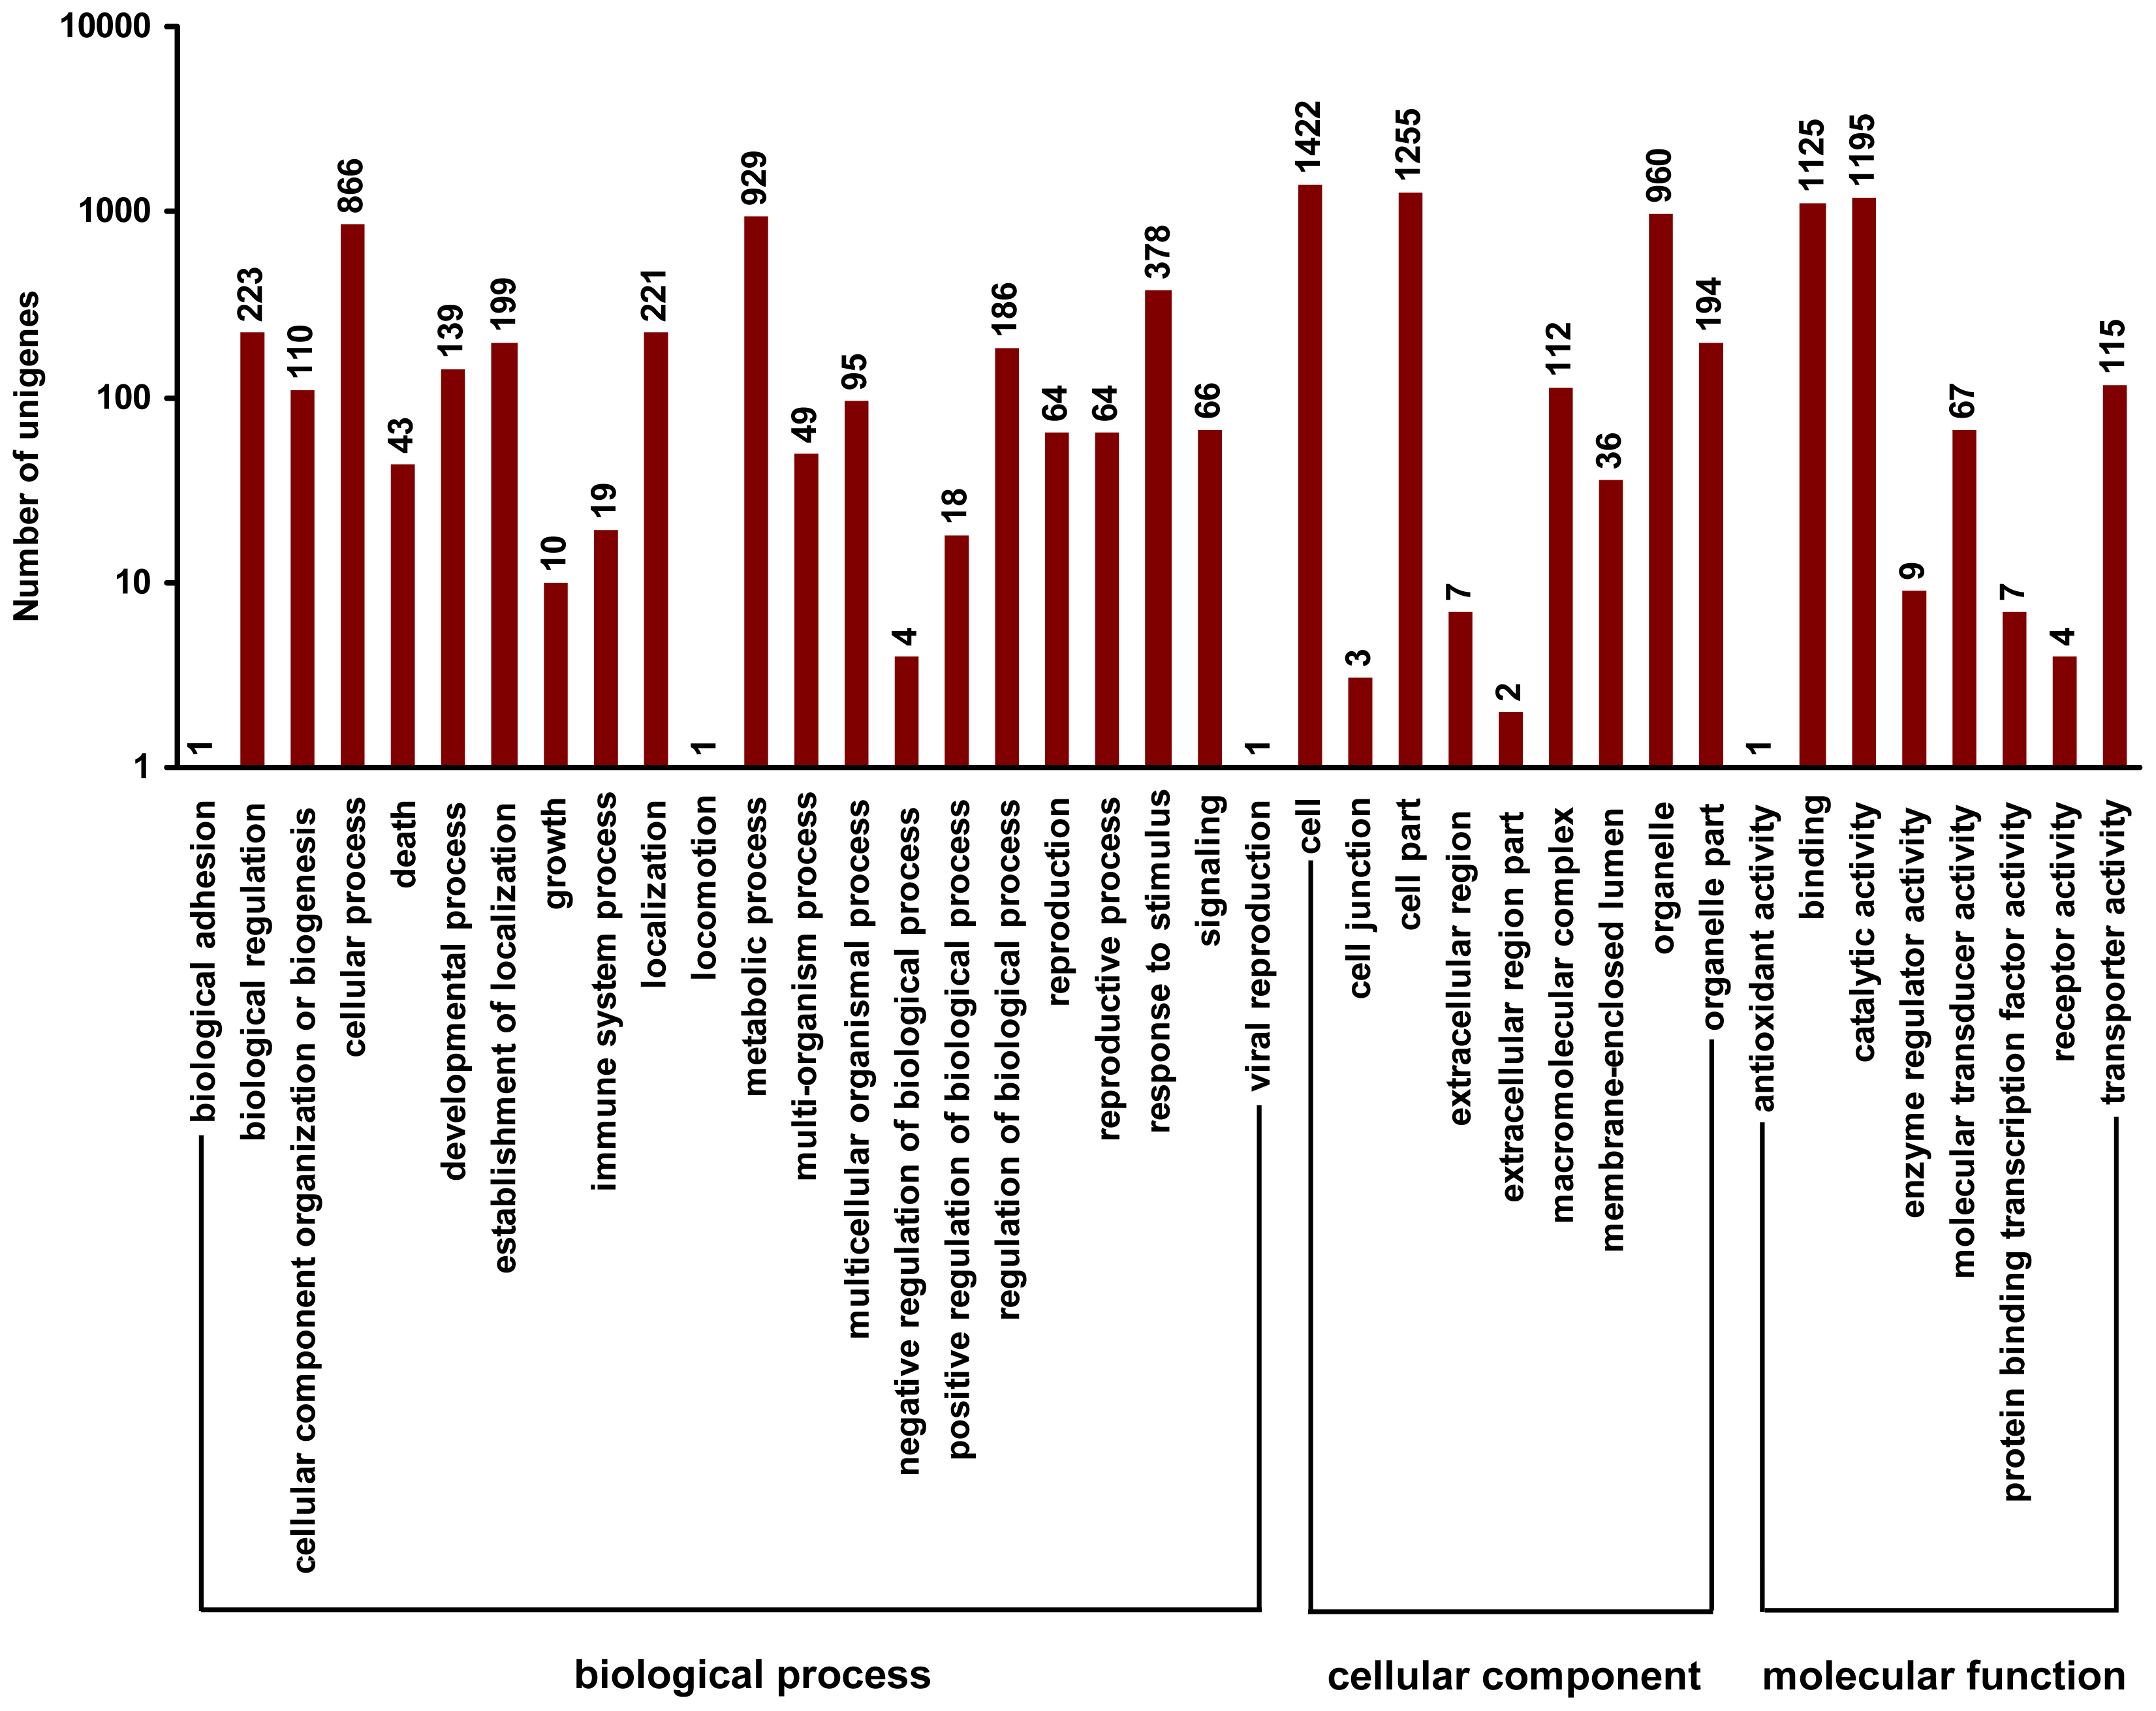
2.4. Gene Ontology Classfication of DEUs

The differentially expressed unigenes (DEUs) were selected based on expression profiles. A total of 7052 unigenes were found to have been upregulated in the autotetraploids compared to the diploids. Moreover, the expression of 3658 unigenes was downregulated in the autotetraploids (Figure 4).
Gene ontology analysis was performed by mapping each DEU to the GO database. In total, 2651 DEUs matched genes in Blast2GO were separated into gene ontology classes according to biological process, cellular component and molecular function (Figure 5). With regard to biological process, metabolic processes (929 unigenes, 35.04%) and cellular processes (866 unigenes, 32.67%) were prominently represented. For cellular component, cell (1422 unigenes, 53.64%), cell part (1255 unigenes, 47.34%) and organelle components (960 unigenes, 36.21%) represented the majorities of this category. Catalytic activity (1195 unigenes, 45.08%) and binding (1125 unigenes, 42.44%) represented a high percentage of the molecular function category. Moreover, cell death, the aminoglycan catabolic process, response to stimulus, the polysaccharide catabolic process and stress differed significantly (corrected p-value < 0.05) between autotetraploids and diploids.

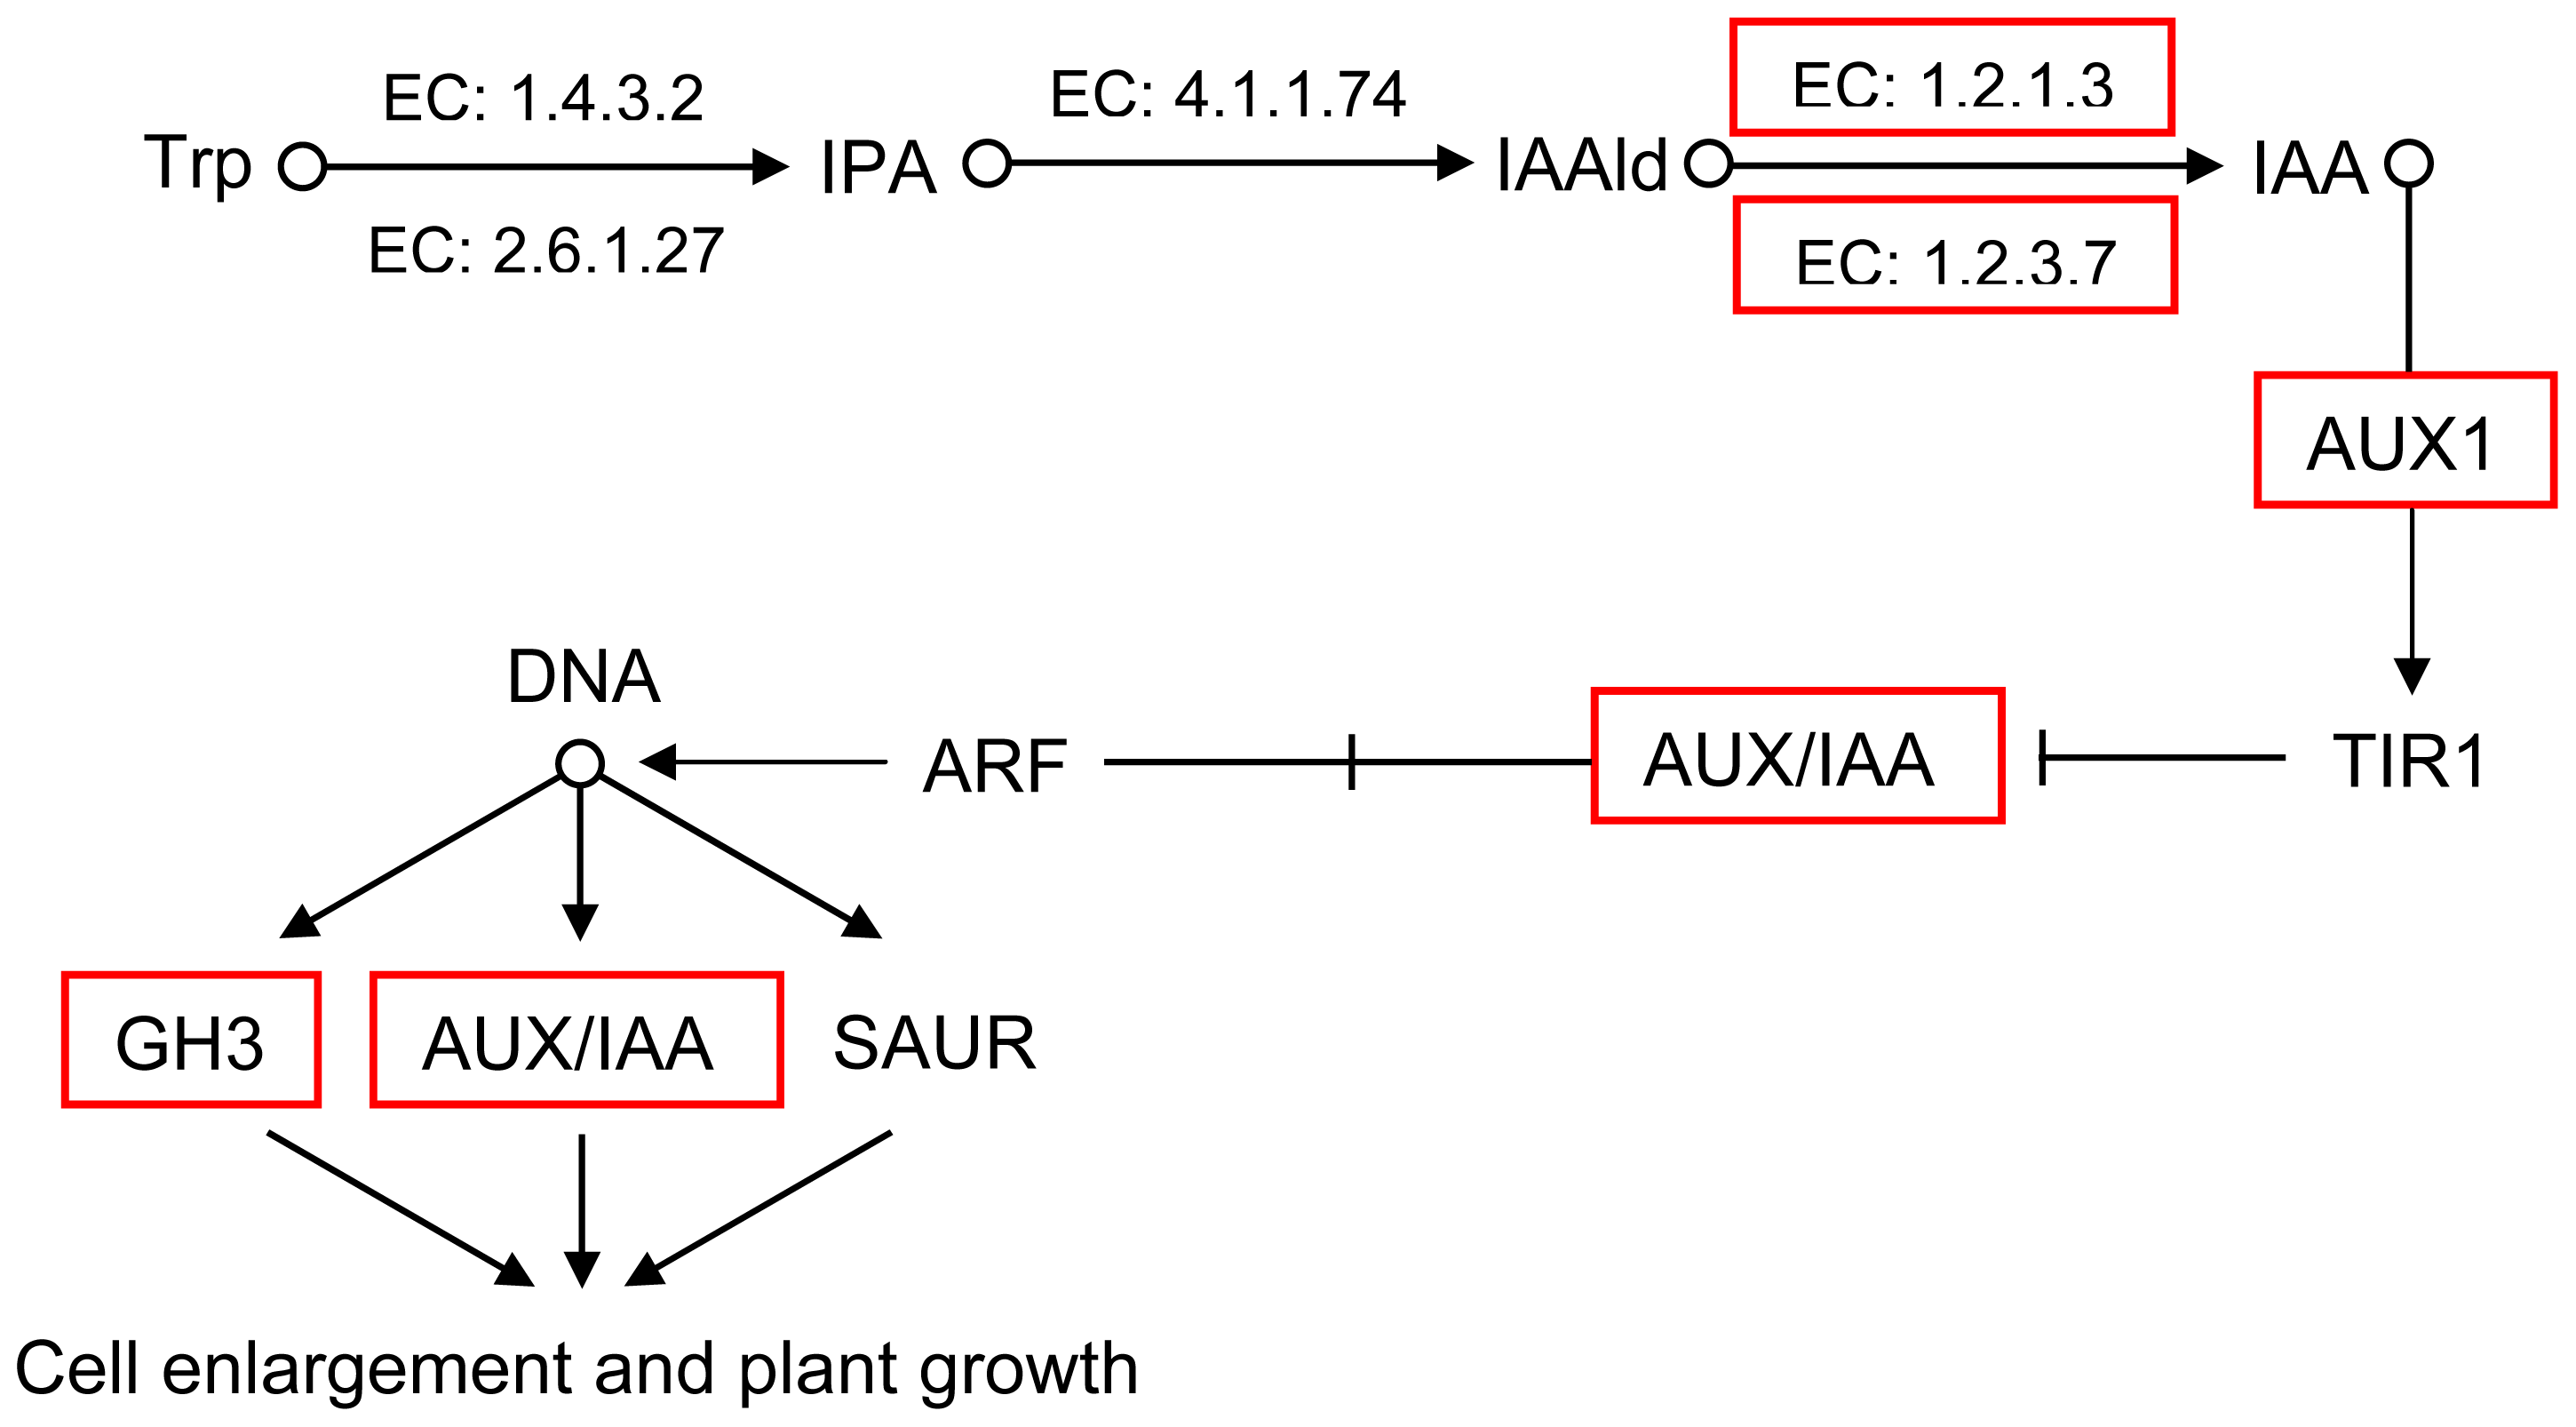
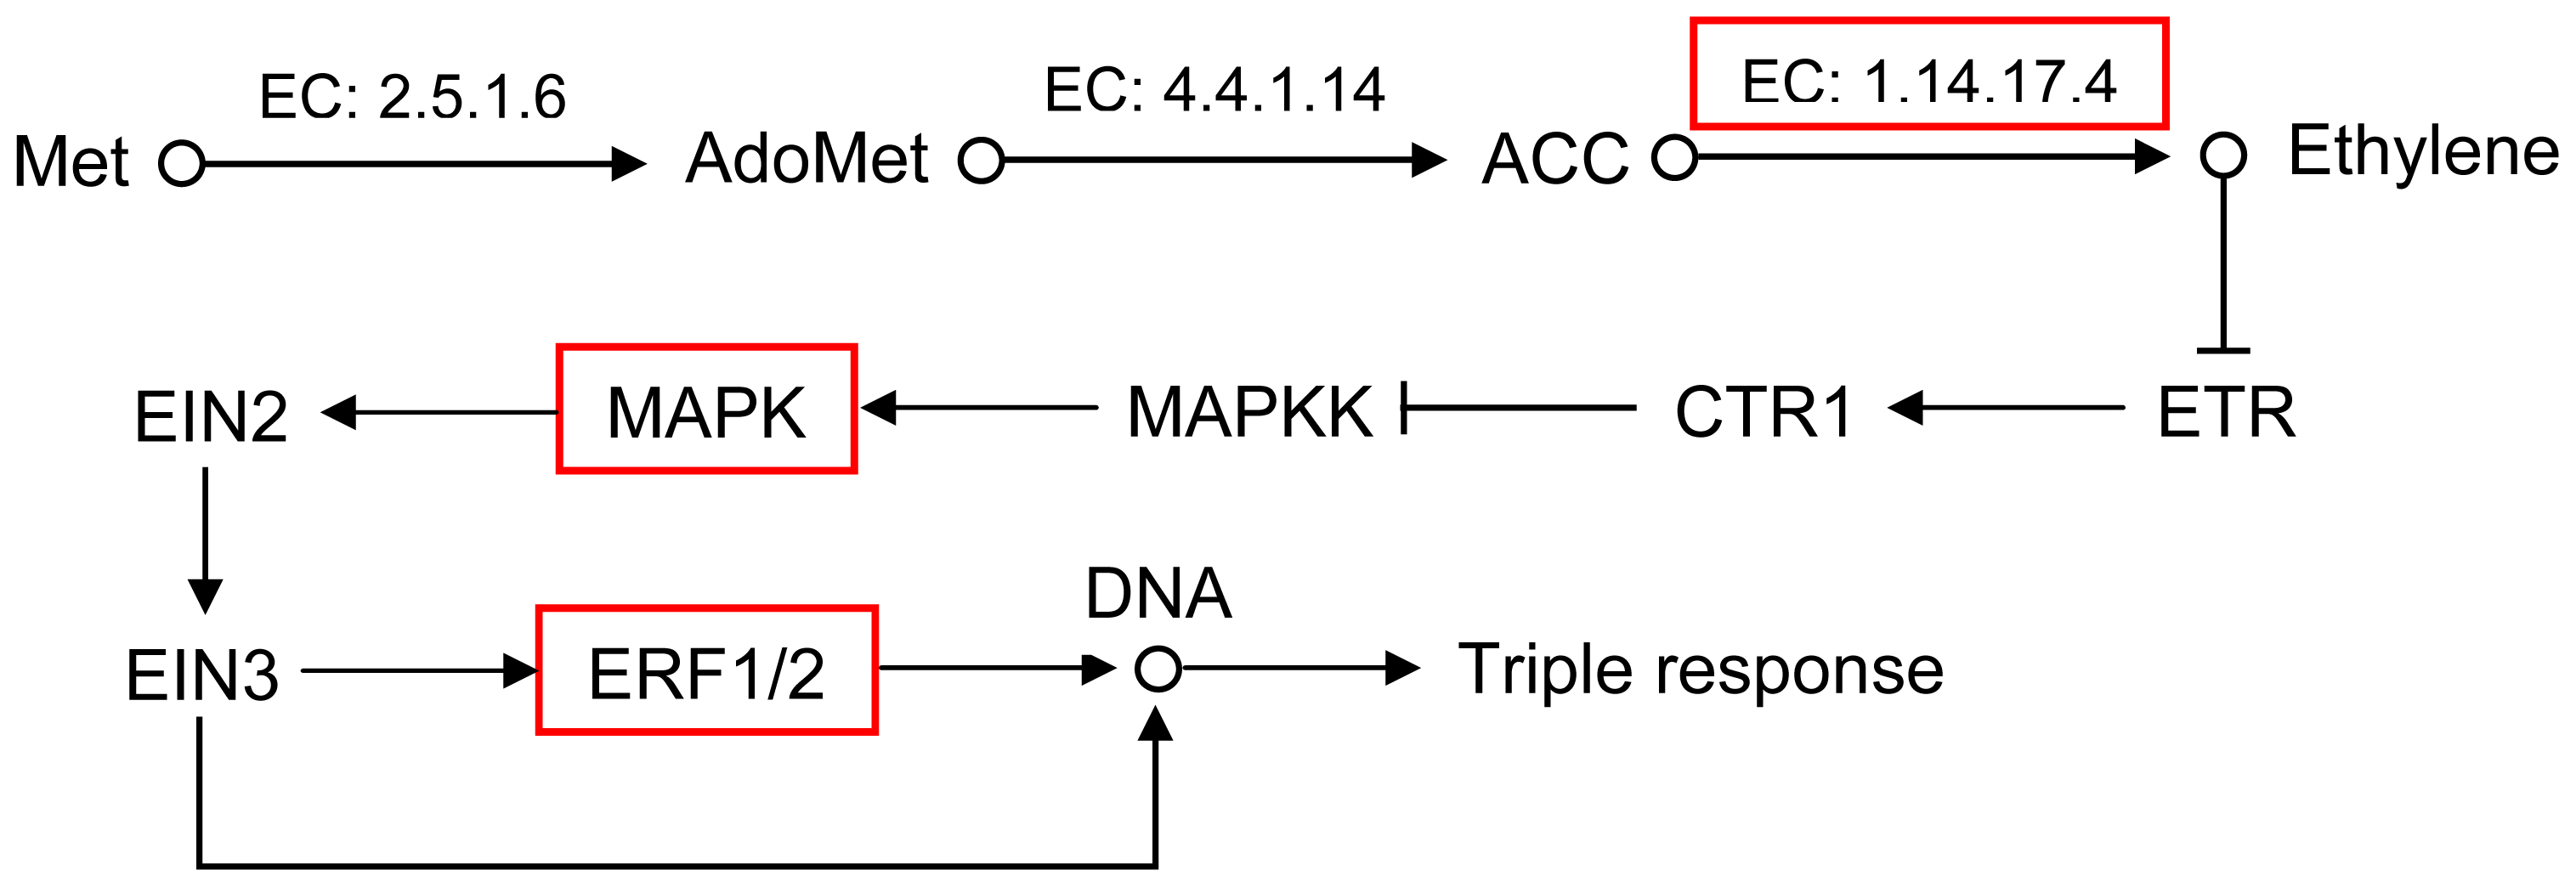
2.5. Pathway Analysis of DEUs

To further investigate biological behavior, KEGG pathway analysis was used to identify the biological pathways of DEUs. There were 3437 DEUs mapped into 122 KEGG pathways, some of which were consistent with biological processes already revealed by GO analyses. The pathway that differed most significantly between the autotetraploids and diploids was plant-pathogen interactions (Ko04626), followed by stilbenoid, diarylheptanoid and gingerol biosynthesis (Ko00945), limonene and pinene degradation (Ko00903), phenylpropanoid biosynthesis (Ko00940), amino sugar and nucleotide sugar metabolism (Ko00520), flavonoid biosynthesis (Ko00941), biosynthesis of secondary metabolites (Ko01110), plant hormone signal transduction (Ko04075) and phenylalanine metabolism (Ko00360).
The DEUs could be divided into two groups related to phenotype and transcriptome differences between the autotetraploids and diploids based on previous knowledge about plant growth. The first group of DEUs were involved in the biosynthesis and signal transduction of indoleacetate (IAA), including eleven genes involved in aldehyde dehydrogenase (EC: 1.2.1.3), indole-3-acetaldehyde oxidase (EC: 1.2.3.7), AUX1, AUX/IAA and GH3 (Figure 6 and Table 4). The second group were genes involved in the biosynthesis and signal transduction of ethylene, including six genes involved in aminocyclopropanecarboxylate oxidase (EC: 1.14.17.4), MAPK, ERF1 and ERF2 (Figure 7 and Table 5). All of these genes were upregulated in the autotetraploid.

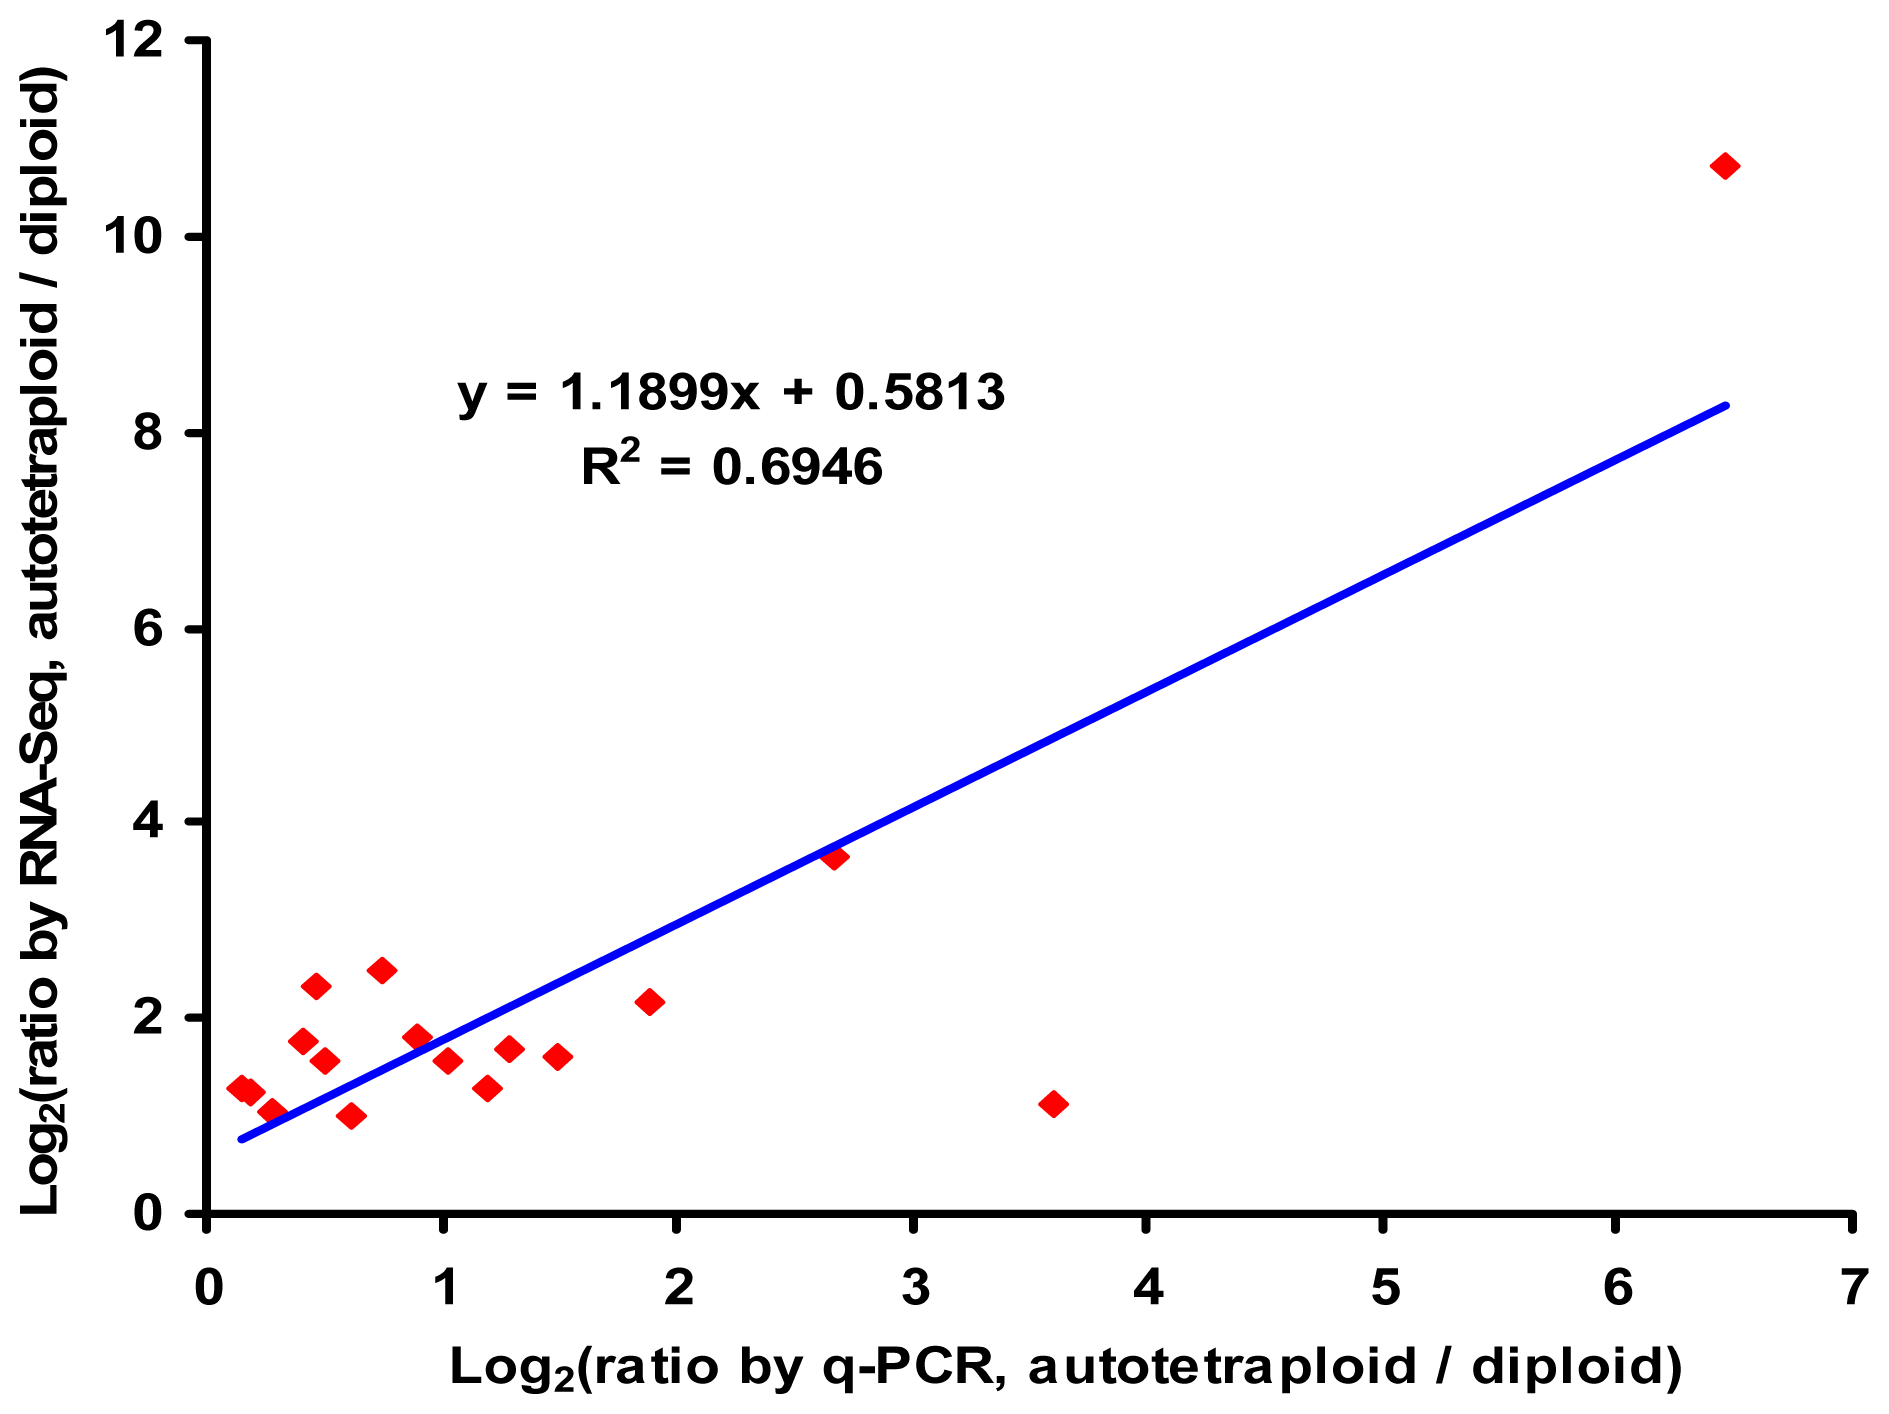
2.6. Verification of RNA-Seq by q-PCR

To test the reliability of RNA-Seq further, q-PCR was performed with specific primers for the 17 differentially expressed genes involved in the biosynthesis and signal transduction of IAA and ethylene.
Expression patterns revealed by q-PCR analysis were similar to those revealed by RNA-Seq for the same genes (Figure 8). In addition, a significantly positive correlation (r = 0.833; p < 0.01; n = 17) was found between RNA-Seq and q-PCR results from these genes.

3. Materials and Methods

3.1. Plant Material

The experiment was initiated in April 2004. Seeds from four full-sib families (5 × 3, 5 × 9, 5 × 11 and 6 × 5; all parent plants were located in an intensive seed orchard in Harbin, China) were soaked in 0.1% (w/v) colchicine for 48 h in the dark. A number of seeds from these four full-sib families were soaked in distilled water for the controls. The seeds were sown in a greenhouse after colchicine treatment, and a total of approximately 7000 saplings were obtained. In 2005, 128 novel saplings and 120 control diploid saplings (30 saplings chosen from each family at random) were transplanted into plastic pots in an intensive seed orchard.

3.2. Ploidy Measurement

The DNA contents of leaves of novel saplings were evaluated by flow cytometry (PA, Partec, Germany) using the methods of Zhang et al. [27]. Briefly, approximately 2 cm2 leaf material was chopped with a razor blade in a plastic petri dish containing 1.5 mL nuclei extraction buffer (10 mmol/L MgSO4·7H2O, 50 mmol/L KCl, 5 mmol/L HEPES, 1% (w/v) PVP-40, 0.25% (v/v) Triton X-100, pH 8.0). The homogenate was filtered through a 30 μm Partec Celltrics™ nylon filter to remove cell debris, and 1 mL staining solution (Partec) was added. The analysis was performed automatically. The total DNA content of each sample was measured, and the percentages of the cells that showed varied DNA content were processed using DPAC software. Meanwhile, the DNA content of diploid leaves was measured in the control group.
Mitotic chromosomes were isolated from young leaf buds using the protoplast dropping method of Anamthawat-Jónsson [28]. Briefly, buds were collected in ice water and treated for 24 h to arrest the cells at metaphase before fixing the buds in a mixture of three parts absolute ethanol to one part glacial acetic acid. The fixed buds were digested in an enzyme mixture of 2.5% (w/v) cellulase Onozuka R10 (Merck, Darmstadt, Germany) and 2.5% (v/v) pectinase (Sigma-Aldrich, St. Louis, MO, USA) for 5 h at room temperature. After hypotonic treatment with 75 mmol/L KCl for 5–10 min and repeated fixation to clear the cytoplasm, the protoplasts were placed onto microscope slides using a dropper. The chromosomes were stained with carmine and visualized under a microscope (Axioimanger A1, ZEISS, Germany) using 1000× magnification. Chromosomes were counted from 10 to 20 cells in metaphase from each individual tree.

3.3. Phenotype Measurement

Height, breast-height diameter, volume, leaf, fruit and stoma of diploid and autotetraploid trees were measured in 2009. The areas of mature leaves were measured using a portable area meter (LI-3100C, LI-COR, USA). At least ten healthy, undamaged and fully expanded leaves from the top of each individual tree were measured at random.
Stoma lengths were evaluated using a scanning electron microscope (S-4800, Hitachi, Japan). Briefly, approximately 1 cm2 from the center of each leaf was fixed in 2.5% (v/v) glutaral for 24 h and then transferred to 70% (v/v) ethanol for storage. Prior to evaluation, the material was dehydrated through a graded series of alcohol-isoamyl acetate, critical point dried in carbon dioxide for 15 min with a critical point dryer (HCP-2, Hitachi) and coated with gold palladium at 15 nm with an ion coater (EIKO IB-3, Hitachi). At least 30 stomata from each individual tree were viewed and measured at 15 kV using 800× magnification.
The lengths and diameters of the fruits were measured using a vernier caliper. At least ten healthy, undamaged fruits from each tree that had flowered were selected at random and measured. Height and breast-height diameter measurements were taken after the vegetation period ended. Individual tree volumes were calculated following the methods of Meng [29].

3.4. RNA Extraction, Library Construction and RNA-Seq

For transcriptomic analysis, a single autotetraploid tree and its diploid sister from the 6 × 5 family, both of which were healthy, had flowered and possessed erect stems, were chosen. In June 2011, shoot tips from diploid and autotetraploid trees were collected, immediately frozen in liquid nitrogen and stored at −80 °C until use. Total RNA from each sample was isolated using a modified CTAB method and digested with DNaseI (RNase free) to remove contaminating DNA. Enrichment of mRNA, fragment interruption, addition of adapters, size selection and PCR amplification and RNA-Seq were performed by staff at the Beijing Genome Institute (BGI) (Shenzhen, China). Total mRNA was isolated with oligo (dT) cellulose and broken into short fragments. Using these short fragments as templates, the first-strand cDNA and second-strand cDNA were synthesized. Sequencing adapters were ligated to short fragments after purification using a QiaQuick PCR extraction kit, which were used to distinguish different sequencing samples. Fragments that were 200 ± 25 bp in length were then separated by agarose gel electrophoresis and selected as sequencing templates for PCR amplification. Finally, the two transcriptomic libraries were sequenced using Illumina HiSeq™ 2000. The remaining RNA was used for real-time quantitative RT-PCR verification.

3.5. De Novo Assembly and Functional Annotation

The raw reads were first filtered by removing the adapter sequences and low quality sequences, which included reads with N percentages (i.e., the percentage of nucleotides in a read that could not be sequenced) of over 5% and sequences containing more than 20% nucleotides with a Q-value ≤ 10. The Q-value represents the sequencing quality of related nucleotides. Clean reads were used in de novo assembly and read-mapping to the transcriptome. RNA-Seq data was de novo assembled using the Trinity assembling program [30]. For each library, short reads were first assembled into longer but gapless contigs. Then the reads were mapped back to contigs, taking the distance of paired-end reads as frame. The contigs were connected to access the sequence that could not be extended on either end, and the sequence of the unigene was then produced. Next, unigenes from two libraries were further spliced and assembled to obtain maximum length nonredundant unigenes using TGICL clustering software [31] with a minimum overlap length of 100 bp. After clustering, the unigenes were divided to two classes: clusters, with the prefix CL and singletons, with the prefix Unigene. Finally, unigenes were aligned with the NCBI Nr, Swiss-Prot, KEGG and COG protein databases using Blastx with an E-value ≤ 10−5. The best results were used to further determine the sequence orientations of the unigenes. If results from different databases conflicted with each other, a priority order of Nr, Swiss-Prot, KEGG and COG was followed to determine the sequence orientation. When a unigene did not align with any of the above databases, ESTScan software [32] was used to predict the coding regions and orientation of the sequence. Blast2GO [33] was used to obtain GO annotation of the unigenes based on Blastx hits against the NCBI Nr database. Blastn was used to align the unigenes to the NCBI Nt nucleotide database, retrieving proteins with the highest sequence similarity with the given unigenes along with their protein functional annotations.

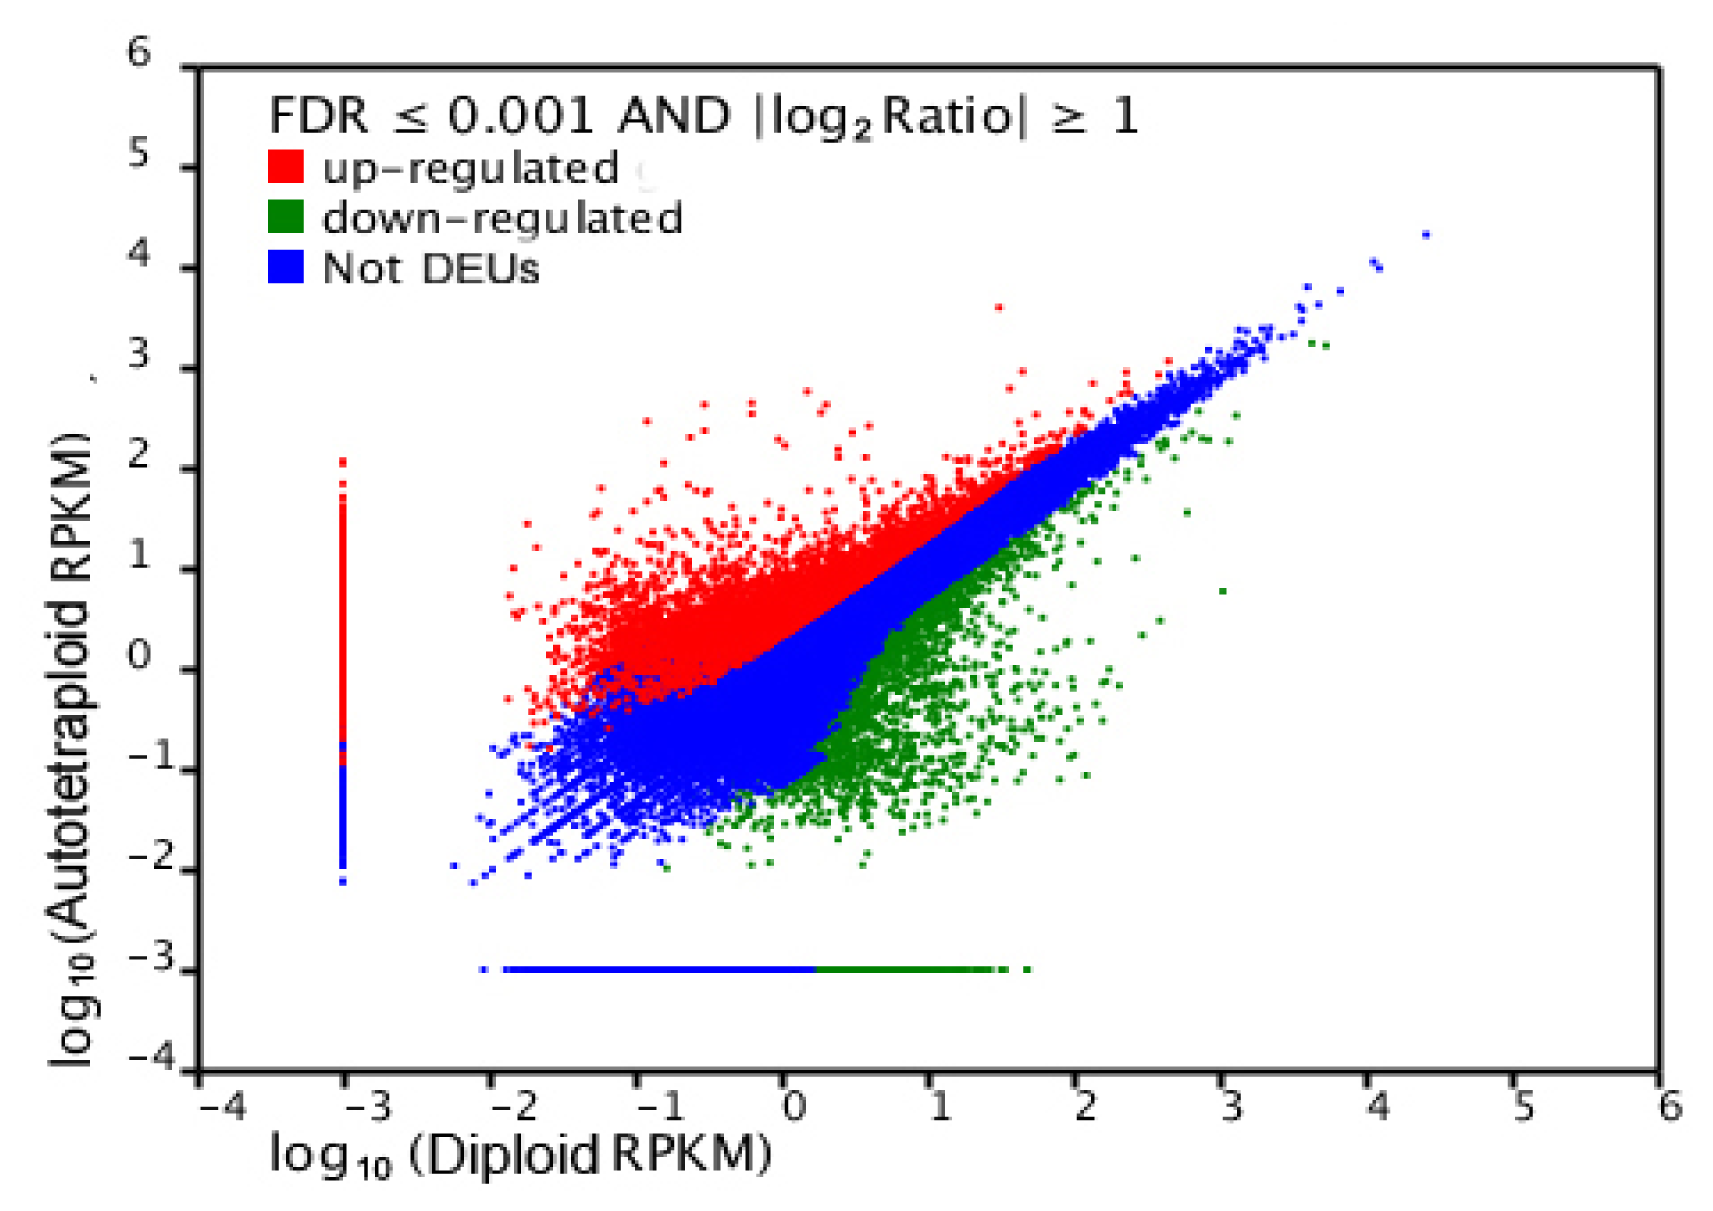
3.6. Differential Expression of Unigenes

An alignment package, SOAPaligner [34], was used to map reads back to the transcriptome. The number of mapped clean reads for each unigene was counted and normalized into an RPKM value (reads per kb per million reads), which is commonly used to calculate unigene expression [35]. The fold change for each transcript was then calculated using the log2 formula of autotetraploid RPKM/diploid RPKM. If the value of either autotetraploid RPKM or diploid RPKM was zero, 0.001, rather than 0, was used to calculate the fold change. The method of Audic et al. [36] was used to analyze differential gene expression. The formula used to calculate the probability of a specific gene being expressed equally between the two samples was as follows:
P ( y x ) = ( N 2 N 1 ) y ( x + y ) ! x ! y ! ( 1 + N 2 N 1 ) ( x + y + 1 )
where N1 and N2 indicate the total number of clean reads in a diploid and autotetraploid, respectively, and x and y indicate the mapped clean read counts of the transcript in each sample, respectively. The FDR (false discovery rate) method [37] was used to determine the threshold of p-values in multiple tests. In this study, FDR ≤ 0.001 and |log2ratio| ≥ 1 were the thresholds employed to judge the significance of differentiated gene expression.

3.7. Gene Ontology Functional Enrichment Analysis of Differentially Expressed Unigenes (DEUs)

The analysis mapped all DEUs to GO terms in the database to calculate the numbers of genes for every term. A hypergeometric test was then performed to find significantly enriched GO terms in DEUs compared to the transcriptome background. The formula used for this calculation was as follows:
P = 1 - i = 0 m - 1 ( M i ) ( N - M n - i ) ( N n )
where N is the number of all unigenes with GO annotation, n is the number of DEUs in N, M is the number of all unigenes annotated to the specific GO terms and m is the number of DEUs in M. The calculated p-value was subjected to Bonferroni Correction using the corrected p-value of 0.05 as the threshold. GO terms fulfilling this condition were defined as significantly enriched GO terms in DEUs. This analysis was able to recognize the main biological functions that DEUs exercised.

3.8. Pathway Analysis of DEUs

The Blastall program was used to annotate the pathways of DEUs against the KEGG database. The formula used to calculate p-value was similar with that used in the GO analysis. In this formula, N represents the total number of unigenes with KEGG annotation, n is the number of DEUs in N, M is the total number of unigenes annotated to specific pathways and m is the number of DEUs in M.

3.9. Real-Time Quantitative RT-PCR (q-PCR) Verification

The expression of candidate genes was confirmed by q-PCR. Primers for these genes were designed manually (Table 6). RNA extraction and DNase treatment were performed as described above, and the first-strand cDNA was synthesized using ReverTra qPCR RT Master Mix with gDNA Remover (Toyobo, Osaka, Japan) according to the manufacturer protocol. The cDNA was diluted tenfold and used as the template for q-PCR.
The q-PCR mixture comprised a 3 μL template of the RT reaction mixture, 10 μL of 2× SYBR Green Master Mix (Toyobo, Osaka, Japan) and 0.5 μL of forward and reverse primer (10 μmol/L) brought to a final volume of 20 μL with water. The reactions were performed in an MJ Opticon™−2 machine (Bio-Rad, Hercules, CA, USA) using the two-step method that was initiated for 30 s at 94 °C followed by 44 cycles of 94 °C for 12 s, 55 °C for 30 s, 72 °C for 30 s and 78.5 °C for 1 s for plate reading. A melting curve was performed from 55 °C to 95 °C to check the specificity of the amplified product. All experiments were conducted with three biological replicates for each sample. The expression was calculated by 2−ΔΔCt and normalized to values obtained from the 18S rRNA and α-tubulin controls.

4. Discussion

Polyploidization events occur frequently during plant evolution and most natural autopolyploids probably did not originate through “simple” genome doubling [38]. For the past few years, analyses of whole-genome sequences, extensive expressed sequence tag (EST) sets and duplicated genomic regions have led to the realization that genome doubling has occurred repeatedly during plant evolution [39]. Variations in plant morphology and physiology resulting from genome duplication have occurred in many plants, which led to the production of fast-growing, high-quality plants due to changes in genes expression that were shown to have occurred [3]. In the present study, we analyzed transcriptomic variation associated with birch (B. platyphylla) autotetraploidization that resulted in the differential expression of 10,710 unigenes, some of which are involved in cell death, metabolic processes, plant responses to stimulus and plant hormone signal transduction. These results indicate that phenotypic changes may bear some relation to transcriptomic alteration after genome duplication.
According to transcriptomic analysis, eleven genes were upregulated in the biosynthesis and signal transduction of IAA, including genes involved in aldehyde dehydrogenase, indole-3-acetaldehyde oxidase, AUX1, AUX/IAA and GH3. It has been known for decades that the plant hormone IAA plays a critical role in regulating plant growth and cell enlargement [40]. Although several pathways have been proposed, the indole-3-pyruvic acid (IPA) pathway is the main IAA biosynthetic pathway [41], and IAA is biosynthesized from indole-3-acetaldehyde (IAAld), which is catalyzed by aldehyde dehydrogenase and indole-3-acetaldehyde oxidase [42,43]. During transport, IAA can enter a cell by diffusion or by carrier-mediated uptake and leave a cell through the action of efflux carriers; AUX1 is a major influx carrier [44]. As two related families of proteins, Aux/IAA and ARF are key regulators of IAA-modulated gene expression (AUX/IAA, GH3 and SAUR), and AUX/IAA, GH3 and SAUR play a critical role in regulating plant growth and cell enlargement [40,45]. In the present study, eleven upregulated genes were involved not only in IAA biosynthesis but also in signal transduction. This result provides an explanation for the “gigantism” of breast-height diameter, volume, leaves, fruit and stoma found in autotetraploid trees.
In the present study, it was also shown that the mean breast-height diameter of autotetraploids was 25.09% larger than that of diploids, whereas the mean height of autotetraploids was 18.61% lower than that of diploids. Furthermore, six genes involved in the biosynthesis and signal transduction of ethylene were shown to be upregulated in autotetraploids, including genes involved in the aminocyclopropanecarboxylate oxidase, MAPK, ERF1 and ERF2. Ethylene is a gaseous plant hormone with an effect on seedlings known as the triple response. In the model plant species Arabidopsis thaliana, the triple response is characterized by the inhibition of hypocotyl and root elongation, a thickened hypocotyl and an exaggerated apical hook [46]. Ethylene is biosynthesized from 1-aminocyclopropane-1-carboxylate (ACC), which is catalyzed by aminocyclopropanecarboxylate oxidase [47]. MAPK participates in ethylene signal transduction [48]. The transcription factors ERF1 and ERF2 activate the additional downstream ethylene-responsive genes by binding to the GCC-box [49,50]. The six upregulated genes involved in aminocyclopropanecarboxylate oxidase, including MAPK, ERF1 and ERF2, may be related to the stoutness of autotetraploid trees.
Previous research showed that polyploid birch has a higher resistance to biotic and abiotic stress than diploid birch. Triploid birch (B. verrucosa× B. pubescens) was more resistant to birch rust (Melampsoridium betulinum) [14]. Pentaploid and hexaploid birch (B. papyrifera) were more tolerant of water deficit than their diploid relatives [20]. This study revealed that responses to stimulus, responses to stress and plant-pathogen interactions differed significantly between autotetraploids and diploids. Therefore, autotetraploid birch (B. platyphylla) may have a higher resistance to stress than diploid birch. Consequently, this should be investigated in the future.
Polyploid plants contain new gene regulatory networks after genome duplication, leading to phenotypic and physiological changes [3,39,51]. Complete RNA-Seq data are essential to understanding the new regulatory networks [52]. RNA-Seq analysis of different autotetraploid birch organs and plants in different stages of development should be performed to obtain a deeper understanding of molecular variation after genome duplication.

Acknowledgments

This work was financially supported by a grant from the National Science & Technology Pillar Program of China (2012BAD01B05).

References

  1. Dwivedi, N.K.; Suryanarayana, N.; Sikdar, A.K.; Susheelamma, B.N.; Jolly, M.S. Cytomorphological studies in triploid mulberry evolved by diploidization of female gamete cells. Cytologia 1989, 54, 13–19. [Google Scholar]
  2. Gmitter, F.G.; Ling, X.; Deng, X. Induction of triploid Citrus plants from endosperm calli in vitro. Theor. Appl. Genet 1990, 80, 785–790. [Google Scholar]
  3. Leitch, A.R.; Leitch, I.J. Genomic plasticity and the diversity of polyploid plants. Science 2008, 320, 481–483. [Google Scholar]
  4. Einspahr, D.W.; Buijtenen, J.P.; Peckham, J.R. Natural variation and heritability in triploid aspen. Silvae Genet 1963, 12, 51–58. [Google Scholar]
  5. Einspahr, D.W. Production and utilization of triploid hybrid aspen. Iowa State J. Res 1984, 58, 401–409. [Google Scholar]
  6. Zhu, Z.; Kang, X.; Zhang, Z. Advances in the triploid breeding program of Populus tomentosa in China. J. Beijing For. Univ 1997, 6, 1–8. [Google Scholar]
  7. Niwa, Y.; Sasaki, Y. Plant self-defense mechanisms against oxidative injury and protection of the forest by planting trees of triploids and tetraploids. Ecotox. Environ. Safe 2003, 55, 70–81. [Google Scholar]
  8. Zhang, Z.; Kang, X.; Zhang, P.; Li, Y.; Wang, J. Incidence and molecular markers of 2n pollen in Populus tomentosa Carr. Euphytica 2007, 154, 145–152. [Google Scholar]
  9. Zhang, Z.; Kang, X. Cytological characteristics of numerically unreduced pollen production in Populus tomentosa Carr. Euphytica 2010, 173, 151–159. [Google Scholar]
  10. Liu, L.; Huang, F.; Luo, Q.; Pang, H.; Meng, F. cDNA-AFLP analysis of the response of tetraploid black locust (Robinia pseudoacacia L.) to salt stress. Afr. J. Biotechnol 2012, 11, 3116–3124. [Google Scholar]
  11. Eriksson, G.; Jonsson, A. A review of the genetics of Betula. Scand. J. For. Res 1986, 1, 421–434. [Google Scholar]
  12. Löve, Á. A new triploid Betula verrucosa. Svensk bot. Tidskr 1944, 38, 381–393. [Google Scholar]
  13. Johnsson, H. Auto- and allotriploid Betula families derived from colchicine treatment. Z. Forstgentik 1956, 5, 65–70. [Google Scholar]
  14. Eifler, I. The individual results of crosses between B. verrucosa and B. pubescens. Silvae Genet 1960, 9, 159–165. [Google Scholar]
  15. Valanne, T. Colchicine effects and colchicine-induced polyploidy in Betula. Ann. Acad. Sci. Fenn. Ser. A4 1972, 191, 1–28. [Google Scholar]
  16. Särkilahti, E. Micropropagation of a mature colchicine-polyploid and irradiation-mutant of Betula pendula Roth. Tree Physiol 1988, 4, 173–179. [Google Scholar]
  17. Pieninkeroinen, K.; Valanne, T. Old colchicines-induced polyploidy materials of Betula pendula Roth and Betula pubescens Ehrh. Ann. Sci. For 1989, 46, 264–266. [Google Scholar]
  18. Cameron, A.D. Autotetraploid plants from callus cultures of Betula pendula Roth. Tree Physiol 1990, 6, 229–234. [Google Scholar]
  19. Särkilahti, E.; Valanne, T. Induced polyploidy in Betula. Silva Fenn 1990, 24, 227–234. [Google Scholar]
  20. Li, W.; Berlyn, G.P.; Ashton, P.M. Polyploids and their structural and physiological characteristics relative to water deficit in Betula papyrifer. Am. J. Bot 1996, 83, 15–20. [Google Scholar]
  21. Stupar, R.M.; Bhaskar, P.B.; Yandell, B.S.; Rensink, W.A.; Hart, A.L.; Ouyang, S.; Veilleux, R.E.; Busse, J.S.; Erhardt, R.J.; Buell, C.R.; et al. Phenotypic and transcriptomic changes associated with potato autopolyploidization. Genetics 2007, 176, 2055–2067. [Google Scholar]
  22. Riddle, N.C.; Jiang, H.; An, L.; Doerge, R.W.; Birchler, J.A. Gene expression analysis at the intersection of ploidy and hybridity in maize. Theor. Appl. Genet 2010, 120, 341–353. [Google Scholar]
  23. Yu, Z.; Habererb, G.; Matthesa, M.; Rattei, T.; Mayer, K.F.X.; Gierl, A.; Torres-Ruiz, R.A. Impact of natural genetic variation on the transcriptome of autotetraploid Arabidopsis thaliana. Proc. Natl. Acad. Sci. USA 2010, 107, 17809–17814. [Google Scholar]
  24. Wang, Z.; Fang, B.; Chen, J.; Zhang, X.; Luo, Z.; Huang, L.; Chen, X. De novo assembly and characterization of root transcriptome using Illumina paired-end sequencing and development of cSSR markers in sweetpotato (Ipomoea batatas). BMC Genomics 2010, 11. [Google Scholar] [CrossRef]
  25. Bajgain, P.; Richardson, B.A.; Price, J.C.; Cronn, R.C.; Udall, J.A. Transcriptome characterization and polymorphism detection between subspecies of big sagebrush (Artemisia tridentata). BMC Genomics 2011, 12. [Google Scholar] [CrossRef]
  26. Wong, C.E.; Prem, L.B.; Harald, O.; Mohan, B.S. Transcriptional profiling of the pea shoot apical meristem reveals processes underlying its function and maintenance. BMC Plant Biol 2008, 8. [Google Scholar] [CrossRef]
  27. Zhang, J.; Guo, W.; Deng, X. Relationship between ploidy variation of citrus calli and competence for somatic embryogenesis. Acta Genet. Sin 2006, 33, 647–654. [Google Scholar]
  28. Anamthawat-Jónsson, K. Preparation of chromosomes from plant leaf meristems for karyotype analysis and in situ hybridization. Methods Cell Sci 2003, 25, 91–95. [Google Scholar]
  29. Meng, X. Forest Measuration, 2nd ed; China Forestry Publishing House: Beijing, China, 2006; p. 32. [Google Scholar]
  30. Grabherr, M.G.; Haas, B.J.; Yassour, M.; Levin, J.Z.; Thompson, D.A.; Amit, I.; Adiconis, X.; Fan, L.; Raychowdhury, R.; Zeng, Q.; et al. Full-length transcriptome assembly from RNA-Seq data without a reference genome. Nat. Biotechnol 2011, 29, 644–652. [Google Scholar]
  31. Pertea, G.; Huang, X.; Liang, F.; Antonescu, V.; Sultana, R.; Karamycheva, S.; Lee, Y.; White, J.; Cheung, F.; Parvizi, B.; et al. TIGR gene indices clustering tools (TGICL): A software system for fast clustering of large EST datasets. Bioinformatics 2003, 19, 651–652. [Google Scholar]
  32. Iseli, C.; Jongeneel, C.V.; Bucher, P. ESTScan: A program for detecting, evaluating, and reconstructing potential coding regions in EST sequences. Proc. Int. Conf. Intell. Syst. Mol. Biol 1999, 99, 138–148. [Google Scholar]
  33. Conesa, A.; Götz, S.; García-Gómez, J.M.; Terol, J.; Talón, M.; Robles, M. Blast2GO: A universal tool for annotation, visualization and analysis in functional genomics research. Bioinformatics 2005, 21, 3674–3676. [Google Scholar]
  34. Li, R.; Yu, C.; Li, Y.; Lam, T.W.; Yiu, S.M.; Kiisttiansen, K.; Wang, J. SOAP2: An improved ultrafast tool for short read alignment. Bioinformatics 2009, 25, 1666–1667. [Google Scholar]
  35. Mortazavi, A.; Williams, B.A.; Kenneth, M.; Schaeffer, L.; Wold, B. Mapping and quantifying mammalian transcriptomes by RNA-Seq. Nat. Methods 2008, 5, 621–628. [Google Scholar]
  36. Audic, S.; Claverie, J.M. The significance of digital gene expression profiles. Genome Res 1997, 7, 986–995. [Google Scholar]
  37. Benjamini, Y.; Drai, D.; Elmer, G.; Kafkafi, N.; Golani, I. Controlling the false discovery rate in behavior genetics research. Behav. Brain Res 2001, 125, 279–284. [Google Scholar]
  38. Parisod, C.; Holderegger, R.; Brochmann, C. Evolutionary consequences of autopolyploidy. New Phytol 2010, 186, 5–17. [Google Scholar]
  39. Adams, K.L.; Wendel, J.F. Polyploidy and genome evolution in plants. Curr. Opin. Plant Biol 2005, 8, 135–141. [Google Scholar]
  40. Jain, M.; Kaur, N.; Tyagi, A.K.; Khurana, J.P. The auxin-responsive GH3 gene family in rice (Oryza sativa). Funct. Integr. Genomics 2006, 6, 36–46. [Google Scholar]
  41. Mashiguchi, K.; Tanaka, K.; Sakai, T.; Sugawara, S.; Kawaide, H.; Natsume, M.; Hanada, A.; Yaeno, T.; Shirasu, K.; Yao, H.; et al. The main auxin biosynthesis pathway in Arabidopsis. Proc. Natl. Acad. Sci. USA 2011, 108, 18512–18517. [Google Scholar]
  42. Mikkelsen, M.D.; Naur, P.; Halkier, B.A. Arabidopsis mutants in the C–S lyase of glucosinolate biosynthesis establish a critical role for indole-3-acetaldoxime in auxin homeostasis. Plant J 2004, 37, 770–777. [Google Scholar]
  43. Puyvelde, S.; Cloots, L.; Engelen, K.; Das, F.; Marchal, K.; Vanderleyden, J.; Spaepen, S. Transcriptome analysis of the rhizosphere bacterium Azospirillum brasilense reveals an extensive auxin response. Microb. Ecol 2011, 61, 723–728. [Google Scholar]
  44. Vandenbussche, F.; Petrášek, J.; Zádníková, P.; Hoyerová, K.; Pešek, B.; Raz, V.; Swarup, R.; Bennett, M.; Zažímalová, E.; Benková, E.; et al. The auxin influx carriers AUX1 and LAX3 are involved in auxin-ethylene interactions during apical hook development in Arabidopsis thaliana seedlings. Development 2010, 137, 597–606. [Google Scholar]
  45. Liscum, E.; Reed, J.W. Genetics of Aux/IAA and ARF action in plant growth and development. Plant Mol. Biol 2002, 49, 387–400. [Google Scholar]
  46. Bleecker, A.B.; Estelle, M.A.; Somerville, C.; Kende, H. Insensitivity to ethylene conferred by a dominant mutation in Arabidopsis thaliana. Science 1988, 241, 1086–1089. [Google Scholar]
  47. Yang, S.; Hoffman, N.E. Ethylene biosynthesis and its regulation in higher plants. Annu. Rev. Plant Physiol 1984, 35, 155–189. [Google Scholar]
  48. Ouaked, F.; Rozhon, W.; Lecourieux, D.; Hirt, H. A MAPK pathway mediates ethylene signaling in plants. EMBO J 2003, 22, 1282–1288. [Google Scholar]
  49. Chen, Y.; Etheridge, N.; Schaller, G.E. Ethylene signal transduction. Ann. Bot-Lond 2005, 95, 901–915. [Google Scholar]
  50. Nakano, T.; Nishiuchi, T.; Suzuki, K.; Fujimura, T.; Shinshi, H. Studies on transcriptional regulation of endogenous genes by ERF2 transcription factor in tobacco cells. Plant Cell Physiol 2006, 47, 554–558. [Google Scholar]
  51. Adams, K.L. Evolution of duplicate gene expression in polyploidy and hybrid plants. J. Hered 2007, 98, 136–141. [Google Scholar]
  52. Nie, J.; Stewart, R.; Zhang, H.; Thomson, J.A.; Ruan, F.; Cui, X.; Wei, H. TF-Cluster: A pipeline for identifying functionally coordinated transcription factors via network decomposition of the shared coexpression connectivity matrix (SCCM). BMC Syst. Biol 2011, 5. [Google Scholar] [CrossRef]
Figure 1. Ploidy analysis of birch saplings. (a) DNA content of diploids (the main peak at channel 100); (b) DNA content of autotetraploids (the main peak at channel 198). The main peaks represent mature cells and the secondary peaks represent meristematic cells; (c) Chromosome number of diploids (2n = 2x = 28); (d) Chromosome number of autotetraploids (2n = 4x = 56).
Ijms 13 13012f1
Figure 2. Phenotypic characterization of diploids and autotetraploids grown under the same conditions. (a) Diploid and autotetraploid saplings; (b) Leaves of diploids and autotetraploids; (c) Fruits of diploids and autotetraploids; (d) Stomata of diploids and autotetraploids.
Ijms 13 13012f2
Figure 3. Characteristics of homology-searched birch unigenes. (a) Number of unigenes annotated by Blastx and Blastn with an E-value threshold of 10−5 against the databases. The numbers above the columns indicate the number of unigenes annotated by the databases; (b) E-value distribution of the top Blastx hits against the Nr database for each unigene.
Ijms 13 13012f3
Figure 4. Comparison of unigene expression between autotetraploids and diploids. The differentially expressed unigenes (DEUs) are shown in red and green, while blue indicates unigenes that were not differentially expressed between autotetraploids and diploids.
Ijms 13 13012f4
Figure 5. Gene ontology classification of DEUs. The numbers above the columns indicate the numbers of DEUs in each category.
Ijms 13 13012f5
Figure 6. Biosynthesis (IPA pathway) and signal transduction of indoleacetate (IAA) in birch. Up-regulated expressed genes in autotetraploid are in red boxes.
Ijms 13 13012f6
Figure 7. Biosynthesis and signal transduction of ethylene in birch. Up-regulated expressed genes in autotetraploid are in red boxes.
Ijms 13 13012f7
Figure 8. Scatter plot showing similar expression patterns between RNA-Seq and q-PCR of 17 differentially expressed genes involved in the biosynthesis and signal transduction of IAA and ethylene.
Ijms 13 13012f8
Table 1. Comparison between diploids and autotetraploids in different families with respect to height, breast-height diameter, volume, leaf area, fruit length, fruit diameter and stoma length.
TraitsFull-sib families

5 × 35 × 95 × 116 × 5


DiploidAutotetraploidDiploidAutotetraploidDiploidAutotetraploidDiploidAutotetraploid
Height (m)6.80 ± 0.25 A5.61 ± 0.49 B6.86 ± 0.17 A5.70 ± 0.43 B6.83 ± 0.22 A5.52 ± 0.48 B6.92 ± 0.18 A5.48 ± 0.37 B
Breast-height diameter (mm)36.44 ± 1.13 B46.71 ± 3.00 A36.59 ± 0.91 B47.30 ± 3.02 A37.88 ± 1.80 B46.05 ± 3.35 A37.59 ± 0.83 B45.70 ± 3.12 A
Volume (dm3)4.09 ± 0.29 B5.96 ± 1.07 A4.15 ± 0.24 B6.17 ± 1.02 A4.45 ± 0.52 B5.74 ± 1.02 A4.41 ± 0.25 B5.61 ± 0.91 A
Leaf area (cm2)13.92 ± 5.62 B28.81 ± 8.63 A20.77 ± 4.82 B26.44 ± 5.57 A13.51 ± 3.87 B30.64 ± 8.90 A14.48 ± 3.97 B27.83 ± 6.40 A
Fruit length (mm)40.70 ± 2.53 B48.17 ± 5.25 A44.51 ± 5.22 B50.87 ± 6.06 A45.62 ± 3.59 B48.53 ± 5.07 A51.78 ± 6.07 B57.63 ± 8.39 A
Fruit diameter (mm)8.55 ± 0.58 B11.43 ± 2.88 A8.02 ± 0.53 B12.76 ± 2.04 A9.11 ± 0.59 B12.03 ± 1.19 A9.02 ± 0.77 B11.31 ± 1.46 A
Stoma length (μm)11.09 ± 1.33 B23.19 ± 5.06 A16.73 ± 2.04 B26.31 ± 4.17 A11.78 ± 1.60 B27.28 ± 4.64 A11.84 ± 1.34 B20.81 ± 3.43 A
Values labeled with different letters differ significantly (p < 0.01).
Table 2. Throughout and quality of RNA-Seq of diploid and autotetraploid.
SamplesTotal readsTotal nucleotides (nt)Q20 percentage (%)N percentage (%)GC percentage (%)
Diploid51,251,2404,612,611,60096.690.0048.53
Autotetraploid54,936,1624,944,254,58096.650.0048.28
Q20 percentage indicates the proportion of nucleotides with quality values higher than 20; N percentage indicates the proportion of unknown nucleotides in clean reads.
Table 3. Quality of de novo assembly of diploid and autotetraploid.
SamplesNumber of unigenesTotal length of unigenes (nt)Mean length of unigenes (nt)N50 (nt)
Diploid78,21348,907,8086251115
Autotetraploid88,60755,149,4626221117
All84,78864,593,4137621294
N50 indicates that half of the assembled bases were incorporated into unigenes with a length at least; All indicates nonredundant unigenes assembled by unigenes from diploid and autotetraploid.
Table 4. Differentially expressed genes involved in biosynthesis and signal transduction of IAA.
GenesLog2(autotetraploid RPKM/diploid RPKM)Annotation
GI: 2241125511.8auxin influx carrier component
GI: 3023985691.6ARF domain class transcription factor
GI: 1147331.6RecName: Full = Auxin-induced protein AUX22
GI: 202690551.5AUX/IAA protein
GI: 621253921.3auxin-responsive protein IAA
GI: 3023985891.3ARF domain class transcription factor
GI: 425616421.2P-loop containing nucleoside triphosphate hydrolase-like protein
GI: 504044771IAA type protein
GI: 3071363601.1auxin-regulated protein
GI: 2978025581.8ALDH3I1
GI: 2241316942.3aldehyde oxidase 2
Table 5. Differentially expressed genes involved in biosynthesis and signal transduction of ethylene.
GenesLog2(autotetraploid RPKM/diploid RPKM)Annotation
GI: 1153458082.5mitogen-activated protein kinase 20
GI: 22412351810.7AP2/ERF domain-containing transcription factor
GI: 2926689353.7AP2 domain class transcription factor
GI: 2894663491.7ERF transcription factor 4
GI: 2224276792.2ethylene responsive transcription factor 1a
GI: 625265791ACC oxidase ACCO2
Table 6. Primers used for real-time quantitative RT-PCR verification.
Gene-IDForward primer (5′-3′)Reverse primer (5′-3′)Product size (bp)
18S rRNAATCTTGGGTTGGGCAGATCGCATTACTCCGATCCCGAAGG223
α-TubulinGCACTGGCCTCCAAGGATTGGGTCGCTCAATGTCAAGG282
Unigene20020_AllAGACTGAGATTTGGGTATCTTCGCGTTAACAGAACCTGAGCAACC259
CL26738.Contig1_AllAGACGATGATGATGAATCTTTGCCCTCAGAAAGATCGACCTAAGG298
CL37007.Contig1_AllGAACTTGTTCTGAACTGTCTGCGGAAACTTCAAACGAAGACC273
Unigene32315_AllGTCTTTCTCCCTCCTTGGTTAGCTTGTTCTTCCTTAATTTCGTGTCC273
CL41914.Contig1_AllGCATTGGAAACATTAGAACTGTCCCCTTCCTTATCGTCAAGCAATCG264
CL10694.Contig1_AllCCAAGGAACATCTCCTGCAAGCAGCTCCATCAGCATCAAGGTGG290
CL1467.Contig1_AllGCTCTGGTTGGTGGAATGGCCTCAGCTCTGTCTCCTCG248
CL26579.Contig1_AllCCAGCTGCAAAGACACAAGTGGTCCAACTAGCATCCAGTCACC294
CL7645.Contig1_AllGGTTTGAGCAGTTTTGACATAGCCATCGATGAAGGCAATTCAGTCC277
CL20989.Contig1_AllGTTCTTGAGAGAGAGAGAGAGGTACACTGCTTTCGTACGTGTGG284
Unigene39140_AllTGAGCTCTCCAGTGTCGACCGGAACCCATCTCTGCTATTTCC251
Unigene25063_AllCGACCTACTGCAGAAGAGGTCCTCAAGATATGCAAACTGC272
Unigene31405_AllCCAACCTTTCTACTATTTTCTGCGTGGTTTTGGATGAGTTGTTAGC244
Unigene29640_AllTTGTCGAATCCCTTATCTCAGCTCACCGGAATCTTTCTCCTGG265
CL29218.Contig1_AllGGATGAAATCTTTGCAAGCTGGGCACCAAATCAATGCGTCGAGC279
CL6280.Contig1_AllTTGGAGCACGAAAGTTTACCGAGTGGGAAGTTGAGCAAGG279
CL27664.Contig1_AllCTTCTAGGCAGTGACACTATGGGTGAACATAGGAGACCAAGTGG285

