Article

Efficient 1H-NMR Quantitation and Investigation of N-Acetyl-D-glucosamine (GlcNAc) and N,N'-Diacetylchitobiose (GlcNAc)2 from Chitin

1
Department of Chemistry, National Cheng Kung University, Tainan 701, Taiwan
2
Institute of Biotechnology, National Cheng Kung University, Tainan 701, Taiwan
3
Department of Pharmacy, China Medical University, Taichung 401, Taiwan
*
Author to whom correspondence should be addressed.
Int. J. Mol. Sci. 2011, 12(9), 5828-5843; https://doi.org/10.3390/ijms12095828
Submission received: 20 June 2011 / Revised: 22 August 2011 / Accepted: 26 August 2011 / Published: 9 September 2011
(This article belongs to the Section Biochemistry)

Abstract

:
A quantitative determination method of N-acetyl-d-glucosamine (GlcNAc) and N,N′-diacetylchitobiose (GlcNAc)2 is proposed using a proton nuclear magnetic resonance experiment. N-acetyl groups of GlcNAc and (GlcNAc)2 are chosen as target signals, and the deconvolution technique is used to determine the concentration of the corresponding compound. Compared to the HPLC method, 1H-NMR spectroscopy is simple and fast. The method can be used for the analysis of chitin hydrolyzed products with real-time analysis, and for quantifying the content of products using internal standards without calibration curves. This method can be used to quickly evaluate chitinase activity. The temperature dependence of 1H-NMR spectra (VT-NMR) is studied to monitor the chemical shift variation of acetyl peak. The acetyl groups of products are involved in intramolecular H-bonding with the OH group on anomeric sites. The rotation of the acetyl group is closely related to the intramolecular hydrogen bonding pattern, as suggested by the theoretical data (molecular modeling).

1. Introduction

N-acetyl-d-glucosamine (GlcNAc) and its derivative N,N′-diacetylchitobiose (GlcNAc)2 are a class of medicinal agent [15] with several interesting pharmacological activities, such as therapeutic activity in osteoarthritis [6] and inflammatory bowel disease [7]. They have also been evaluated as food supplements [8]. The hydrolysis of chitin may produce a variety of products, such as monomer GlcNAc, dimer (GlcAc)2, and chitosan oligomer. They have recently received considerable attention as functional materials for many applications in the fields of medicine, the food industry, agriculture, cosmetics and pharmaceuticals [9]. Although GlcNAc and (GlcNAc)2 can be produced via the acid hydrolysis of chitin, this procedure has high costs, low yields, and acidic waste [10]. Recently, GlcNAc and (GlcNAc)2 has been produced from chitins using enzymatic hydrolysis with good yields [11,12]. Therefore, methods that allow an accurate measurement of GlcNAc and (GlcNAc)2 are needed. Several methods have been used to determine the content of chitin hydrolyzed products, such as thin layer chromatography (TLC) [13] and high-performance liquid chromatography (HPLC) [12,14,15]. The most widely used method for analyzing the chitinase-catalyzed hydrolyzed products of chitin is HPLC. However, this method requires that enzymes be deactivated and filtered through a dialytic membrane before HPLC analysis. Calibration curves are also needed to quantitatively determine the content of chitin hydrolyzed products.
A highly specific and sensitive method is developed in this paper. Here, we describe the quantitative analysis of GlcNAc and (GlcNAc)2 simultaneously using an 1H-NMR experiment. Compared to the HPLC method, 1H-NMR spectroscopy quickly provides more information on chitin hydrolyzed products (α/β GlcNAc, β-α/β-β (GlcNAc)2, Scheme 1). No standard compounds are required for the preparation of calibration curves. All the components are detected simultaneously in a single measurement without any pre-cleaning steps. To our knowledge, no quantitative NMR method has been developed and validated for GlcNAc and (GlcNAc)2 determination. In the present study, an 1H-NMR method was developed for analyzing chitinase-catalyzed hydrolysis products obtained from chitin. This method can be used for the analysis of hydrolysis products obtained from chitin without destroying enzyme activity, and for quantifying the content of products using internal standards without calibration curves. This method has an excellent correlation between the concentration of products and the integration of the peak, and the ratio’s of α,β configurations of products. The experiments were carried out in phosphate buffer solutions with various pH levels to estimate the activity of chitinase. This study also focused on the kinetic behavior of N-acetyl-d-glucosamine and N,N′-diacetylchitobiose in pyridine-d5. The rate constants were associated with the variation of chemical shifts at the acetyl peak of GlcNac and (GlcNAc)2, respectively, and were studied using the temperature dependence of 1H-NMR spectra (VT-NMR). Density-functional theory (DFT) studies with Becke’s three-parameter hybrid function using the Lee, Yang, and Parr correlation function (B3LYP) were performed on the equilibrium geometries for N-acetyl-d-glucosamine and N,N′-diacetylchitobiose. The optimized geometric structure and the geometrical parameters (bond lengths and energy) of intramolecular hydrogen bonds in GlcNAc were also studied.

2. Results and Discussion

2.1. Quality Analysis of Enzyme Hydrolyzed Products

An 1H NMR method was developed to analyze the chitinase-catalyzed chitin hydrolysis products. This method can be used for the analysis of chitin hydrolysis products without destroying of the enzyme activity, and to quantify the contents of products using internal standard without need of the calibration curves. Especially, this method has an excellent correlation between concentration of the products and integration of the peak, also the ratio’s of α,β conformers of products.
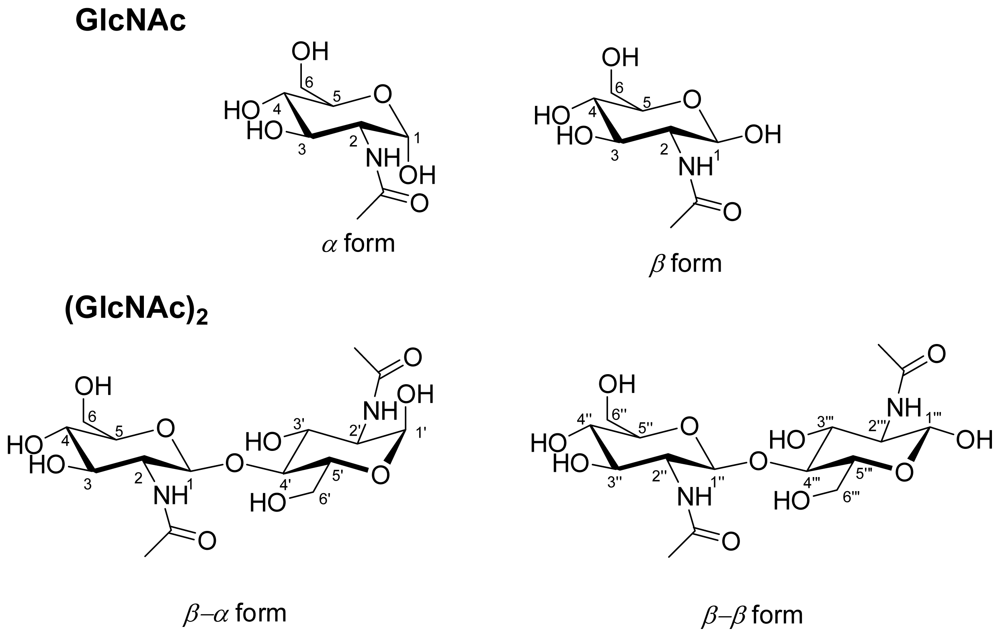
With the enzyme catalysis of chitin, two kinds of hydrolysate were obtained: α/β GlcNAc and β-α/β-β (GlcNAc)2 (Scheme 1). The analysis of the 
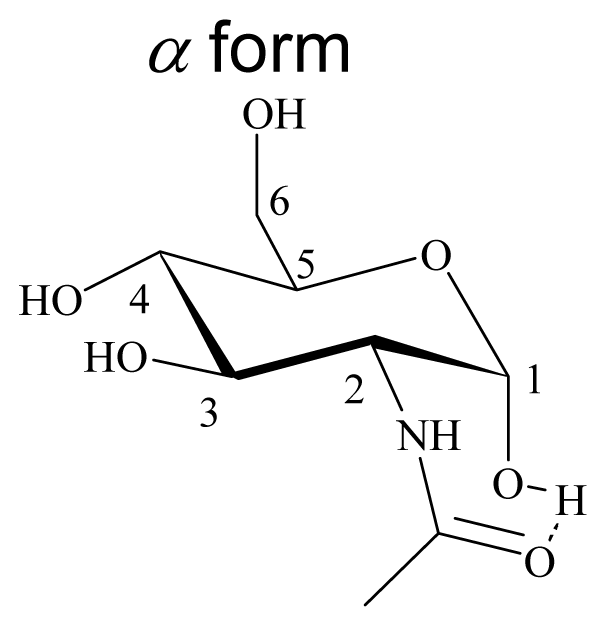
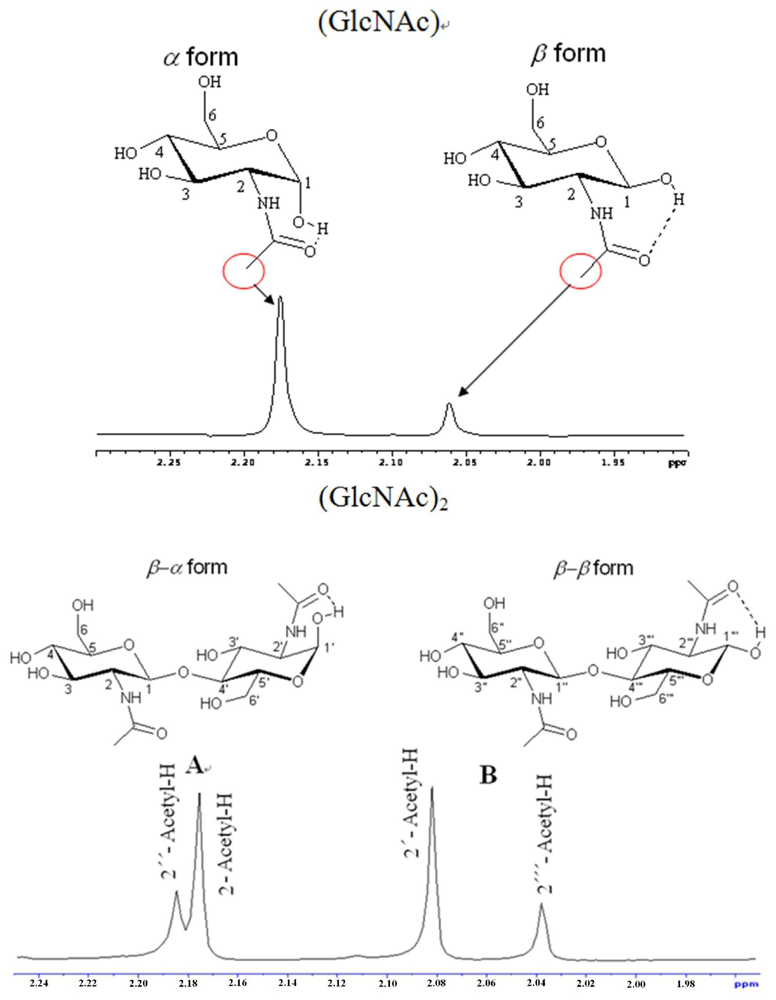
1H-NMR spectrum of the standard GlcNAc, (GlcNAc)2, and hydrolysates shows that 
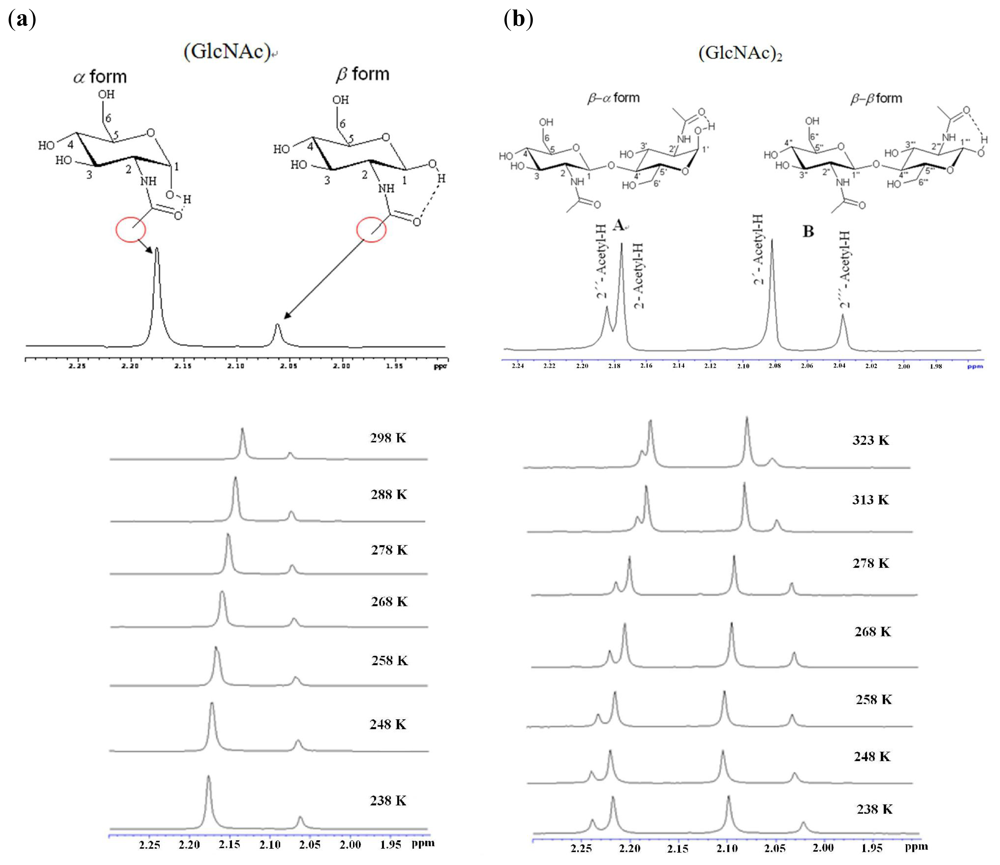
N-acetyl groups and anomeric protons can be selected as target signals for quantification (Figures 1 and 2). We chose TSP as an internal standard because it is a very stable compound with a simple 1H-NMR spectrum consisting of a singlet (δ 0.00). The quantities of the compounds were calculated using the relative ratio of the intensity of each compound to a known amount of the internal standard. The chemical shifts of α/β GlcNAc and β-α/β-β (GlcNAc)2 are quite easy to assign (
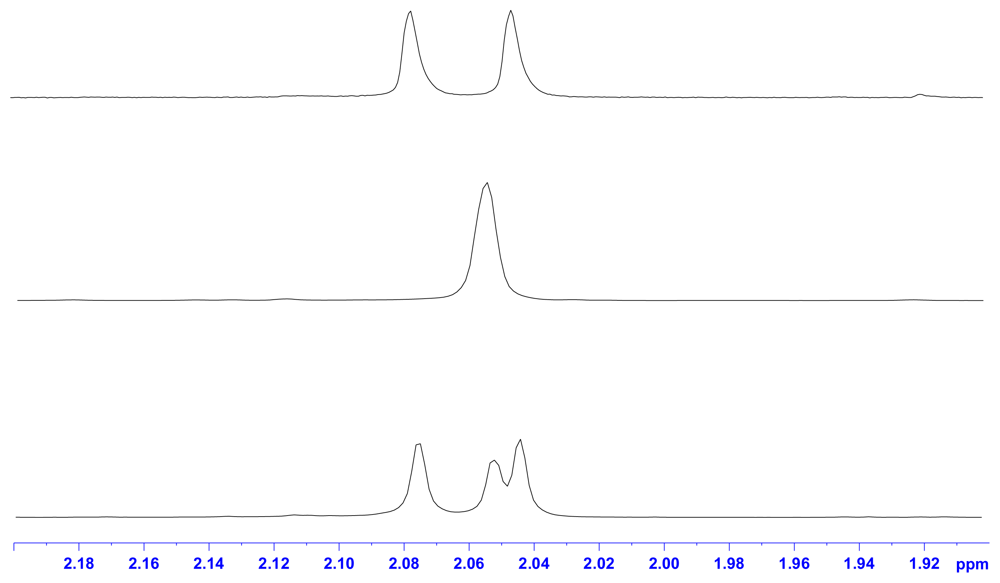
Table 1), but some signals overlap. This can be solved using the deconvolution routine of Bruker NMR software, making the N-acetyl groups of GlcNAc and (GlcNAc)2 distinguishable. The deconvolution allows the determination of the individual areas and the line widths of the overlapped signals. Thus, it can be used for quantifying GlcNAc and (GlcNAc)
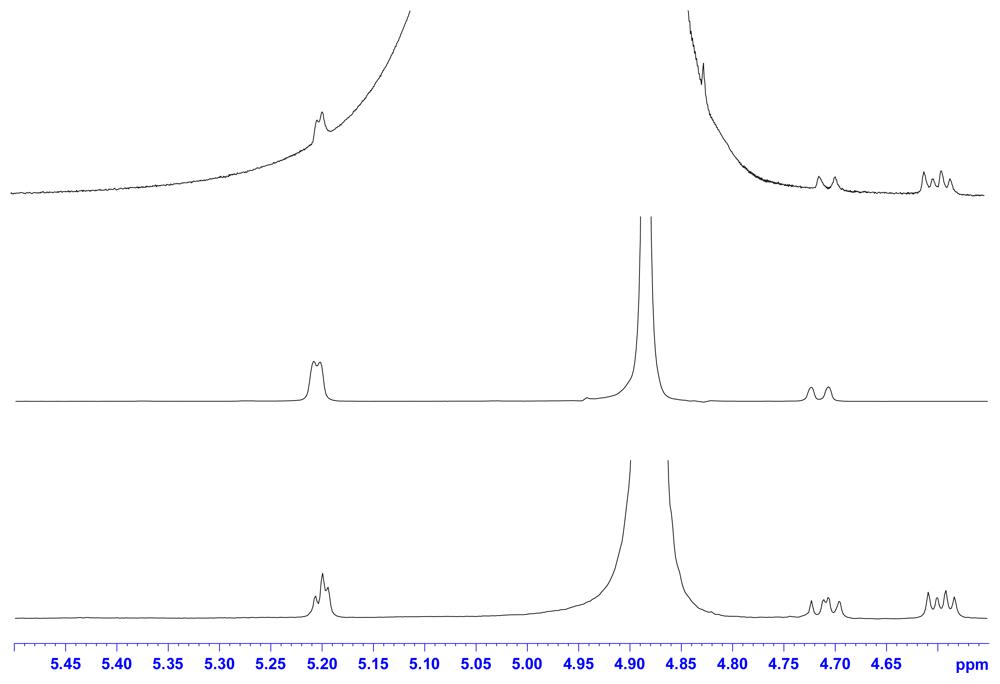
2. In addition, anomeric protons of α/β GlcNAc and β-α/β-β (GlcNAc)2 appeared in the range 5.3–4.5 ppm; therefore, this is the working region for determining the ratio of α/β GlcNAc and the ratio of β-α/β-β (GlcNAc)2. However, when acquiring an NMR spectrum at 305 K, the signals Hβ-1 and Hβ-1″ of (GlcNAc)2 overlap with the H2O background signal. In order to prevent this overlap, the NMR working temperature was changed to 290 K. The signals Hβ-1and Hβ-1″ can then be used for quantifying the β-α and β-β forms of (GlcNAc)2 using the NMR deconvoluting technique. Furthermore, α-GlcNAc and β-GlcNAc can be determined by subtracting the overlapping signals from α/β GlcNAc and β-α/β-β (GlcNAc)2.
Calibration curves was determined in the concentration ranges for GlcNAc and (GlcNAc)2 to evaluate the accuracy of this method at various concentrations, respectively. The calibration curves were made using the ratio of the peak integral of the compound and the internal standard (TSP) (Table 2). The linearity of the calibration curves was determined by plotting the least squares regression lines. All calibration curves were highly linear with a r2-value of more than 0.999. Because all preliminary quantifications were well within the linear range of this method, we can conclude that these values were accurate. It should be noted that these calibration curves are not needed for quantifying the compounds in future experiments because the area of each signal is proportional to the molar concentration of the corresponding compound in 1H-NMR.
An HPLC method was used to confirm the analysis results obtained using the 1H-NMR method (Table 3). HPLC methods only obtain the total yield of GlcNAc and (GlcNAc)2; they cannot determine the ratio of α/β GlcNAc and the ratio of β-α/β-β (GlcNAc)2. Therefore, the NMR method is simple, rapid, and specific; no reference compounds are needed. An overall profile of the preparation can be obtained directly.
Using the proposed method, the production of GlcNAc and (GlcNAc)2 can be analyzed in a much shorter time than that required for conventional chromatographic methods. We report a systematic study on a commercial chitinase derived from Streptomyces griseus HUT-6037 (EC 3.2.1.14), which leads to a higher efficiency of GlcNAc and (GlcNAc)2 production from α-chitin. The experiments were carried out in different pH phosphate buffer solutions to estimate the activity of chitinase. This enzyme was tested for hydrolytic activity of α-chitin at pH 5~9 within 5 days and the amount of GlcNAc and (GlcNAc)2 by chitinase from Streptomyces griseus HUT-6037 at various pH values summaries in Table 4. The amount of (GlcNAc)2 is the highest at pH = 9, however, the amount of (GlcNAc) is the highest at pH = 5. When chitinase hydrolysis reaction was set in the acidic range, the yield of GlcNAc significantly increased with incubation time. However, the yield of (GlcNAc)2 reached its maximum after 3 days, and then decreased slowly. The results indicate that acid hydrolysis of (GlcNAc)2 might occur, resulting in GlcNAc production. When the pH was 7, GlcNAc and (GlcNAc)2 were produced at the same rate. After 5 days, the yield of GlcNAc was the same as that of (GlcNAc)2. A study on chitinolytic activity in the basic range showed that a significant yield of (GlcNAc)2 can be obtained observed at pH 9. However, the percent yield of GlcNAc production increased only slightly. The results indicate that the acid hydrolysis of (GlcNAc)2 does not happen and that it does not transfer to GlcNAc. The ratio of α/β GlcNAc and the ratio of β-α/β-β (GlcNAc)2 were also evaluated (Table 4). The yield of β-α (GlcNAc)2 was significantly higher than that of β-β (GlcNAc)2, while the yield of GlcNAc was higher for the β form.

2.2. Kinetic Properties of Enzyme Hydrolyzed Products

The kinetic properties of enzyme hydrolyzed products were determined experimentally using VT-NMR. Figure 3 shows the 1H-NMR signal of (GlcNAc) and (GlcNAc)2 in pyridine-d5.
We can evaluate the rate constant from Equation (1) at various temperatures [16].
k = [ ( Δ v o ) 2 - ( Δ v p ) 2 ] 1 / 2 × π / 2
where Δvo is the difference of chemical shifts of the acetyl peak (α form and β form) at the lowest temperature (T = 238 K). With the increase of temperature, the acetyl peak positions of GlcNAc α form and β form are close from 238 to 298 K (Figure 4). Δvp is the difference of chemical shifts of the acetyl peak at the present temperature (T = 248–343 K for (GlcNAc), and T = 248–338 K for (GlcNAc)2). The rate constant (k) of (GlcNAc) and (GlcNAc)2 at various temperatures is summarized in Table 5. The column headings “A” and “B” refer to the chemical shift difference of β-a/β-β form (GlcNAc)2. The temperature calibration of the VT-NMR has been studied using polynomial fitting (k = a0 + a1T + a2T2 + a3T3), the fitting parameters of kinetic constants (k) for (GlcNAc) and (GlcNAc)2 at various temperatures are summarized in Table 6.
From the 1H-NMR study of (GlcNAc)2 in pyridine-d5, the signal of the α-form acetyl group increases with reaction time; however, the signal of the β-form acetyl group decreases, implying opening and closing of the ring in (GlcNAc)2 [17
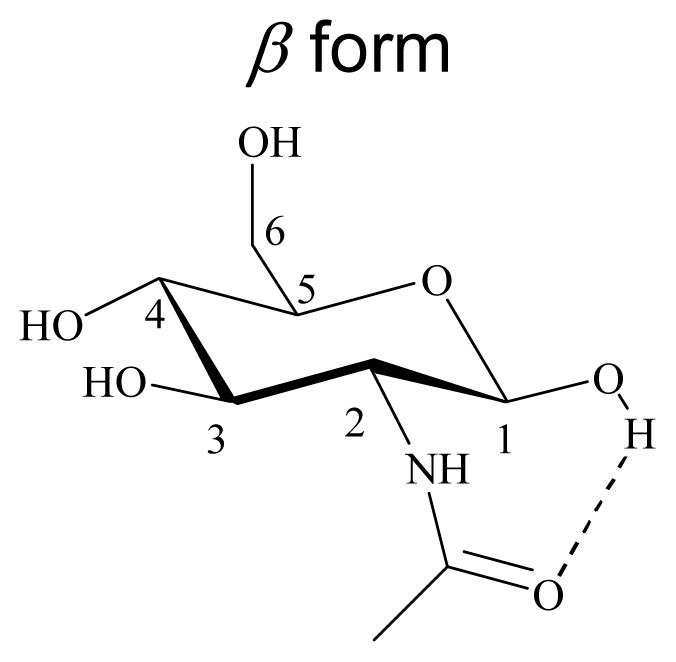
19]. The signal magnitude of the β-form acetyl group changes to the signal magnitude of the α-form acetyl group gradually, suggesting that the intramolecular hydrogen bonds of (GlcNAc)2 in pyridine-d5 make α-form more stable than β-form.

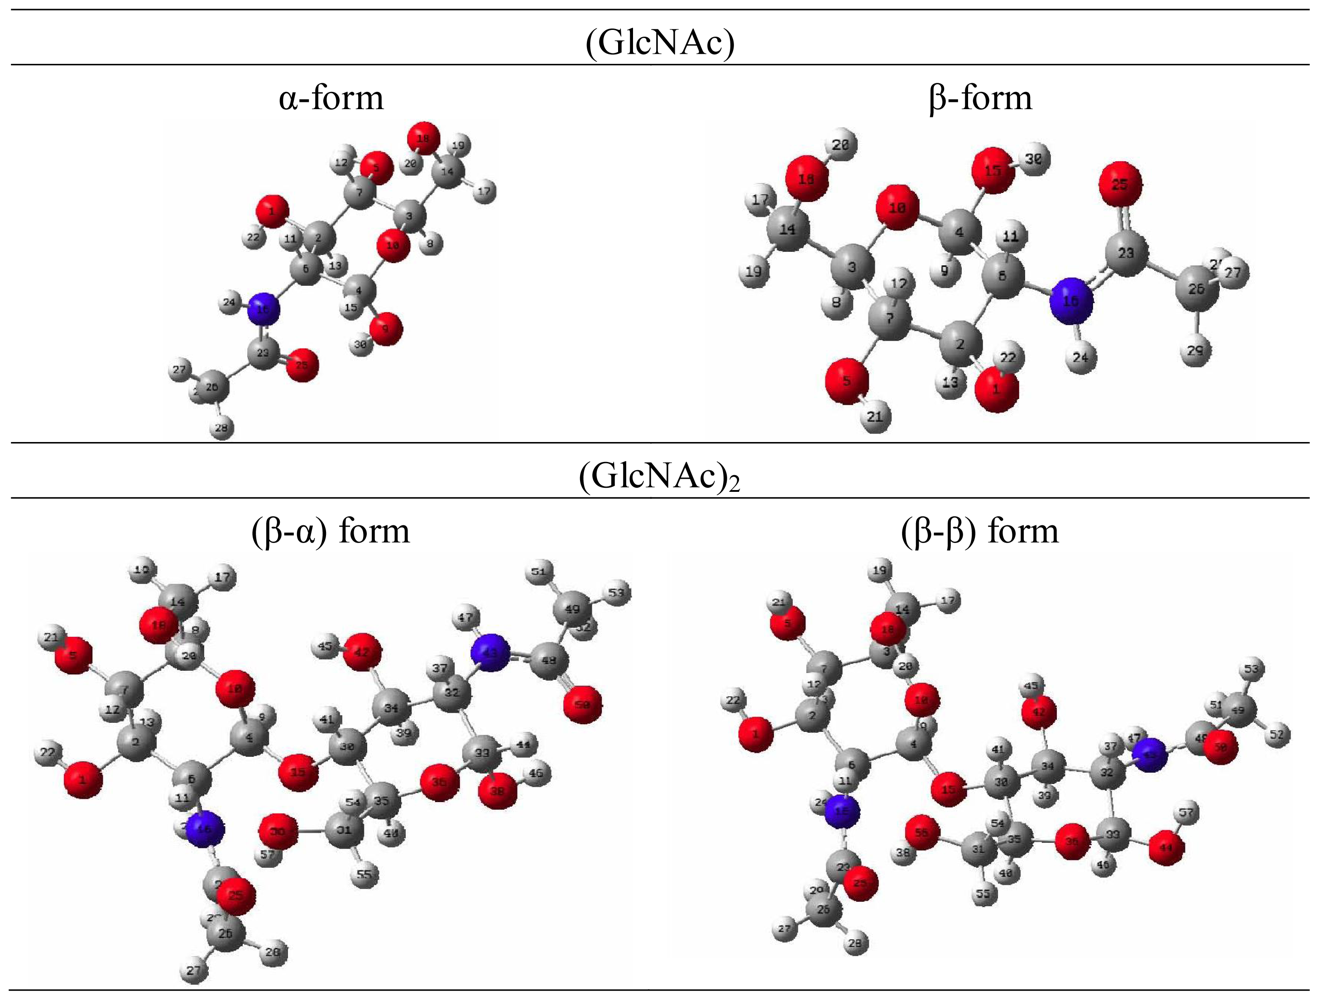
2.3. Equilibrium Geometries

Density functional theory (DFT) is a quantum mechanical method used in physics and chemistry to investigate the equilibrium geometric structure [2026]. The geometrical properties of N-acetyl-d-glucosamine were studied with density functional theory (DFT) using the Gaussian 03 program package, as shown in Figure 5. The calculations were done on a B3LYP/6-31G(d) level for geometry optimizations in the ground state. B3LYP is a hybrid function modified from the three-parameter exchange-correlation functional of Becke [20], while the gradient-corrected exchange and correlation functions are calculated according to Becke [21] and Lee et al. [22]. The geometrical parameters (bond length, bond angle, and bond energy of intramolecular hydrogen bonds) were studied from the optimized equilibrium geometries. The geometric parameters of N-acetyl-d-glucosamine are summarized in Table 7. The bond lengths and bond angles of α-form N-acetyl-d-glucosamine are similar to those of β-form N-acetyl-d-glucosamine, except bond angle ∠O-H-O shows significant difference between α-form (∠O9-H30-O25 = 163.29°) and β-form (∠O15-H30-O25 = 150.35°) N-acetyl-d-glucosamine. The bond length and bond energy of intramolecular hydrogen bonds (O25-H30) from α-form N-acetyl-d-glucosamine are 1.78 Å and 10 kJ/mole, respectively, whereas those from β-form N-acetyl-d-glucosamine are 1.82 Å and 8 kJ/mole, respectively. There is a relationship of the conformational study of GlcNAc to the NMR experiments. α form GlcNAc shows shorter intramolecular hydrogen bond length 1.78 Å than β form GlcNAc (1.82 Å), the chemical shift of 1H NMR shows acetyl signal of β form GlcNAc is upfield than α form GlcNAc.

3. Experimental Section

3.1. Chemicals

α-chitin was purchased from Kiotek Corp (Hsinchu, Taiwan). Chitinase derived from Streptomyces griseus HUT-6037 (EC 3.2.1.14), and the reference compounds N-acetyl-d-glucosamine (GlcNAc) and N,N′-diacetylchitobiose (GlcNAc)2 were purchased from Sigma. D2O (99.9%) and TSP (3-(trimethylsilyl)-propionic-2,2,3,3-d4 acid sodium salts) were obtained from Aldrich. HPLC grade CH3CN was purchased from Merck (Darmstadt, Germany).

3.2. General

1H-NMR spectra were recorded in a deuterated phosphate buffer solution using a Bruker AVANCE 500 spectrometer at 290 K. For each sample, 32 scans were recorded with the following parameters: 0.19 Hz/point; spectra width, 5482.456 Hz; pulse width, 8 μs; relaxation delay, 2 s; and acquiring time, 2.988 s. For quantitative analysis, the peak area was used; the start and end points of the integration of each peak were selected manually. The relative area under the overlapping peak was analyzed using the Gaussian/Lorentzian deconvolution technique [27,28].
The 1H-NMR chemical shifts of N-acetyl-d-glucosamine (GlcNAc) and N,N′-diacetylchitobiose (GlcNAc)2 summarize as follows,
Acetyl signal:
N-acetyl-d-glucosamine (GlcNAc): δ 2.05(s).
N,N′-diacetylchitobiose (GlcNAc)2: δ 2.08(s), δ 2.05(s).
Anomeric signal:
(GlcNAc): Hα-1′ signal: δ 5.21 (d, J = 3.0 Hz)
Hâ-1 signal: δ 4.72 (d, J = 8.4 Hz)
(GlcNAc)2: Há-1′ signal: δ 5.20 (d, J = 2.6 Hz)
Hâ-1‴ signal: δ 4.70 (d, J = 7.9 Hz)
Hâ-1 signal: δ 4.60 (d, J = 8.5 Hz)
Hâ-1″ signal: δ 4.59 (d, J = 8.5 Hz)
The internal standard of 1H-NMR spectrum is TSP (3-(Trimethylsilyl)propionic-2,2,3,3-d4 acid sodium salt). After evaluating the integral area ratio of internal standard and chitin hydrolysis products, the amount of chitin hydrolysis products can be evaluated from internal standard, the values of chitin hydrolyzed products (GlcNAc) and (GlcNAc)2 were fitted using the equations:
( GlcNAc ) ( M ) = A × M s 3 × V
( GlcNAc ) 2 ( M ) = A × M s 6 × V
where A is the integral area ratio, Ms is the mole amount of internal standard, V is the volume of solution (L).
The calibration curves of 1H-NMR spectrum were made using the ratio of the peak integral of the compound and the internal standard (TSP). The linearity of the calibration curves was determined by plotting the least squares regression lines. The calibration curves were highly linear with a r2-value of 0.9999 and 0.9994 for GlcNAc and (GlcNAc)2, respectively.
HPLC analysis of chitin hydrolyzed products was performed on a Shimadzu LC-10ATvp (Japan) (Cosmosil Sugar-D column (4.6 × 250 mm, 5 μm); CH3CN/H2O = 8/2; flow rate = 1.0 mL/min; injection, 20 μL; detection, UV at 210 nm). Calibration curves were determined in the concentration ranges for GlcNAc and (GlcNAc)2 to evaluate the accuracy of this method at various concentrations (see supplementary materials). The linearity of the calibration curves was determined by plotting the least squares regression lines. The calibration curves were highly linear with a r2-value of 0.9995 and 0.9999 for GlcNAc and (GlcNAc)2, respectively.

3.3. NMR Analysis of Products from Chitin Hydrolysis

α-chitin (5 mg) was suspended in 400 μL of deuterated phosphate buffer solution (pH 5~9) in a 5 mm NMR tube containing 50 μL 0.01 M TSP (internal standard). Streptomyces griseus HUT-6037 (1.4 mg) dissolved in deuterated phosphate buffer solution (100 μL, pH 5~9) was then added into the above solution and shaken at 37 °C. After the prescribed time, the signal of enzyme is really weak, the amounts of GlcNAc and (GlcNAc)2 were directly estimated using NMR. The quantification of chitinase hydrolyzed products continued to be recorded for 5 days of incubation. The deuterated phosphate buffer solution was prepared by 0.1 M citric acid buffer (pH = 5–6) and 0.1 M Tris buffer (pH = 7–9). For pH 5.0, the deuterated phosphate buffer solution was prepared using approximately a 50%: 50% mixture of 0.1 M citric acid to 0.1 M disodium hydrogen phosphate. For pH 6.0, the deuterated phosphate buffer solution was prepared using titrating pH of phosphate with citric acid. For pH = 7–9, 0.1 M Tris buffer is titrated to desired pH with HCl.

3.4. HPLC Analysis of Products from Chitin Hydrolysis

α-chitin (5 mg) was suspended in 400 μL of deuterated phosphate buffer solution (pH 7) in a 5 mm NMR tube. Streptomyces griseus HUT-6037 (1.4 mg) dissolved in deuterated phosphate buffer solution (100 μL, pH 7) was then added into the above solution and shaken at 37 °C. After the prescribed time, the reaction mixture was taken out, filtered, and analyzed using HPLC. The amounts of GlcNAc and (GlcNAc)2 in the reaction mixture were estimated from the calibration curve of the standard GlcNAc and (GlcNAc)2.

3.5. Computational Methods

Equilibrium geometries were obtained using the Gaussian 03 program package [29] and optimized using B3LYP (Becke’s three-parameter hybrid function with the Lee-Yang-Perdew correlation function). Under the optimized geometries, total energies were obtained at the Pople 6–31 + g(d) level.

4. Conclusions

A highly specific and sensitive method using 1H-NMR was developed for the quantitative determination of α/β GlcNAc and β-α/β-β GlcNAc. This technique has a good agreement with the HPLC method. Since enzymatic hydrolysis is conducted under quite mild conditions and high selectivity is achieved in the production of GlcNAc and (GlcNAc)2, the proposed method is useful for quickly evaluating chitinase activity and for finding a suitable chitinase which could produce high yields of GlcNAc and (GlcNAc)2. Especially, this method has an excellent correlation between concentration of the products and integration of the peak, also the ratio of α,β conformers of products. A systematic study on a commercial chitinase derived from Streptomyces griseus HUT-6037 (EC 3.2.1.14) is reported, which leads to a higher efficiency of GlcNAc and (GlcNAc)2 production from α-chitin. The experiments were carried out in phosphate buffer solutions (pH = 5–9) to estimate the activity of chitinase. The kinetic properties of enzyme hydrolyzed products were determined experimentally using VT-NMR. The rate constant (k) of (GlcNAc) and (GlcNAc)2 at various temperatures is evaluated. The geometrical parameters (bond length, bond angle, and bond energy of intramolecular hydrogen bonds) of N-acetyl-d-glucosamine were studied from the optimized equilibrium geometries. From the 1H-NMR study of (GlcNAc)2 in pyridine-d5, a mechanism of the N,N′-diacetylchitobiose open-close ring system in pyridine-d5 is proposed.

Supplementary Information

ijms-12-05828-s001.pdf

Acknowledgments

The authors are grateful for financial support from the National Science Council, Taiwan, Republic of China awarded to T. S. Wu. The authors also gratefully acknowledge the contributions of Cheng-Wen Chang, Department of chemistry, National Cheng Kung University, for helping with the laboratory work.

References

  1. Park, BK; Kim, MM. Applications of chitin and its derivatives in biological medicine. Int J Mol Sci 2010, 11, 5152–5164. [Google Scholar]
  2. Chen, JK; Shen, CR; Yeh, CH; Fang, BS; Huang, TL; Liu, CL. N-acetyl glucosamine obtained from chitin by chitin degrading factors in Chitinbacter tainanesis. Int J Mol Sci 2011, 12, 1187–1195. [Google Scholar]
  3. Faijes, M; Planas, A. In vitro synthesis of artificial polysaccharides by glycosidases and glycosynthases. Carbohydr Res 2007, 342, 1581–1594. [Google Scholar]
  4. Herasimenka, Y; Kotasinska, M; Walter, S; Schrempf, H. A selective assay to detect chitin and biologically active nano-machineries for chitin-biosynthesis with their intrinsic chitin-synthase molecules. Int J Mol Sci 2010, 11, 3122–3137. [Google Scholar]
  5. Keong, LC; Halim, AS. In vitro models in biocompatibility assessment for biomedical-grade chitosan derivatives in wound management. Int J Mol Sci 2009, 10, 1300–1313. [Google Scholar]
  6. John, MT; Robert, WG. Pilot study of oral polymeric N-acetyl-d-glucosamine as a potential treatment for patients with osteoarthritis. Clin Ther 1996, 18, 1184–1190. [Google Scholar]
  7. Salvatore, S; Heuschkel, R; Tomlin, S; Davies, SE; Edwards, S; Walker-Smith, JA; French, I; Murch, SH. A pilot study of N-acetyl glucosamine, a nutritional substrate for glycosaminoglycan synthesis, in paediatric chronic inflammatory bowel disease. Aliment Pharmacol Ther 2000, 14, 1567–1579. [Google Scholar]
  8. Shahidi, F; Arachchi, JKV; Jeon, YJ. Food applications of chitin and chitosans. Trends Food Sci Technol 1999, 10, 37–51. [Google Scholar]
  9. Aubry-Barroca, N; Pernet-Poil-Chevrier, A; Domard, A; Trombotto, S. Towards a modular synthesis of well-defined chitooligosaccharides: Synthesis of the four chitodisaccharides. Carbohydr Res 2010, 345, 1685–1697. [Google Scholar]
  10. Inouye, Y; Onodera, K; Kitaoka, S; Hirano, S. Some fatty acid derivatives of d-glucosamine. J Am Chem Soc 1956, 78, 4722–4724. [Google Scholar]
  11. Kuk, JH; Jung, WJ; Hyun Jo, G; Ahn, JS; Kim, KY; Park, RD. Selective preparation of N-acetyl-d-glucosamine and N,N′-diacetylchitobiose from chitin using a crude enzyme preparation from Aeromonas sp. Biotechnol Lett 2005, 27, 7–11. [Google Scholar]
  12. Sashiwa, H; Fujishima, S; Yamano, N; Kawasaki, N; Nakayama, A; Muraki, E; Hiraga, K; Oda, K; Aiba, SI. Production of N-acetyl-d-glucosamine from α-chitin by crude enzymes from Aeromonas hydrophila H-2330. Carbohydr Res 2002, 337, 761–763. [Google Scholar]
  13. Tanaka, T; Fukui, T; Atomi, H; Imanaka, T. Characterization of an exo-β-d-glucosaminidase involved in a novel chitinolytic pathway from the hyperthermophilic archaeon Thermococcus kodakaraensis KOD1. J Bacteriol 2003, 185, 5175–5181. [Google Scholar]
  14. Sashiwa, H; Fujishima, S; Yamano, N; Kawasaki, N; Nakayama, A; Muraki, E; Sukwattanasinitt, M; Pichyangkura, R; Aiba, SI. nzymatic production of N-acetyl-dglucosamine from chitin. Degradation study of N-acetyl-chitooligosaccharide and the effect of mixing of crude enzymes. Carbohydr Polym 2003, 51, 391–395. [Google Scholar]
  15. Pichyangkura, R; Kudan, S; Kuttiyawong, K; Sukwattanasinitt, M; Aiba, SI. Synthesis of an xylosylated rhamnose pentasaccharide, the repeating unit of the O-chain polysaccharide of the lipopolysaccharide of Xanthomonas campestris pv. begoniae GSPB 525. Carbohydr Res 2002, 337, 391–395. [Google Scholar]
  16. Marchetti, F; Marchetti, F; Masi, F; Pampaloni, G; Passarelli, V; Sommazzi, A; Spera, S. Synthesis, variable temperature NMR investigations and solid state characterization of novel octafluorofluorene compounds. J Fluor Chem 2009, 130, 341–347. [Google Scholar]
  17. Espinosa, JF; Asensio, JL; García, JL; Laynez, J; Bruix, M; Wright, C; Siebert, H-C; Gabius, H-J; Canada, FJ; Jiménez-Barbero, J. NMR investigations of protein-carbohydrate interactions. Binding studies and refined three dimensional solution structure of the complex between the B domain of wheat germ agglutinin and N,N′,N″-Triacetylchitotriose. Eur J Biochem 2000, 267, 3965–3978. [Google Scholar]
  18. Asensio, JL; Siebert, H-C; von der Lieth, C-W; Laynez, J; Bruix, M; Soedjanaatmadja, UM; Beintema, JJ; Canada, FJ; Gabius, H-J; Jiménez-Barbero, J. NMR investigations of protein-carbohydrate interactions: Studies on the relevance of Trp/Tyr variations in Lectin binding sites as deduced from titration microcalorimetry and NMR structure of the complex between Pseudohevein and N, N′, N″-Triacetylchitotriose. Proteins 2000, 40, 218–236. [Google Scholar]
  19. Siebert, H-C; André, S; Asensio, JL; Canada, FJ; Dong, X; Espinosa, JF; Frank, M; Gilleron, M; Kaltner, H; Kozár, T; et al. A new combined computational and NMRspectroscopical strategy for the identification of additional conformational constraints of the bound ligand in an aprotic solvent. Chembiochem 2000, 1, 181–195. [Google Scholar]
  20. Becke, AD. Density-functional thermochemistry. III. The role of exact exchange. J Chem Phys 1993, 98, 5648–5652. [Google Scholar]
  21. Becke, AD. Density-functional thermochemistry. I. The effect of the exchange-only gradient correction. J Chem Phys 1992, 96, 2155–2160. [Google Scholar]
  22. Lee, C; Yang, W; Parr, RG. Development of the Colle-Salvetti correlation-energy formula into a functional of the electron density. Phys Rev B 1988, 37, 785–789. [Google Scholar]
  23. Wu, TY; Tsao, MH; Chen, FL; Su, SG; Chang, CW; Wang, HP; Lin, YC; Ou-Yang, WC; Sun, IW. Synthesis and characterization of organic dyes containing various donors and acceptors. Int J Mol Sci 2010, 11, 329–353. [Google Scholar]
  24. Tsao, MH; Wu, TY; Wang, HP; Sun, IW; Su, SG; Lin, YC; Chang, CW. An efficient metal free sensitizer for dye-sensitized solar cells. Mater Lett 2011, 65, 583–586. [Google Scholar]
  25. Wu, TY; Tsao, MH; Chen, FL; Su, SG; Chang, CW; Wang, HP; Lin, YC; Sun, IW. Synthesis and characterization of three organic dyes with various donors and rhodanine ring acceptor for use in dye-sensitized solar cells. J Iran Chem Soc 2010, 7, 707–720. [Google Scholar]
  26. Wu, TY; Tsao, MH; Su, SG; Wang, HP; Lin, YC; Chen, FL; Chang, CW; Sun, IW. Synthesis, characterization and photovoltaic properties of di-anchoring organic dyes. J Braz Chem Soc 2011, 22, 780–789. [Google Scholar]
  27. Metz, KR; Lam, MM; Webb, AG. Reference deconvolution: A simple and effective method for resolution enhancement in nuclear magnetic resonance spectroscopy. Concept Magn Reson 2000, 12, 21–42. [Google Scholar]
  28. Khaodee, W; Jongsomjit, B; Praserthdam, P; Goto, S; Assabumrungrat, S. Impact of temperature ramping rate during calcination on characteristics of nano-ZrO2 and its catalytic activity for isosynthesis. J Mol Catal A Chem 2008, 280, 35–42. [Google Scholar]
  29. Frisch, MJ; Trucks, GW; Schlegel, HB; Scuseria, GE; Robb, MA; Cheeseman, JR; Montgomery, JA, Jr; Vreven, T; Kudin, KN; Burant, JC; et al. Gaussian 03, Revision C.02; Gaussian, Inc: Wallingford, CT, USA, 2004. [Google Scholar]
Figure 1. 1H-NMR spectroscopy of N-acetyl group of GlcNAc, (GlcNAc)2, and the hydrolyzates of chitin by chitinase at 290 K.
Ijms 12 05828f1
Figure 2. 1H-NMR spectroscopy of anomeric protons of GlcNAc, (GlcNAc)2, and the hydrolyzates of chitin by chitinase at 290 K.
Ijms 12 05828f2
Figure 3. The 1H NMR signal of (GlcNAc) and (GlcNAc)2 in pyridine-d5.
Ijms 12 05828f3
Figure 4. The chemical shift difference of (a) α/β form (GlcNAc) and (b) β-α/β-β form (GlcNAc)2.
Ijms 12 05828f4
Figure 5. B3LYP optimized geometrical structure of (GlcNAc) and (GlcNAc)2.
Ijms 12 05828f5
Scheme 1. Structures of N-acetyl-d-glucosamine (GlcNAc) and N,N′-diacetylchitobiose (GlcNAc)2.
Ijms 12 05828f6
Table 1. The target 1H-NMR chemical shifts of GlcNAc and (GlcNAc)2.
Substance1H shift (δ)Assignment
2.05 (s)N-acetyl group
α/β GlcNAc5.21 (d, J = 3.0 Hz)Hα-1
4.72 (d, J = 8.4 Hz)Hβ-1

2.08 (s), 2.05 (s)N-acetyl group
5.20 (d, J = 2.6 Hz)Hα-1′
β-α/β-β [GlcNAc]24.70 (d, J = 7.9 Hz)Hβ-1‴
4.60 (d, J = 8.5 Hz)Hβ-1
4.59 (d, J = 8.5 Hz)Hβ-1″
*Solvent: deuterated phosphate buffer, pH = 5.0, the concentration is 50%: 50% mixture of 0.1 M citric acid and 0.1 M disodium hydrogen phosphate.
Table 2. The 1H-NMR peak integral of the (GlcNAc)2 and the internal standard (TSP). Calibration curves was determined in the concentration ranges for (GlcNAc)2 to evaluate the accuracy of 1H-NMR at various concentrations.
No.Area of δ 0 (TSP)Area of δ 2.08 and 2.05 (GlcNAc)2Real Concentration of (GlcNAc)2 (mM)Calculate Concentration of (GlcNAc)2 (mM)
1120.4914.9684.8190.009090.11076
2103.1710.52410.650.2270.27987
3110.80620.45520.7910.45450.50759
4100.27227.58927.2580.6810.75850
5115.02340.75341.7640.9090.99705
*Solvent: deuterated phosphate buffer, pH = 5.0.
Table 3. Comparison of the quantitative determination of GlcNAc and (GlcNAc)2.
HPLCNMR

Digestion Time (day)(GlcNAc)2 (mM)(GlcNAc) (mM)Digestion Time (day)(GlcNAc)2 (mM)(GlcNAc) (mM)
13.7821.57513.7081.624
24.4352.45324.3092.551
34.5812.90034.5422.973
44.9213.91934.9783.941
55.0674.83445.0644.866
*D2O phosphate buffer, pH = 7.0.
Table 4. Production of GlcNAc and (GlcNAc)2 by chitinase from Streptomyces griseus HUT-6037.
Digestion Time (day)(GlcNAc)2 (mM)β-α (%)β-β (%)GlcNAc (mM)α (%)β (%)
pH = 5
13.55455.544.52.61658.741.3
24.52955.744.33.90758.641.4
34.71655.944.15.62058.841.2
44.52154.945.16.01358.441.6
54.19155.344.77.03658.042.0
pH = 6
13.79761.538.52.15557.542.5
24.36159.940.13.14458.441.6
34.81959.940.14.24159.240.8
44.50261.738.35.40560.139.9
54.37360.539.56.54259.940.1
pH = 7
13.70859.940.11.62458.941.1
24.30960.239.82.51158.441.6
34.54261.538.52.97356.743.3
44.97860.239.83.94159.340.7
55.06458.141.94.86661.338.8
pH = 8
13.71660.339.71.04558.541.5
24.11659.940.11.39959.140.9
34.79560.539.51.74958.841.2
44.87960.839.22.08859.740.3
55.21860.739.32.16058.841.2
pH = 9
13.85955.644.41.03960.539.5
24.34756.044.01.47658.341.7
34.60954.245.81.61161.638.4
44.89055.444.61.72559.740.3
55.34655.944.12.08760.839.2
Solvent: deuterated phosphate buffer, pH 5–9, which was prepared by 0.1 M citric acid buffer (pH = 5–6) and 0.1 M Tris buffer (pH = 7–9).
Table 5. The rate constant (k) of (GlcNAc) and (GlcNAc)2 at various temperatures.
GlcNAc(GlcNAc)2

Temperature (K)k (s−1)AB

Temperature (K)k (s−1)Temperature (K)k (s−1)
24842.4932489.96624824.24
25862.67925813.74625836.812
26878.66626815.89926847.58
27890.6427817.64327854.627
288101.3331321.42531377.374
298107.58332321.62932380.458
313116.66133321.99433383.397
323120.41933622.16633683.593
333123.45933722.32833783.951
343125.50333822.47333884.114
Solvent: pyridine-d5.
Table 6. Fitting parameters of kinetic constants (k) for (GlcNAc) and (GlcNAc)2 at various temperatures (k = a0 + a1T + a2T2 + a3T3).
a0a1a2a3R2a
GlcNAc−2.898 × 10326.15−7.612 × 10−27.461 × 10−50.9998
(GlcNAc)2 peak A−6.184 × 1025.82−1.776 × 10−21.82 × 10−50.9984
(GlcNAc)2 peak B−9.782 × 1027.653−1.789 × 10−21.345 × 10−50.9995
aCorrelation coefficient.
Table 7. The bond length and bond angle, bond energy of intramolecular hydrogen bond of α and β form (GlcNAc) performed with the Gaussian 03 program.
Ijms 12 05828f7Ijms 12 05828f8
C-O1.39 Å (C4-O9)1.37 Å (C4-O15)
O-H0.98 Å (O9-H30)0.98 Å (O15-H30)
C=O1.24 Å (C23-O25)1.23 Å (C23-O25)
Bond lengthC-N1.36 Å (C23-N16)1.36 Å (C23-N16)
C-C1.52 Å (C23-C26)1.52 Å (C23-C26)
N-C1.47 Å (N16-C6)1.46 Å (N16-C6)
C-C1.55 Å (C6-C4)1.55 Å (C6-C4)

∠C-O-H109.96° (∠C4-O9-H30)109.36° (∠C4-O15-H30)
∠O-H-O163.29° (∠O9-H30-O25)150.35° (∠O15-H30-O25)
∠H-O-C107.78° (∠H30-O25-C23)107.78° (∠H30-O25-C23)
Bond angle∠O-C-N122.91° (∠O25-C23-N16)122.91° (∠O25-C23-N16)
∠C-N-C126.17° (∠C23-N16-C6)126.17° (∠C23-N16-C6)
∠N-C-C114.89° (∠N16-C6-C4)114.89° (∠N16-C6-C4)
∠O-C-C114.19° (∠O9-C4-C6)114.19° (∠O15-C4-C6)

Intramolecular hydrogen bond (Bond length)O-H1.78 Å (O25-H30)1.82 Å (O25-H30)

Intramolecular hydrogen bond (Bond energy)O-H10 kJ/mole (O25-H30)8 kJ/mole (O25-H30)

