Selection of Candidate Housekeeping Genes for Normalization in Human Postmortem Brain Samples


Abstract
:1. Introduction
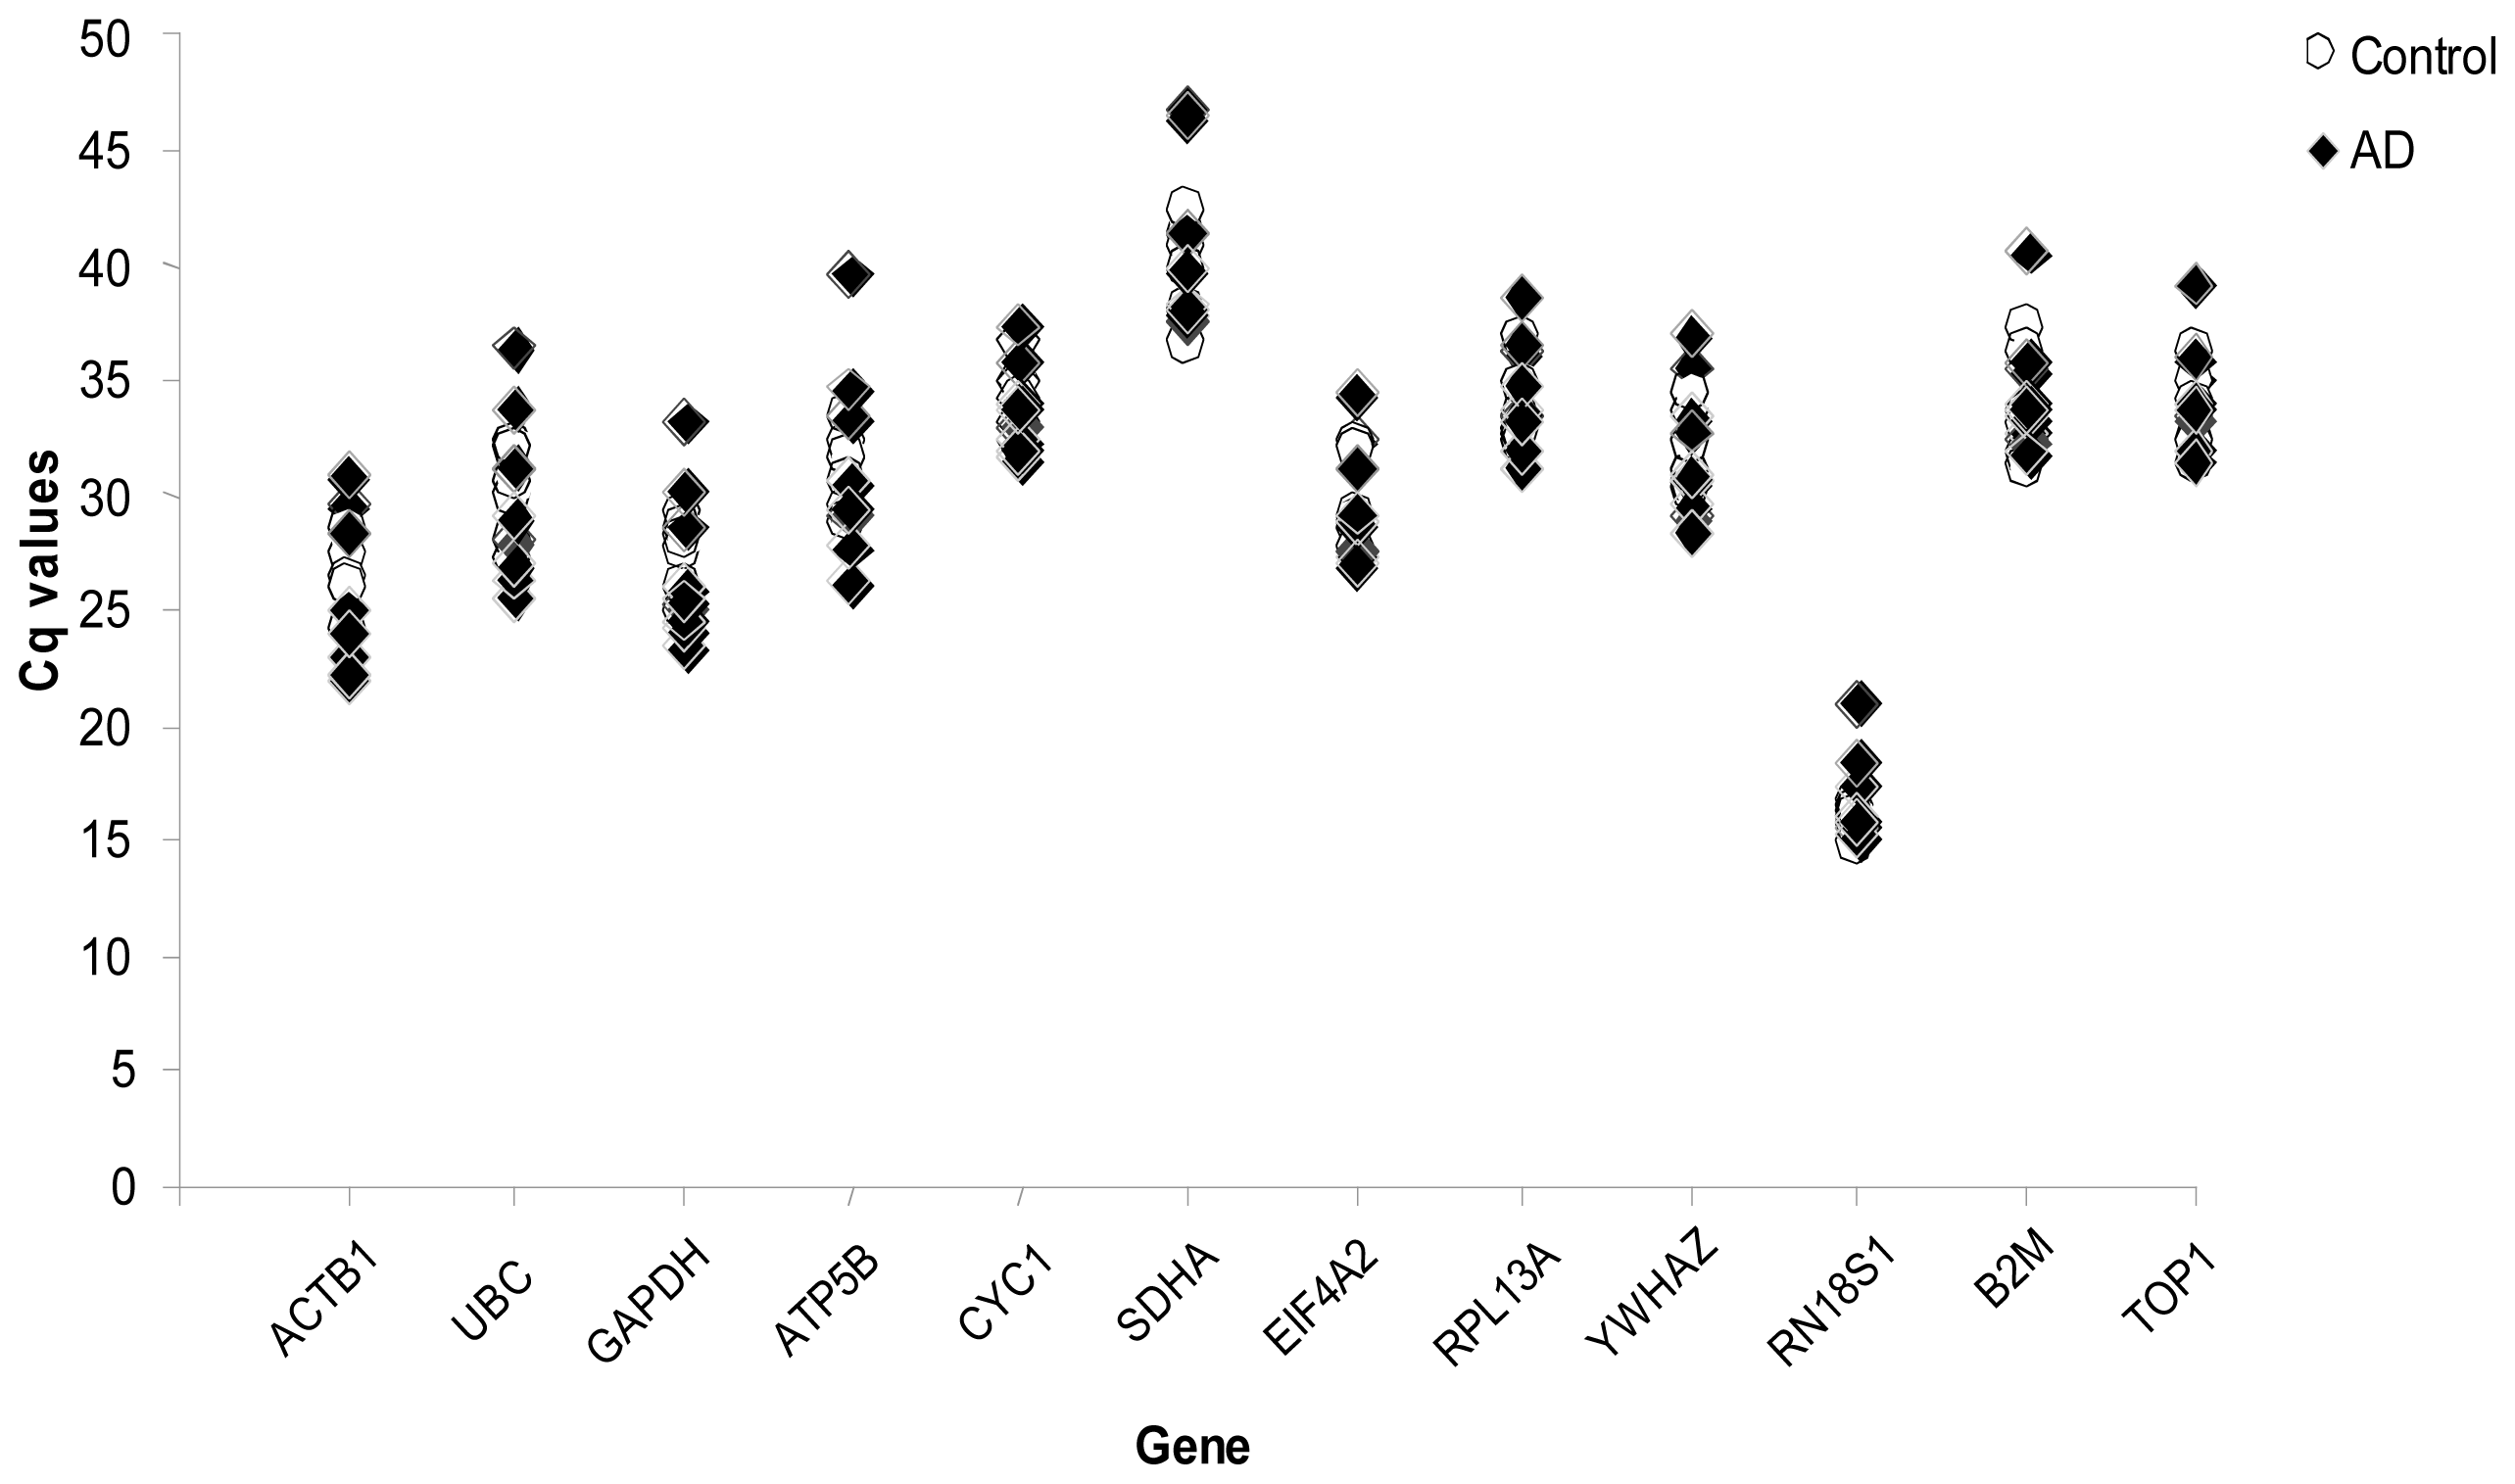
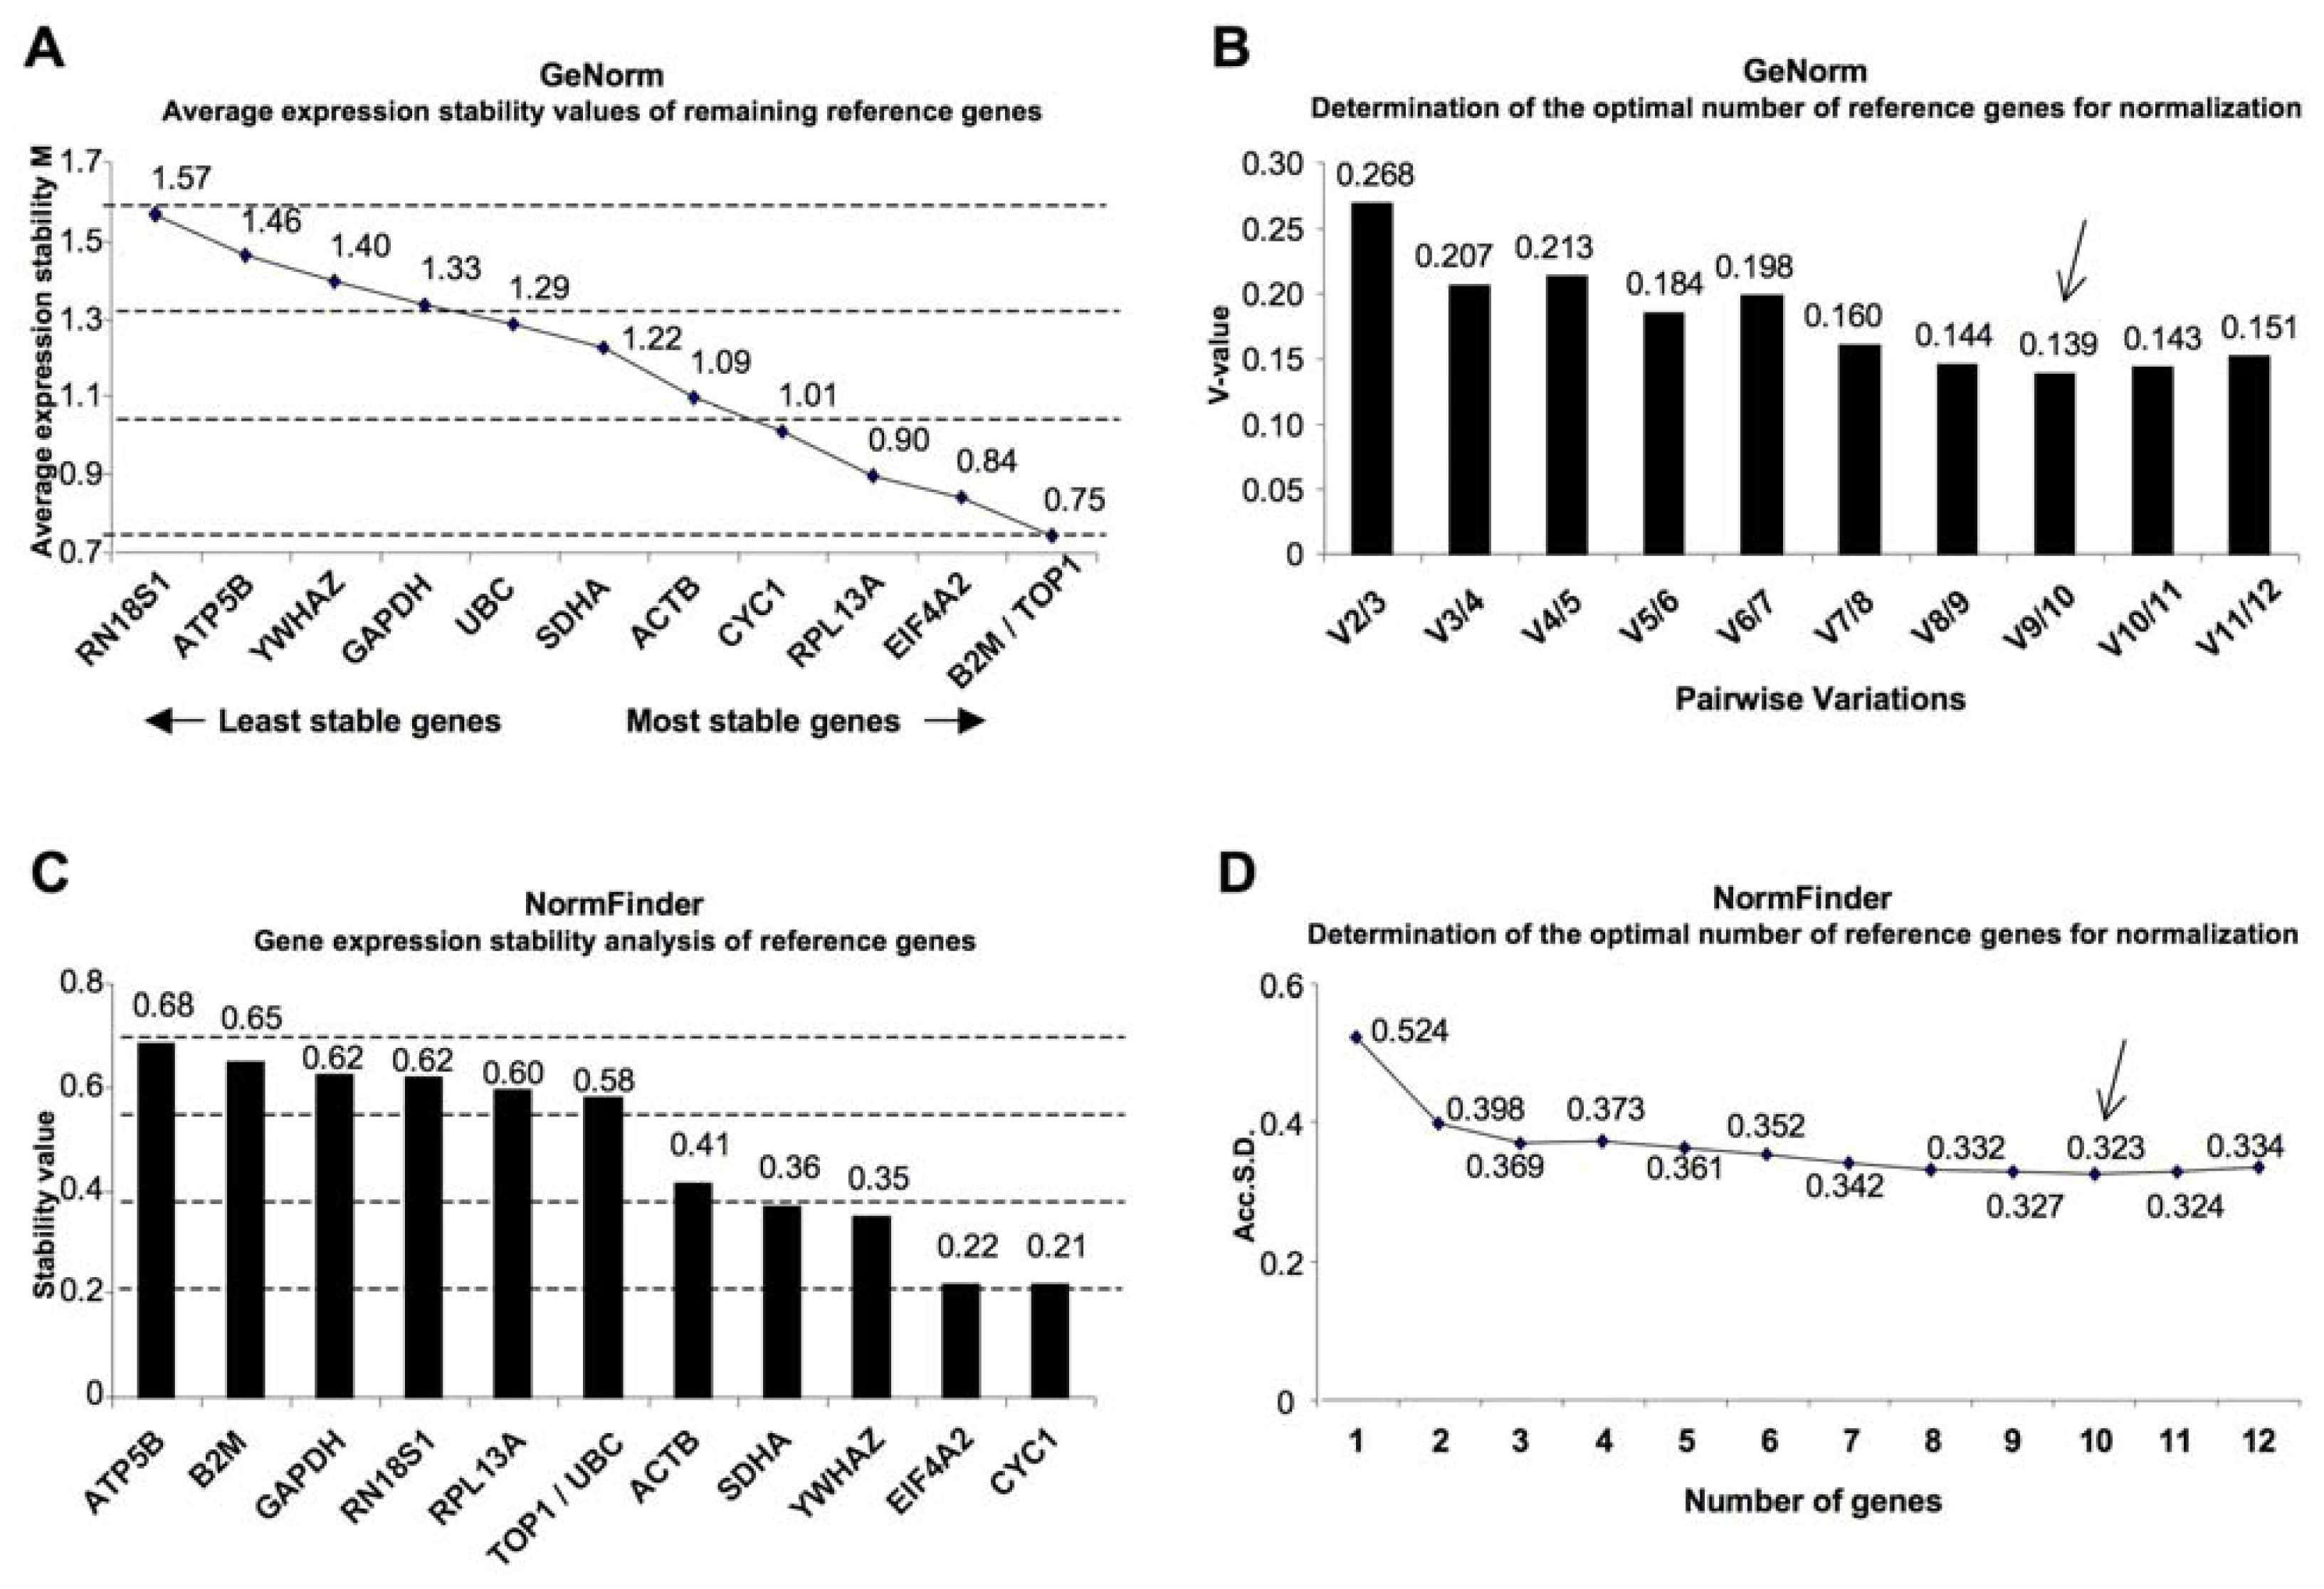
2. Results
3. Discussion
4. Material and Methods
4.1. Human Brain Samples and cDNA Preparation
4.2. Quantitative Real-Time RT-PCR
4.3. Gene Expression Stability Analysis
Acknowledgments
- Conflict of InterestThe authors declare no conflict of interest.
References
- Huang, HC; Jiang, ZF. Accumulated amyloid-beta peptide and hyperphosphorylated tau protein: Relationship and links in Alzheimer’s disease. J Alzheimers Dis 2009, 16, 15–27. [Google Scholar]
- Stan, AD; Ghose, S; Gao, XM; Roberts, RC; Lewis-Amezcua, K; Hatanpaa, KJ; Tamminga, CA. Human postmortem tissue: What quality markers matter? Brain Res 2006, 1123, 1–11. [Google Scholar]
- Cooper, MJ; Hutchins, GM; Mennie, RJ; Israel, MA. Beta 2-microglobulin expression in human embryonal neuroblastoma reflects its developmental regulation. Cancer Res 1990, 50, 3694–3700. [Google Scholar]
- Suzuki, T; Higgins, PJ; Crawford, DR. Control selection for RNA quantitation. Biotechniques 2000, 29, 332–337. [Google Scholar]
- Warrington, JA; Nair, A; Mahadevappa, M; Tsyganskaya, M. Comparison of human adult and fetal expression and identification of 535 housekeeping/maintenance genes. Physiol Genomics 2000, 2, 143–147. [Google Scholar]
- Coulson, DT; Brockbank, S; Quinn, JG; Murphy, S; Ravid, R; Irvine, GB; Johnston, JA. Identification of valid reference genes for the normalization of RT qPCR gene expression data in human brain tissue. BMC Mol Biol 2008, 9, 46. [Google Scholar]
- Dheda, K; Huggett, JF; Bustin, SA; Johnson, MA; Rook, G; Zumla, A. Validation of housekeeping genes for normalizing RNA expression in real-time PCR. Biotechniques 2004, 37, 112–119. [Google Scholar]
- Gebhardt, FM; Scott, HA; Dodd, PR. Housekeepers for accurate transcript expression analysis in Alzheimer’s disease autopsy brain tissue. Alzheimers Dement 2010, 6, 465–474. [Google Scholar]
- Soucek, T; Cumming, R; Dargusch, R; Maher, P; Schubert, D. The regulation of glucose metabolism by HIF-1 mediates a neuroprotective response to amyloid beta peptide. Neuron 2003, 39, 43–56. [Google Scholar]
- Tsuchiya, K; Tajima, H; Yamada, M; Takahashi, H; Kuwae, T; Sunaga, K; Katsube, N; Ishitani, R. Disclosure of a pro-apoptotic glyceraldehyde-3-phosphate dehydrogenase promoter: Anti-dementia drugs depress its activation in apoptosis. Life Sci 2004, 74, 3245–3258. [Google Scholar]
- Bustin, SA. Why the need for qPCR publication guidelines? The case for MIQE. Methods 2010, 50, 217–226. [Google Scholar]
- Vandesompele, J; De Preter, K; Pattyn, F; Poppe, B; van Roy, N; De Paepe, A; Speleman, F. Accurate normalization of real-time quantitative RT-PCR data by geometric averaging of multiple internal control genes. Genome Biol 2002, 3, RESEARCH0034. [Google Scholar]
- Andersen, CL; Jensen, JL; Orntoft, TF. Normalization of real-time quantitative reverse transcription-PCR data: A model-based variance estimation approach to identify genes suited for normalization, applied to bladder and colon cancer data sets. Cancer Res 2004, 64, 5245–5250. [Google Scholar]
- Strube, C; Buschbaum, S; Wolken, S; Schnieder, T. Evaluation of reference genes for quantitative real-time PCR to investigate protein disulfide isomerase transcription pattern in the bovine lungworm Dictyocaulus viviparus. Gene 2008, 425, 36–43. [Google Scholar]
- Van Hiel, MB; van Wielendaele, P; Temmerman, L; van Soest, S; Vuerinckx, K; Huybrechts, R; Broeck, JV; Simonet, G. Identification and validation of housekeeping genes in brains of the desert locust Schistocerca gregaria under different developmental conditions. BMC Mol Biol 2009, 10, 56. [Google Scholar]
- Nolan, T; Hands, RE; Bustin, SA. Quantification of mRNA using real-time RT-PCR. Nat Protoc 2006, 1, 1559–1582. [Google Scholar]
- Wierschke, S; Gigout, S; Horn, P; Lehmann, TN; Dehnicke, C; Bräuer, AU; Deisz, RA. Evaluating reference genes to normalize gene expression in human epileptogenic brain tissues. Biochem Biophys Res Commun 2010, 403, 385–390. [Google Scholar]

| Case Number | Sex | Diagnosis | Age (Y.O.) | Postmortem Delay (Hours) | Death Status | Area |
|---|---|---|---|---|---|---|
| Control | ||||||
| 90–234 | M | Prostatic carcinoma | 77 | 5 | Cognitively Normal | FC |
| CTR 3 | ND | Heart Infarct | 65 | 10 | Cognitively Normal | FC |
| A93–300 | M | Control | 88 | 4 | Cognitively Normal | TC |
| CTR7 | ND | Lung disease | 69 | 7 | Cognitively Normal | ND |
| 0916 | ND | Control | 70 | ND | Cognitively Normal | ND |
| CTR 8 | ND | Control | ND | ND | Cognitively Normal | ND |
| A94–207 | M | Multiple infarct basal ganglia | 86 | 4 | Cognitively Normal | ND |
| AD cases | ||||||
| 801 | ND | AD | 78 | ND | Dementia | ND |
| AD02–011 | ND | AD | 64 | 14 | Dementia | ND |
| AD 94–382 | ND | AD | 81 | 2.05 | Dementia | TC |
| AD 007 | ND | AD | 69 | ND | Dementia | ND |
| AD171 | ND | AD | 87 | 15 | Dementia | ND |
| 969 | F | AD | 82 | 1.05 | Dementia | FC |
| 977 | M | AD | 80 | 6.03 | Dementia | FC |
| A92–404 | M | AD | 69 | 6.05 | Dementia | TC |
| geNorm | NormFinder | |||||
|---|---|---|---|---|---|---|
| Gene name | Gene symbol | Genebank accession | Ranking order | Average M value | Ranking order | Stability value |
| Topoisomerase (DNA) I | TOP1 | NM_003286.2 | 1 | 0.75 | 6 | 0.577 |
| Beta-2-microglobulin | B2M | NM_004048.2 | 1 | 0.75 | 11 | 0.651 |
| Eukaryotic translation initiation factor 4A2 | EIF4A2 | NM_001967.3 | 3 | 0.84 | 2 | 0.218 |
| Ribosomal protein L13a | RPL13A | NM_012423.2 | 4 | 0.9 | 8 | 0.596 |
| Cytochrome c-1 | CYC1 | NM_001916.3 | 5 | 1.01 | 1 | 0.217 |
| Actin, beta | ACTB | NM_001101.3 | 6 | 1.09 | 5 | 0.413 |
| Succinate dehydrogenase complex, subunit A, flavoprotein (Fp) | SDHA | NM_004168.2 | 7 | 1.22 | 4 | 0.365 |
| Ubiquitin C | UBC | NM_021009.5 | 8 | 1.29 | 6 | 0.577 |
| Glyceraldehyde-3-phosphate dehydrogenase | GAPDH | NM_002046.3 | 9 | 1.33 | 10 | 0.623 |
| Tyrosine 3-monooxygenase/tryptophan 5-monooxygenase activation protein, zeta polypeptide | YWHAZ | NM_001135699.1 | 10 | 1.4 | 3 | 0.347 |
| ATP synthase, H+ transporting, mitochondrial F1 complex, beta polypeptide | ATP5B | NM_001686.3 | 11 | 1.46 | 12 | 0.683 |
| RNA, 18S ribosomal 1 | RN18S1 | NR_003286.2 | 12 | 1.57 | 9 | 0.621 |
© 2011 by the authors; licensee MDPI, Basel, Switzerland. This article is an open-access article distributed under the terms and conditions of the Creative Commons Attribution license (http://creativecommons.org/licenses/by/3.0/).
Share and Cite
Penna, I.; Vella, S.; Gigoni, A.; Russo, C.; Cancedda, R.; Pagano, A. Selection of Candidate Housekeeping Genes for Normalization in Human Postmortem Brain Samples. Int. J. Mol. Sci. 2011, 12, 5461-5470. https://doi.org/10.3390/ijms12095461
Penna I, Vella S, Gigoni A, Russo C, Cancedda R, Pagano A. Selection of Candidate Housekeeping Genes for Normalization in Human Postmortem Brain Samples. International Journal of Molecular Sciences. 2011; 12(9):5461-5470. https://doi.org/10.3390/ijms12095461
Chicago/Turabian StylePenna, Ilaria, Serena Vella, Arianna Gigoni, Claudio Russo, Ranieri Cancedda, and Aldo Pagano. 2011. "Selection of Candidate Housekeeping Genes for Normalization in Human Postmortem Brain Samples" International Journal of Molecular Sciences 12, no. 9: 5461-5470. https://doi.org/10.3390/ijms12095461