Detecting Molecular Features of Spectra Mainly Associated with Structural and Non-Structural Carbohydrates in Co-Products from BioEthanol Production Using DRIFT with Uni- and Multivariate Molecular Spectral Analyses

Abstract
:1. Introduction
2. Results and Discussion
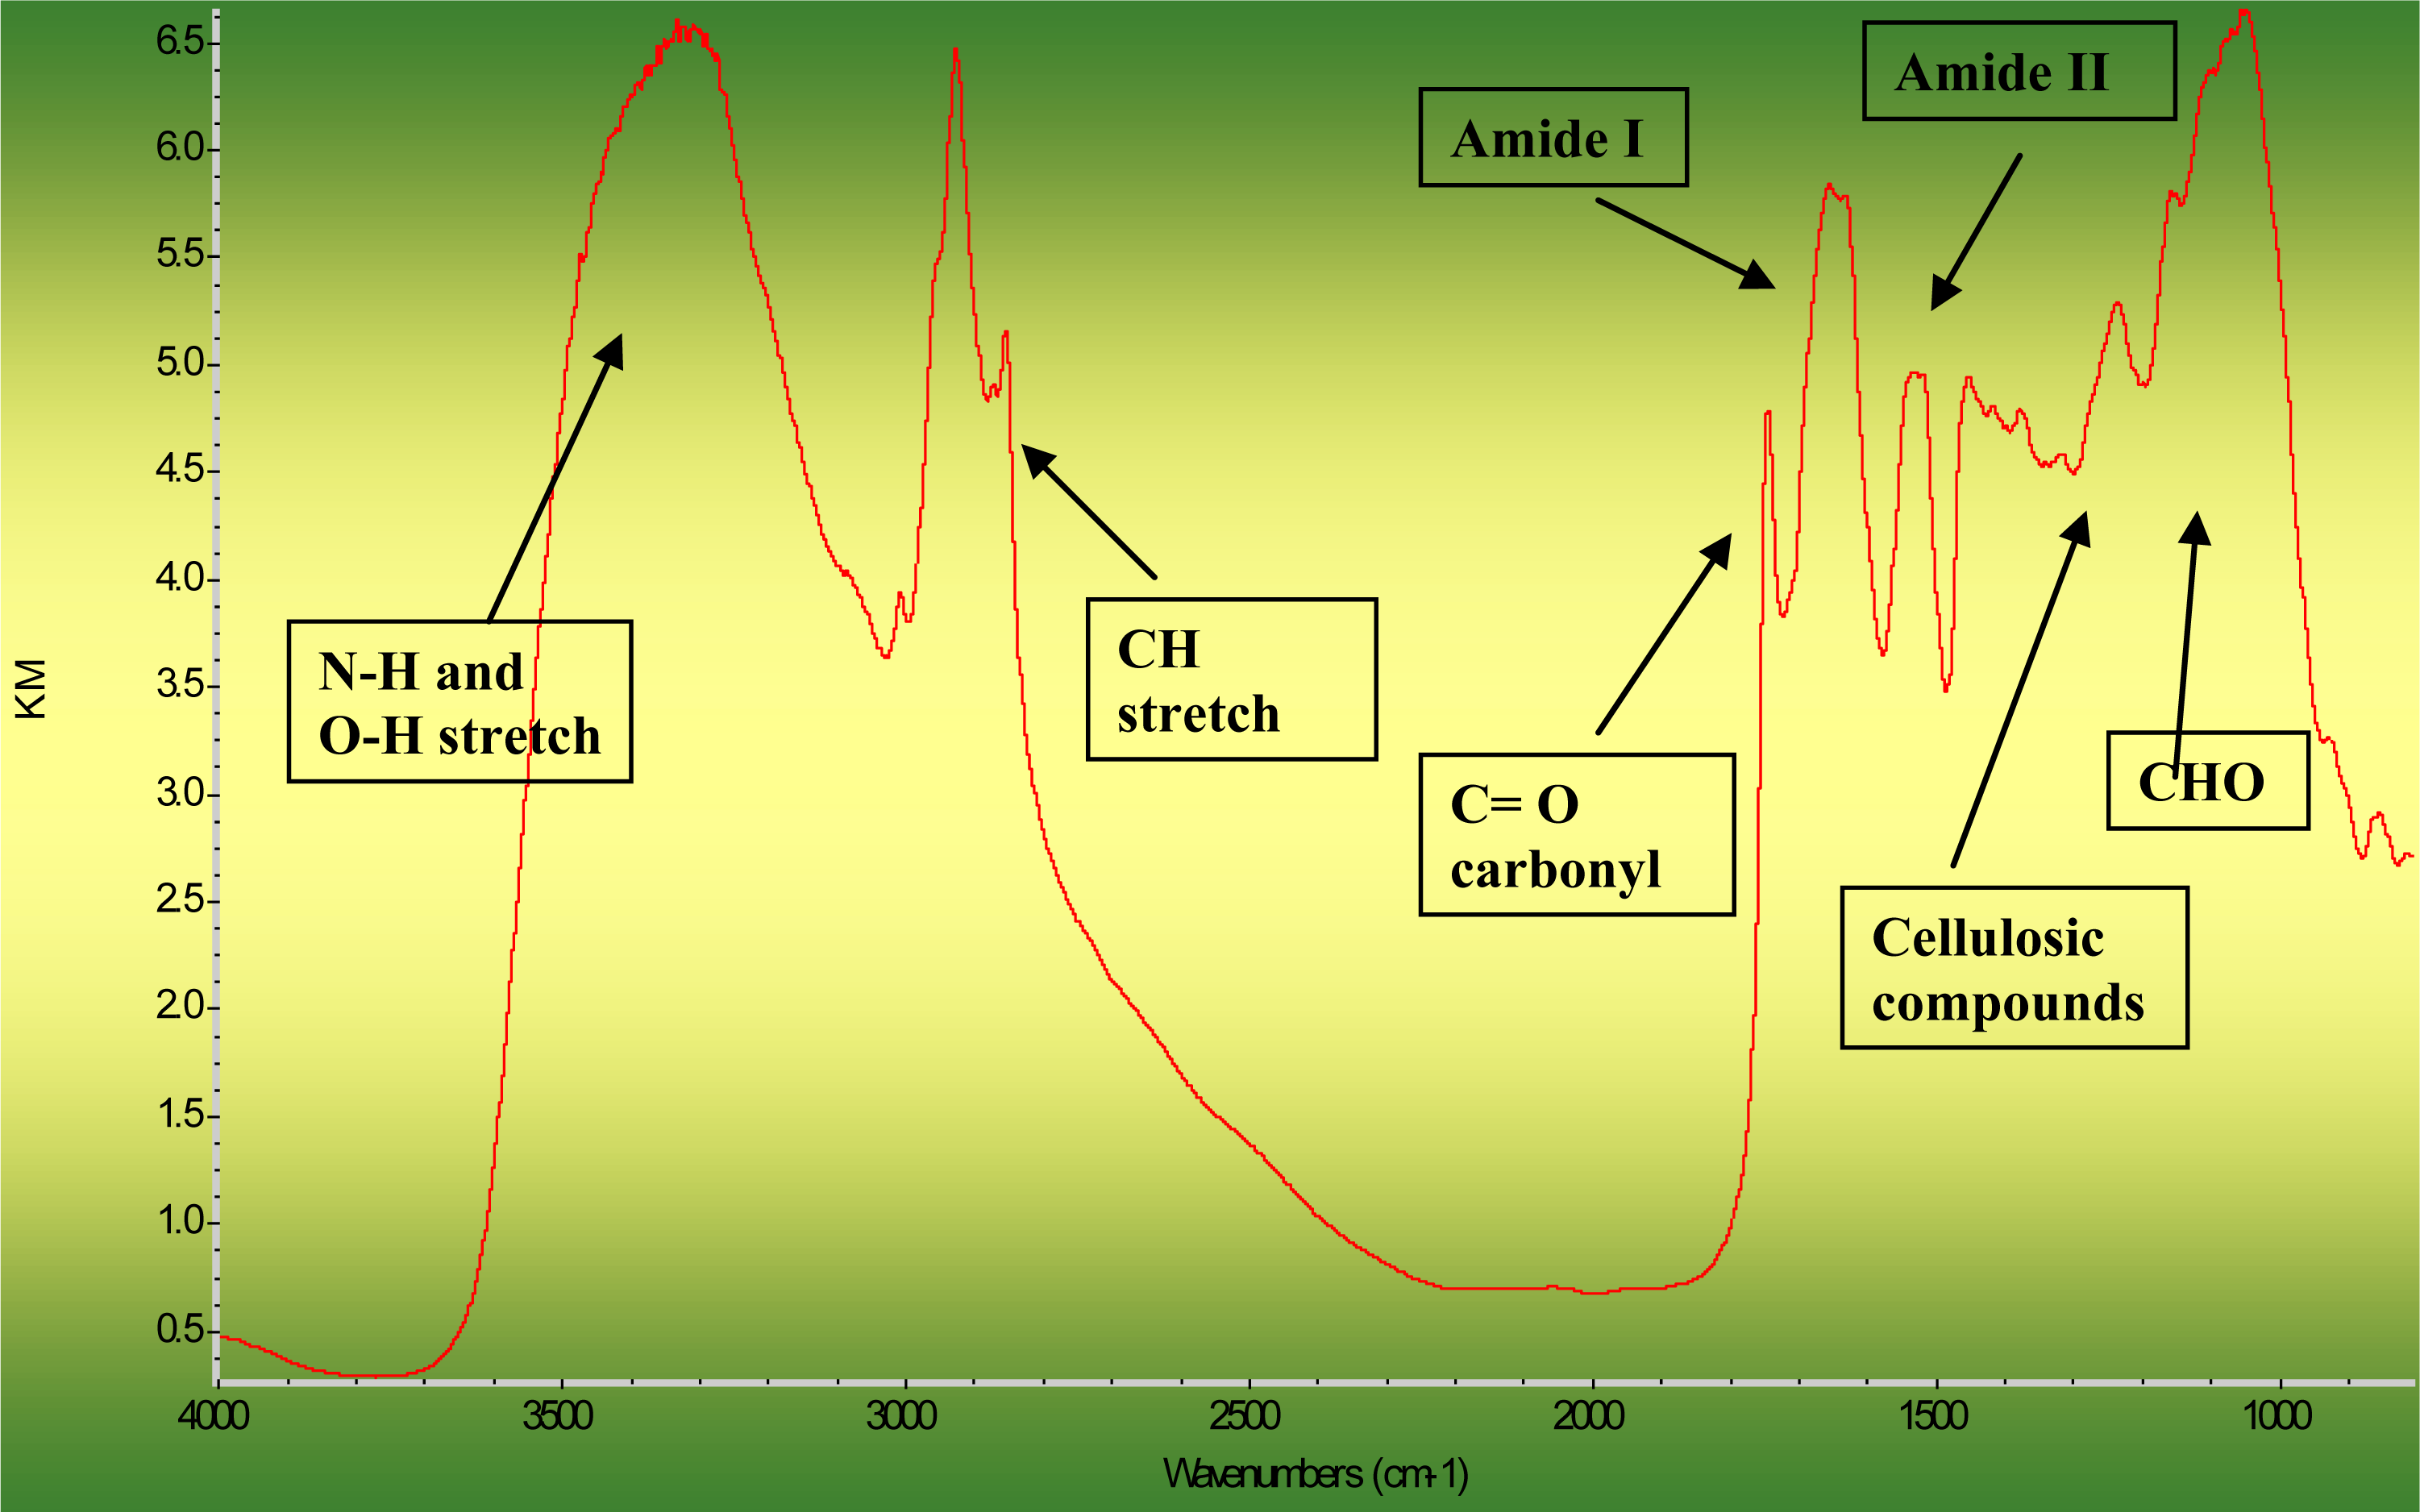
2.1. Carbohydrate Related Molecular Spectroscopic Features
2.2. Detect Changes in Carbohydrate Molecular Structure Changes by Bioethanol Processing
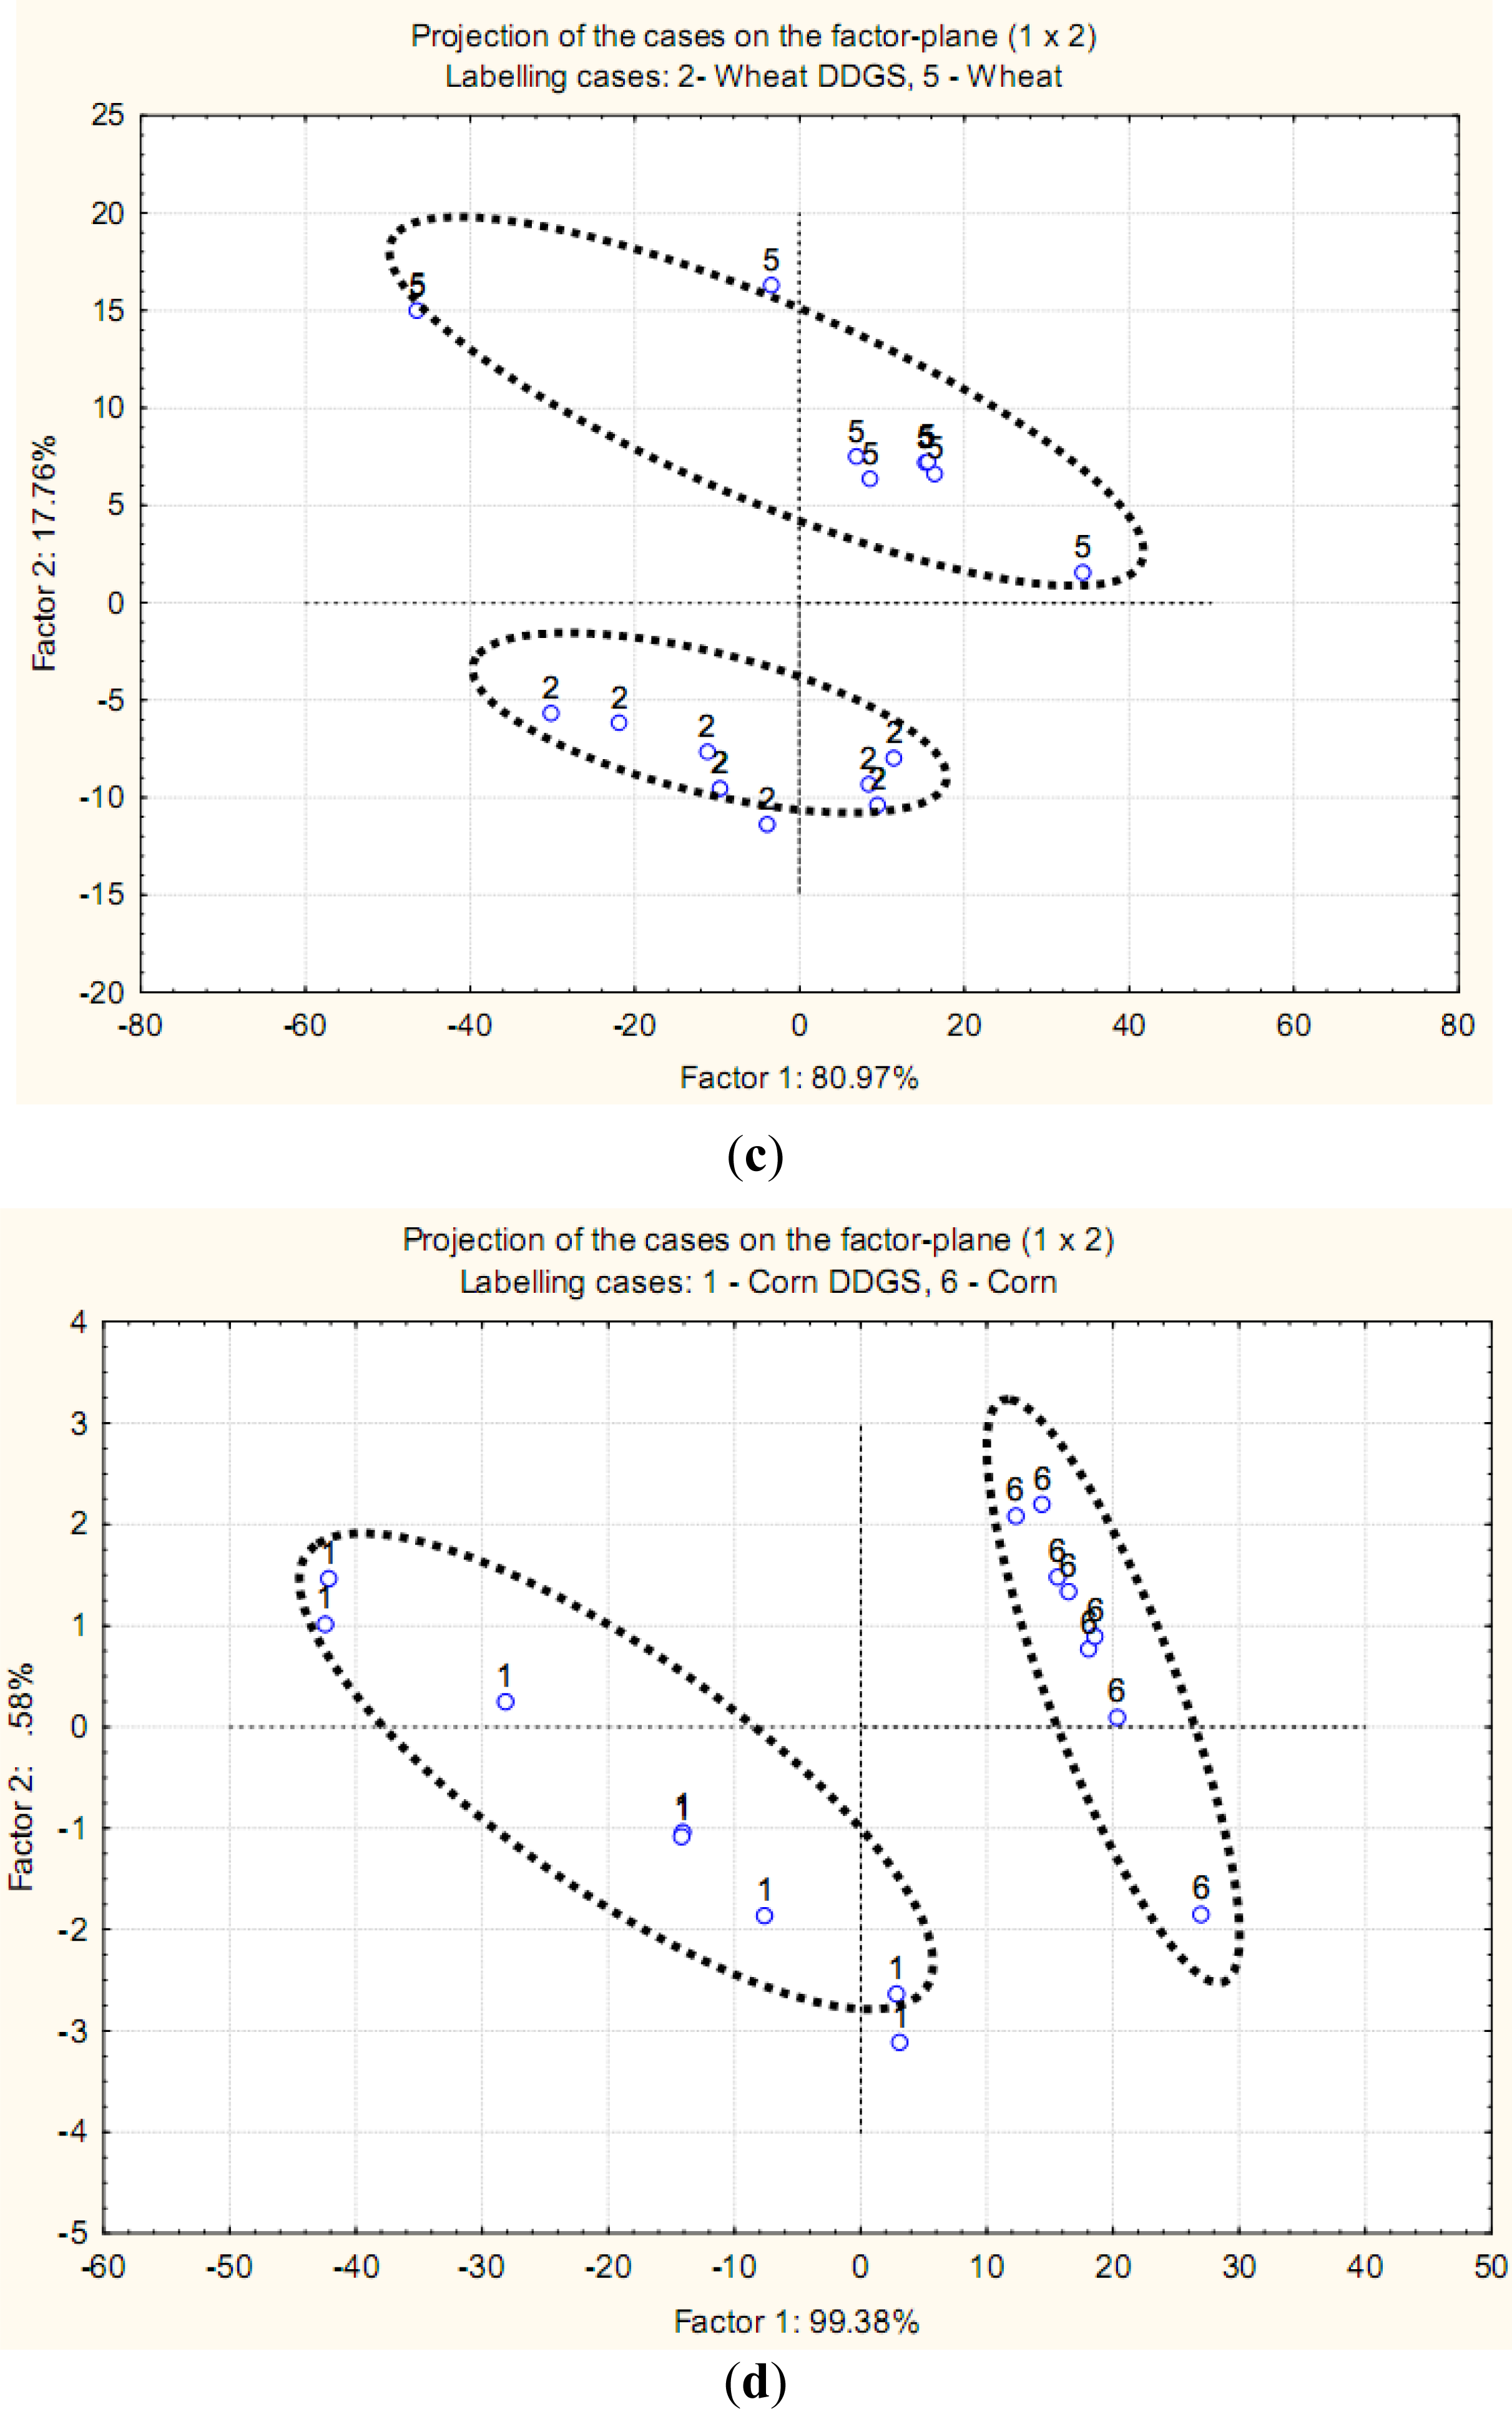
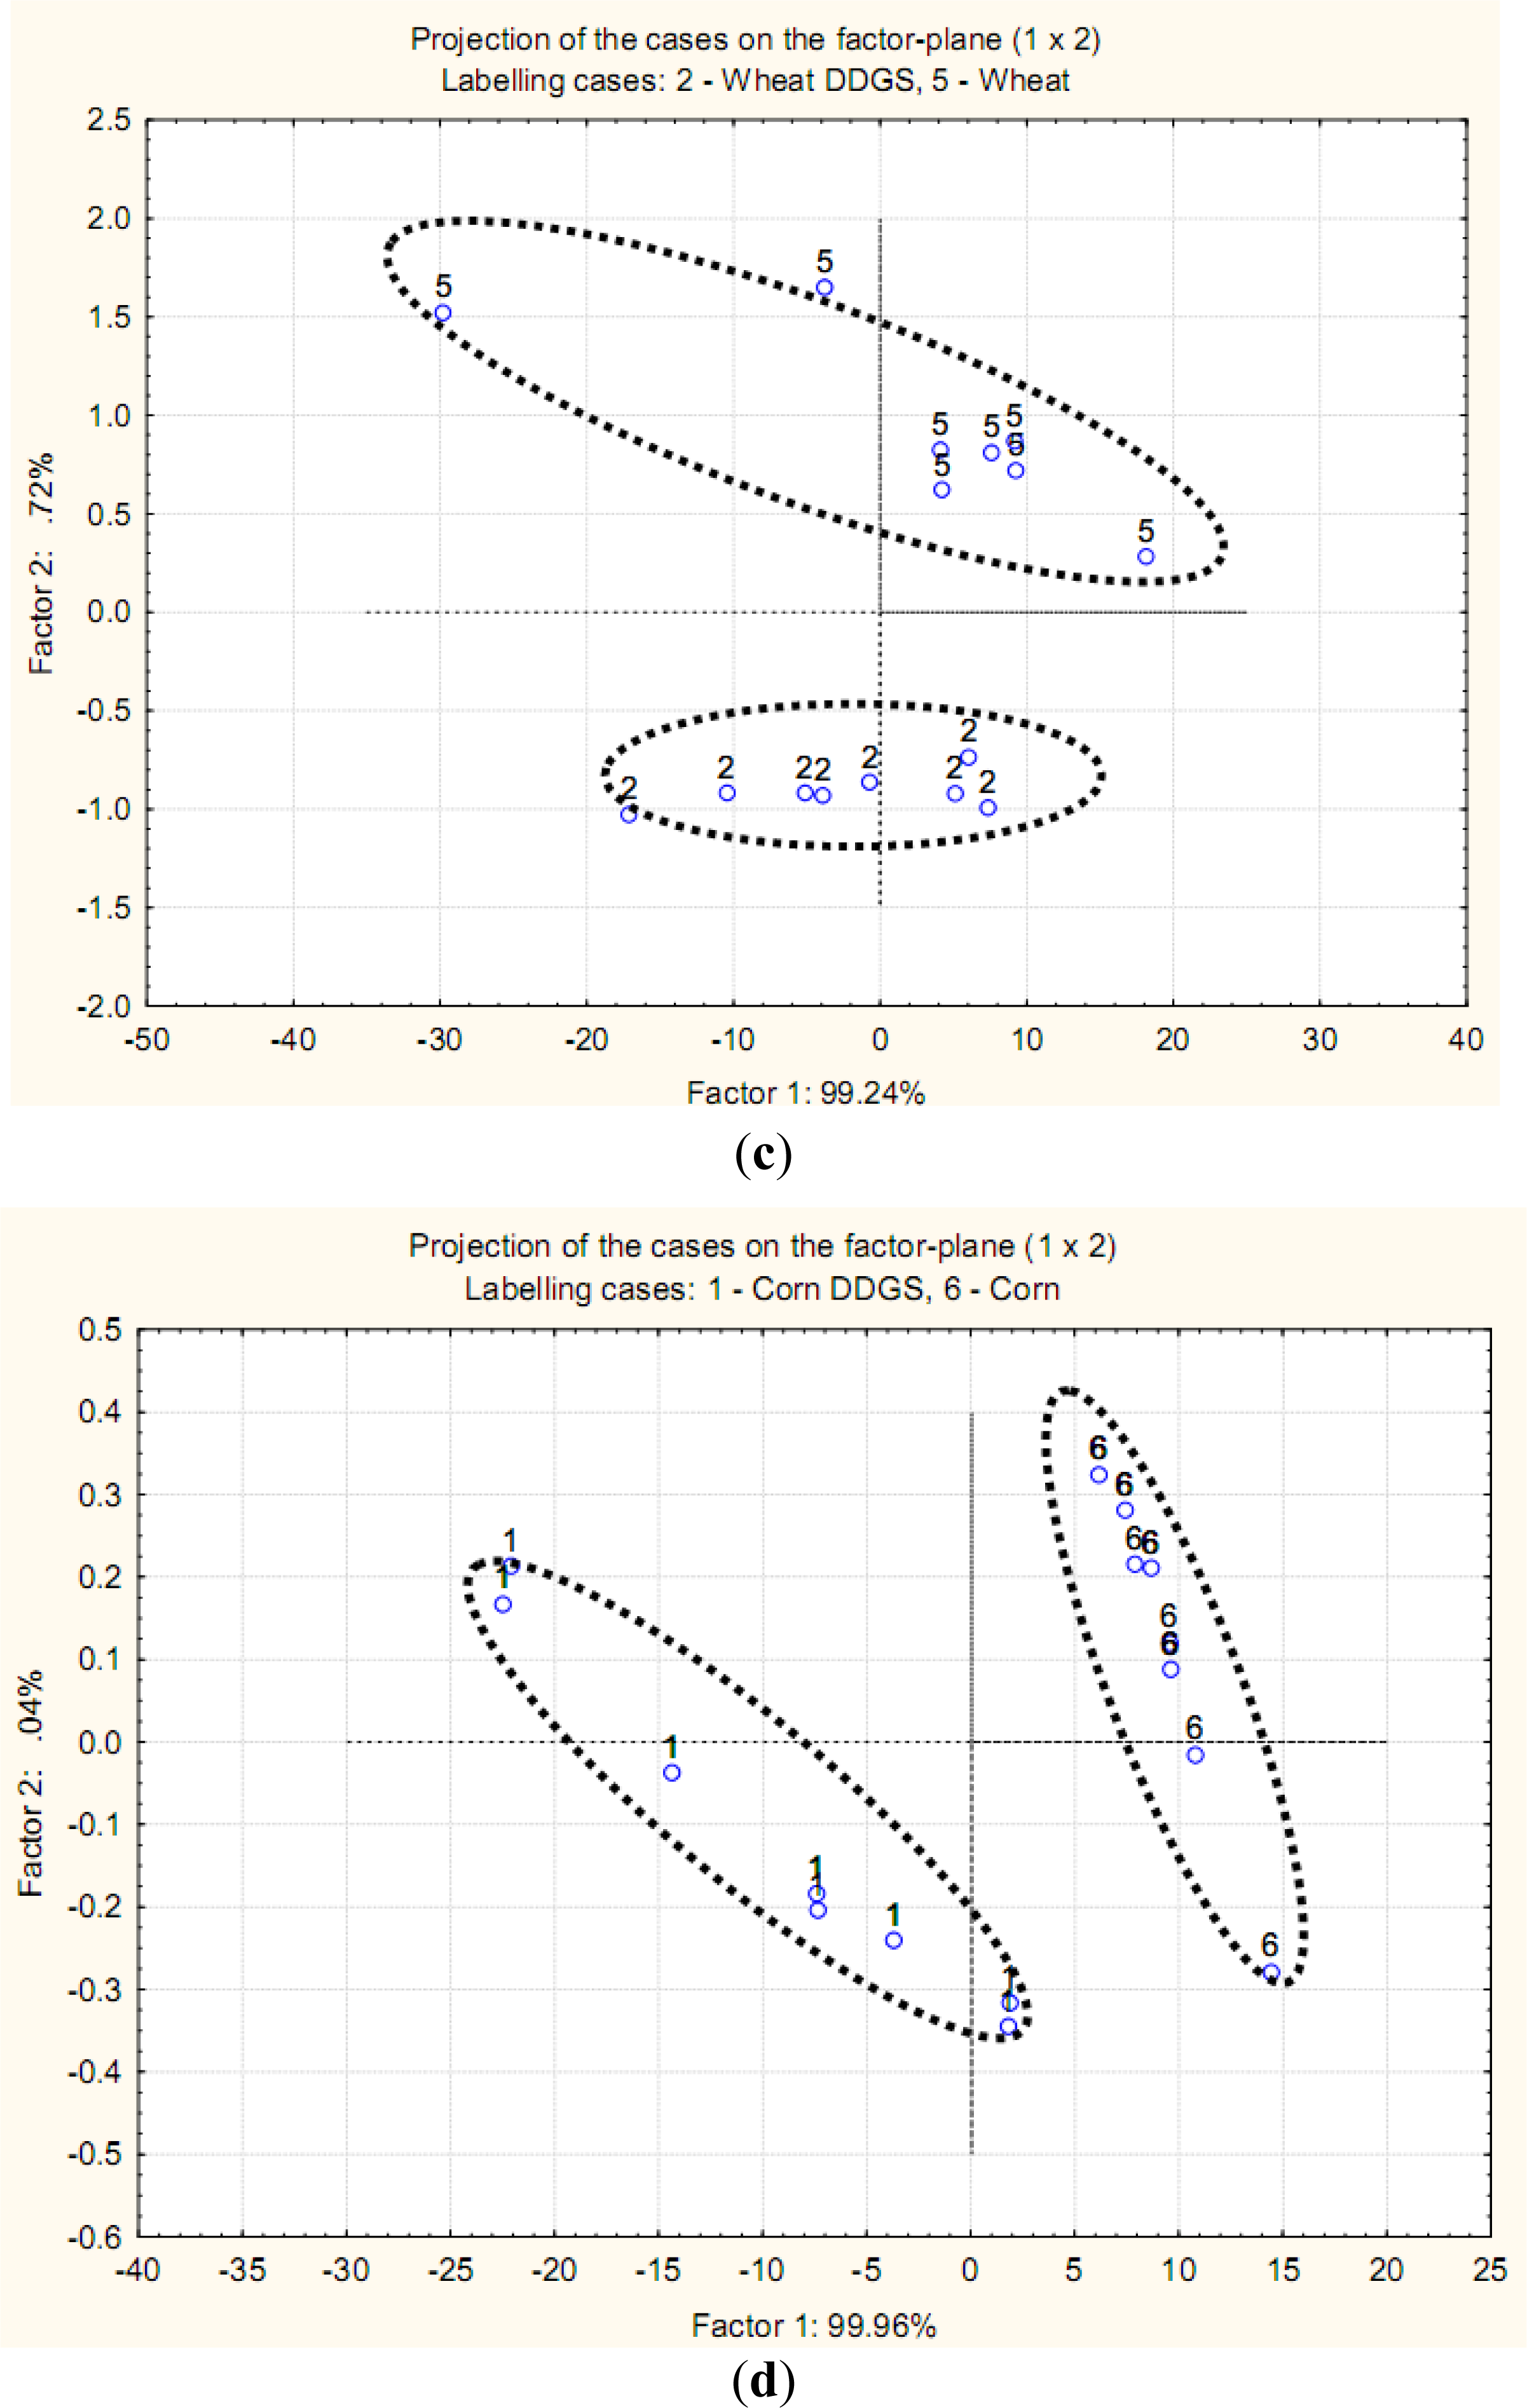
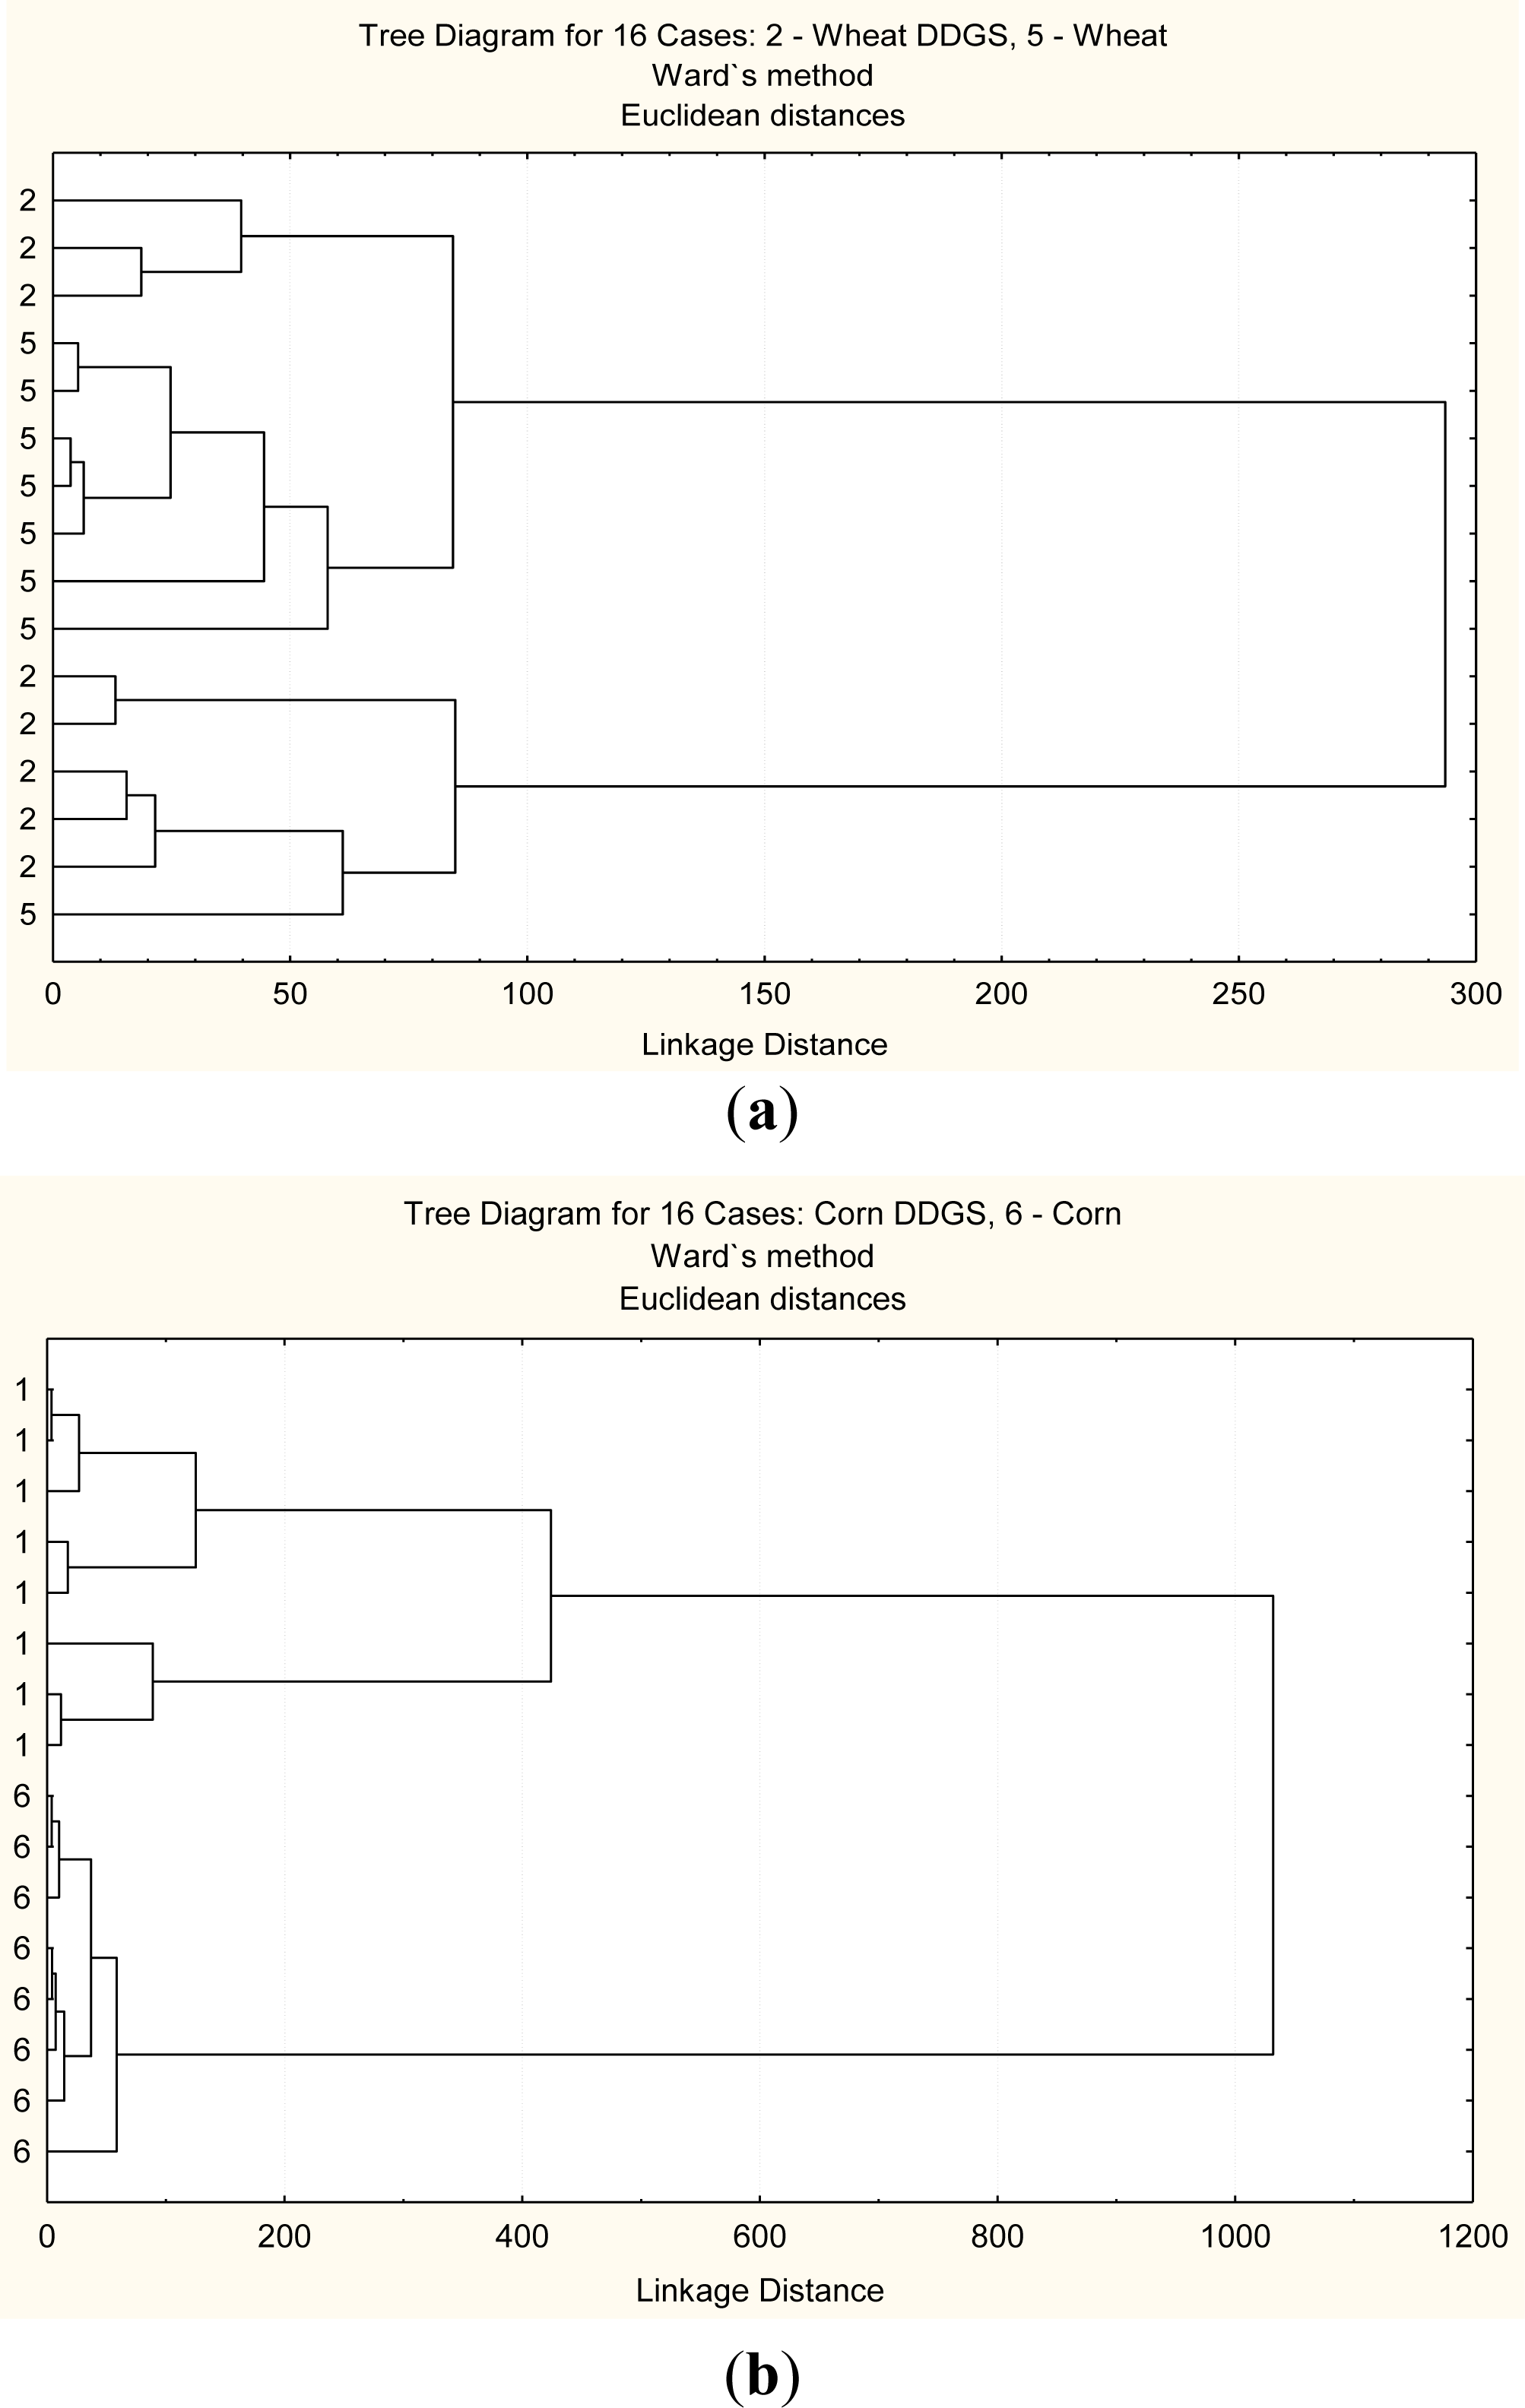
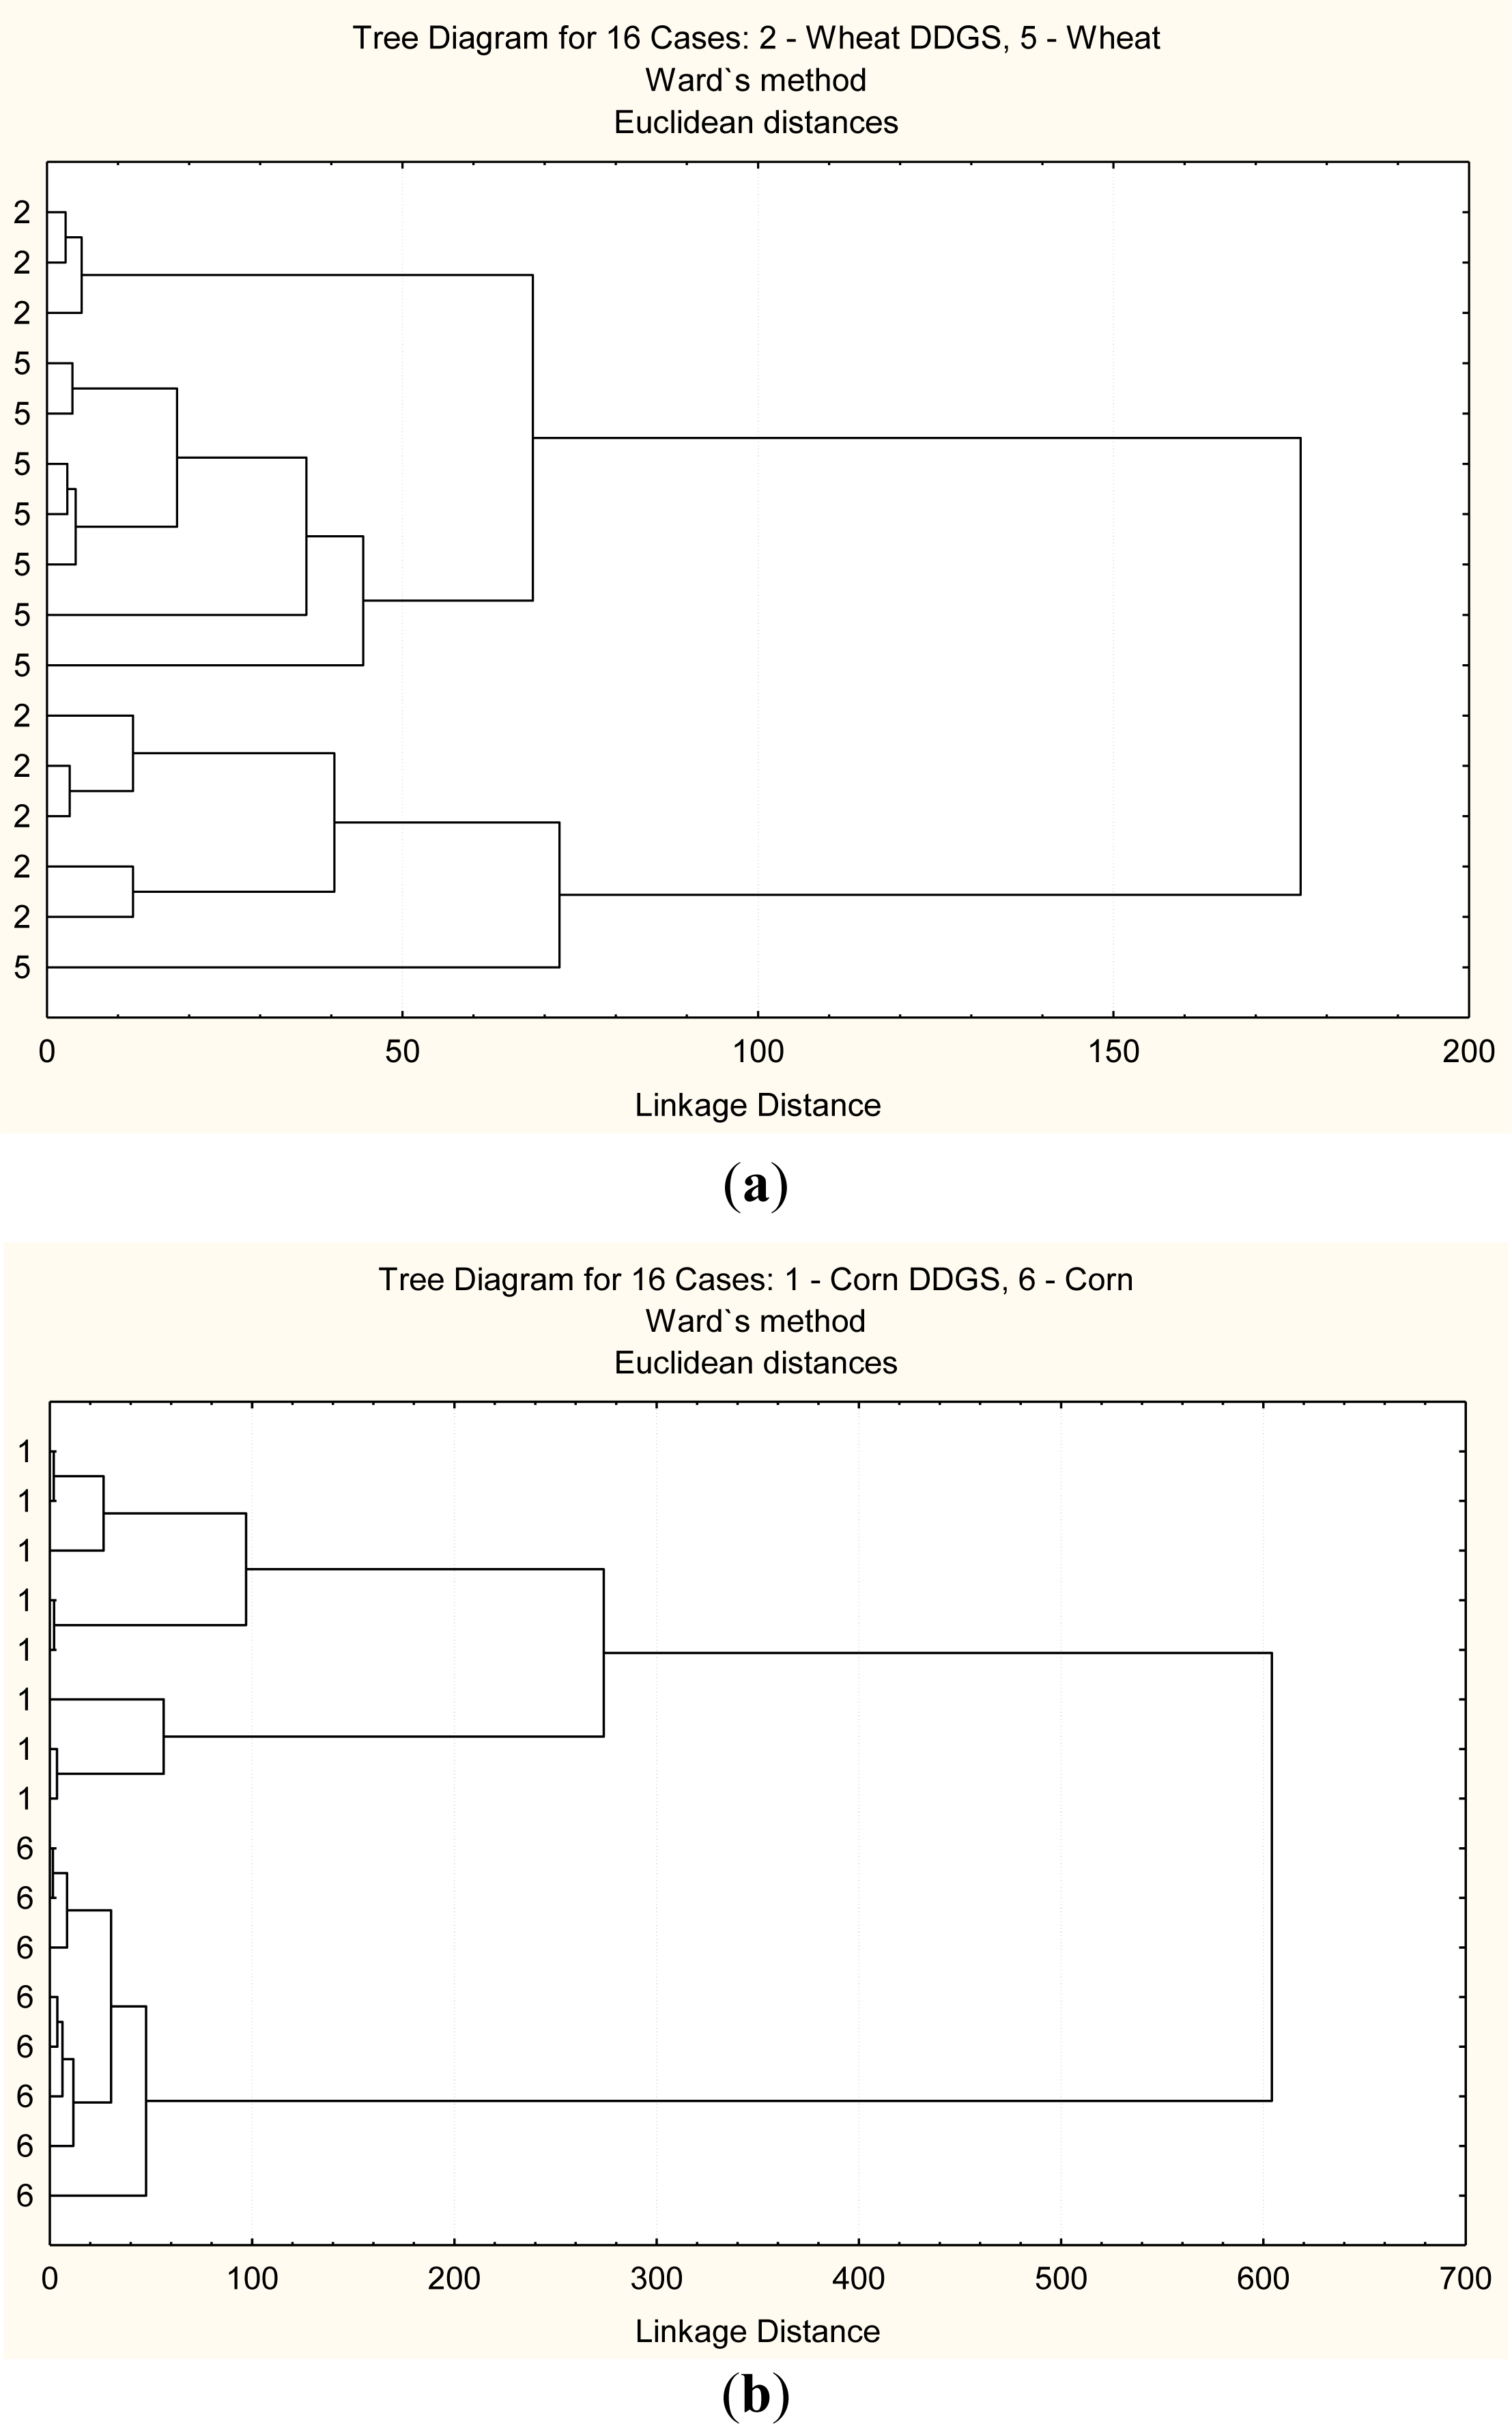
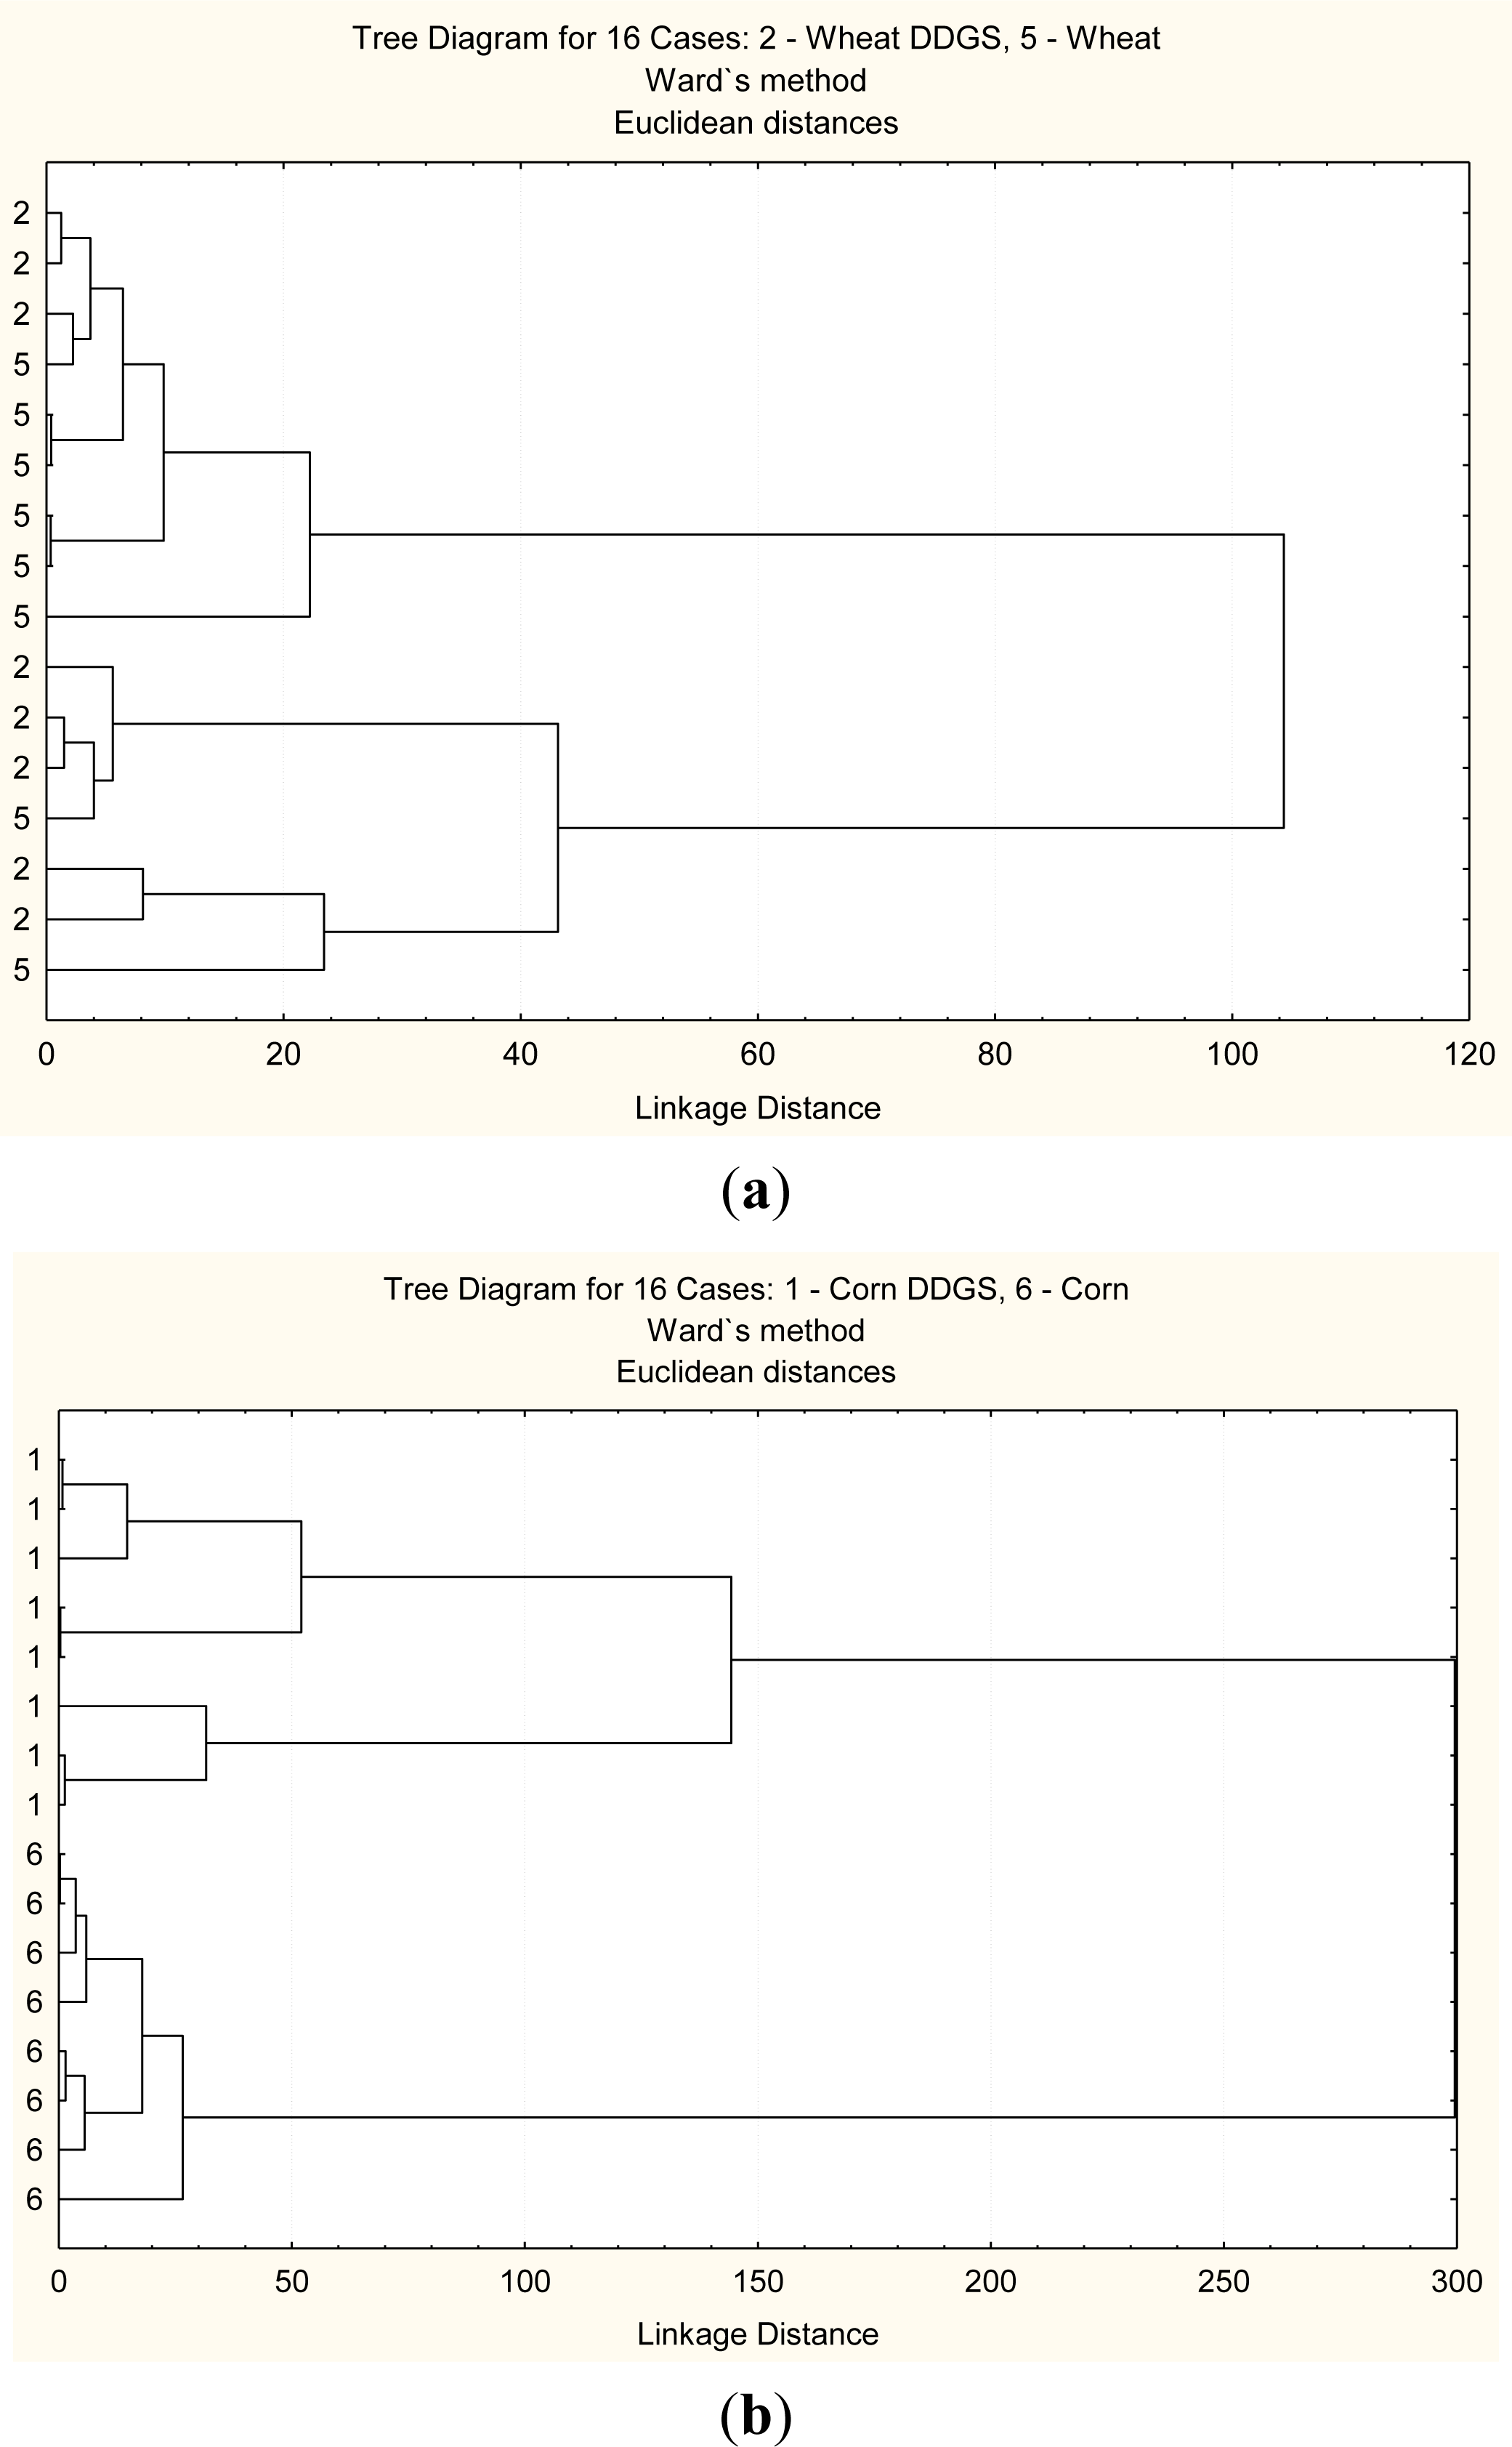
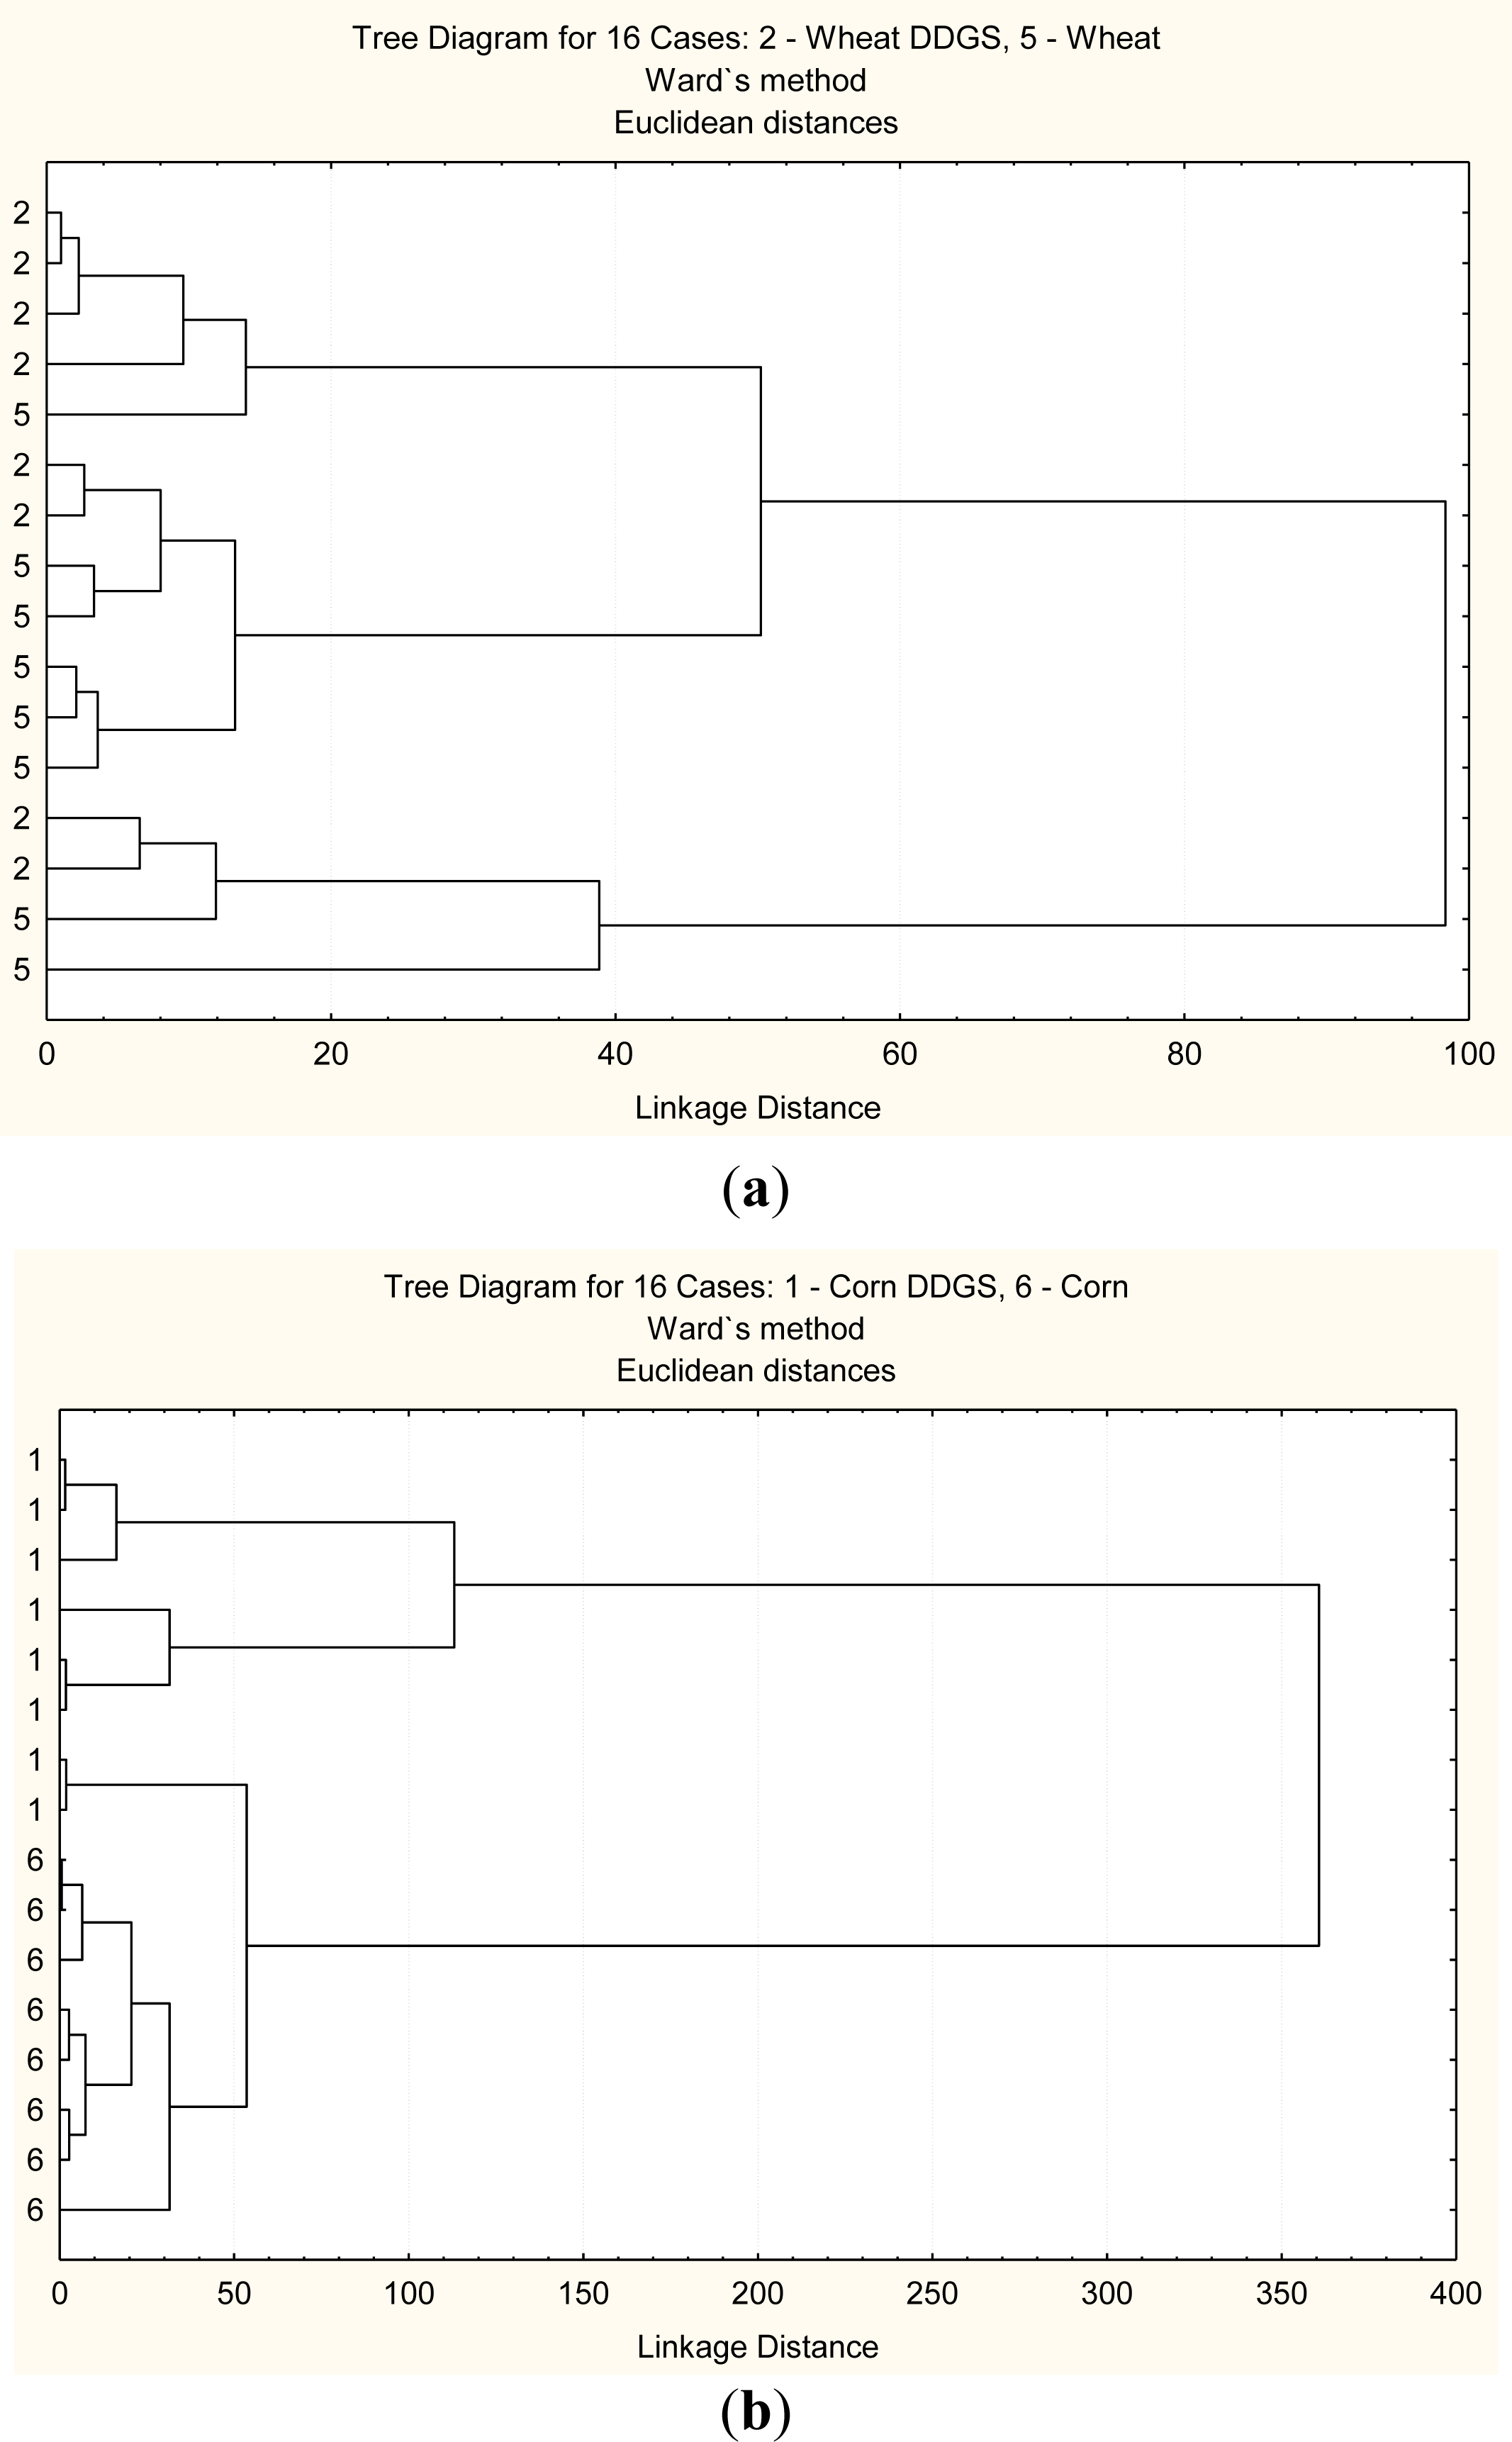
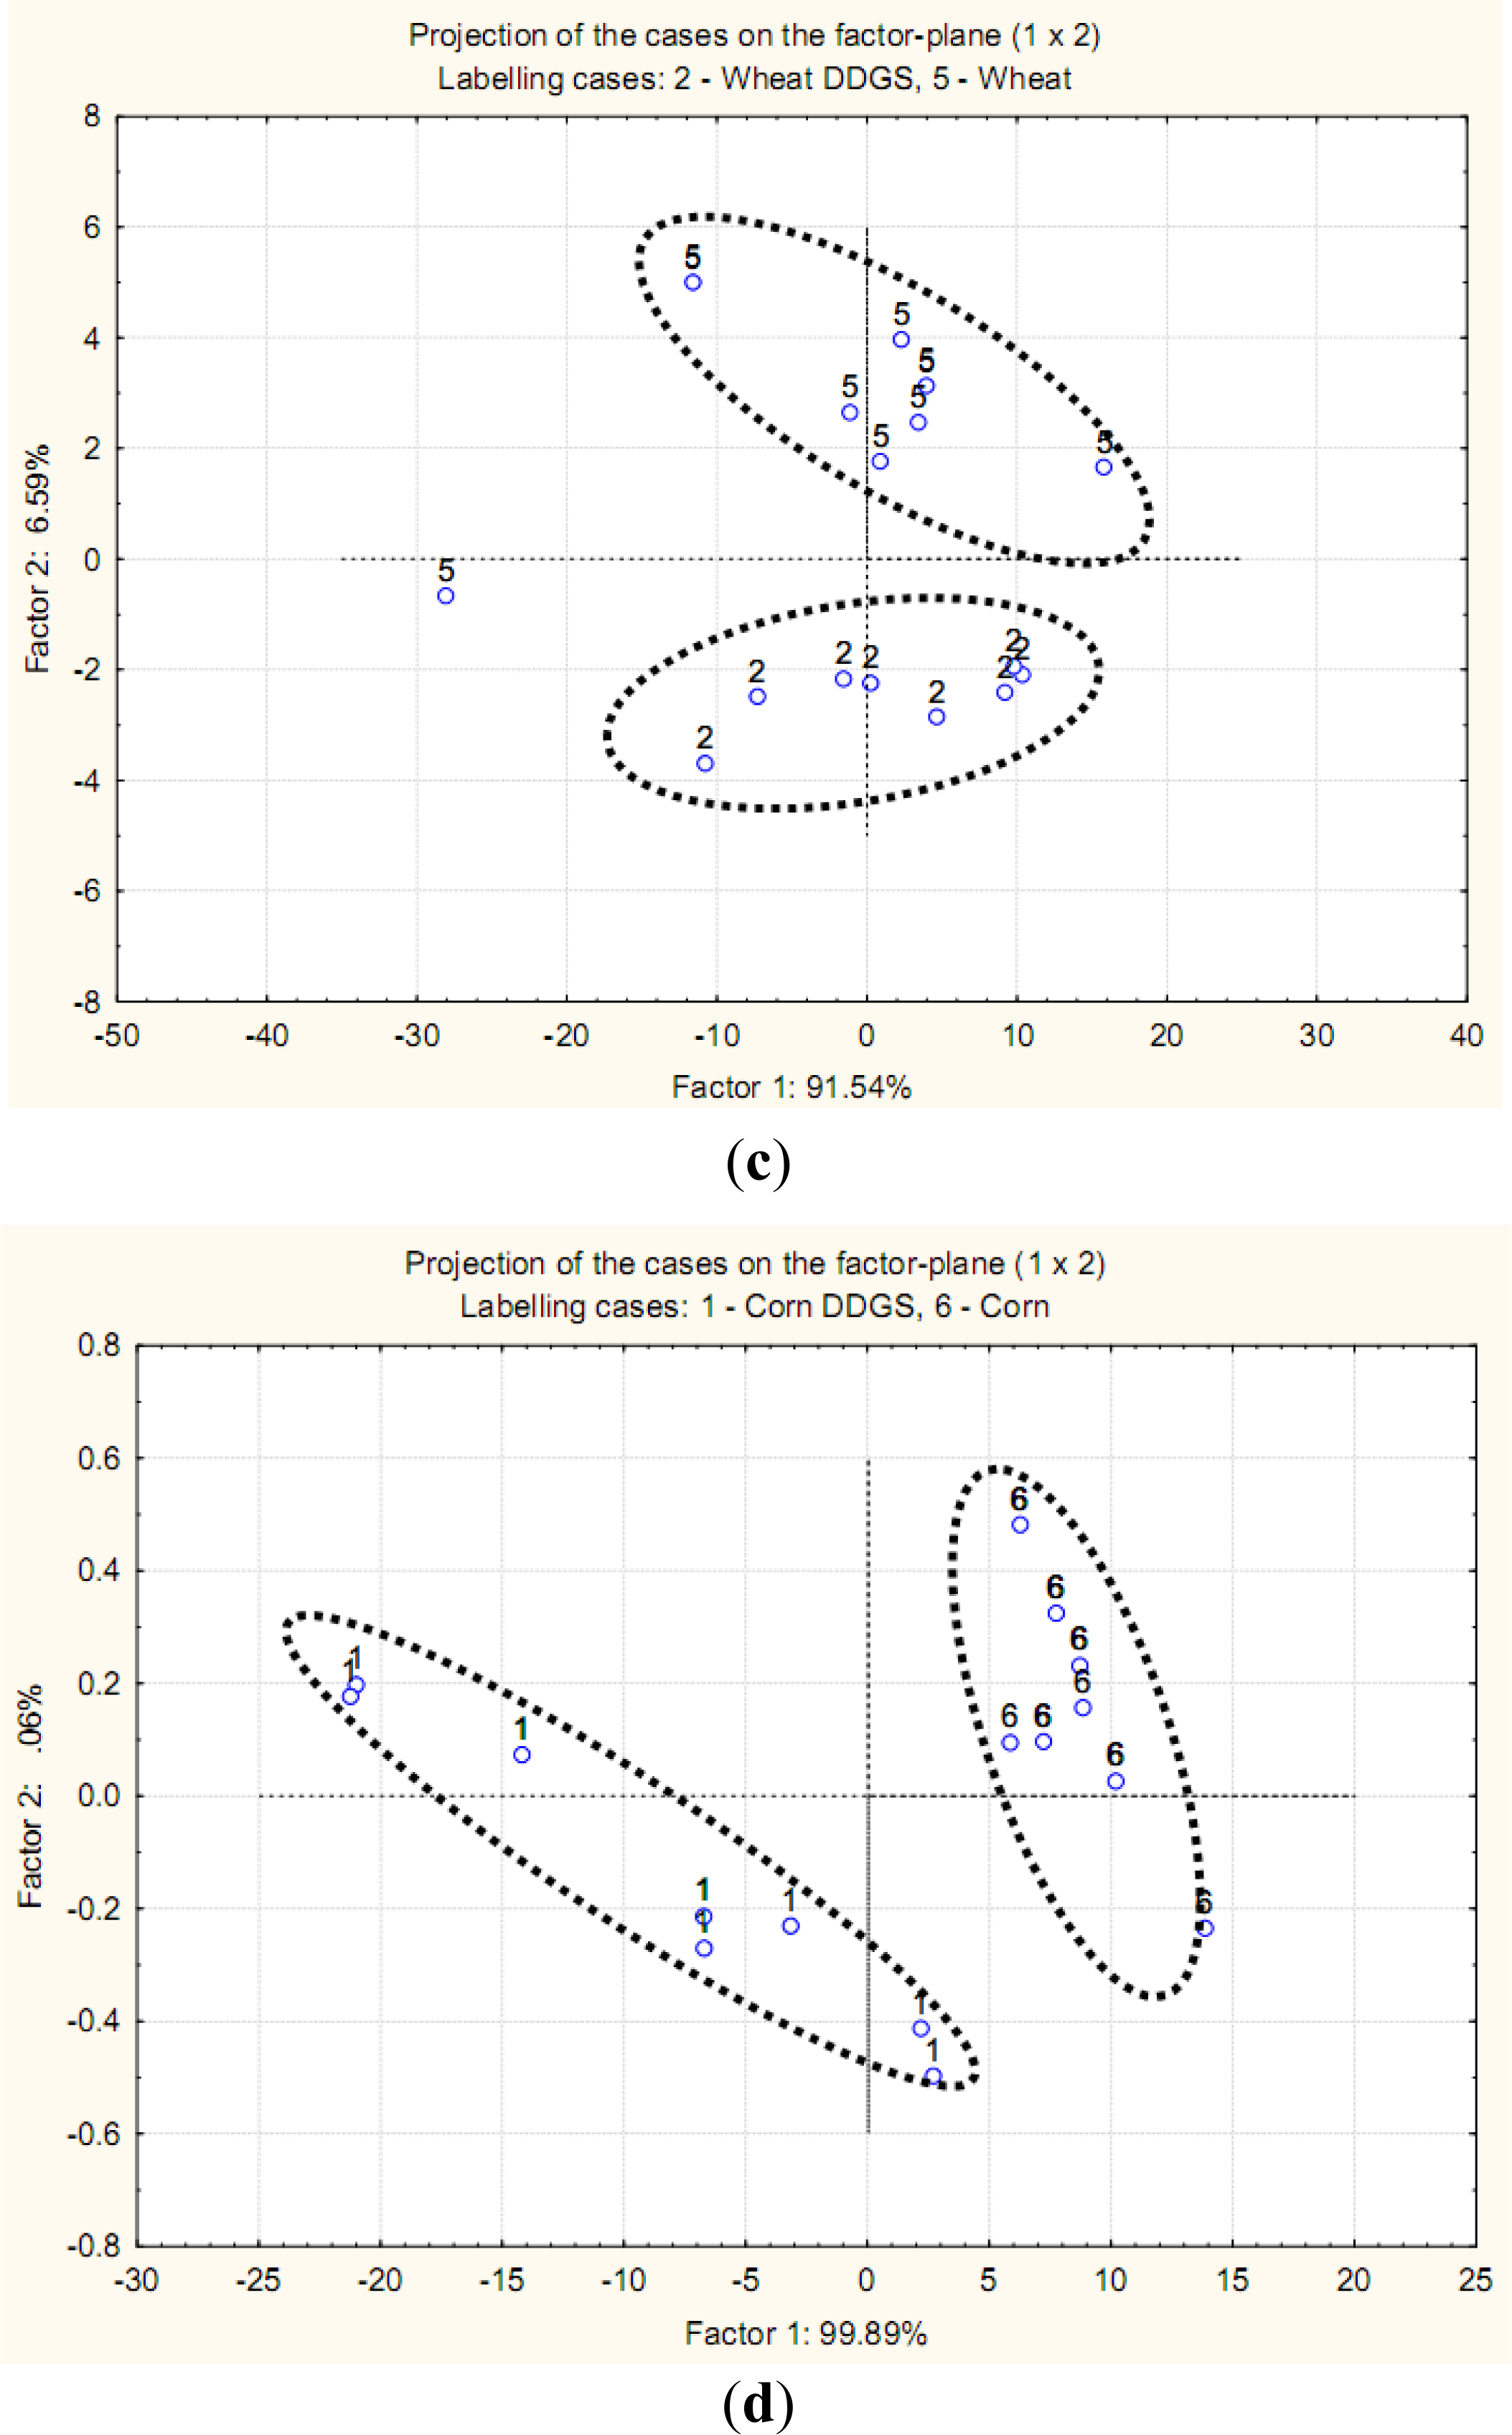
2.3. Discriminate and Classify Carbohydrate Molecular Structure
- Region 1 is the mid-infrared region ca. 4000–827 cm−1;
- Region 2 is the fingerprint region ca. 1800–827 cm−1;
3. Experimental Section
3.1. Co-Products from Bioethanol Production
3.2. Infrared Spectroscopy
3.3. Molecular Spectral Analysis of Carbohydrates
3.4. Statistical Analysis
3.5. Multivariate Molecular Spectral Analysis for DRIFT Spectra
4. Conclusion
Acknowledgments
References
- Nuez-Ortín, WG; Yu, P. Nutrient variation and availability of wheat DDGS, corn DDGS and blend DDGS from bioethanol plants. J. Sci. Food Agric 2009, 89, 1754–1761. [Google Scholar]
- Nuez-Ortín, WG; Yu, P. Comparison of the NRC 2001 model with the DVE/OEB system in modeling the metabolic characteristics of the proteins in dairy cattle from new co-products from bio-ethanol processing. J. Sci. Food Agric 2011, 91, 405–411. [Google Scholar]
- Nuez-Ortín, WG; Yu, P. Effects of bioethanol plant and co-products type on the metabolic characteristics of the proteins. J. Dairy Sci 2010, 93, 3775–3783. [Google Scholar]
- Nuez-Ortín, WG; Yu, P. Estimation of ruminal and intestinal digestion profiles, hourly degradation ratio and potential nitrogen to energy synchronization of co-products of bioethanol production. J. Sci. Food Agric 2010, 90, 2058–2067. [Google Scholar]
- Yu, P; Niu, Z; Damiran, D. Protein molecular structures and protein fraction profiles of new co-products of bioethanol production: A novel approach. J. Agric. Food Chem 2010, 58, 3460–3464. [Google Scholar]
- Yu, P; Nuez-Ortín, WG. Relationship between protein molecular structures and metabolisable proteins in different types of dried distillers grains with solubles: A novel approach. Br. J. Nutr 2010, 101, 1429–1437. [Google Scholar]
- Mathlouthi, M; Koenig, JL. Vibrational Spectra of Carbohydrates. Adv. Carbohydr. Chem. Biochem 1986, 44, 7–89. [Google Scholar]
- Wetzel, DL; Eilert, AJ; Pietrzak, LN; Miller, SS; Sweat, JA. Ultraspatially resolved synchrotron infrared microspectroscopy of plant tissue in situ. Cell. Mol. Bio 1998, 44, 145–167. [Google Scholar]
- Wetzel, DL. When molecular Causes of wheat quality are known, molecular methods will supercede traditional methods. Proceeding of 2nd International Wheat Quality Conference, New York, NY, USA; 2001; pp. 1–20. [Google Scholar]
- Yu, P; Christensen, CR; Christensen, DA; McKinnon, JJ. Ultrastructural-chemical makeup of yellow-(Brassica Rapa) and brown-seeded (Brassica Napus) canola within cellular dimensions, explored with synchrotron reflection FTIR microspectroscopy. Can. J. Plant Sci 2005, 85, 533–541. [Google Scholar]


| Molecular characteristics (IR KM intensity unit) | ||||||||||
|---|---|---|---|---|---|---|---|---|---|---|
| Grain | Co-products | |||||||||
| Items | Peak type | Peak center (cm−1) | Region (cm−1) | Baseline (cm−1) | Wheat (n = 8) | Corn (n = 8) | Wheat DDGS (n = 16) | Corn DDGS (n = 8) | Blend DDGS (n = 8) | SEM |
| Based on the peak area | ||||||||||
| A_Cell | Peak area | – | 1485–1188 | 1485–1188 | 260.5 a b | 179.7 b | 210.8 a,b | 240.0 a,b | 273.0 a | 21.14 |
| A_1240 | Peak area | ca. 1240 | 1292–1198 | 1292–1198 | 10.9 c | 6.1 c | 30.5 b | 44.1 a | 41.4 a | 2.92 |
| A_CHO | Peak area | 1187–950 | 1187–950 | 664.4 a | 294.6 b | 505.8 a | 568.5 a | 566.6 a | 52.30 | |
| A_928 | Peak area | ca. 928 | 952–910 | 952–910 | 19.5 a | 15.1 b | 2.1 c | 1.7 c | 2.2 c | 0.68 |
| A_860 | Peak area | ca. 860 | 880–827 | 880–827 | 22.2 a | 19.3 a | 7.0 b | 9.2 b | 7.2 b | 1.46 |
| Based on the peak height | ||||||||||
| H_1415 | Peak height | ca. 1415 | – | 1485–1188 | 1.5 | 1.0 | 1.4 | 1.5 | 1.6 | 0.14 |
| H_1370 | Peak height | ca. 1370 | – | 1485–1188 | 1.4 | 1.0 | 1.0 | 1.2 | 1.3 | 0.10 |
| Molecular Spectroscopy: (IR Peak area intensity KM unit) | Molecular Spectroscopy: (IR Peak height intensity KM unit) | |||||||
|---|---|---|---|---|---|---|---|---|
| Items | Replications | A_Cell | A_1240 | A_CHO | A_928 | A_860 | H_1415 | H_1370 |
| Peak type | Peaks area | Peak area | Peaks area | Peak area | Peak area | Peak height | Peak height | |
| Peak center (cm−1) | – | ca. 1240 | – | ca. 928 | ca. 860 | ca. 1415 | ca. 1370 | |
| Region (cm−1) | 1485–1188 | 1292–1198 | 1187–950 | 952–910 | 880–827 | – | – | |
| Baseline (cm−1) | 1485–1188 | 1292–1198 | 1187–950 | 952–910 | 880–827 | 1485–1188 | 1485–1188 | |
| Grain vs. Bioethanol co-products | ||||||||
| Grains | 16 | 220.1 | 8.5 b | 479.5 | 17.3 a | 20.7 a | 1.3 | 1.2 |
| DDGS | 32 | 233.5 | 36.6 a | 536.7 | 2.0 b | 7.6 b | 1..4 | 1.1 |
| SEM | 14.90 | 2.16 | 40.67 | 0.51 | 0.83 | 0.09 | 0.07 | |
| P value | 0.53 | <0.01 | 0.32 | <0.01 | <0.01 | 0.16 | 0.69 | |
© 2011 by the authors; licensee MDPI, Basel, Switzerland. This article is an open-access article distributed under the terms and conditions of the Creative Commons Attribution license (http://creativecommons.org/licenses/by/3.0/).
Share and Cite
Yu, P.; Damiran, D.; Azarfar, A.; Niu, Z. Detecting Molecular Features of Spectra Mainly Associated with Structural and Non-Structural Carbohydrates in Co-Products from BioEthanol Production Using DRIFT with Uni- and Multivariate Molecular Spectral Analyses. Int. J. Mol. Sci. 2011, 12, 1921-1935. https://doi.org/10.3390/ijms12031921
Yu P, Damiran D, Azarfar A, Niu Z. Detecting Molecular Features of Spectra Mainly Associated with Structural and Non-Structural Carbohydrates in Co-Products from BioEthanol Production Using DRIFT with Uni- and Multivariate Molecular Spectral Analyses. International Journal of Molecular Sciences. 2011; 12(3):1921-1935. https://doi.org/10.3390/ijms12031921
Chicago/Turabian StyleYu, Peiqiang, Daalkhaijav Damiran, Arash Azarfar, and Zhiyuan Niu. 2011. "Detecting Molecular Features of Spectra Mainly Associated with Structural and Non-Structural Carbohydrates in Co-Products from BioEthanol Production Using DRIFT with Uni- and Multivariate Molecular Spectral Analyses" International Journal of Molecular Sciences 12, no. 3: 1921-1935. https://doi.org/10.3390/ijms12031921