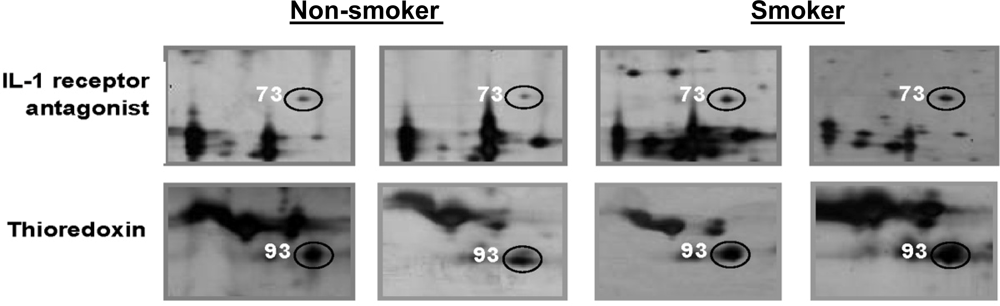
Proteomic Analysis of Whole Human Saliva Detects Enhanced Expression of Interleukin-1 Receptor Antagonist, Thioredoxin and Lipocalin-1 in Cigarette Smokers Compared to Non-Smokers

Abstract
:1. Introduction
2. Materials and Methods
2.1. Collection of Whole Saliva
2.2. Two-Dimensional Electrophoresis
2.3. Silver Staining
2.4. Image Analysis
2.5. In Gel Trypsin Digestion and Mass Spectrometry
2.6. Database Searches
2.7. Statistical Analysis
3. Results
4. Discussion
5. Conclusion
Acknowledgments
References
- Fellows, JL; Trosclair, A; Adams, EK; Rivera, CC. Annual smoking-attributable mortality, year of potential life lost, and economics costs-United States, 1995–1999. Morbidity Mortality Wkly. Rep 2002, 51, 300–303. [Google Scholar]
- Freedman, ND; Leitzmann, MF; Hollenbeck, AR; Schatzkin, A; Abnet, CC. Cigarette smoking and subsequent risk of lung cancer in men and women: analysis of a prospective cohort study. Lancet Oncol 2008, 9, 649–656. [Google Scholar]
- Ko, YC; Huang, YL; Lee, CH; Chen, MJ; Lin, LM; Tsai, CC. Betel quid chewing, cigarette smoking and alcohol consumption related to oral cancer in Taiwan. J. Oral Pathol. Med 1995, 24, 450–453. [Google Scholar]
- Zheng, T; Holford, T; Chen, Y; Jiang, P; Zhang, B; Boyle, P. Risk of tongue cancer associated with tobacco smoking and alcohol consumption. Oral Oncol 1997, 33, 82–85. [Google Scholar]
- Ockene, IS; Miller, NH. Cigarette smoking, cardiovascular disease, and stroke: a statement for healthcare professionals from the American Heart Association. American Heart Association Task Force on Risk Reduction. Circulation 1997, 96, 3243–3247. [Google Scholar]
- Yoshida, T; Tuder, RM. Pathobiology of cigarette smoke-induced chronic obstructive pulmonary disease. Physiol. Rev 2007, 87, 1047–1082. [Google Scholar]
- Bergstrom, J. Tobacco smoking and chronic destructive periodontal disease. Odontology 2004, 92, 1–8. [Google Scholar]
- Pauly, JL; Waight, JD; Paszkiewicz, GM. Tobacco flakes on cigarette filters grow bacteria: A potential health risk to the smoker? Tob. Control 2008, 17, i49–i52. [Google Scholar]
- Tobacco smoke and involuntary smoking. In IARC Monographs on the Evaluation of Carcinogenic Risks to Humans; Lyon, France, 11–18 June 2002; Volume 83.
- Hasday, JD; Bascom, R; Costa, JJ; Fitzgerald, T; Dubin, W. Bacterial endotoxin is an active component of cigarette smoke. Chest 1999, 115, 829–835. [Google Scholar]
- Lubin, JH; Purdue, M; Kelsey, K; Zhang, ZF; Winn, D; Wei, Q; Talamini, R; Szeszenia-Dabrowska, N; Sturgis, EM; Smith, E; et al. Total exposure and exposure rate effects for alcohol and smoking and risk of head and neck cancer: a pooled analysis of case-control studies. Epidemiology 2009, 170, 937–947. [Google Scholar]
- Hershkovich, O; Oliva, J; Nagler, RM. Lethal synergistic effect of cigarette smoke and saliva in an in vitro model: Does saliva have a role in the development of oral cancer? Eur. J. Cancer 2004, 40, 1760–1767. [Google Scholar]
- Nagler, RM; Reznick, AZ. Cigarette smoke effects on salivary antioxidants and oral cancer—novel concepts. Isr. Med. Assoc. J 2004, 6, 691–694. [Google Scholar]
- Nagler, R; Dayan, D. The dual role of saliva in oral carcinogenesis. Oncology 2006, 71, 10–17. [Google Scholar]
- Reznick, AZ; Klein, I; Eiserich, JP; Cross, CE; Nagler, RM. Inhibition of oral peroxidase activity by cigarette smoke: in vivo and in vitro studies. Free Radic. Biol. Med 2003, 34, 377–384. [Google Scholar]
- Ayan, N; Ayan, I; Alatli, C; Guler, SD; Dalkilic, C; Cinar, F; Dogan, O. P53 overexpression in normal oral mucosa of heavy smokers. J. Exp. Clin. Cancer Res 2000, 19, 525–529. [Google Scholar]
- Wong, DT. Salivary diagnostics for oral cancer. J. Calif. Dent. Assoc 2006, 34, 303–308. [Google Scholar]
- Hofman, LF. Human saliva as diagnostic specimen. J. Nutr 2001, 131, 1621S–1625S. [Google Scholar]
- Slavkin, HC. Toward molecular based diagnostic for the oral cavity. J. Am. Dent. Assoc 1998, 129, 1138–1143. [Google Scholar]
- Ferguson, DB. Saliva as a diagnostic fluid. Acta Stomatologia Croat 2009, 43, 77–82. [Google Scholar]
- Xie, H; Rhodus, NL; Griffin, RJ; Carlis, JV; Griffin, TJ. A catalogue of human saliva proteins identified by free flow electrophoresis-based peptide separation and tandem mass spectrometry. Mol. Cell. Proteomics 2005, 4, 1826–1830. [Google Scholar]
- Vitorino, R; Lobo, MJ; Ferrer-Correira, AJ; Dubin, JR; Tomer, KB; Domingues, PM; Amado, FM. Identification of human whole saliva protein components using proteomics. Proteomics 2004, 4, 1109–1115. [Google Scholar]
- Hu, S; Xie, Y; Ramachandran, P; Ogorzalek Loo, RR; Li, Y; Loo, JA; Wong, DT. Large-scale identification of proteins in human salivary proteome by liquid chromatography/mass spectrometry and two-dimensional gel elcetrophoresis-mass spectrometry. Proteomics 2005, 5, 1714–1728. [Google Scholar]
- Ghafouri, B; Tagesson, C; Lindahl, M. Mapping of proteins in human saliva using two-dimensional gel electrophoresis and peptide mass fingerprinting. Proteomics 2003, 3, 1003–1015. [Google Scholar]
- Huang, CM. Comparative proteomic analysis of human whole saliva. Arch. Oral Biol 2004, 49, 951–962. [Google Scholar]
- Hirtz, C; Chevalier, F; Centeno, D; Egea, J; Rossignol, M; Sommerer, N; de Périère, D. Complexity of the human whole saliva proteome. J. Physiol. Biochem 2005, 61, 469–480. [Google Scholar]
- Wu, Y; Shu, R; Luo, LJ; Ge, LH; Xie, YF. Initial comparison of proteomic profiles of whole unstimulated saliva obtained from generalized aggressive periodontitis patients and healthy control subjects. J. Periodontal Res 2009, 44, 636–644. [Google Scholar]
- Haigh, BJ; Stewart, KW; Whelan, JR; Barnett, MP; Smolenski, GA; Wheeler, TT. Alterations in the salivary proteome associated with periodontitis. J. Clin. Periodontol 2010, 37, 241–247. [Google Scholar]
- Giusti, L; Baldini, C; Bazzichi, L; Ciregia, F; Tonazzini, I; Mascia, G; Giannaccini, G; Bombardieri, S; Lucacchini, A. Proteome analysis of whole saliva: a new tool for rheumatic diseases—the example of Sjögren’s syndrome. Proteomics 2007, 7, 1634–1643. [Google Scholar]
- Hu, S; Arellano, M; Boontheung, P; Wang, J; Zhou, H; Jiang, J; Elashoff, D; Wei, R; Loo, JA; Wong, DT. Salivary proteomic for oral cancer biomarker discovery. Clin. Cancer Res 2008, 14, 6246–6252. [Google Scholar]
- Li, Y; John, MA, St; Zhou, X; Kim, Y; Sinha, U; Jordan, RC; Eisele, D; Abemayor, E; Elashoff, D; Park, NH; Wong, DT. Salivary transcriptome diagnostic for oral cancer detection. Clin. Cancer Res 2004, 10, 8442–8450. [Google Scholar]
- Hu, S; Yu, T; Xie, Y; Yang, Y; Li, Y; Zhou, X; Tsung, S; Loo, RR; Loo, JR; Wong, DT. Discovery of oral fluid biomarkers for human oral cancer by mass spectrometry. Cancer Genomics Proteomics 2007, 4, 55–64. [Google Scholar]
- Dowling, P; Wormald, R; Meleady, P; Henry, M; Curran, A; Clynes, M. Analysis of the saliva proteome from patients with head and neck squamous cell carcinoma reveals differences in abundance levels of proteins associated with tumour progression and metastasis. J. Proteomics 2008, 71, 168–175. [Google Scholar]
- Ohshiro, K; Rosenthal, DI; Koomen, JM; Streckfus, CF; Chambers, M; Kobayashi, R; El-Naggar, AK. Pre-analytic saliva processing affect proteomic results and biomarker screening of head and neck squamous carcinoma. Int. J. Oncol 2007, 30, 743–749. [Google Scholar]
- Streckfus, C; Bigler, L; Tucci, M; Thigpen, JT. A preliminary study of cA15-3, c-erbB-2, epidermal growth factor receptor, cathepsin-D and p53 in saliva among women with breast carcinoma. Cancer Invest 2000, 18, 101–109. [Google Scholar]
- Lindahl, M; Ekstrom, T; Sorensen, J; Tagesson, C. Two dimensional protein patterns of bronchoalveolar lavage fluid from non-smokers, smokers, and subjects exposed to asbestos. Thorax 1996, 51, 1028–1035. [Google Scholar]
- Plymoth, A; Yang, Z; Lofdahl, CG; Ekberg-Jansson, A; Dahlback, M; Fehniger, TE; Marko-Varga, G; Hancock, WS. Rapid proteome analysis of bronchoalveolar lavage samples of lifelong smokers and never smokers by micro-scale liquid chromatography and mass spectrometry. Clin. Chem 2006, 52, 671–679. [Google Scholar]
- Plymoth, A; Lofdahl, CG; Ekberg-Jansson, A; Dahlback, M; Broberg, P; Foster, M; Fehniger, TE; Marko-Varga, G. Protein expression patterns associated with progression of chronic obstructive pulmonary disease in bronchoalveolar lavage of smokers. Clin. Chem 2007, 53, 636–644. [Google Scholar]
- Ghafouri, B; Stahlbom, B; Tagesson, C; Lindahl, M. Newly identified proteins in human nasal lavage fluid from non-smokers and smokers using two-dimensional gel electrophoresis and peptide mass fingerprinting. Proteomics 2002, 2, 112–120. [Google Scholar]
- Airoldi, L; Magagnotti, C; Iannuzzi, AR; Marelli, C; Bagnati, R; Pastorelli, R; Colombi, A; Santaguida, S; Chiabrando, C; Schiarea, S; Fanelli, R. Effects of cigarette smoking on the human urinary proteome. Biochem. Biophys. Res. Commun 2009, 381, 397–402. [Google Scholar]
- Kelsen, SG; Duan, X; Ji, R; Perez, O; Liu, C; Merali, S. Cigarette smoke induced in unfold protein response in the human lung. Am. J. Respir. Cell. Mol. Biol 2008, 38, 541–550. [Google Scholar]
- Gianazza, E; Allegra, L; Bucchioni, E; Eberini, I; Puglisi, L; Blasi, F; Terzano, C; Wait, R; Sirtori, CR. Increassed keratin content detected by proteomic analysis of exhaled breath condensate from healthy persons who smoke. Am. J. Med 2004, 117, 51–54. [Google Scholar]
- Jessie, K; Hashim, OH; Rahim, ZHA. Precipitation methods for salivary proteins and rehydration buffer for two-dimensional electrophoresis. Biotechnology 2008, 7, 686–693. [Google Scholar]
- Heukeshoven, J; Dernick, R. Improved silver staining procedure for fast staining in PhastSystem Development Unit. I. Staining of sodium dodecyl sulfate gels. Electrophoresis 1988, 9, 28–32. [Google Scholar]
- Yan, JX; Wait, R; Berkelman, T; Harry, RA; Westbrook, JA; Wheeler, CH; Dunn, MJ. A modified silver staining protocol for visualization of proteins compatible with matrix-assisted laser desorption/ionization and electrospray ionization-mass spectrometry. Electrophoresis 2000, 21, 3666–3672. [Google Scholar]
- Seriramalu, R; Pang, WW; Jayapalan, JJ; Mohamed, E; Abdul-Rahman, PS; Bustam, AZ; Khoo, ASB; Hashim, OH. Application of champedak mannose-binding lectin in the glycoproteomic profiling of serum samples unmasks reduced expression of alpha-2 macroglobulin and complement factor B in patients with nasopharyngeal carcinoma. Electrophoresis 2010, 31, 2388–2395. [Google Scholar]
- Benjamini, Y; Hochberg, Y. Controlling the false discovery rate: a practical and powerful approach to multiple testing. J. R. Stat. Soc. B 1995, 57, 289–300. [Google Scholar]
- Humphrey, SP; Williamson, RT. A review of saliva: normal composition, flow, and function. J. Prosthet. Dent 2001, 85, 162–169. [Google Scholar]
- Turner, RJ; Sugiya, H. Understanding salivary fluid and protein secretion. Oral Dis 2002, 8, 3–11. [Google Scholar]
- Defabianis, P; Re, F. The role of saliva in maintaining oral health. Minerva Stomatol 2003, 52, 301–308. [Google Scholar]
- Helmerhorst, EJ; Oppenheim, FG. Saliva: a dynamic proteome. Critical Reviews in Oral Biology and Medicine. J. Dent. Res 2007, 86, 680–693. [Google Scholar]
- Liu, YF; Xiao, ZQ; Li, MX; Li, MY; Zhang, PF; Li, C; Li, F; Chen, YH; Yi, H; Yao, HX; Chen, ZC. Quantitative proteome analysis reveals annexin A3 as a novel biomarker in lung adenocarcinoma. J. Pathol 2009, 217, 54–64. [Google Scholar]
- Petrova, DT; Asif, AR; Armstrong, VW; Dimova, I; Toshev, S; Yaramov, N; Oellerich, M; Toncheva, D. Expression of chloride intracellular channel protein 1 (CLIC1) and tumor protein D52 (TPD52) as potential biomarkers for colorectal cancer. Clin. Biochem 2008, 41, 1224–1236. [Google Scholar]
- Gromov, P; Gromova, I; Bunkenborg, J; Cabezon, T; Moreira, JM; Timmermans-Wielenga, V; Roepstorff, P; Rank, F; Celis, JE. Up-regulated proteins in the fluid bathing the tumour cell microenvironment as potential serological markers for early detection of cancer of the breast. Mol. Oncol 2010, 4, 65–89. [Google Scholar]
- Wang, Z; Feng, X; Liu, X; Jiang, L; Zeng, X; Ji, N; Li, J; Li, L; Chen, Q. Involvement of potential pathways in malignant transformation from oral leukoplakia to oral squamous cell carcinoma revealed by proteomic analysis. BMC Genomics 2009, 10, 383. [Google Scholar]
- Gupta, N; Shankernarayan, NP; Dharmalingam, K. Alpha1-acid glycoprotein as a putative biomarker for monitoring the development of the type II reactional stage of leprosy. J. Med. Microbiol 2010, 59, 400–407. [Google Scholar]
- Almgren, MAE; Henriksson, KCE; Fujimoto, J; Chang, CL. Nucleoside diphosphate kinase A/nm23-H1 promotes metastasis of NB69-derived human neuroblastoma. Mol. Cancer Res 2004, 2, 387–394. [Google Scholar]
- Allard, L; Burkhard, PR; Lescuyer, P; Burgess, JA; Walter, N; Hochstrasser, DF; Sanchez, JC. PARK7 and nucleoside diphosphate kinase A as plasma markers for the early diagnosis of stroke. Clin. Chem 2005, 51, 2043–2051. [Google Scholar]
- Lo, WY; Tsai, MH; Tsai, Y; Hua, CH; Tsai, FJ; Huang, SY; Tsai, CH; Lai, CC. Identification of over-expressed proteins in oral squamous cell carcinoma (OSCC) patients by clinical proteomic analysis. Clin. Chim. Acta 2007, 376, 101–107. [Google Scholar]
- O’Donovan, N; Fischer, A; Abdo, EM; Simon, F; Peter, HJ; Gerber, H; Buergi, U; Marti, U. Differential expression of IgG Fc binding protein (FcgammaBP) in human normal thyroid tissue, thyroid adenomas and thyroid carcinomas. J. Endocrinol 2002, 174, 517–524. [Google Scholar]
- Whitaker, HC; Warren, AY; Eeles, R; Kote-Jarai, Z; Neal, DE. The potential value of microseminoprotein-beta as a prostate cancer biomarker and therapeutic target. Prostate 2010, 70, 333–340. [Google Scholar]
- Esser, D; Alvarez-Llamas, GA; de Vries, MP; Weening, D; Vonk, RJ; Roelofsen, H. Sample Stability and Protein Composition of Saliva: Implications for Its Use as a Diagnostic Fluid. Biomark Insights 2008, 3, 25–37. [Google Scholar]
- Patti, G; D’Ambrosio, A; Mega, S; Giorgi, G; Zardi, EM; Zardi, DM; Dicuonzo, G; Dobrina, A; Di Sciascio, G. Early interleukin-1 receptor antagonist elevation in patients with acute myocardial infraction. Journal of the American College of Cardiology. J. Am. Coll. Cardiol 2004, 43, 35–38. [Google Scholar]
- Fearon, WF; Fearon, DT. Inflammation and cardiovascular disease, the role of the interleukin-1 receptor antagonist. Circulation 2008, 117, 2577–2579. [Google Scholar]
- Casini-Raggi, V; Kam, L; Chong, YJ; Fiocchi, C; Pizarro, TT; Cominelli, F. Mucosal imbalance of IL-1 and IL-1 receptor antagonist in inflammatory bowel disease. a novel mechanism of chronic intestinal inflammation. J. Immunol 1995, 154, 2434–2440. [Google Scholar]
- Wojnar, P; Dirnhofer, S; Ladurner, P; Berger, P; Redl, B. Human lipocalin 1, a physiological scavenger of lipophilic compounds, is produced by corticotrophs of the pituitary gland. J. Histochem. Cytochem 2002, 50, 433–435. [Google Scholar]
- van’t Hof, W; Blankenvoorde, MFJ; Veerman, ECI; Amerongen, AVN. The salivary lipocalin von Ebner’s gland protein is a cysteine proteinase inhibitor. J. Biol. Chem 1997, 272, 1837–1841. [Google Scholar]
- Huang, YL; Chuang, CY; Sung, FC; Chen, CY. Thioredoxin overexpression modulates remodeling factors in stress responses to cigarette smoke. J. Toxicol. Environ. Health A 2008, 71, 1490–1498. [Google Scholar]


| Subject(a) | Age | Cigarettes/Day | Smoking Duration(b) | Stick-year(c) |
|---|---|---|---|---|
| 1 | 35 | 20 | 15 | 300 |
| 2 | 36 | 14 | 23 | 322 |
| 3 | 38 | 20 | 15 | 300 |
| 4 | 51 | 14 | 20 | 280 |
| 5 | 36 | 14 | 15 | 210 |
| 6 | 54 | 20 | 30 | 600 |
| 7 | 38 | 20 | 17 | 340 |
| 8 | 54 | 30 | 30 | 900 |
| 9 | 39 | 20 | 20 | 400 |
| 10 | 39 | 20 | 25 | 500 |
| 11 | 48 | 24 | 17 | 408 |
| 12 | 40 | 14 | 15 | 210 |
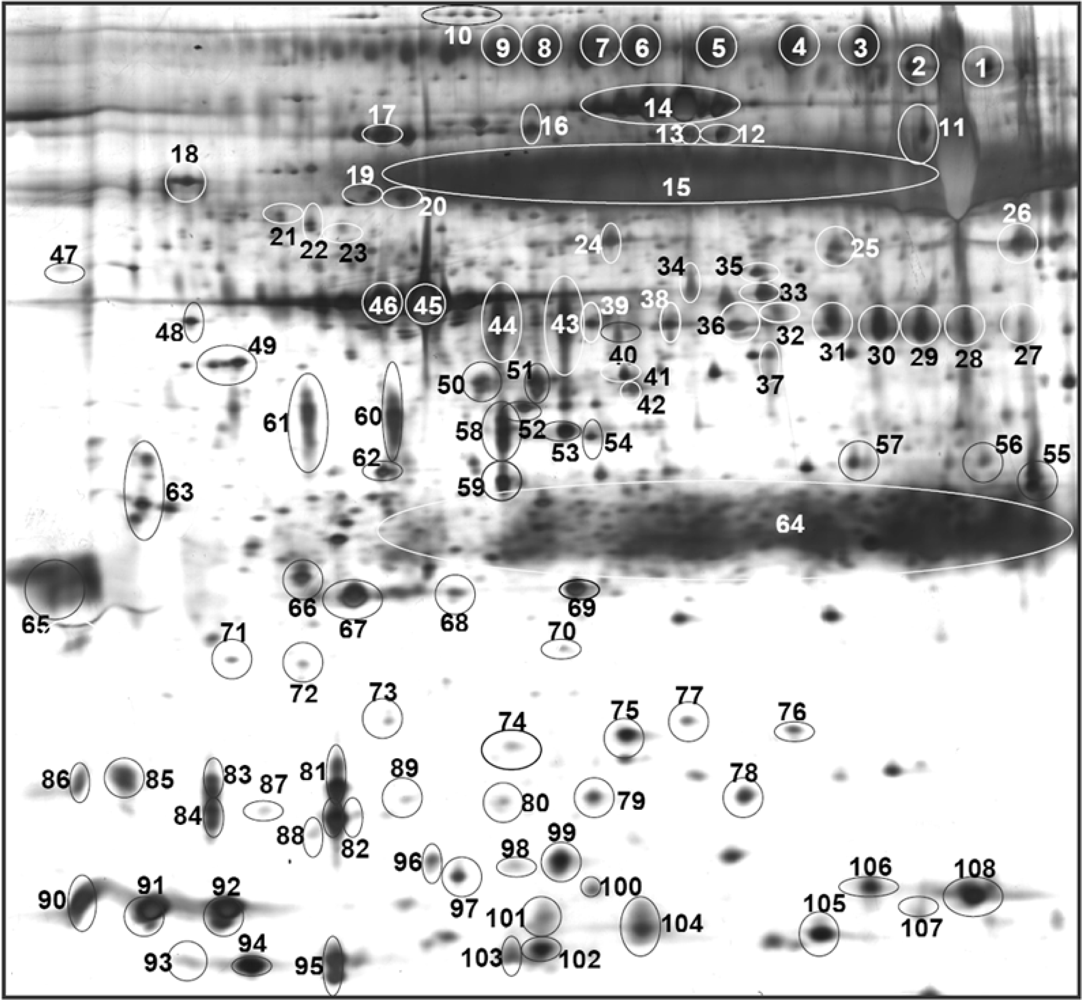
| Accession No. (a) | Protein | Spot No.(b) | MASCOT Score | No. of Peptides Hit | Sequence Coverage | Ref. |
|---|---|---|---|---|---|---|
| P02787 | Serotransferrin | 1 | 89 | 10 | 9 | [22,23,25] |
| 2 | 78 | 16 | 8 | |||
| P01833 | Polymeric immunoglobulin receptor | 3 | 282 | 9 | 8 | [22–26] |
| 4 | 111 | 11 | 33 | |||
| 5 | 99 | 17 | 27 | |||
| 6 | 240 | 7 | 22 | |||
| 7 | 246 | 20 | 55 | |||
| 8 | 169 | 12 | 32 | |||
| 9 | 120 | 18 | 28 | |||
| Q9Y6R7 | IgGFc-binding protein | 10 | 645 | 10 | 2 | Npd |
| Q8TDL5 | *Long palate, lung and nasal epithelium carcinoma-associated protein 1 | 11 | 187 | 4 | 11 | Npd |
| P09960 | *Leukotriene A-4 hydrolase | 12 | 376 | 6 | 14 | Npd |
| P02768 | Serum albumin | 13 | 98 | 3 | 5 | [22–26] |
| 14 | 122 | 5 | 7 | |||
| P04745 | Human salivay α-amylase | 15 | 101 | 15 | 27 | [22–26] |
| P08107 | Heat shock 70 kDa protein 1 | 16 | 572 | 8 | 14 | [23] |
| P13796 | Plastin-2 | 17 | 555 | 32 | 16 | Npd |
| P07237 | *Protein disulfide-isomerase | 18 | 636 | 13 | 27 | Npd |
| P02774 | Vitamin D-binding protein precursor | 19 | 741 | 11 | 32 | [27] |
| 20 | 575 | 10 | 27 | |||
| P01009 | Alpha-1-antitrypsin | 21 | 211 | 8 | 10 | [25] |
| 22 | 112 | 6 | 12 | |||
| 23 | 99 | 5 | 18 | |||
| P61158 | Actin-related protein 3 | 24 | 327 | 13 | 17 | Npd |
| P50395 | *Rab GDP dissociation inhibitor beta | 25 | 363 | 15 | 19 | [28] |
| P06733 | Alpha-enolase | 26 | 735 | 11 | 33 | [22,23,26] |
| P23280 | Carbonic anhydrase VI | 27 | 290 | 15 | 19 | [22,23] |
| 28 | 90 | 4 | 4 | |||
| 29 | 303 | 11 | 40 | |||
| 30 | 488 | 32 | 48 | |||
| 31 | 79 | 4 | 8 | |||
| 32 | ||||||
| P30740 | *Leukocyte elastase inhibitor | 33 | 374 | 12 | 19 | [29] |
| 34 | 315 | 10 | 16 | |||
| Q99536 | **Synaptic vesicle membrane protein VAT-1 | 35 | 76 | 2 | 4 | Npd |
| P40121 | Macrophage-capping protein | 36 | 579 | 16 | 20 | Npd |
| P02675 | Fibrinogen beta chain | 37 | 676 | 12 | 26 | [23,25] |
| 38 | 554 | 16 | 36 | |||
| 39 | 467 | 15 | 20 | |||
| P00738 | Haptoglobin | 40 | 518 | 10 | 21 | [28] |
| P37837 | *Transaldolase | 41 | 60 | 8 | 15 | [28] |
| 42 | 77 | 6 | 13 | |||
| P25311 | Zinc-alpha-2-glycoprotein | 43 | 246 | 16 | 28 | [22–26] |
| 44 | 285 | 11 | 20 | |||
| P60709 | Actin, cytoplasmic 1 | 45 | 230 | 3 | 15 | [23,25] |
| 46 | 188 | 4 | 15 | |||
| P27797 | **Calreticulin | 47 | 651 | 10 | 27 | Npd |
| P01024 | Complement C3 | 48 | 330 | 15 | 6 | Npd |
| 49 | 332 | 14 | 5 | |||
| P63261 | Actin, cytoplasmic 2 | 50 | 285 | 11 | 20 | [23] |
| P60709 | Actin, cytoplasmic 1 | 51 | 243 | 5 | 14 | [23,25] |
| P52907 | F-actin-capping protein subunit alpha-1 | 52 | 274 | 6 | 16 | Npd |
| P25311 | Zinc-alpha-2-glycoprotein | 53 | 82 | 3 | 10 | [22–26] |
| P12429 | Annexin A3 | 54 | 331 | 8 | 14 | Npd |
| P00738 | Haptoglobin | 55 | 627 | 12 | 24 | [28] |
| P01876 | Ig alpha-1 chain C region | 56 | 274 | 5 | 17 | [22–24,26] |
| P30740 | *Leukocyte elastase inhibitor | 57 | 417 | 20 | 30 | [29] |
| Q96DR5 | *Short palate, lung and nasal epithelium carcinoma-associated protein 2 | 58 | 141 | 4 | 15 | [22] |
| 59 | 119 | 5 | 18 | |||
| 60 | 293 | 20 | 68 | |||
| 61 | ||||||
| O00299 | *Chloride intracellular channel protein 1 | 62 | 561 | 9 | 52 | Npd |
| P63104 | Protein kinase C inhibitor protein-1(14-3-3 protein zeta/delta) | 63 | 101 | 4 | 12 | Npd |
| P01834 | Ig kappa chain C region | 64 | 101 | 4 | 33 | [23–26] |
| P01591 | Immunoglobulin J chain | 65 | 241 | 11 | 32 | [22,24,25] |
| P52565 | Rho GDP-dissociation inhibitor 1 | 66 | 356 | 13 | 30 | Npd |
| P52566 | *Rho GDP-dissociation inhibitor 2 | 67 | 173 | 9 | 31 | Npd |
| P09211 | Glutathione S Transferase | 68 | 201 | 6 | 22 | [22–24,26] |
| 69 | 493 | 19 | 61 | |||
| P32119 | Peroxiredoxin-2 | 70 | 264 | 6 | 27 | [28] |
| P02763 | Alpha-1-acid glycoprotein 1 | 71 | 317 | 6 | 27 | Npd |
| 72 | 137 | 4 | 17 | |||
| P18510 | Interleukin-1 receptor antagonist protein | 73 | 148 | 6 | 15 | [22,24] |
| P00738 | Haptoglobin | 74 | 358 | 6 | 22 | [28] |
| 75 | 491 | 7 | 20 | |||
| 76 | 439 | 8 | 22 | |||
| P15531 | **Nucleoside diphosphate kinase A | 77 | 132 | 6 | 25 | Npd |
| P52566 | Rho GDP-dissociation inhibitor 2 | 78 | 185 | 4 | 32 | Npd |
| O15511 | Actin-related protein 2/3 complex subunit 5 | 79 | 69 | 2 | 7 | Npd |
| P12273 | Prolactin-inducible protein | 80 | 385 | 6 | 45 | [22–25] |
| 81 | 116 | 32 | 6 | |||
| 82 | 375 | 5 | 44 | |||
| 83 | 365 | 6 | 45 | |||
| 84 | 410 | 6 | 45 | |||
| 85 | 413 | 7 | 54 | |||
| 86 | 279 | 5 | 45 | |||
| P31025 | *Lipocalin-1 | 87 | 169 | 5 | 18 | [22,24] |
| 88 | 168 | 3 | 17 | |||
| 89 | 213 | 4 | 21 | |||
| P01036 | *Cystatin S | 90 | 535 | 15 | 62 | [22–24,26] |
| 91 | 444 | 8 | 58 | |||
| P09228 | *Cystatin SA | 92 | 437 | 7 | 64 | [22–26] |
| P10599 | Thioredoxin | 93 | 88 | 4 | 16 | [21] |
| 94 | 111 | 3 | 15 | |||
| P12273 | Prolactin-inducible protein | 95 | 413 | 7 | 54 | [22–25] |
| P02766 | Transthyretin | 96 | 80 | 3 | 33 | [28,33] |
| Q14019 | **Coactosin-like protein | 97 | 379 | 8 | 60 | Npd |
| P08118 | **Beta-microseminoprotein | 98 | 119 | 2 | 8 | Npd |
| P02766 | Transthyretin | 99 | 269 | 7 | 40 | [28,33] |
| Q01469 | *Fatty acid-binding protein, epidermal | 100 | 219 | 6 | 47 | [22–24,29] |
| P01036 | *Cystatin S | 101 | 192 | 4 | 37 | [22–24,26] |
| P06702 | Calgranulin-B | 102 | 296 | 6 | 51 | [22,24,26] |
| P01040 | Cystatin-A | 103 | 42 | 1 | 18 | [22,25,26] |
| P06702 | Calgranulin-B | 104 | 395 | 7 | 63 | [22,24,26] |
| P28325 | *Cystatin D | 105 | 172 | 6 | 34 | [22,24] |
| Q01469 | *Fatty acid-binding protein, epidermal | 106 | 347 | 8 | 52 | [22–24,29] |
| Q05315 | **Eosinophil lysophospholipase | 107 | 108 | 3 | 9 | Npd |
| P01037 | *Cystatin SN | 108 | 293 | 20 | 68 | [22–26] |
| Protein | Non-smokers | Smokers | |||
|---|---|---|---|---|---|
| % volume(a) (±S.E.M) | RP(b)/12 | % volume(a) (±S.E.M) | RP(b)/12 | p(c) | |
| 1: Energy/Metabolism | |||||
| Amylase | 14.15 (±0.54) | 12 | 12.72 (±0.85) | 12 | 0.168 |
| Carbonic anhydrase VI | 1.48 (±0.17) | 12 | 1.07 (±0.14) | 12 | 0.077 |
| Zinc-alpha-2-glycoprotein | 1.02 (±0.09) | 12 | 1.09 (±0.13) | 12 | 0.673 |
| Fatty acid-binding protein, epidermal | 0.08 (±0.01) | 12 | 0.12 (±0.02) | 12 | 0.111 |
| Transaldolase | 0.04 (±0.01) | 12 | 0.04 (±0.01) | 12 | 0.543 |
| Alpha-enolase | 0.06 (±0.02) | 10 | 0.10 (±0.02) | 12 | 0.183 |
| 2: Defence/Immune response | |||||
| Polymeric immunoglobulin receptor | 4.58 (±0.12) | 12 | 3.57 (±0.40) | 12 | 0.024 |
| Immunoglobulin J chain | 0.38 (±0.06) | 12 | 0.41 (±0.06) | 12 | 0.305 |
| Interleukin-1 receptor antagonist protein | 0.01 (±0.00) | 7 | 0.04 (±0.01) | 11 | 0.004 |
| Prolactin-inducible protein | 2.27 (±0.20) | 12 | 2.35 (±0.23) | 12 | 0.787 |
| Short palate, lung and nasal epithelium carcinoma-associated protein 2 | 1.22 (±0.18) | 11 | 1.42 (±0.18) | 12 | 0.456 |
| Alpha-1-acid glycoprotein 1 | 0.01 (±0.00) | 2 | 0.02 (±0.01) | 5 | 0.159 |
| 3: Protein degradation inhibitor | |||||
| α1-Antitrypsin | 0.02 (±0.01) | 6 | 0.05 (±0.01) | 8 | 0.027 |
| Cystatin A | 0.08 (±0.02) | 12 | 0.09 (±0.03) | 12 | 0.620 |
| Cystatin S | 0.04 (±0.01) | 12 | 0.05 (±0.01) | 12 | 0.775 |
| Cystatin SA | 0.28 (±0.05) | 12 | 0.27 (±0.07) | 12 | 0.916 |
| Cystatin SN | 0.28 (±0.06) | 12 | 0.30 (±0.04) | 12 | 0.744 |
| Cystatin D | 0.12 (±0.02) | 12 | 0.12 (±0.02) | 11 | 0.769 |
| Leukocyte elastase inhibitor | 0.10 (±0.01) | 12 | 0.10 (±0.01) | 12 | 0.922 |
| 4: Cell adhesion/communication | |||||
| Calgranulin B | 0.13 (±0.01) | 12 | 0.21 (±0.04) | 12 | 0.032 |
| 5: Protein folding/repair | |||||
| Heat shock 70 kDa protein 1 | 0.06 (±0.01) | 12 | 0.05 (±0.01) | 12 | 0.818 |
| 6: Redox | |||||
| Thioredoxin | 0.03 (±0.00) | 1 | 0.07 (±0.02) | 8 | 0.001 |
| Peroxiredoxin-2 | 0.01 (±0.01) | 3 | 0.02 (±0.01) | 7 | 0.617 |
| 7: Signaling | |||||
| Complement C3 precursor | 0.00 (±0.00) | 3 | 0.01 (±0.00) | 9 | 0.012 |
| Glutathione-S Transferase | 0.10 (±0.01) | 12 | 0.12 (±0.02) | 12 | 0.444 |
| Rho GDP-dissociation inhibitor 1 | 0.14 (±0.03) | 3 | 0.15 (±0.03) | 3 | 0.557 |
| Rho GDP-dissociation inhibitor 2 | 0.03 (±0.01) | 10 | 0.04 (±0.01) | 12 | 0.327 |
| Protein kinase C inhibitor protein-1 | 0.11 (±0.03) | 7 | 0.17 (±0.05) | 11 | 0.282 |
| Annexin A3 | 0.07 (±0.02) | 11 | 0.00 (±0.01) | 6 | 0.088 |
| 8: Structural/cytoskeletal | |||||
| f-actin-capping protein subunit alpha-1 | 0.02 (±0.01) | 4 | 0.03 (±0.01) | 8 | 0.521 |
| Macrophage-capping protein | 0.03 (±0.01) | 7 | 0.02 (±0.00) | 9 | 0.261 |
| l-plastin | 0.11 (±0.01) | 12 | 0.09 (±0.01) | 12 | 0.376 |
| 9: Transport | |||||
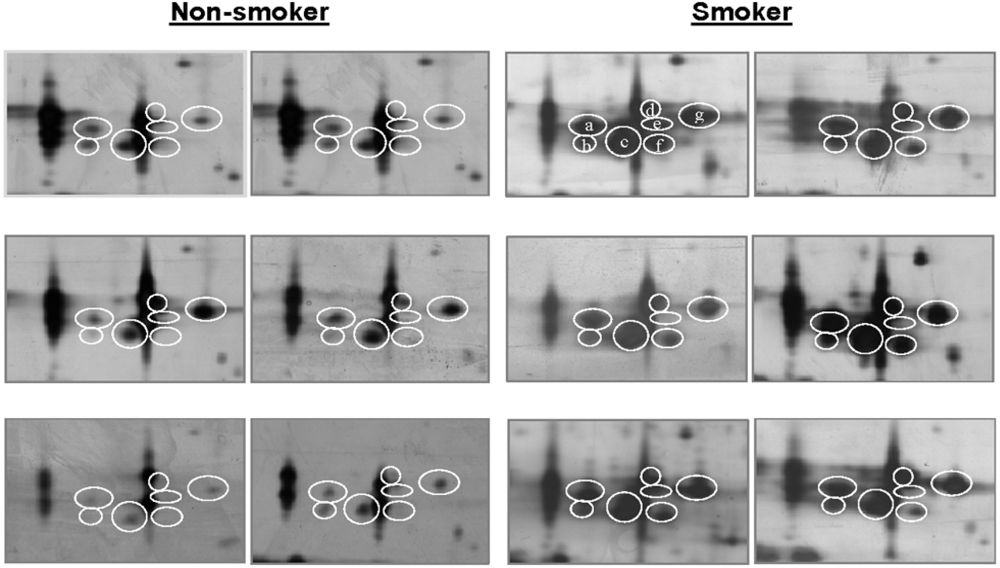
| Lipocalin-1 | 0.15 (±0.05) | 8 | 0.65 (±0.13) | 12 | 0.001 |
| Haptoglobin | 0.06 (±0.01) | 11 | 0.07 (±0.01) | 12 | 0.694 |
| Transthyretin | 0.07 (±0.01) | 12 | 0.10 (±0.02) | 12 | 0.108 |
| Serum albumin | 1.63 (±0.14) | 12 | 1.71 (±022) | 12 | 0.758 |
| Isoform Spot(a) | Non-smokers | Smokers | p | Fold Change(d) | ||
|---|---|---|---|---|---|---|
| % vol(b) | RP(c) | % vol(b) | RP(c) | |||
| a | 0.056 | 8 | 0.195 | 12 | 0.005 | +3.5 |
| b | 0.007 | 4 | 0.150 | 10 | 0.000 | +21.4 |
| c | 0.085 | 11 | 0.305 | 12 | 0.012 | +3.7 |
| d | 0.013 | 5 | 0.108 | 11 | 0.012 | +8.3 |
| e | 0.006 | 4 | 0.069 | 9 | 0.038 | +11.5 |
| f | 0.003 | 1 | 0.089 | 6 | 0.031 | +29.7 |
| g | 0.110 | 12 | 0.316 | 12 | 0.018 | +2.9 |
© 2010 by the authors; licensee Molecular Diversity Preservation International, Basel, Switzerland. This article is an open-access article distributed under the terms and conditions of the Creative Commons Attribution license (http://creativecommons.org/licenses/by/3.0/).
Share and Cite
Jessie, K.; Pang, W.W.; Rahim, Z.H.A.; Hashim, O.H. Proteomic Analysis of Whole Human Saliva Detects Enhanced Expression of Interleukin-1 Receptor Antagonist, Thioredoxin and Lipocalin-1 in Cigarette Smokers Compared to Non-Smokers. Int. J. Mol. Sci. 2010, 11, 4488-4505. https://doi.org/10.3390/ijms11114488
Jessie K, Pang WW, Rahim ZHA, Hashim OH. Proteomic Analysis of Whole Human Saliva Detects Enhanced Expression of Interleukin-1 Receptor Antagonist, Thioredoxin and Lipocalin-1 in Cigarette Smokers Compared to Non-Smokers. International Journal of Molecular Sciences. 2010; 11(11):4488-4505. https://doi.org/10.3390/ijms11114488
Chicago/Turabian StyleJessie, Kala, Wei Wei Pang, Zubaidah Haji Abdul Rahim, and Onn Haji Hashim. 2010. "Proteomic Analysis of Whole Human Saliva Detects Enhanced Expression of Interleukin-1 Receptor Antagonist, Thioredoxin and Lipocalin-1 in Cigarette Smokers Compared to Non-Smokers" International Journal of Molecular Sciences 11, no. 11: 4488-4505. https://doi.org/10.3390/ijms11114488