
Theoretical Characterization by Density Functional Theory (DFT) of Delphinidin 3-O-Sambubioside and Its Esters Obtained by Chemical Lipophilization

 , ,
, ,  and
and
Abstract
:
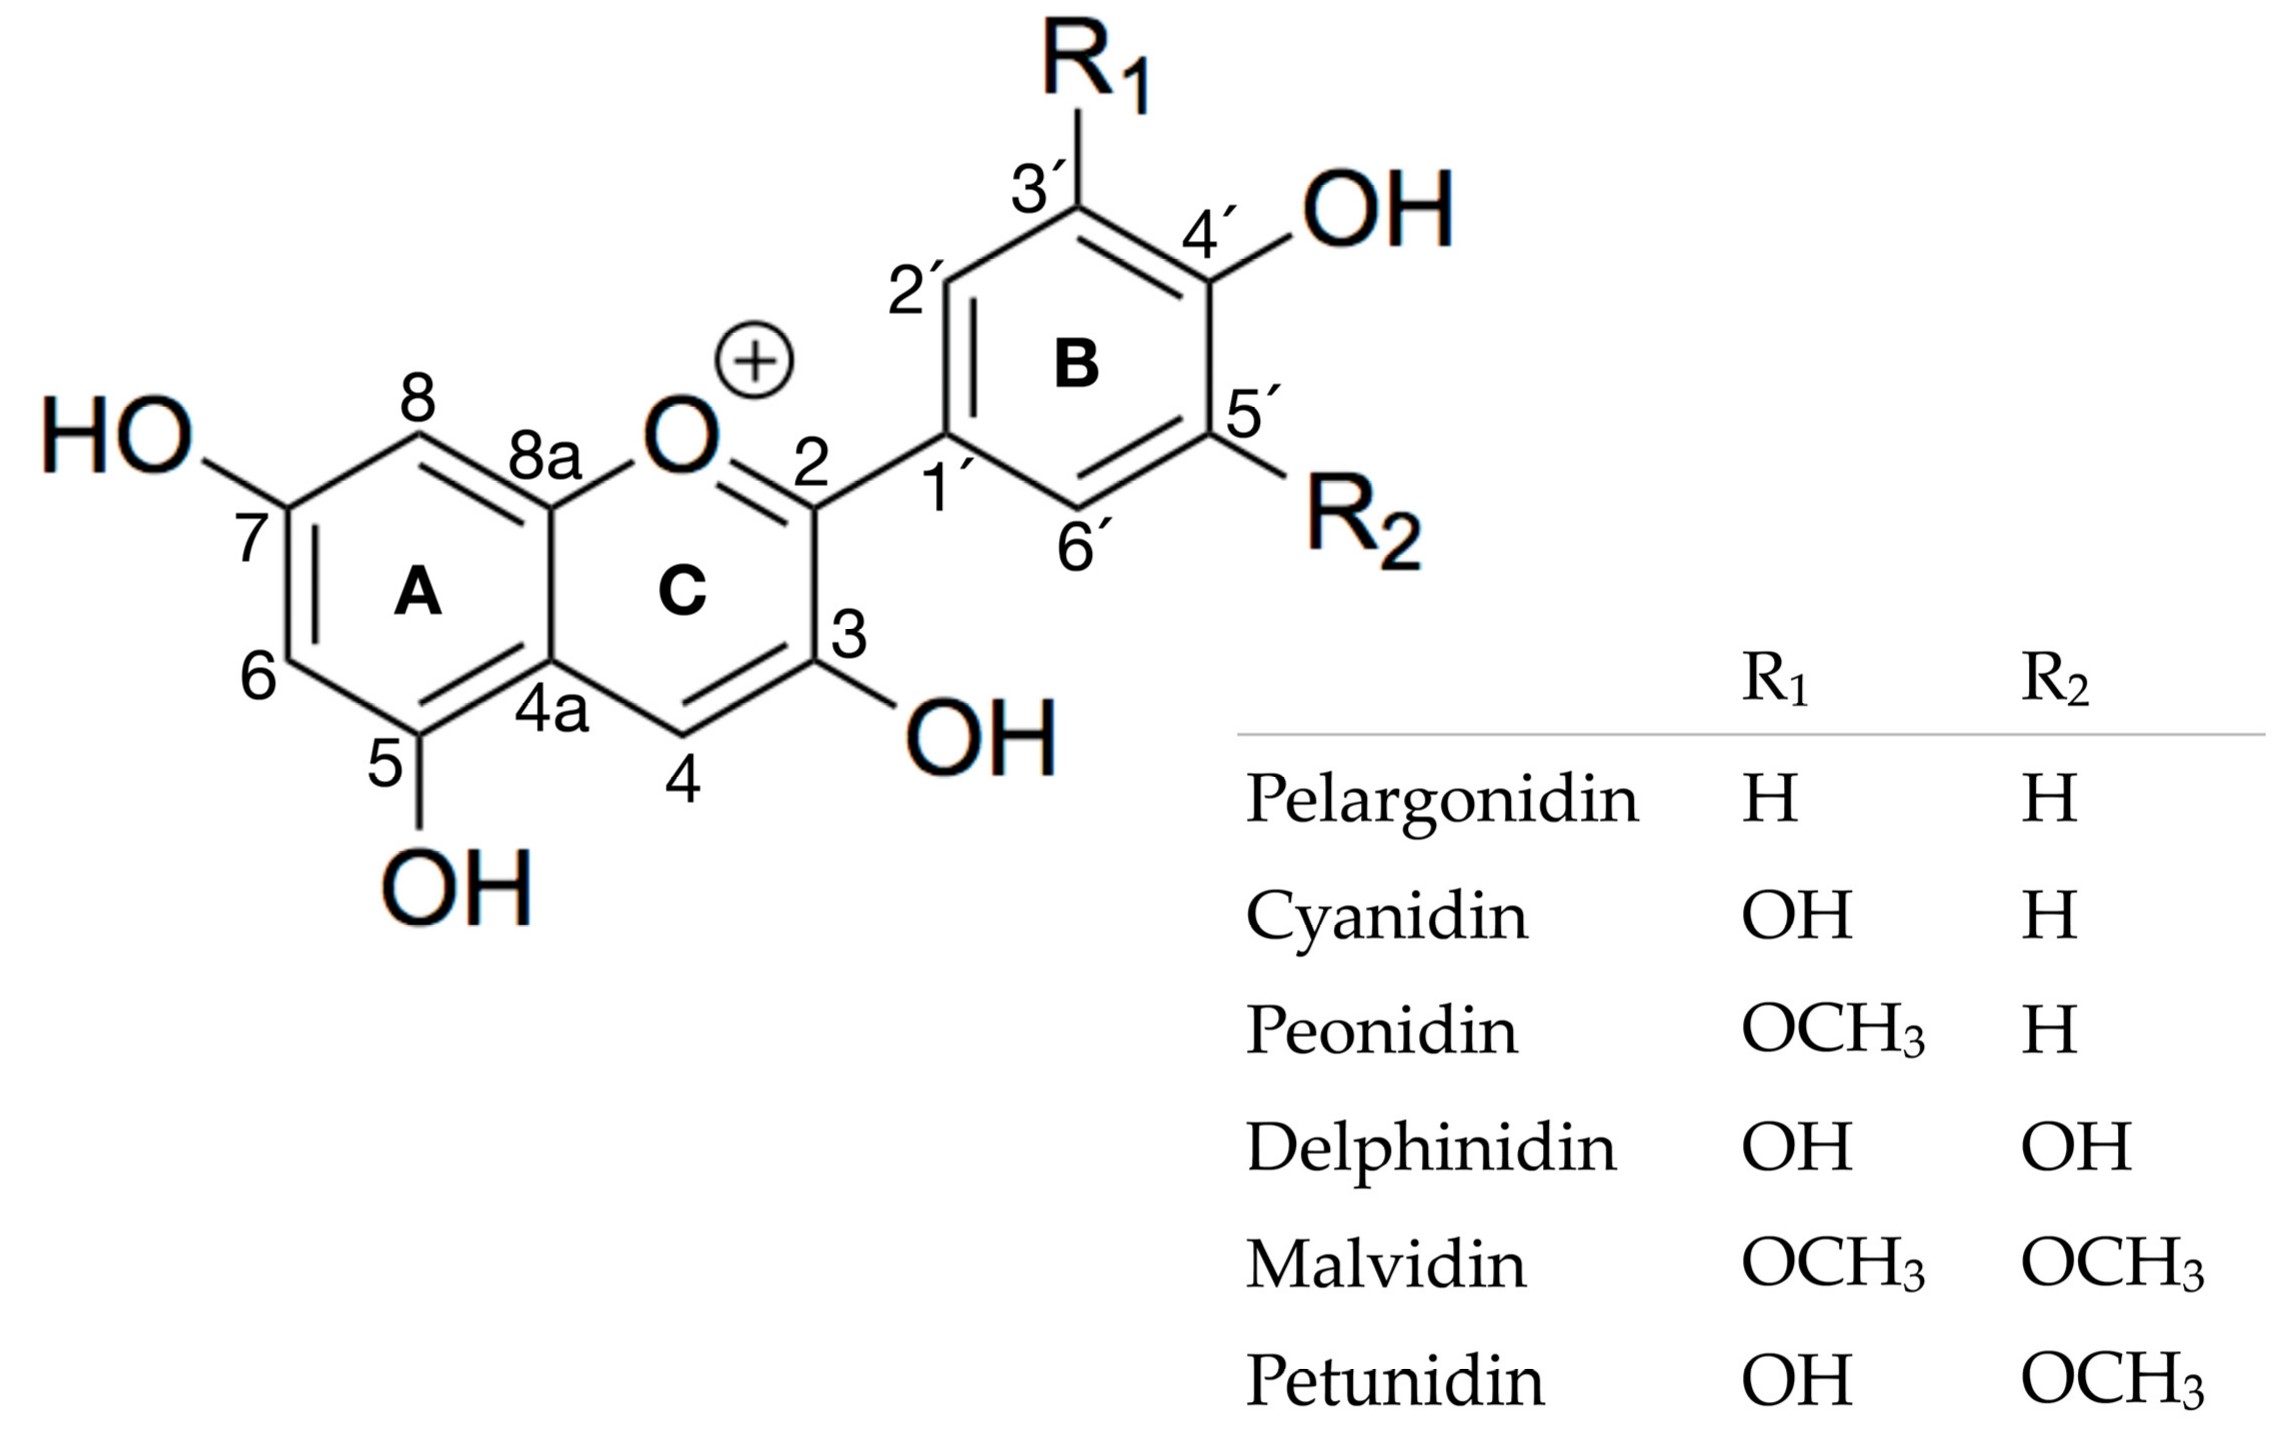
1. Introduction
2. Results and Discussion
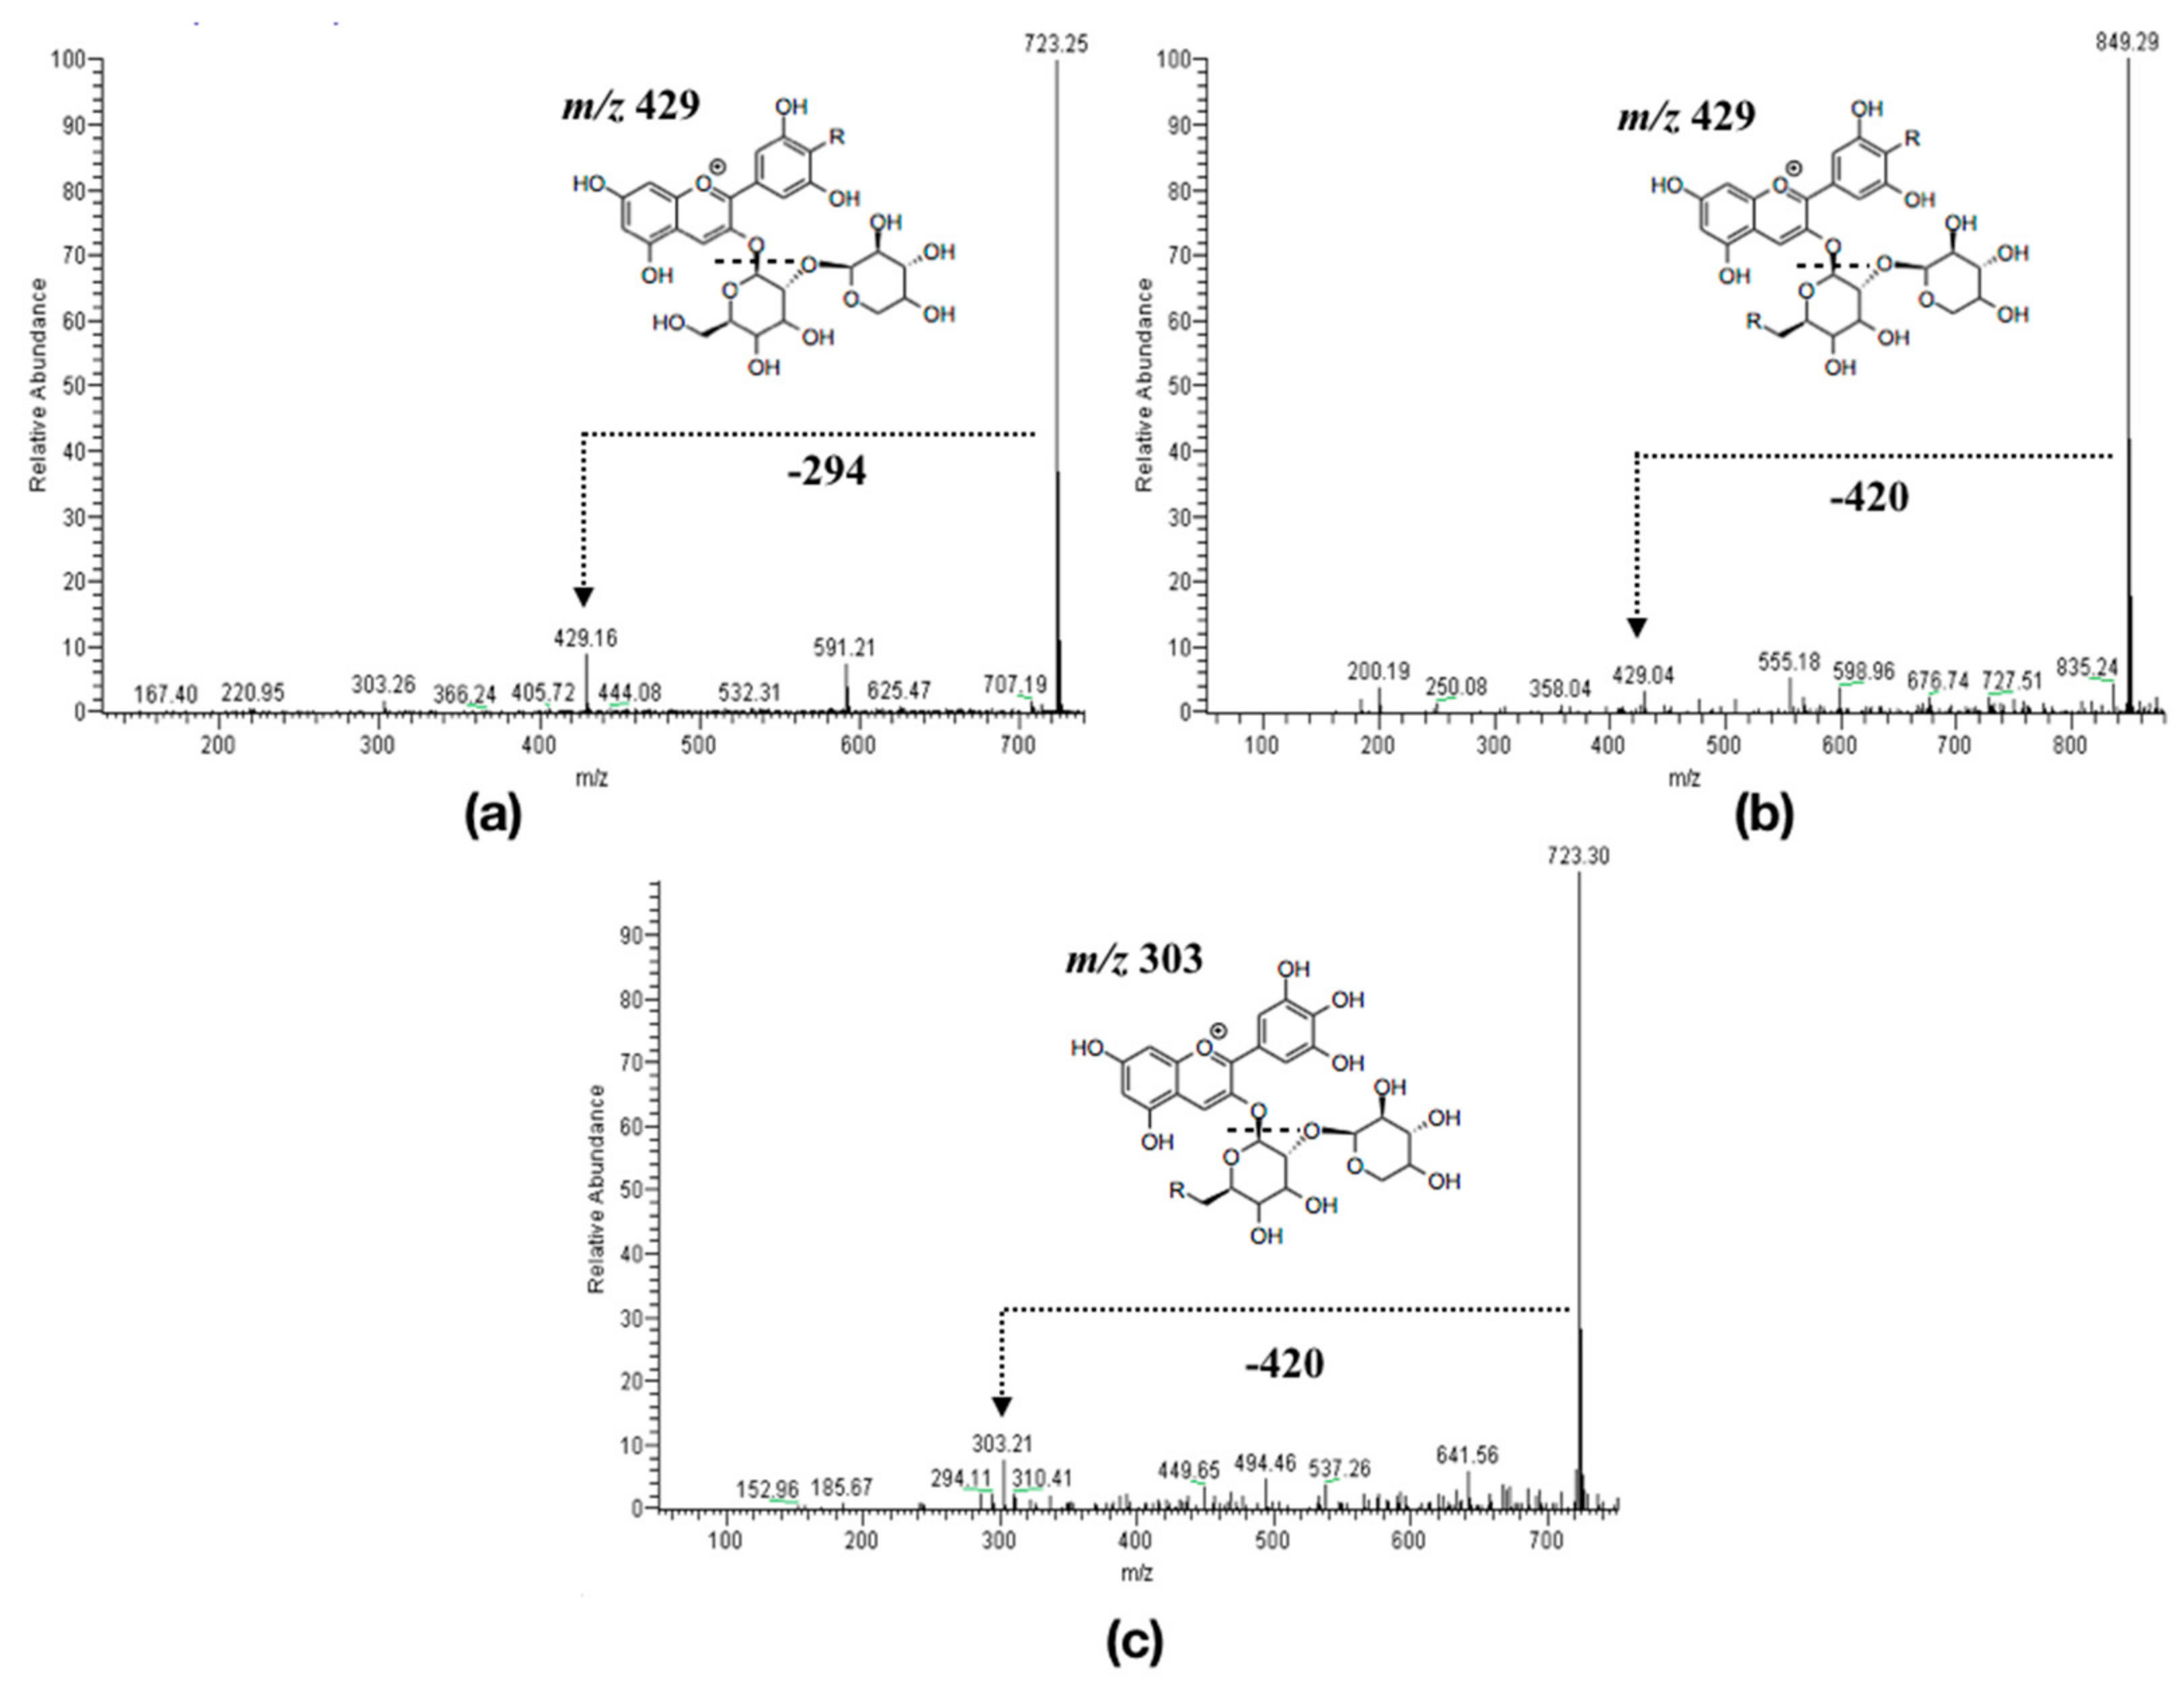
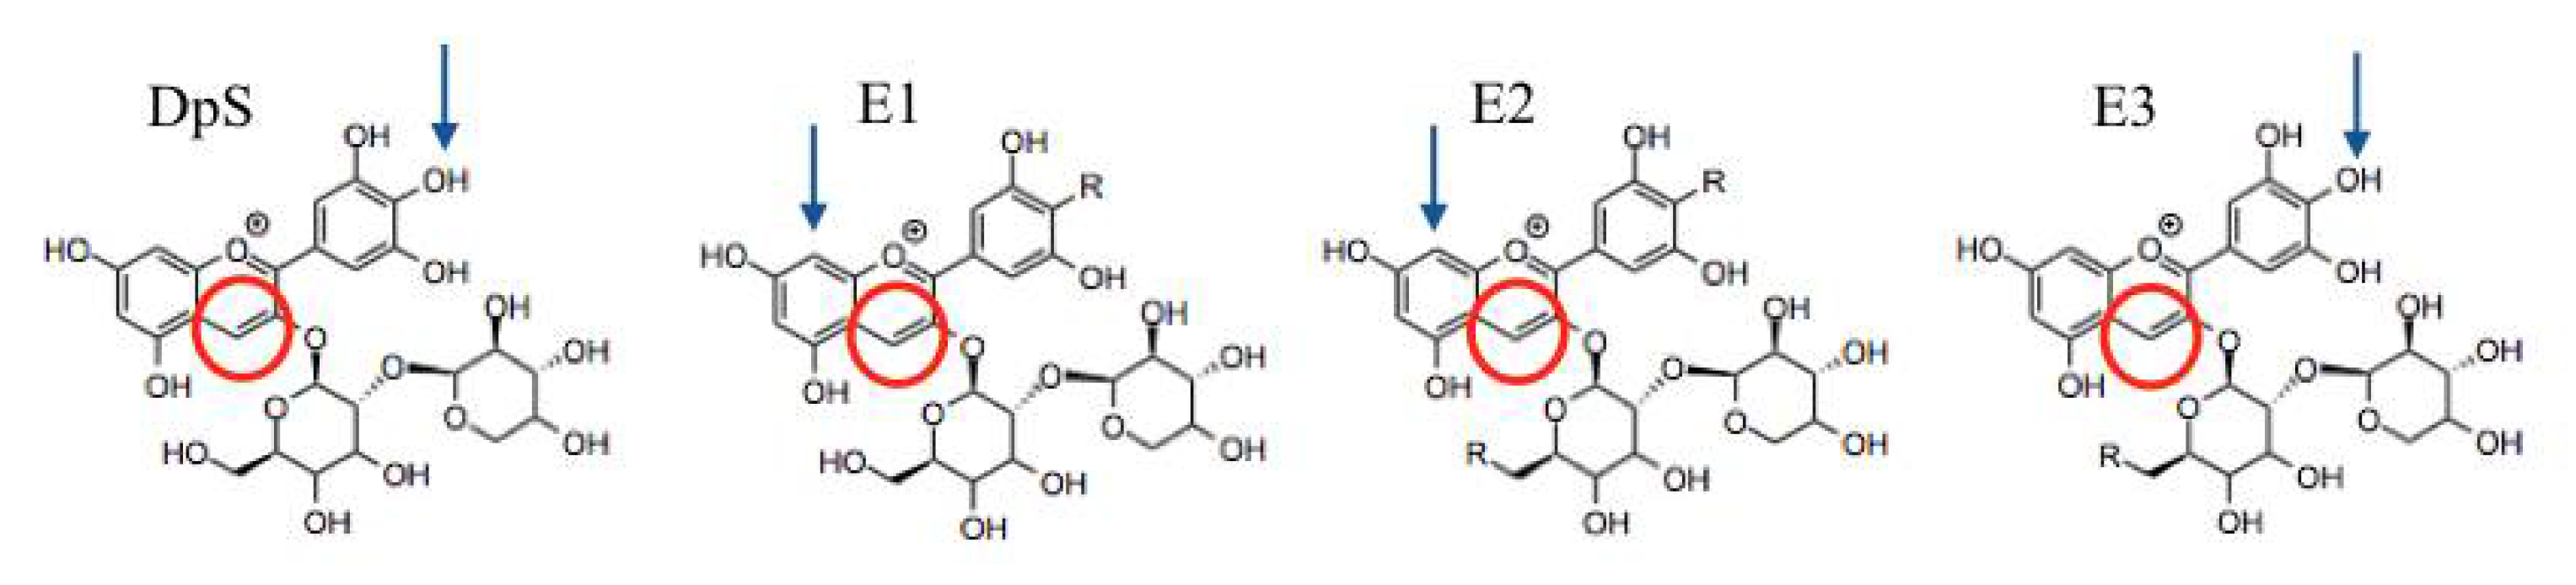
2.1. Experimental Results
2.2. Theoretical Results
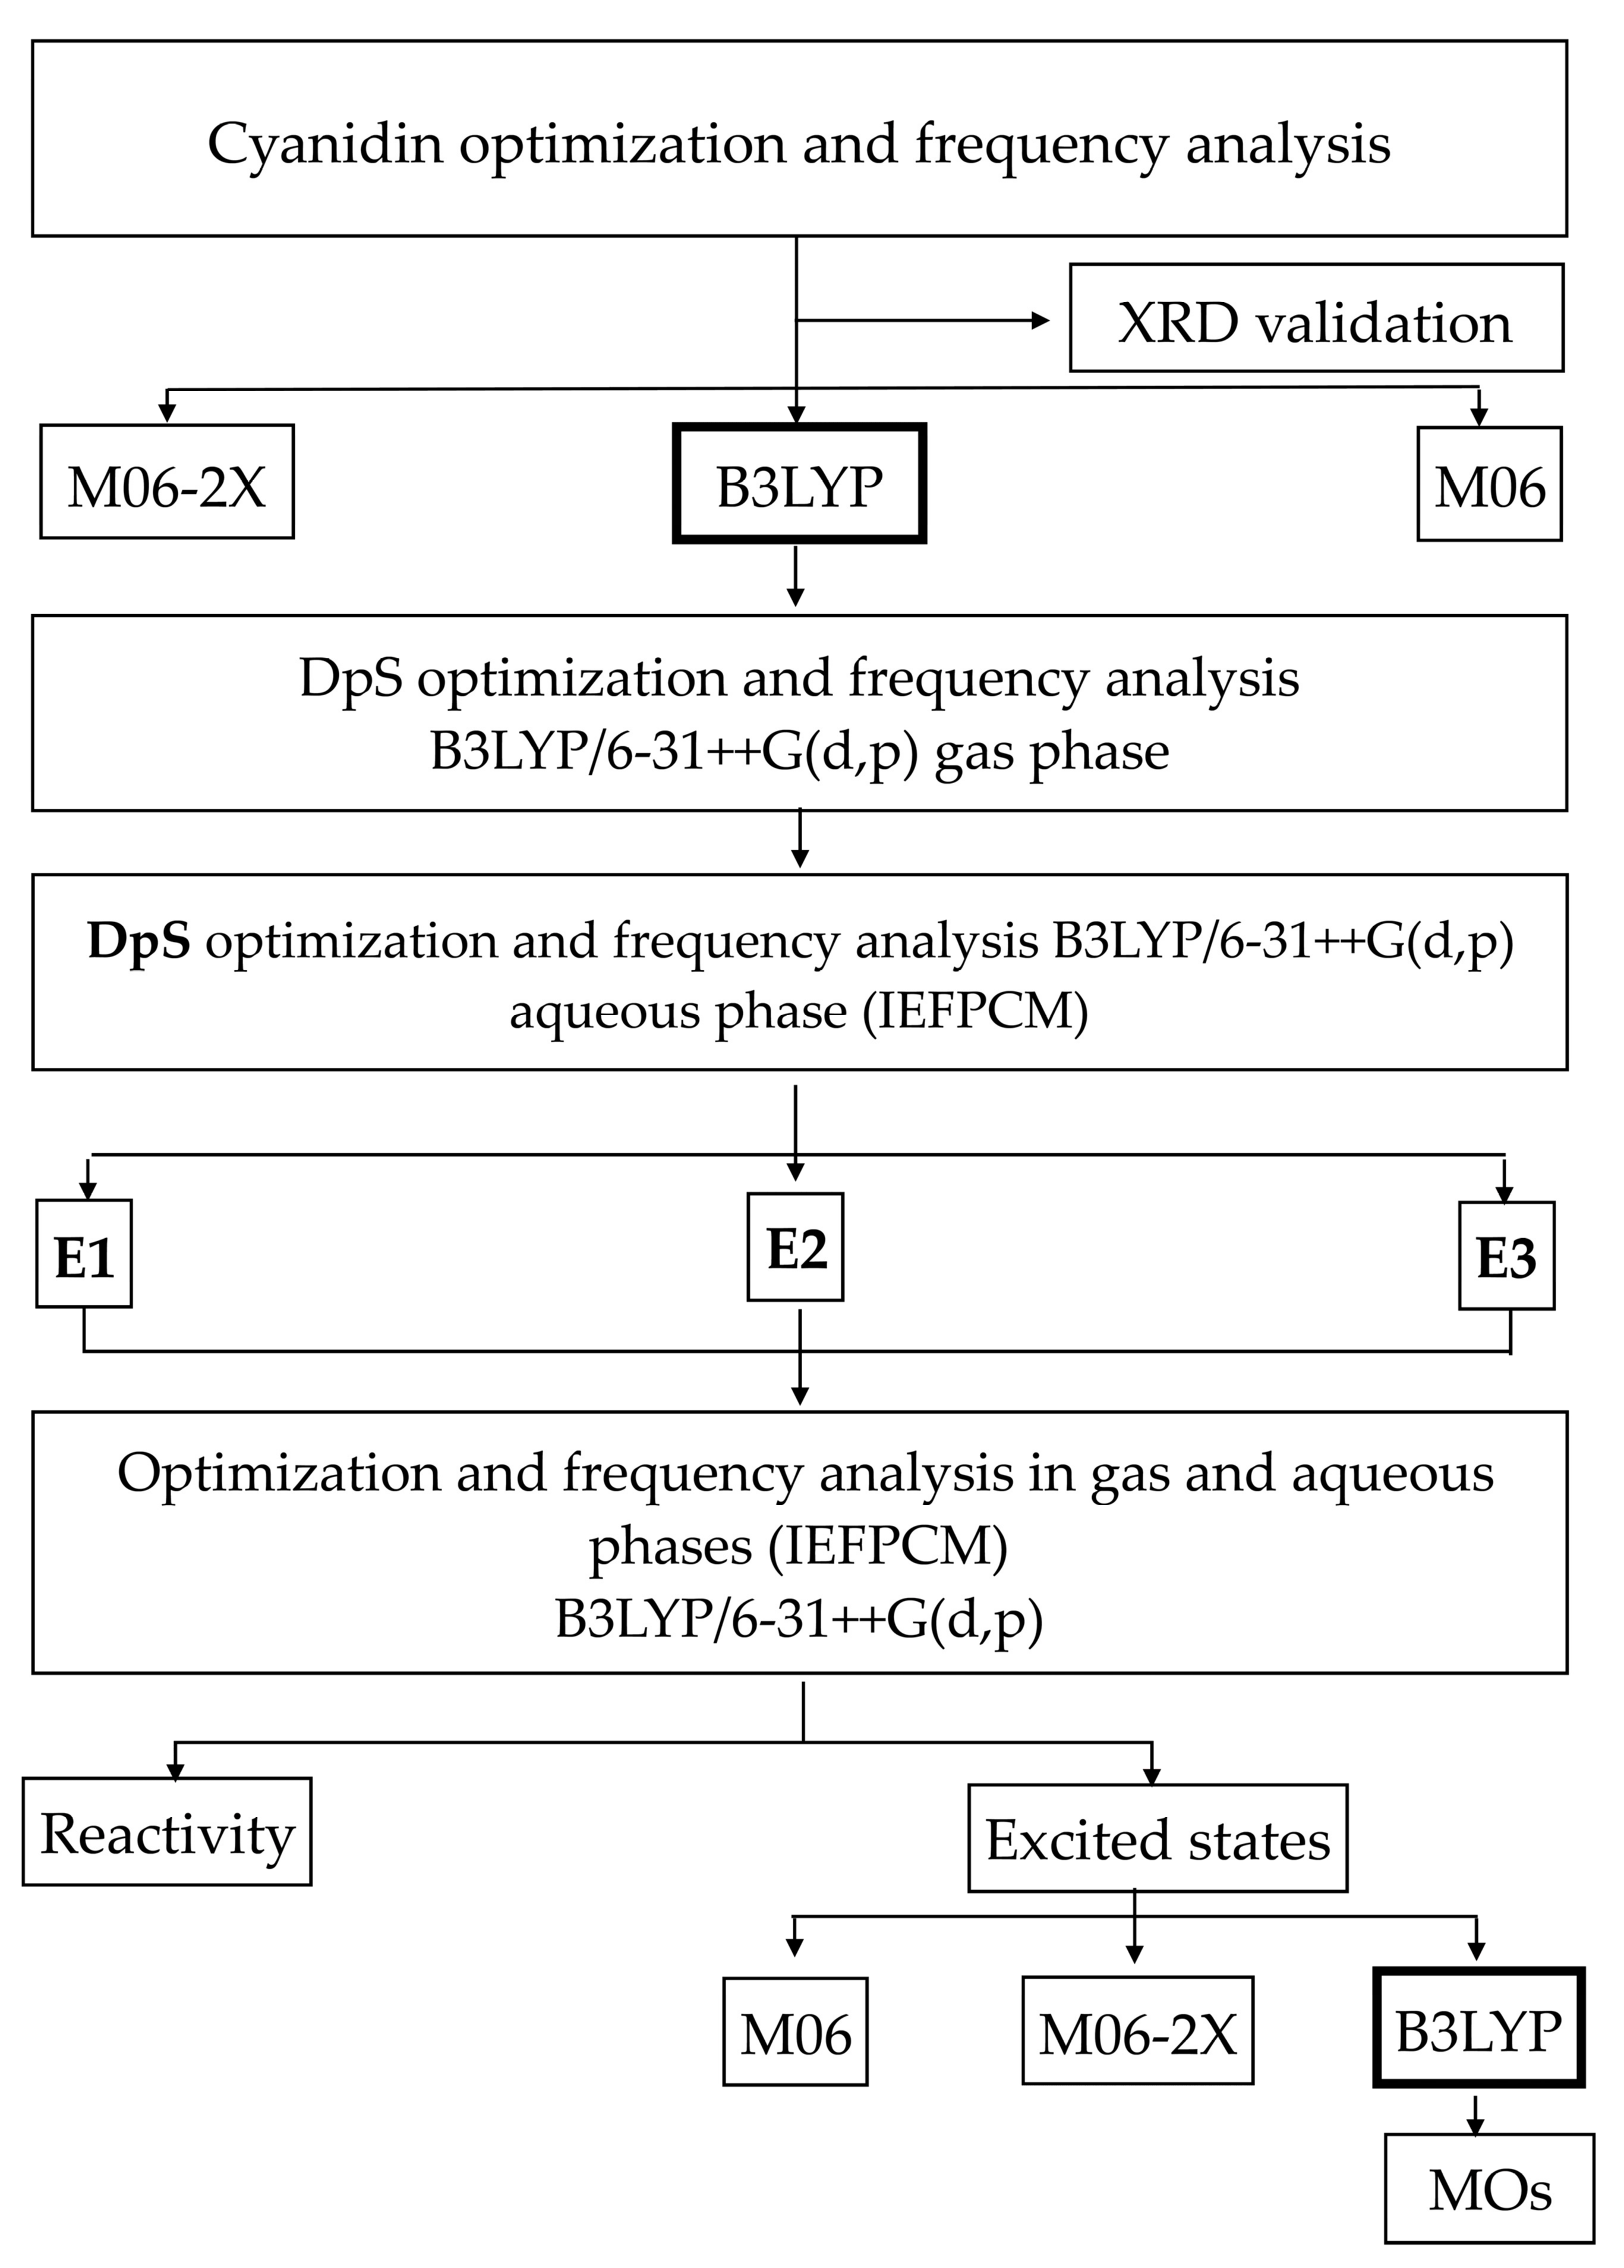
2.2.1. Theoretical Methodology Selection
2.2.2. Reactivity Analyses
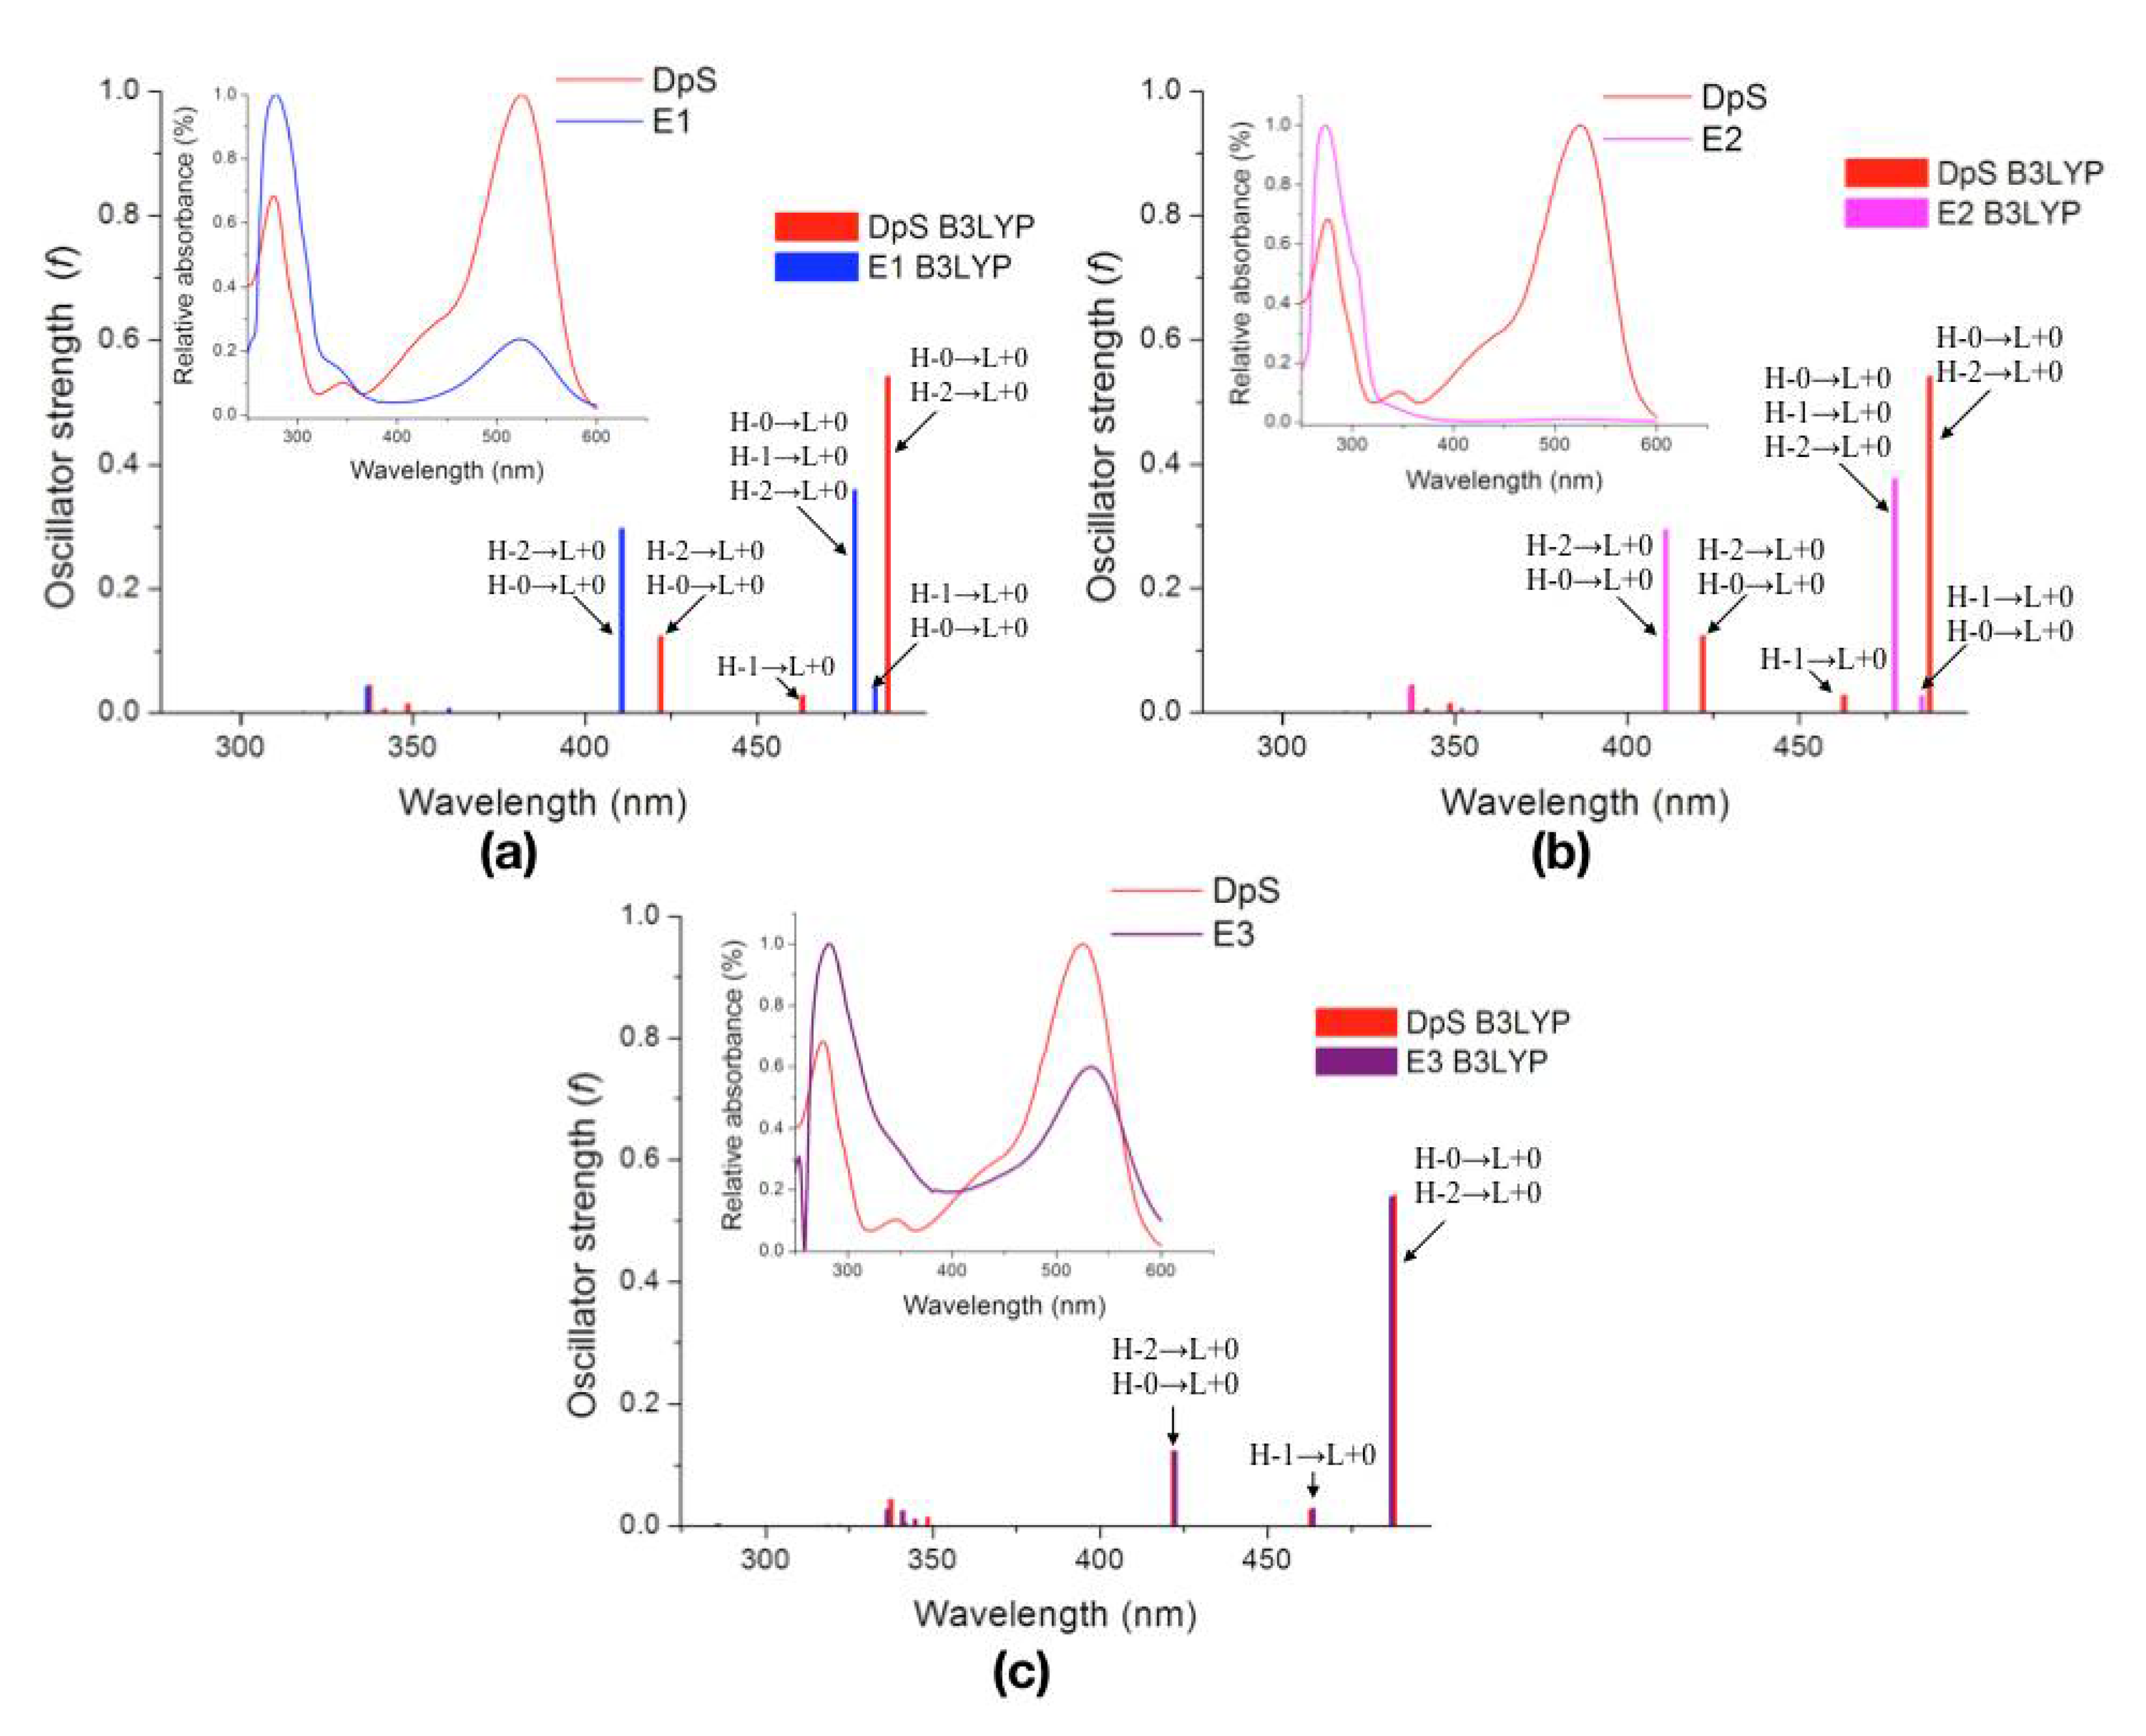
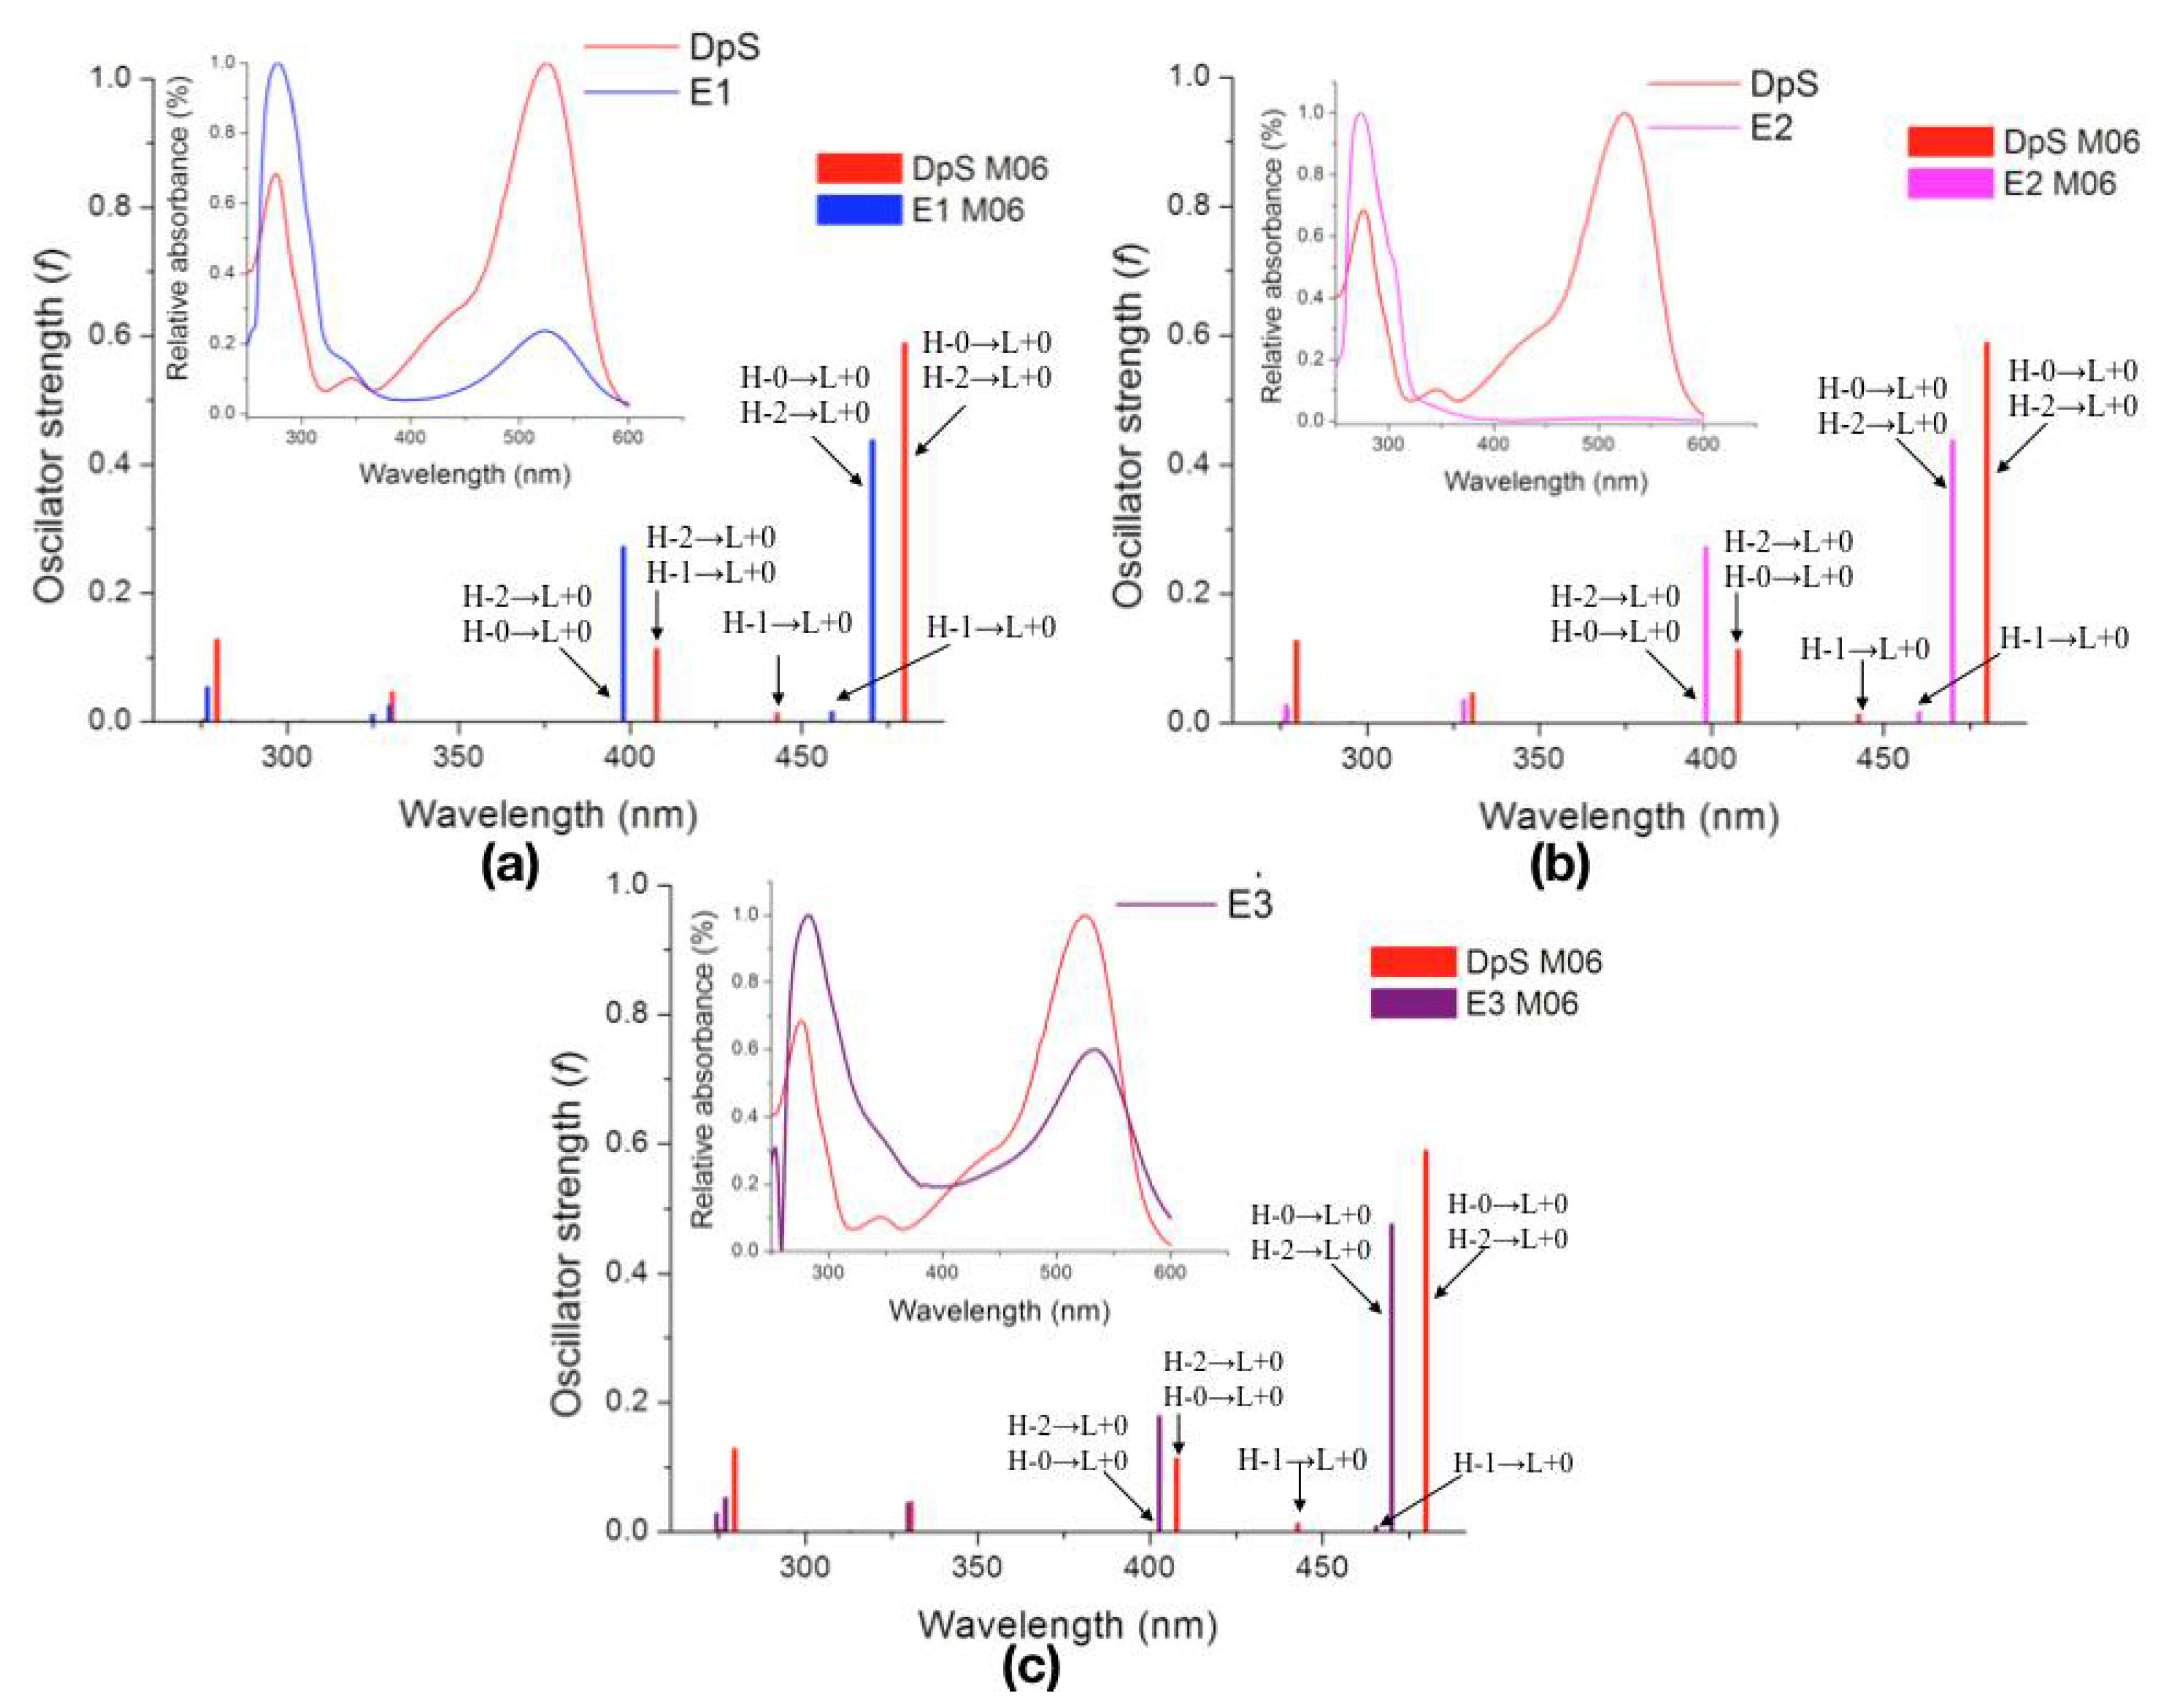
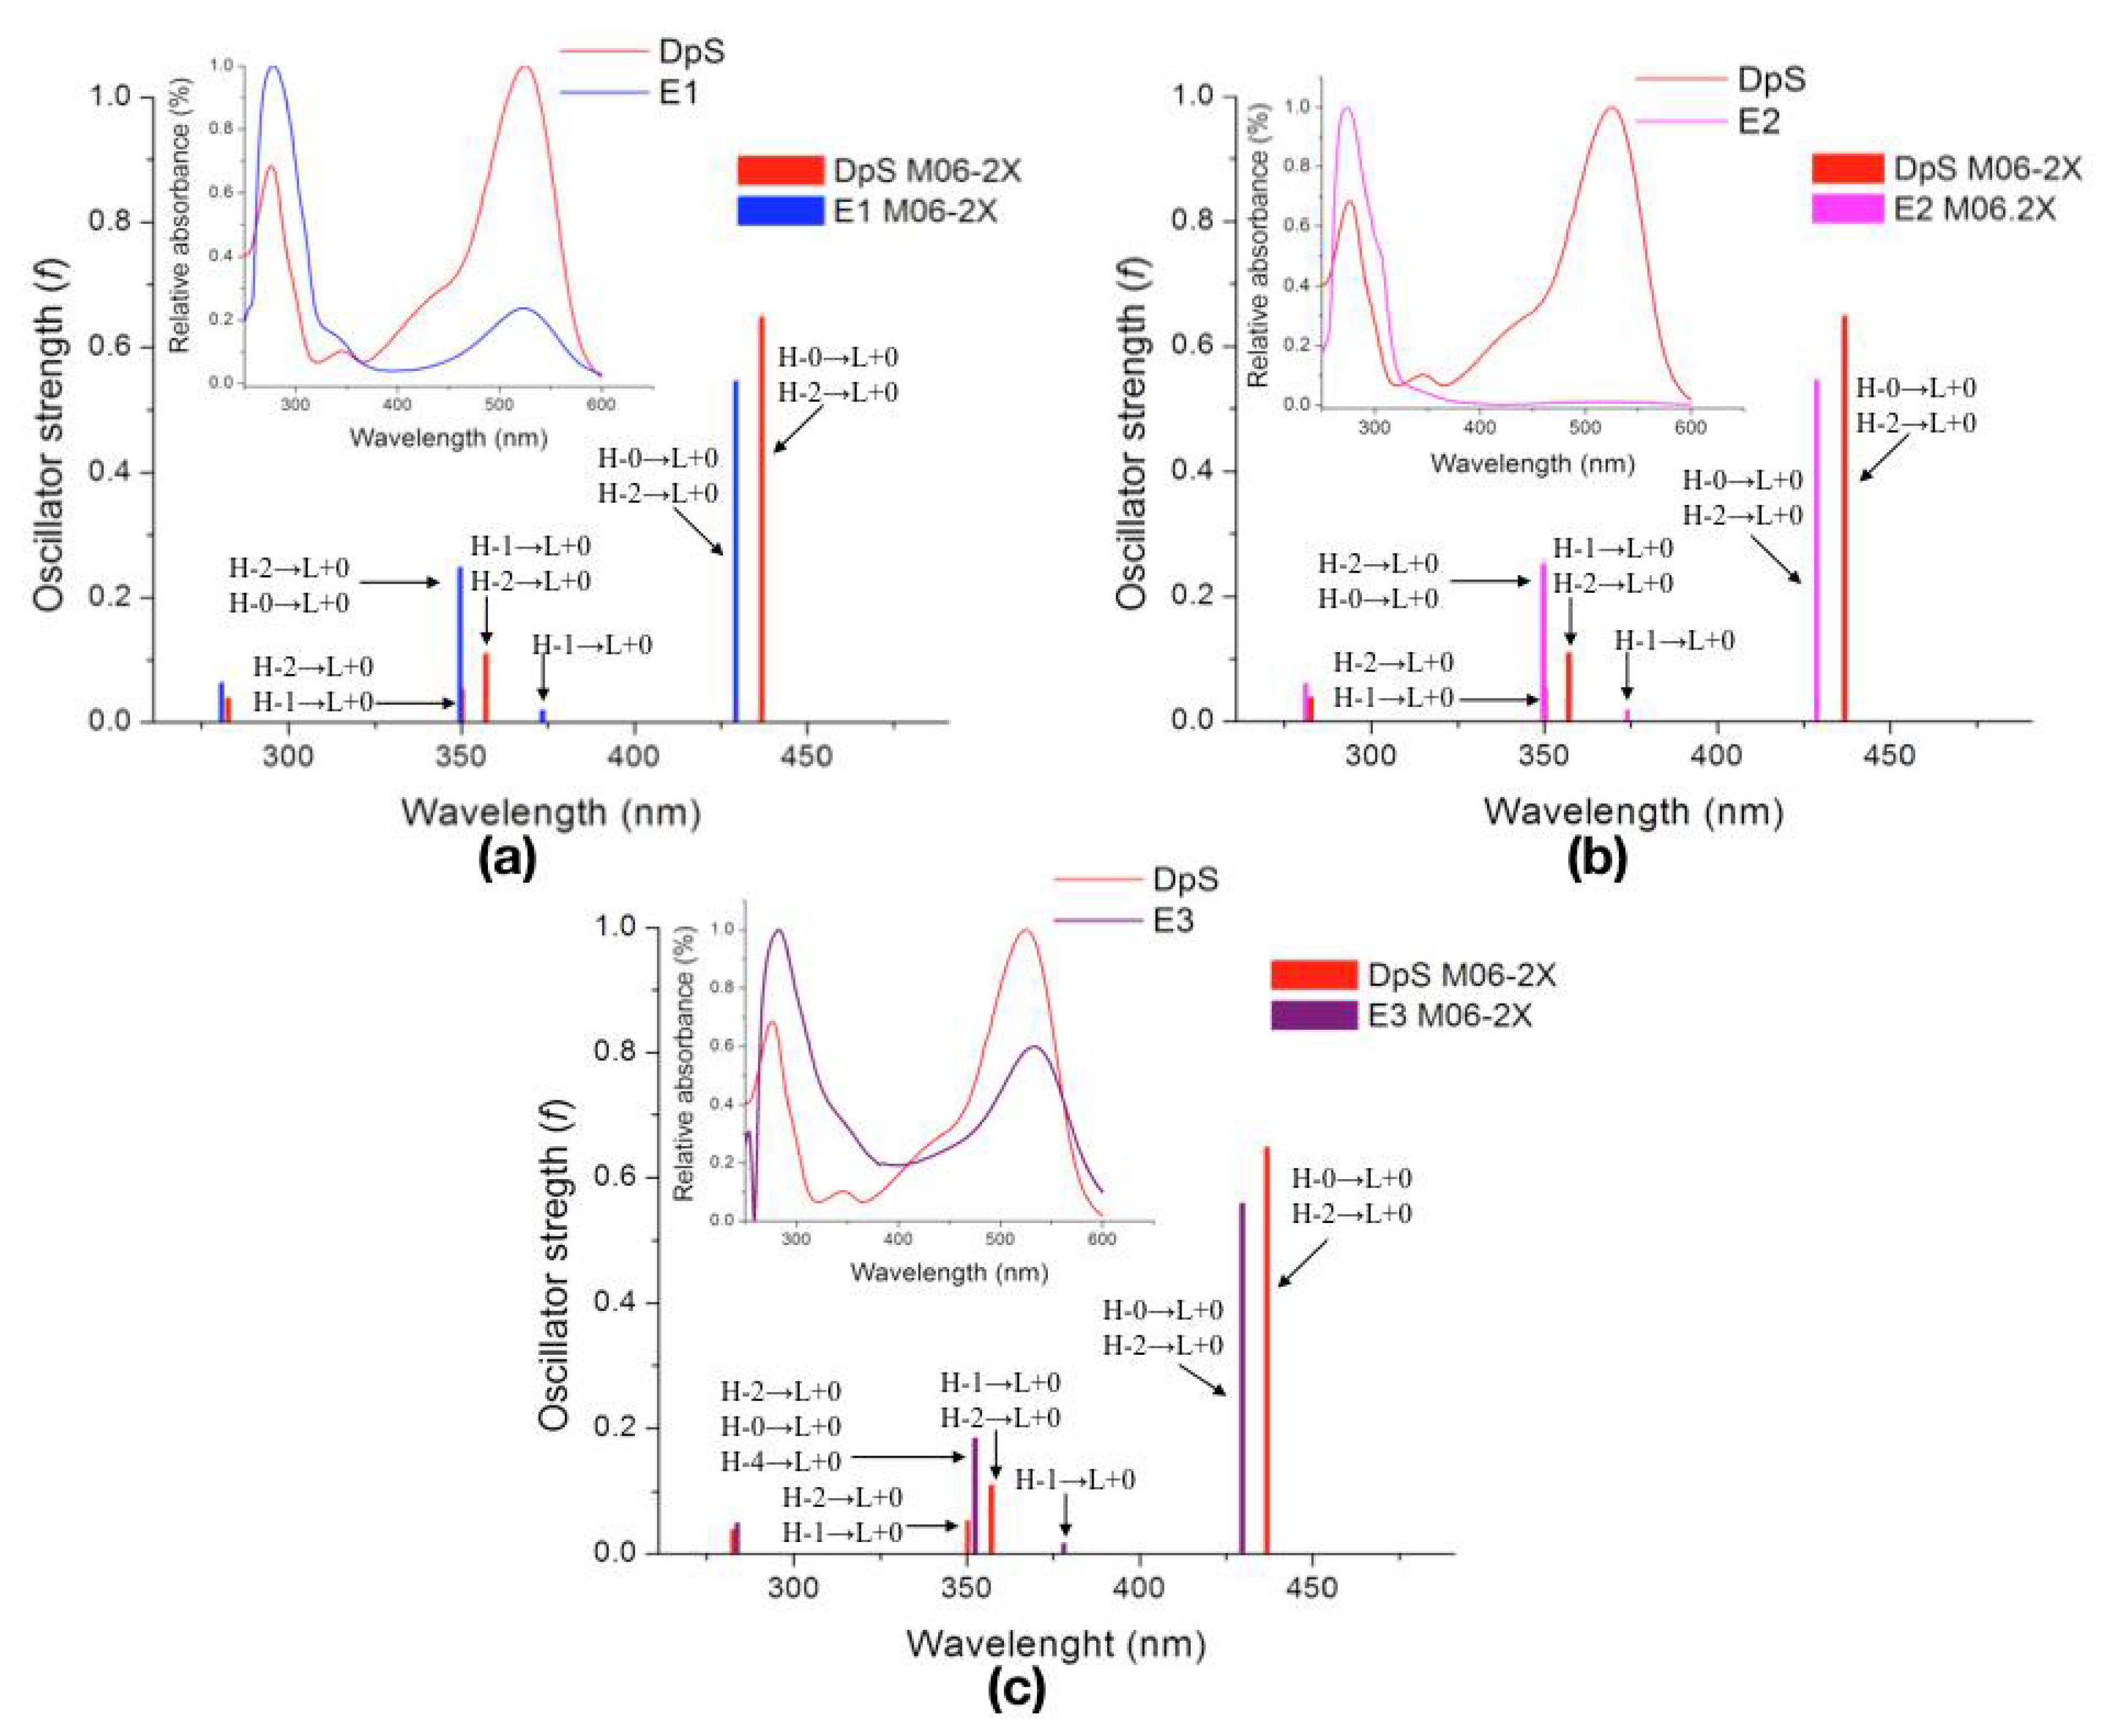
2.2.3. Excited States
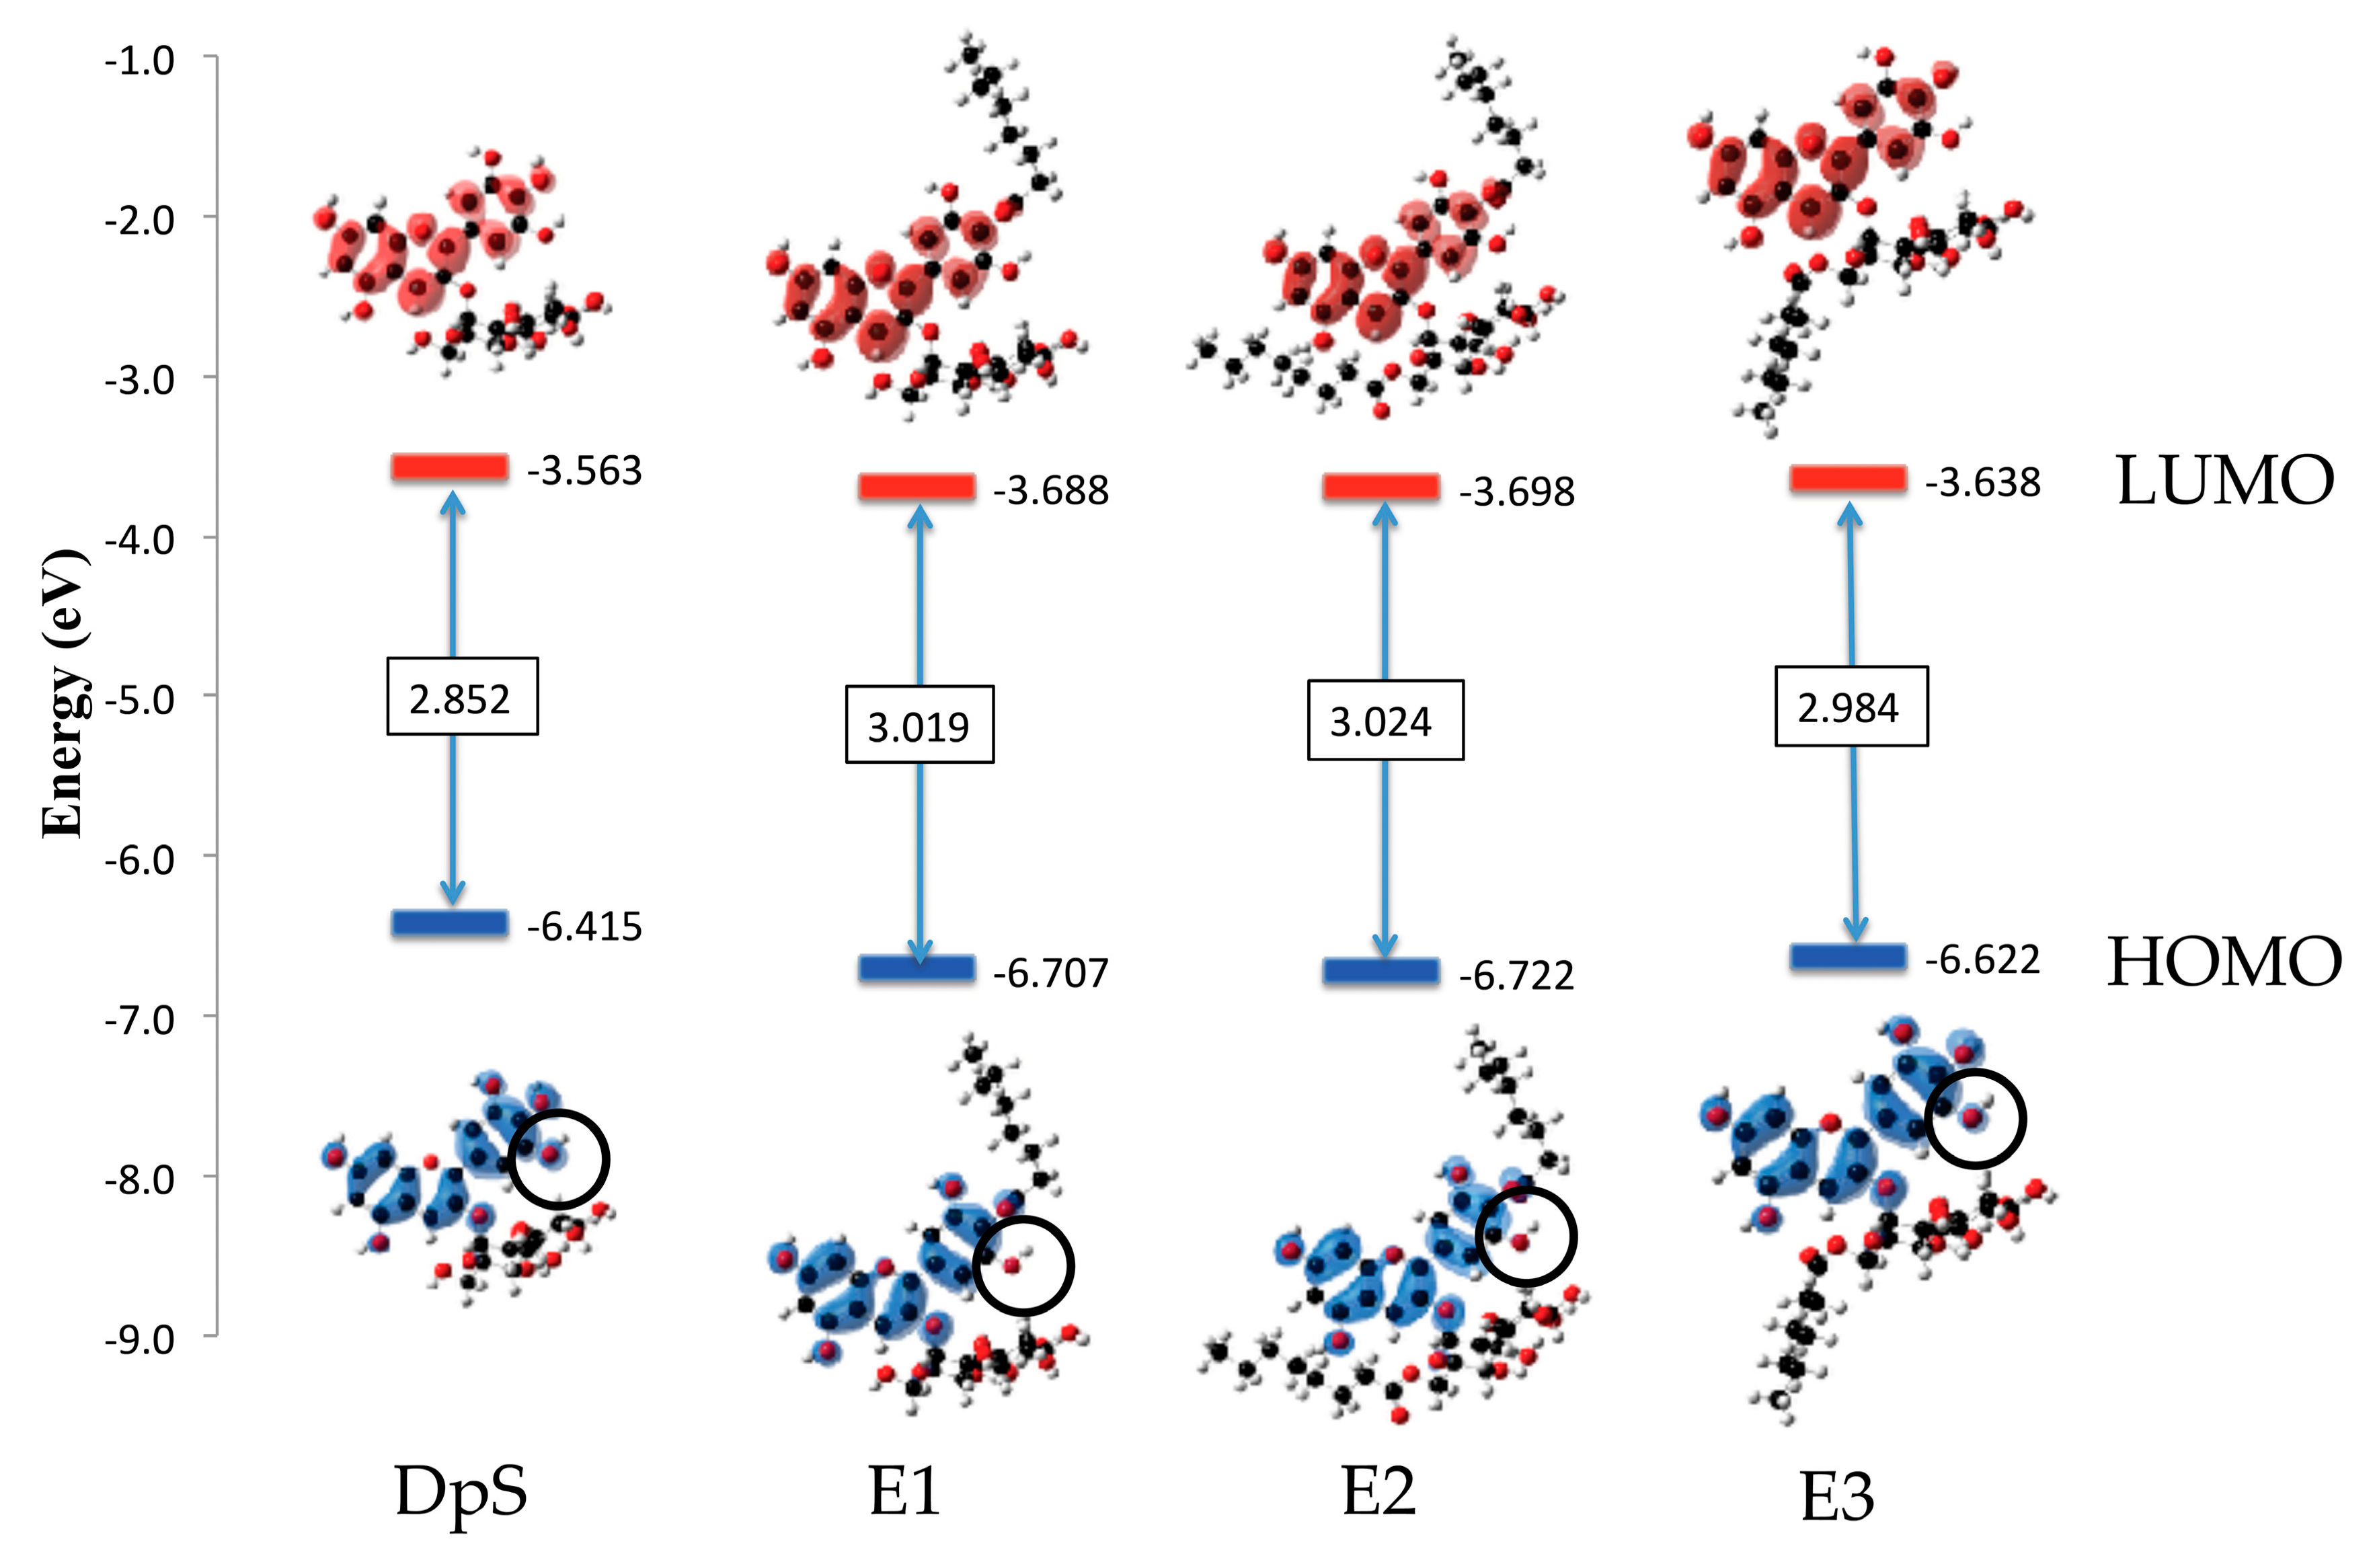
2.2.4. Molecular Orbitals
3. Materials and Methods
3.1. Experimental Methodology
3.1.1. Anthocyanin Extraction and Purification
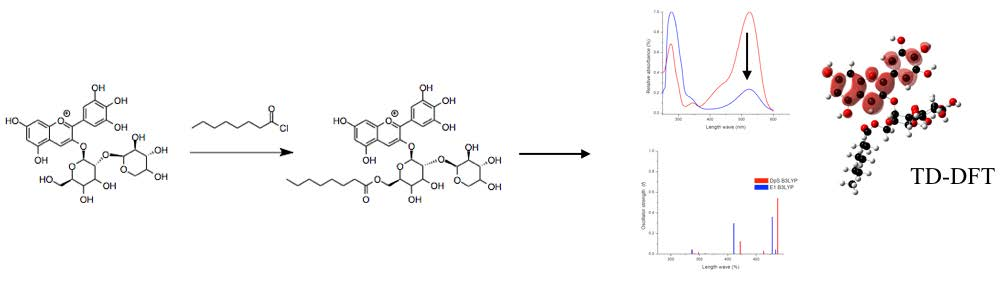
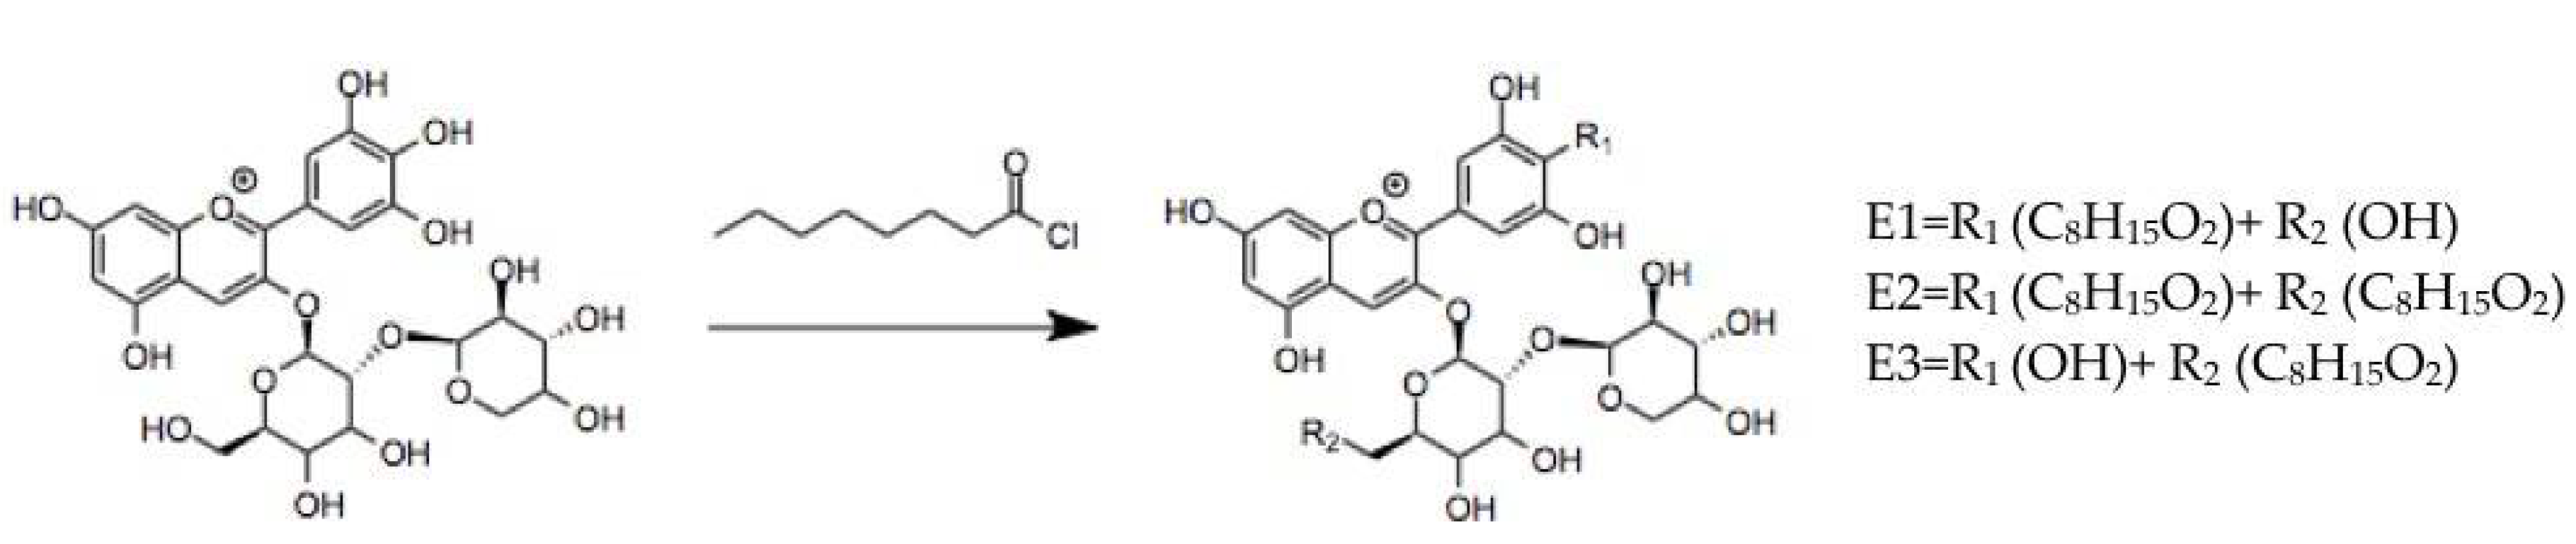
3.1.2. Anthocyanins Lipophilization
3.2. Theoretical Methodology
3.2.1. Methodology Selection
3.2.2. Local Reactivity
3.2.3. Excited States
3.2.4. Molecular Orbitals
4. Conclusions
Author Contributions
Funding
Acknowledgments
Conflicts of Interest
References
- Brouillard, R. Chemical structure of anthocyanins. In Anthocyanins as Food Colors, 1st ed.; Markakis, P., Ed.; Academic Press: New York, NY, USA, 1982; pp. 1–40. [Google Scholar]
- Fulcrand, H.; Atanasova, V.; Salas, E.; Cheynier, V. The fate of anthocyanins in wine: Are there determining factors? Red Wine Color Reveal. Myster. 2004, 886, 68–88. [Google Scholar] [CrossRef]
- Castañeda-Ovando, A.; de Lourdes Pacheco-Hernández, M.; Páez-Hernández, M.E.; Rodríguez, J.A.; Galán-Vidal, C.A. Chemical studies of anthocyanins: A review. Food Chem. 2009, 113, 859–871. [Google Scholar] [CrossRef]
- Cruz, L.; Fernandes, I.; Guimarães, M.; de Freitas, V.; Mateus, N. Enzymatic synthesis, structural characterization and antioxidant capacity assessment of a new lipophilic malvidin-3-glucoside–oleic acid conjugate. Food Funct. 2016, 7, 2754–2762. [Google Scholar] [CrossRef] [PubMed]
- Grajeda-Iglesias, C.; Salas, E.; Barouh, N.; Baréa, B.; Figueroa-Espinoza, M.C. Lipophilization and MS characterization of the main anthocyanins purified from hibiscus flowers. Food Chem. 2017, 230, 189–194. [Google Scholar] [CrossRef] [PubMed]
- Sakata, K.; Saito, N.; Honda, T. Ab initio study of molecular structures and excited states in anthocyanidins. Tetrahedron 2006, 62, 3721–3731. [Google Scholar] [CrossRef]
- Di Meo, F.; Sancho Garcia, J.C.; Dangles, O.; Trouillas, P. Highlights on anthocyanin pigmentation and copigmentation: A matter of flavonoid π-stacking complexation to be described by DFT-D. J. Chem. Theory Comput. 2012, 8, 2034–2043. [Google Scholar] [CrossRef] [PubMed]
- Chassaing, S.; Lefeuvre, D.; Jacquet, R.; Jourdes, M.; Teissedre, P.; Dangles, O.; Quideau, S. Physicochemical Studies of New Anthocyano-Ellagitannin Hybrid Pigments: About the Origin of the Influence of Oak C-Glycosidic Ellagitannins on Wine. Eur. J. Org. Chem. 2010, 2010, 55–63. [Google Scholar] [CrossRef]
- Trouillas, P.; Di Meo, F.; Gierschner, J.; Linares, M.; Sancho-García, J.C.; Otyepka, M. Optical properties of wine pigments: theoretical guidelines with new methodological perspectives. Tetrahedron 2015, 71, 3079–3088. [Google Scholar] [CrossRef]
- Kurtin, W.E.; Song, P.S. Electronic structures and spectra of some natural products of theoretical interest-I. Molecular orbital studies of anthocyanidins. Tetrahedron 1968, 24, 2255–2267. [Google Scholar] [CrossRef]
- Roothaan, C.C.J. New developments in molecular orbital theory. Rev. Mod. Phys. 1951, 23, 69–89. [Google Scholar] [CrossRef]
- Hohenberg, P.; Kohn, W. Inhomogeneous electron gas. Phys. Rev. 1964, 136, B864–B871. [Google Scholar] [CrossRef]
- Ridley, J.; Zerner, M. An intermediate neglect of differential overlap technique for spectroscopy: Pyrrole and the azines. Theor. Chim. Acta 1973, 32, 111–134. [Google Scholar] [CrossRef]
- Dewar, M.J.S.; Zoebisch, E.G.; Healy, E.F.; Stewart, J.J.P. Development and use of quantum mechanical molecular models. 76. AM1: A new general purpose quantum mechanical molecular model. J. Am. Chem. Soc. 1985, 107, 3902–3909. [Google Scholar] [CrossRef]
- Freitas, A.A.; Shimizu, K.; Quina, F.H. A Computational study of substituted flavylium salts and their quinonoidal conjugate-bases: S0 → S1 electronic transition, absolute pK. J. Braz. Chem. Soc. 2007, 18, 1537–1546. [Google Scholar] [CrossRef]
- Runge, E.; Gross, E.K.U. Density-functional theory for time-dependent systems. Phys. Rev. Lett. 1984, 52, 997–1000. [Google Scholar] [CrossRef]
- Quartarolo, A.D.; Russo, N. A computational study (TDDFT and RICC2) of the electronic spectra of pyranoanthocyanins in the gas phase and solution. J. Chem. Theory Comput. 2011, 7, 1073–1081. [Google Scholar] [CrossRef] [PubMed]
- Anouar, E.H.; Gierschner, J.; Duroux, J.L.; Trouillas, P. UV/Visible spectra of natural polyphenols: A time-dependent density functional theory study. Food Chem. 2012, 131, 79–89. [Google Scholar] [CrossRef]
- Sanchez-Bojorge, N.A.; Rodriguez-Valdez, L.M.; Glossman-Mitnik, D.; Flores-Holguin, N. Theoretical calculation of the maximum absorption wavelength for Cyanidin molecules with several methodologies. Comput. Theory Chem. 2015, 1067, 129–134. [Google Scholar] [CrossRef]
- Mohr, T.; Aroulmoji, V.; Ravindran, R.S.; Müller, M.; Ranjitha, S.; Rajarajan, G.; Anbarasan, P.M. DFT and TD-DFT study on geometries, electronic structures and electronic absorption of some metal free dye sensitizers for dye sensitized solar cells. Spectrochim. Acta Part A Mol. Biomol. Spectrosc. 2015, 135, 1066–1073. [Google Scholar] [CrossRef] [PubMed]
- Tomasi, J.; Mennucci, B.; Cammi, R. Quantum mechanical continuum solvation models. Chem. Rev. 2005, 105, 2999–3093. [Google Scholar] [CrossRef] [PubMed]
- Becke, A.D. Density-functional thermochemistry. III. The role of exact exchange. J. Chem. Phys. 1993, 98, 5648–5652. [Google Scholar] [CrossRef]
- Zhao, Y.; Truhlar, D.G. The M06 suite of density functionals for main group thermochemistry, thermochemical kinetics, noncovalent interactions, excited states, and transition elements: Two new functionals and systematic testing of four M06-class functionals and 12 other function. Theor. Chem. Acc. 2008, 120, 215–241. [Google Scholar] [CrossRef]
- De Castro, V.C.; da Silva, P.H.A.; de Oliveira, E.B.; Desobry, S.; Humeau, C. Extraction, identification and enzymatic synthesis of acylated derivatives of anthocyanins from jaboticaba (Myrciaria cauliflora) fruits. Int. J. Food Sci. Technol. 2014, 49, 196–204. [Google Scholar] [CrossRef]
- Trouillas, P.; Sancho-García, J.C.; de Freitas, V.; Gierschner, J.; Otyepka, M.; Dangles, O. Stabilizing and Modulating Color by Copigmentation: Insights from Theory and Experiment. Chem. Rev. 2016, 116, 4937–4982. [Google Scholar] [CrossRef] [PubMed] [Green Version]
- Nave, F.; Petrov, V.; Pina, F.; Teixeira, N.; Mateus, N.; de Freitas, V. Thermodynamic and kinetic properties of a red wine pigment: Catechin-(4,8)-malvidin-3-O-glucoside. J. Phys. Chem. B 2010, 114, 13487–13496. [Google Scholar] [CrossRef] [PubMed]
- Borkowski, T.; Szymusiak, H.; Gliszczynska-Swiglo, A.; Tyrakowska, B. The effect of 3-O-β-glucosylation on structural transformations of anthocyanidins. Food Res. Int. 2005, 38, 1031–1037. [Google Scholar] [CrossRef]
- Ueno, K. Cyanidinin bromide monohydrate (3,5,7,3′,4′-pentahydrxyflavylium bromide monohydrate). Acta Crystallogr. 1977, 114, 114–116. [Google Scholar] [CrossRef]
- Ditchfield, R.; Hehre, W.J.; Pople, J.A. Self-Consistent Molecular-Orbital Methods. IX. An Extended Gaussian-Type Basis for Molecular-Orbital Studies of Organic Molecules. J. Chem. Phys. 1971, 54, 724–728. [Google Scholar] [CrossRef]
- De Freitas, V.; Mateus, N. Chemical transformations of anthocyanins yielding a variety of colours (Review). Environ. Chem. Lett. 2006, 4, 175–183. [Google Scholar] [CrossRef]
- Vallverdú-Queralt, A.; Biler, M.; Meudec, E.; le Guernevé, C.; Vernhet, A.; Mazauric, J.; Legras, J.; Loonis, M.; Trouillas, P.; Cheynier, V.; et al. p-Hydroxyphenyl-pyranoanthocyanins: An experimental and theoretical investigation of their acid-base properties and molecular interactions. Int. J. Mol. Sci. 2016, 17, 1842. [Google Scholar] [CrossRef] [PubMed]
- Woodford, J.N. A DFT investigation of anthocyanidins. Chem. Phys. Lett. 2005, 410, 182–187. [Google Scholar] [CrossRef]
- Lee, C.; Yang, W.; Parr, R.G. Development of the Colle-Salvetti correlation-energy formula into a functional of the electron density. Phys. Rev. B 1988, 37, 785–789. [Google Scholar] [CrossRef]
- Rustioni, L.; di Meo, F.; Guillaume, M.; Failla, O.; Trouillas, P. Tuning color variation in grape anthocyanins at the molecular scale. Food Chem. 2013, 141, 4349–4357. [Google Scholar] [CrossRef] [PubMed] [Green Version]
- Grajeda-Iglesias, C.; Figueroa-Espinoza, M.C.; Barouh, N.; Baréa, B.; Fernandes, A.; de Freitas, V.; Salas, E. Isolation and Characterization of Anthocyanins from Hibiscus sabdariffa Flowers. J. Nat. Prod. 2016, 79, 1709–1718. [Google Scholar] [CrossRef] [PubMed]
- Miehlich, B.; Savin, A.; Stoll, H.; Preuss, H. Results obtained with the correlation energy density functionals of becke and Lee, Yang and Parr. Chem. Phys. Lett. 1989, 157, 200–206. [Google Scholar] [CrossRef]
- Yang, W.; Mortier, W.J. The Use of Global and Local Molecular Parameters for the Analysis of the Gas-Phase Basicity of Amines. J. Am. Chem. Soc. 1986, 108, 5708–5711. [Google Scholar] [CrossRef] [PubMed]
- Cancès, E.; Mennucci, B.; Tomasi, J. A new integral equation formalism for the polarizable continuum model: Theoretical background and applications to Isotropic and anisotropic dielectrics. J. Chem. Phys. 1997, 107, 3032–3041. [Google Scholar] [CrossRef]
- Frisch, M.J.; Trucks, G.W.; Schlegel, H.B.; Scuseria, G.E.; Robb, M.A.; Cheeseman, J.R.; Scalmani, G.; Barone, V.; Petersson, G.A.; Nakatsuji, H.; et al. Gaussian 16, Revision B.01; Gaussian, Inc.: Wallingford, CT, USA, 2016. [Google Scholar]
Sample Availability: Samples of the compounds are not available from the authors. |


| Base 6-31++G(d,p) | ||||
|---|---|---|---|---|
| Distances * (Å) | Experimental | B3LYP | M06-2X | M06 |
| C2-C1′ | 1.453 | 1.451 | 1.453 | 1.427 |
| C4a-C5 | 1.432 | 1.432 | 1.429 | 1.411 |
| C1′-C2′ | 1.409 | 1.417 | 1.411 | 1.413 |
| C6-C7 | 1.413 | 1.418 | 1.417 | 1.401 |
| C2-C3 | 1.396 | 1.408 | 1.402 | 1.410 |
| C3′-C4′ | 1.400 | 1.415 | 1.411 | 1.394 |
| C4-C4a | 1.382 | 1.399 | 1.396 | 1.404 |
| C6′-C1′ | 1.404 | 1.411 | 1.402 | 1.415 |
| C4a-C8a | 1.408 | 1.421 | 1.414 | 1.393 |
| C7-C8 | 1.387 | 1.398 | 1.392 | 1.427 |
| R2 | - | 0.9329 | 0.9185 | 0.9193 |
| Molecule | λcalc (nm) | Oscillator Strength (f) | Electronic Transitions | |||
|---|---|---|---|---|---|---|
| DpS | 1 | 487.7 | 0.5409 | H-0→L+0 (+92%) | H-2→L+0 (+7%) | |
| 2 | 463.0 | 0.0273 | H-1→L+0 (+98%) | |||
| 3 | 422.0 | 0.1237 | H-2→L+0 (+89%) | H-0→L+0 (+8%) | ||
| E1 | 1 | 484.0 | 0.0417 | H-1→L+0 (+85%) | H-0→L+0 (+14%) | |
| 2 | 478.1 | 0.3598 | H-0→L+0 (+76%) | H-1→L+0 (+15%) | H-2→L+0 (+8%) | |
| 3 | 410.7 | 0.2969 | H-2→L+0 (+89%) | H-0→L+0 (+9%) | ||
| E2 | 1 | 485.4 | 0.0265 | H-1→L+0 (+90%) | H-0→L+0 (+9%) | |
| 2 | 477.6 | 0.3769 | H-0→L+0 (+81%) | H-1→L+0 (+10%) | H-2→L+0 (+8%) | |
| 3 | 411.2 | 0.2943 | H-2→L+0 (+89%) | H-0→L+0 (+9%) | ||
| E3 | 1 | 486.9 | 0.5391 | H-0→L+0 (+91%) | H-2→L+0 (+7%) | |
| 2 | 463.5 | 0.0280 | H-1→L+0 (+99%) | |||
| 3 | 422.4 | 0.1212 | H-2→L+0 (+89%) | H-0→L+0 (+8%) | ||
| Molecule | λcalc (nm) | Oscillator Strength (f) | Electronic Transition | ||
|---|---|---|---|---|---|
| DpS | 1 | 479.9 | 0.5886 | H-0→L+0 (+93%) | H-2→L+0 (+7%) |
| 2 | 442.9 | 0.0137 | H-1→L+0 (+99%) | ||
| 3 | 407.8 | 0.1136 | H-2→L+0 (+89%) | H-0→L+0 (+7%) | |
| E1 | 1 | 470.4 | 0.4380 | H-0→L+0 (+92%) | H-2→L+0 (+7%) |
| 2 | 458.7 | 0.0151 | H-1→L+0 (+99%) | ||
| 3 | 398.1 | 0.2720 | H-2→L+0 (+89%) | H-0→L+0 (+8%) | |
| E2 | 1 | 469.9 | 0.4380 | H-0→L+0 (+92%) | H-2→L+0 (+7%) |
| 2 | 460.1 | 0.0167 | H-1→L+0 (+99%) | ||
| 3 | 398.5 | 0.2719 | H-2→L+0 (+89%) | H-0→L+0 (+8%) | |
| E3 | 1 | 469.9 | 0.4750 | H-0→L+0 (+91%) | H-2→L+0 (+8%) |
| 2 | 465.5 | 0.0094 | H-1→L+0 (+99%) | ||
| 3 | 402.7 | 0.1793 | H-2→L+0 (+87%) | H-0→L+0 (+8%) | |
| Molecule | λcalc (nm) | Oscillator Strength (f) | Electronic Transition | |||
|---|---|---|---|---|---|---|
| DpS | 1 | 436.9 | 0.6474 | H-0→L+0 (+92%) | H-2→L+0 (+6%) | |
| 2 | 357.2 | 0.1095 | H-1→L+0 (+50%) | H-2→L+0 (+39%) | ||
| 3 | 350.3 | 0.0532 | H-2→L+0 (+49%) | H-1→L+0 (+46%) | ||
| E1 | 1 | 429.5 | 0.5450 | H-0→L+0 (+93%) | H-2→L+0 (+6%) | |
| 2 | 373.5 | 0.0188 | H-1→L+0 (+97%) | |||
| 3 | 349.7 | 0.2484 | H-2→L+0 (+86%) | H-0→L+0 (+5%) | ||
| E2 | 1 | 428.9 | 0.5452 | H-0→L+0 (+93%) | H-2→L+0 (+6%) | |
| 2 | 374.0 | 0.0182 | H-1→L+0 (+97%) | |||
| 3 | 349.8 | 0.2515 | H-2→L+0 (+85%) | H-0→L+0 (+5%) | ||
| E3 | 1 | 429.8 | 0.5582 | H-0→L+0 (+91%) | H-2→L+0 (+7%) | |
| 2 | 378.1 | 0.0161 | H-1→L+0 (+97%) | |||
| 3 | 352.5 | 0.1833 | H-2→L+0 (+83%) | H-0→L+0 (+7%) | H-4→L+0 (+5%) | |
© 2018 by the authors. Licensee MDPI, Basel, Switzerland. This article is an open access article distributed under the terms and conditions of the Creative Commons Attribution (CC BY) license (http://creativecommons.org/licenses/by/4.0/).
Share and Cite
Márquez-Rodríguez, A.S.; Grajeda-Iglesias, C.; Sánchez-Bojorge, N.-A.; Figueroa-Espinoza, M.-C.; Rodríguez-Valdez, L.-M.; Fuentes-Montero, M.E.; Salas, E. Theoretical Characterization by Density Functional Theory (DFT) of Delphinidin 3-O-Sambubioside and Its Esters Obtained by Chemical Lipophilization. Molecules 2018, 23, 1587. https://doi.org/10.3390/molecules23071587
Márquez-Rodríguez AS, Grajeda-Iglesias C, Sánchez-Bojorge N-A, Figueroa-Espinoza M-C, Rodríguez-Valdez L-M, Fuentes-Montero ME, Salas E. Theoretical Characterization by Density Functional Theory (DFT) of Delphinidin 3-O-Sambubioside and Its Esters Obtained by Chemical Lipophilization. Molecules. 2018; 23(7):1587. https://doi.org/10.3390/molecules23071587
Chicago/Turabian StyleMárquez-Rodríguez, Ana Selene, Claudia Grajeda-Iglesias, Nora-Aydeé Sánchez-Bojorge, María-Cruz Figueroa-Espinoza, Luz-María Rodríguez-Valdez, María Elena Fuentes-Montero, and Erika Salas. 2018. "Theoretical Characterization by Density Functional Theory (DFT) of Delphinidin 3-O-Sambubioside and Its Esters Obtained by Chemical Lipophilization" Molecules 23, no. 7: 1587. https://doi.org/10.3390/molecules23071587