A Lateral Flow Strip Based Aptasensor for Detection of Ochratoxin A in Corn Samples


1
Key Laboratory of Agro-Product Quality and Safety, Institute of Quality Standards and Testing Technology for Agro-Products, Chinese Academy of Agricultural Sciences, Beijing 100081, China
2
College of Food Science and Technology, Hainan University, Haikou 570228, China
*
Author to whom correspondence should be addressed.
Molecules 2018, 23(2), 291; https://doi.org/10.3390/molecules23020291
Submission received: 19 December 2017
/
Revised: 11 January 2018
/
Accepted: 15 January 2018
/
Published: 31 January 2018
(This article belongs to the Special Issue Nucleic Acid Aptamers)
Abstract
:Ochratoxin A (OTA) is a mycotoxin identified as a contaminant in grains and wine throughout the world, and convenient, rapid and sensitive detection methods for OTA have been a long-felt need for food safety monitoring. Herein, we presented a new competitive format based lateral flow strip fluorescent aptasensor for one-step determination of OTA in corn samples. Briefly, biotin-cDNA was immobilized on the surface of a nitrocellulose filter on the test line. Without OTA, Cy5-labeled aptamer combined with complementary strands formed a stable double helix. In the presence of OTA, however, the Cy5-aptamer/OTA complexes were generated, and therefore less free aptamer was captured in the test zone, leading to an obvious decrease in fluorescent signals on the test line. The test strip showed an excellent linear relationship in the range from 1 ng·mL−1 to 1000 ng·mL−1 with the LOD of 0.40 ng·mL−1, IC15 value of 3.46 ng·mL−1 and recoveries from 96.4% to 104.67% in spiked corn samples. Thus, the strip sensor developed in this study is an acceptable alternative for rapid detection of the OTA level in grain samples.
1. Introduction
Ochratoxin A (OTA), a mycotoxin produced from species of fungi including Penicillium verrucosum, Aspergillus ochraceus, Aspergillus carbonarius and Aspergillus niger [1,2], could be easily found in many improperly stored food and agricultural products [3] such as coffee [4], beer [5] and wine [6,7]. Due to its chemical stability during food and feed processing, OTA may reside in foodstuff, spices and animal feed [8,9,10,11]. In addition, OTA is a nephrotoxic toxin [12] with strong carcinogenic effects on rodents [13]. OTA has been proven to be teratogenic, embryotoxic, genotoxic, neurotoxic and immunosuppressive [14,15]. Due to the extreme toxicity of OTA, many countries and organizations have set guidelines and recommendations for the maximum residue level (MRL) [16], for example, 5 μg·kg−1 and 10 μg·kg−1 of OTA are considered acceptable in cereals by the World Health Organization and European Union and China, respectively.
Rapid and sensitive detection of OTA in foodstuff has become greatly important for food safety control. OTA detection in food is usually performed using instruments, such as high-performance liquid chromatography (HPLC) [17], ultra-performance liquid chromatography with fluorescence detector (UPLC-FLD) [18], ultra-fast liquid chromatography coupled with electrospray ionization tandem mass spectrometry (UFLC-ESI-MS/MS) [19], gas chromatography-mass spectrometry (GC-MS) [20] and liquid chromatography-mass spectrometry (LC-MS) [21]. Although they have good accuracy and reproducibility, they cannot be widely used for rapid onsite detection because of expensive equipment, demand for highly qualified personnel and costly and time-consuming pretreatment.
To overcome the limitations of chromatographic analysis and immunoassay methods such as enzyme-linked immunosorbent assay (ELISA) [22], immunochromatographic assay (ICGA) [23] and electrochemical biosensors [24] have been developed. However, these screening methods rely heavily on antibodies with the following disadvantages: time-consuming production of antibodies, poor stability and high sensitivity to pH and temperature, modification difficulty and high cost, high immunogenecity and low bioavailability in in vivo applications. Therefore, seeking substitutes for antibodies involved in the detection methods is tremendously important.
Aptamers [25,26] are single-stranded oligonucleotides selected from a DNA or RNA library in vitro by a standard process named systematic evolution of ligands by exponential enrichment (SELEX), which can bind to target molecules with high affinity and specificity by folding into specific three-dimensional structures. Aptamer has high specificity, chemical stability, long shelf-life, chemical synthesis and modification simplicity, high biodegradation stability and low vulnerability to denaturation [27], and therefore aptamers have so far been widely applied to drug delivery [28], disease diagnosis [29], targeted therapy [30], cell imaging [31] and biotechnology for detection of proteins [32], metal ions [33], antibiotics [34], pesticides [35], and even cells [36], bacteria [37] and others [38]. Aptamer-based rapid detection methods include colorimetry, fluorescence, matrix-assisted laser desorption/ionization mass spectrometry (MALDI-MS), electrogenerated chemiluminescence (ECL), surface plasmon resonance (SPR), polarization, western blotting and electrochemistry [39]. And aptamer-based biosensors are considered a promising molecular diagnostic approach in the future. At present, there are many methods based on aptamer for detection of OTA, such as electrochemical [40,41,42], colorimetry [43], fluorescence [44,45], chemiluminescence [46] and up-converting luminescence [47]. Although they have good sensitivity and specificity, they cannot be used for onsite one-step detection with the following disadvantages: a small linear range in tests, complex synthesis and immobilization process of nanoparticles or sensor.
Lateral flow assay (LFA) [48] has been used for detection of clinical and non-clinical analytes with the “one-step” and “onsite” advantages. Lateral flow strip biosensor (LFB) [49] based aptamer has been employed to follow biorecognition events, such as detecting Escherichia coli O157:H7 [50], IgE [51], thrombin [52] and ATP [53] with unique characteristics of sensitivity, specificity and operation simplicity. And complex and expensive instrumentation are not needed for the method. For OTA, the LFB based aptamer is mainly visual based GNP-antibody [54,55] and GNP-aptamer (gold nanoparticles or GNPs) [56,57]. But, these strips are mostly used for qualitative [58,59] or half quantitative detection of OTA [60,61] without specific detection range or with a small linear range in testing. And, they are mostly used to detect OTA in wine and grape must [62]. So, the purpose of this study was to establish a stable, rapid, simple and accurate lateral flow strip biosensor to quantitatively detect OTA in corn samples with a large linear range for testing.
Here, we described a novel aptamer-based lateral flow fluorescent strip for rapid detection of OTA. The fluorescence intensity of this lateral flow strip biosensor exhibited a good linear relationship with the OTA concentration ranging from 1 ng·mL−1 to 1000 ng·mL−1 with the LOD of 0.40 ng·mL−1 and IC15 value of 3.46 ng·mL−1. The developed strip was also applied for detection of OTA in corn samples, and a satisfactory result could be obtained. Therefore, it is a promising technique for practical use in mycotoxin screening for agricultural products and food.
2. Materials and Methods
2.1. Reagents and Apparatus
OTA, aflatoxin B1 (AFB1), aflatoxin G1 (AFG1), aflatoxin M1 (AFM1), zearalenone (ZEN), fumonisin B1 (FB1) and tris(hydroxymethyl)aminomethane (Tris) (purity > 99%) were purchased from Sigma-Aldrich (St. Louis, MO, USA). Poly(ethylene glycol) with average M.W. 20,000 (PEG 20,000) was obtained from J&K Scientific Ltd. (Beijing, China). Polyoxyethylene sorbitan monolaurate (Tween 20) was from Tokyo Chemical Industry Co., Ltd. (Shanghai, China). Absorbent pad (H5076), sample pad (GL-b04), nitrocellulose filter (Sartorius CN140) and backing pad were acquired from Shanghai Jieyi Biotechnology Co., Ltd. (Shanghai, China).
Ultrapure water used throughout all experiments was purified by a Milli-Q system (Millipore, Bedford, MA, USA) with the resistivity of 18.2 MΩ cm. Strip signals were scanned using an ESLF10-SO-1010 Lateral Flow Studio V3.3.8 (Qiagen, Germany). Every test strip was prepared with a 3050 dispensing platform and KM-3100 Cutter (BioDot, Irvine, CA, USA).
All other reagents, purchased from Beijing Chemical Reagent Company (Beijing, China), were of analytical grade and used without further purification or treatment unless otherwise specified.
Buffer A, B, C and D components of Tris-HCl were all 10 mM Tris, 120 mM NaCl, 20 mM CaCl2, 5 mM KCl, 0.1% Tween-20 (v/v), 1% PEG 20,000 (m/v), 2% sucrose (m/v) and 5% methanol, and at pH 7.4, 8.0, 8.5 and 9.0, respectively. Buffer E was 10 mM sodium citrate-hydrochloric acid solution, 200 mM NaCl, 20 mM CaCl2, 20 mM MgCl, 0.1% Tween-20 (v/v), 1% PEG 20,000 (m/v), 2% sucrose (m/v) and 5% methanol. Buffer F consisted of 100 mL 10 mM PB solution, 0.5 g PEG 20,000, 1 g sucrose, 0.1 mL Tween-20, 0.02 g MgSO4 and 0.05 g (NH4)2SO4.
All DNA sequences were ordered from Sangon Biotech (Shanghai, China), and lyophilized powder was dissolved in ultrapure water and stored at 4 °C before use. DNA sequences used in this research were as follows (from 5′ to 3′):
OTA aptamer [63]:
- 5′-cy5-(CH2)6-aaa-aaa-aaa-aaa-aaa-aaa-gat-cgg-gtg-tgg-gtg-gcg-taa-agg-gag-cat-cgg-aca-3′
- cDNA: 5′-biotin-(CH2)6-aaa-aaa-tgt-ccg-atg-ctc-cct-tta-cgc-cac-cca-cac-ccg-atc-3′
- probe 2: 5′-biotin-(CH2)6-ttt-ttt-ttt-ttt-ttt-ttt-3′
2.2. Preparation of Streptavidin-Biotin-DNA Probe Conjugates
To immobilize test and control probes on a nitrocellulose (NC) membrane, biotin-modified cDNA and probe 2 were combined with streptavidin to form streptavidin-biotin-DNA conjugate via a biotin-streptavidin affinity reaction. Briefly, streptavidin was dissolved into 0.01 M phosphate-buffered saline (PBS) solution (pH 7.4) at 1 mg·mL−1, and 5 μL of 1 mg·mL−1 streptavidin solution and 35 μL of 3 μM biotin-cDNA solution were incubated at 25 °C for 2 h. Probe 2 was similarly constructed as described above with probe 2 used instead of cDNA. Then, the streptavidin-biotin-DNA probe conjugate was stored at 4 °C and used for subsequent fabrication of the control and test lines on the strips.
2.3. Fabrication of Aptamer-Based Strips
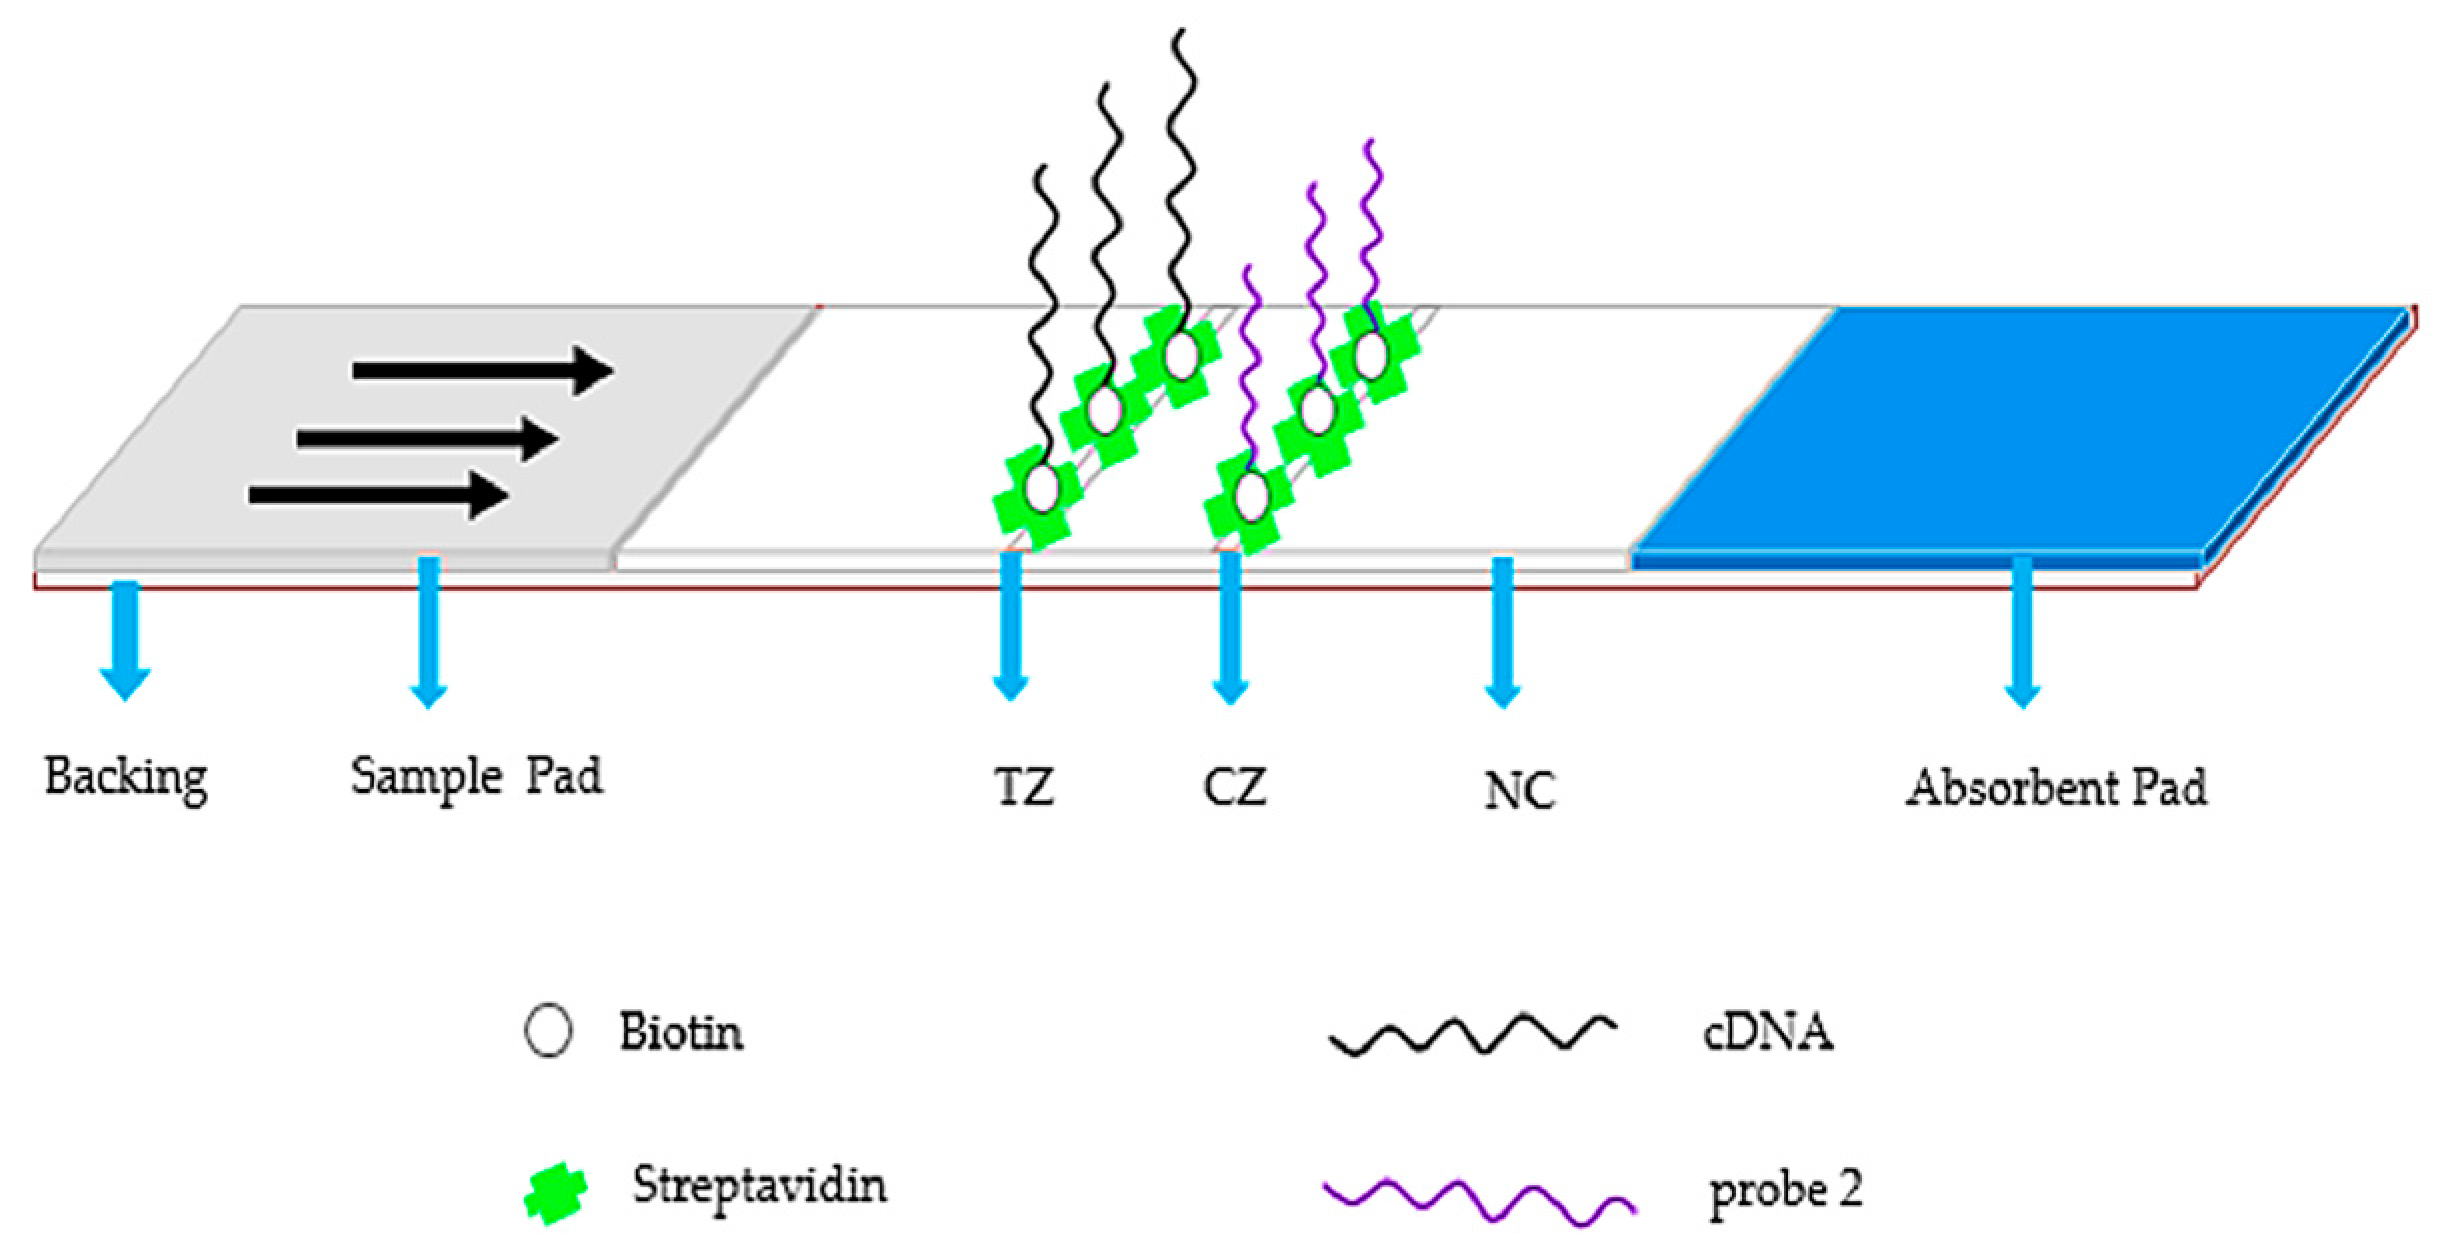
The preparation of the strips is shown in Figure 1. NC membrane, sample pad and absorbent pad were all pasted onto a plastic backing plate and overlapped 2 mm with each other in sequence. Streptavidin-cDNA and streptavidin-DNA probe 2 conjugates were dispersed at an interval of 5 mm on the membrane as the test line and control line, respectively. The two lines were positioned at a 4 mm interval. The plate was dried at 37 °C for 30 min and then cut into 4.0 mm wide strips using the programmable strip cutter KM-3100. They were then put into valve bags, which were stored at 4 °C for future detection tests.
2.4. OTA Detection
In our test, 50 μL of sample solution was mixed with 5 μL of Cy5-labeled aptamer in an Eppendorf (EP) tube and incubated at room temperature for 10 min. Then, each 50 μL portion of the mixture was dripped onto the sample pad of a lateral flow test strip, allowing all liquid to migrate along the strip for absorption. 10 min later, the test strip was analyzed by Lateral Flow Studio so that the fluorescent intensities on both the T line and C line were acquired in the integrated area. To minimize system and random errors in the experiment and increase the signal to noise ratio (SNR), the ratio of the T/C fluorescence intensity was calculated as an evaluation indicator for drawing a standard curve for quantification of the OTA concentrations in the samples. A fluorescence decrease in the T/C value was detected each time OTA was applied.
2.5. Strip Sensitivity and Specificity Detection
To detect the sensitivity of the strip, 5 μL of 0.05 μM Cy5-labeled aptamer was mixed with 50 μL of OTA standard solution at different concentrations (0, 1, 3, 10, 30, 100, 300 and 1000 ng·mL−1) by diluting OTA stock solution (100 μg·mL−1 in methanol) with Tris-HCl buffer. The reaction solution was stirred and incubated at room temperature for 10 min, and then each 50 μL portion was pipetted onto the sample pad. After 10 min, the fluorescence intensities at both the test line and control line were measured by Lateral Flow Studio. The procedure was repeated to estimate the selectivity of the method by replacing OTA with other mycotoxins.
2.6. Applications of Test Strips to Samples
Accurately weighed 2 g of ground corn powder sample was extracted with 10 mL of methanol-water (70:30, v/v) by violently shaking for 5 min, followed by sonication in an ultrasound bath for further 30 min at room temperature and centrifugation at 10,000 rpm for 10 min. The supernatant was dried by nitrogen blowing and then dissolved using 10 mL pH 8.5 Tris-HCl to minimize the influence of the complex matrix and methanol. After that, corn sample extract solution was spiked with OTA stock solution (100 μg·mL−1 in methanol) at a series of concentrations of 3, 10, and 30 ng·mL−1. Then, 50 μL portion of each sample extract solution containing OTA standard solution was applied to the aptamer-based lateral flow strip for detection of OTA, which was repeated three times. The test results were compared with the actual concentrations, and finally the average recovery was calculated.
3. Results and Discussion
3.1. Concept and Aptasensor Mechanism
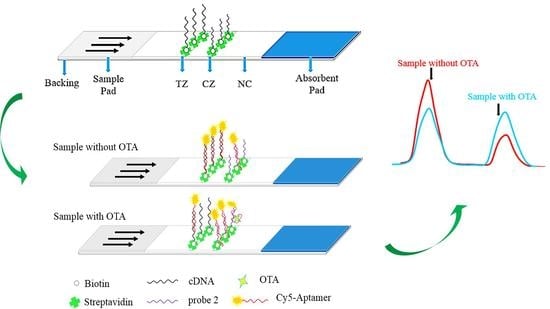
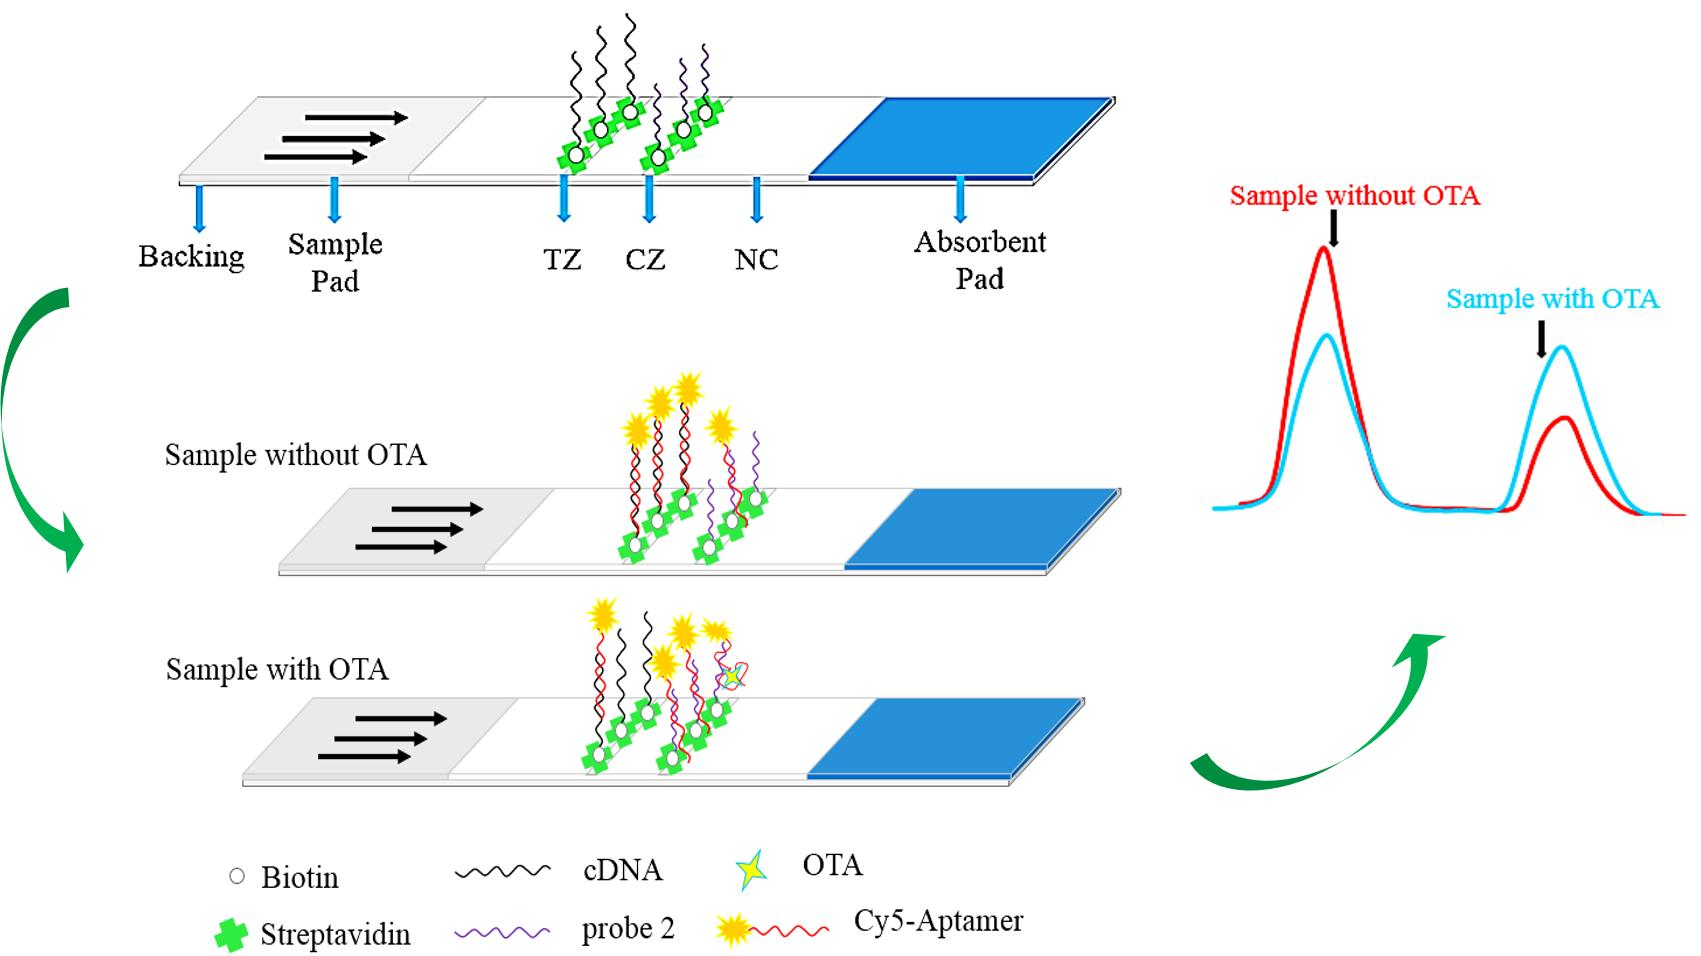
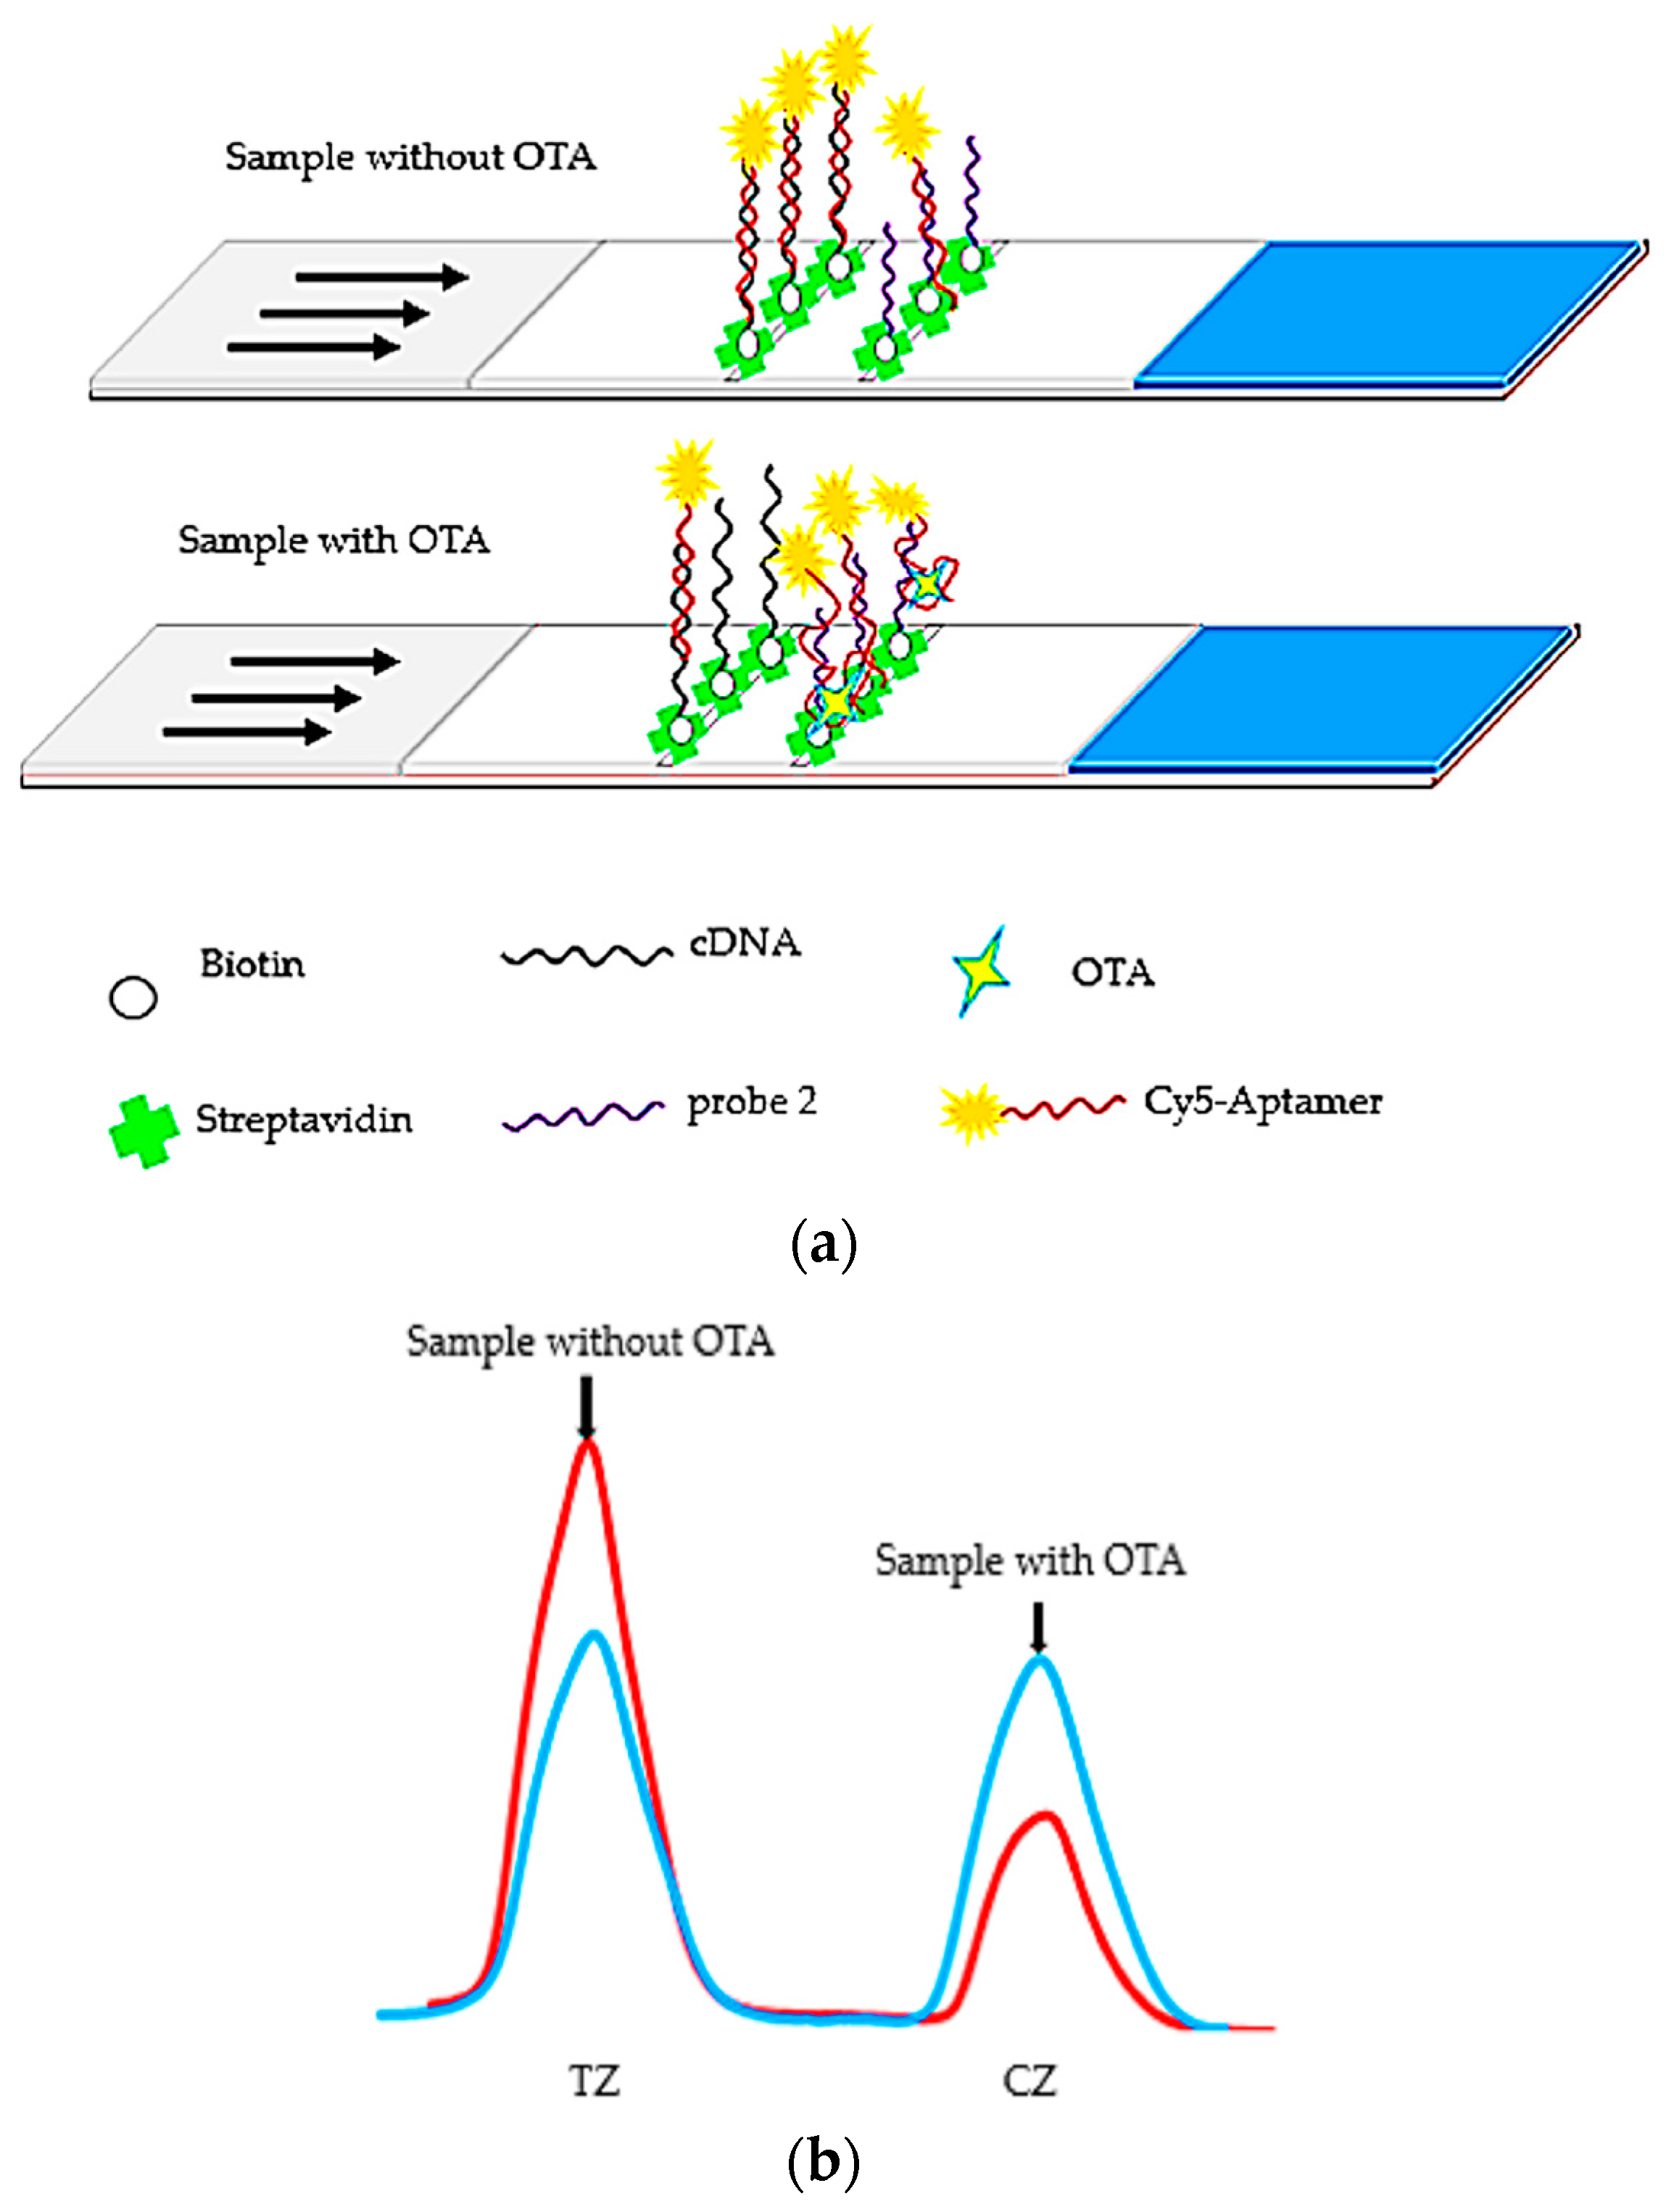
The proposed aptamer-based lateral flow fluorescent strip for OTA detection was fabricated, as shown in Figure 1. In the schematic diagram (Figure 2), the LFB was prepared based on the competitive reaction between cDNA (test line) and Cy5-labeled aptamer, indicating that the fluorescence intensity ratio of the T line to C line was inversely proportional to the OTA concentration in the samples. When the sample solution without OTA was dropped onto the sample pad, the mixture migrated to the test zone with capillary dynamic and Cy5-labeled aptamer was captured largely by cDNA to form a stable double helix, resulting in strong fluorescence intensities in the control and test zones, respectively. In the presence of OTA, however, OTA would combine with the aptamer probe, reducing the amount of Cy5-labeled aptamer, which could hybridize to cDNA on the test line, and therefore the fluorescence intensity became weaker. In other words, the more aptamer-OTA complexes existed in the solution, the less free Cy5-labeled aptamer would be captured on the test line. And no matter whether OTA was present in the detection solution, aptamer probes would definitely hybridize with probe 2 on the control line, ensuring the detection validity. If not, the detection may become invalid.
3.2. Optimization of the Aptamer Concentration
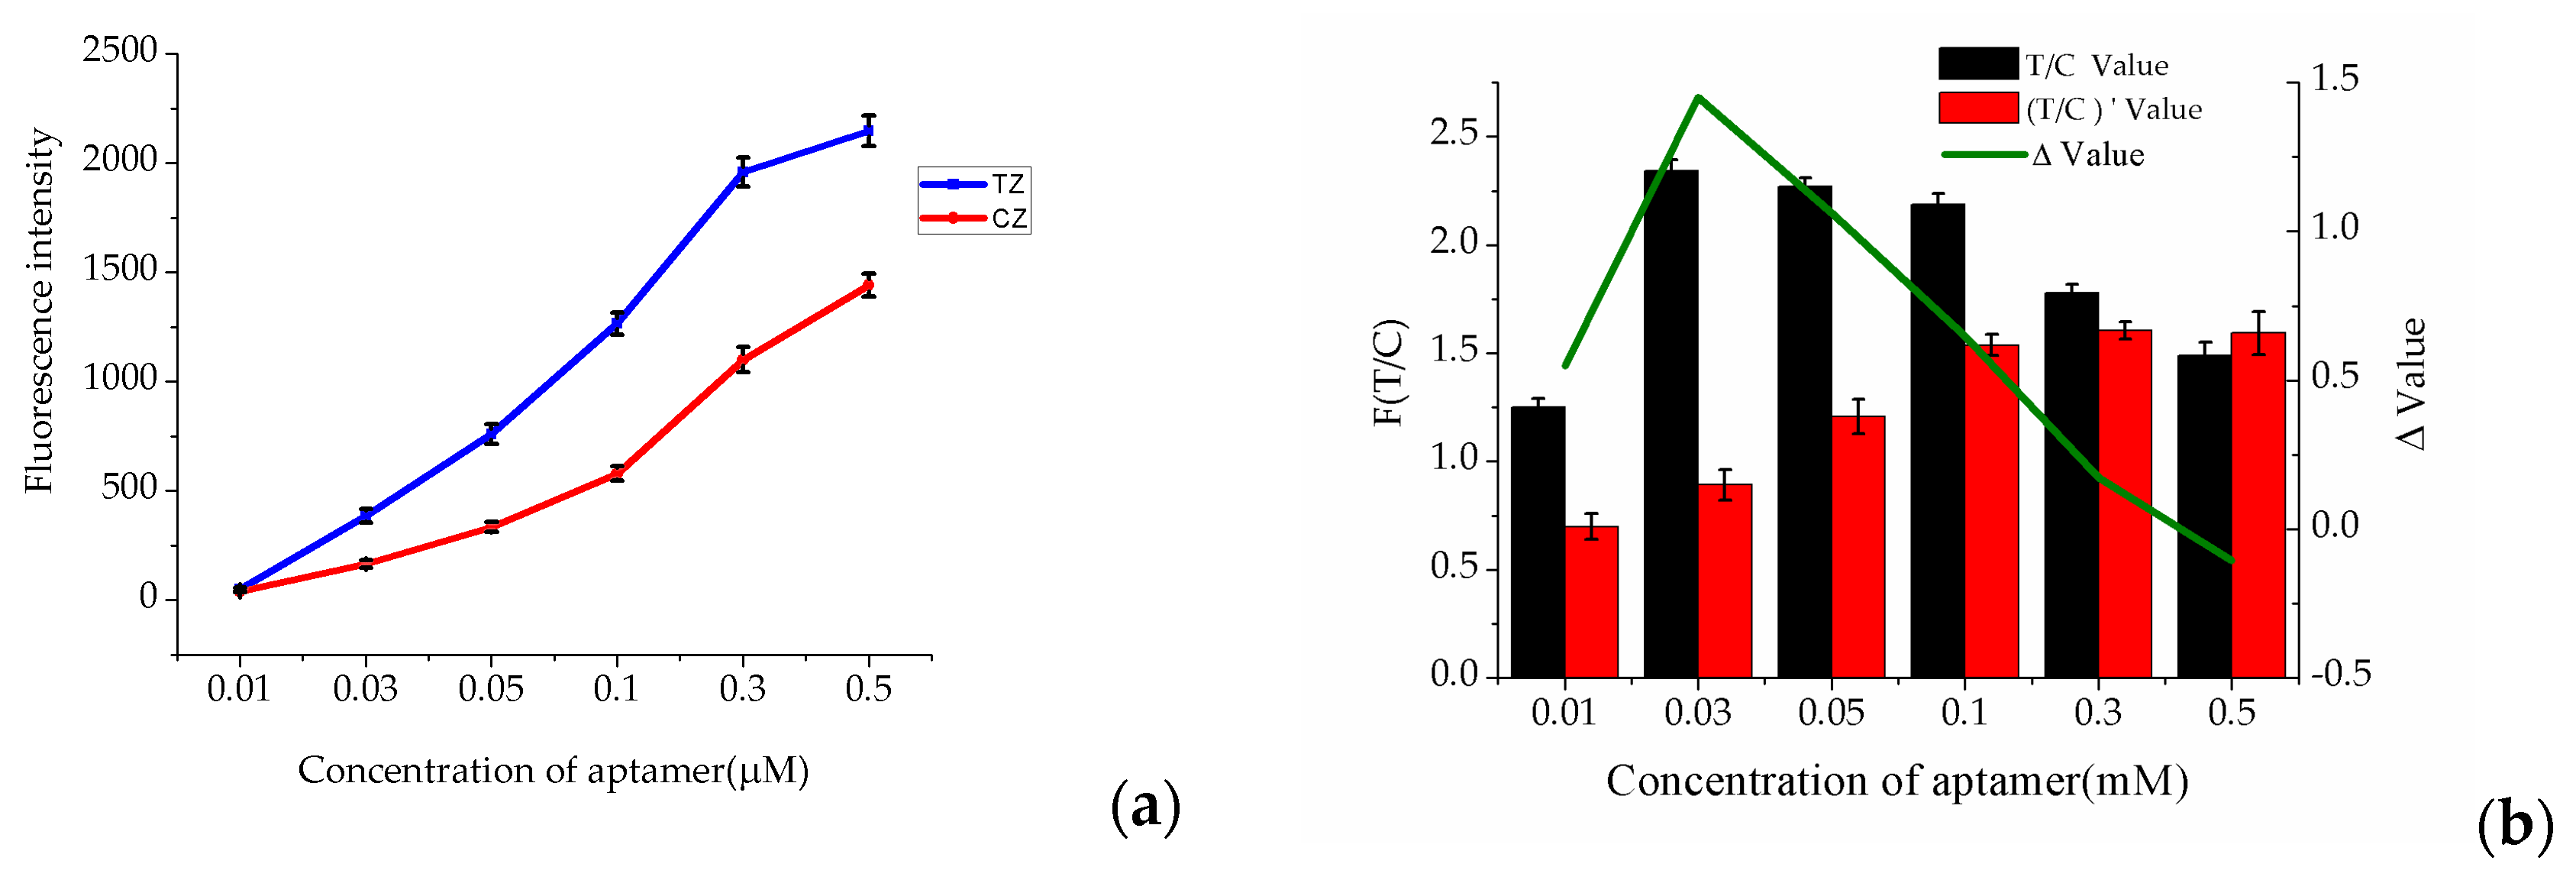
The aptamer concentration was directly associated with the detection limit of aptamer-based lateral flow strip. To determine the optimum concentration of aptamer, 50 μL of 10 mM Tris-HCl buffer was mixed with 5 μL of Cy5-labeled aptamer at different concentrations (0.01, 0.03, 0.05, 0.1, 0.3 and 0.5 μM) in ultrapure water, with dramatic differences between 0 ng·mL−1 and 30 ng·mL−1 OTA standard solution. According to the results (Figure 3), the fluorescence intensities (TZ and CZ) were gradually enhanced with the increase of the aptamer concentration, but the T/C value showed a trend of decline from 0.03 to 0.5 μM. Moreover, the most varied T/C value before (T/C Value) and after ((T/C)’ Value) the solution was spiked with 30 ng·mL−1 OTA was 0.03 μM. So, 0.03 μM aptamer was the best choice for the following experiments with the maximum response value, highest sensitivity and minimum error.
3.3. Effect of pH Value of the Running Buffer on the Strip Sensor Performance
The pH value and ion components of the running buffer have a significant influence on oligonucleotide chain hybridization and combination stability between aptamer and the target, so that the optimal buffer is critical for the performance of strip sensors. Therefore, the pH dependence of the performance of strip biosensors for OTA determination was tested. An expected buffer should ensure that the fluorescent signals of the C line can be scanned in any case. To prevent nonspecific binding and achieve adequate hybridization reaction, the maximum response values of the T&C lines on the membrane were acquired with the minimum error of the measured value. The reason for the maximum signal at pH 8.5 and low signal at pH 9 may be that the electric charge and H+ affected the secondary structure of aptamer and hybridization efficiency. In addition, the active substances on the surface of NC membrane influenced the flow and hybridization of DNA. With multiple factors considered, pH 8.5 was the optimal reaction conditions. After investigation (Figure 4), buffer C was determined as the running buffer.
3.4. Sensitivity and Specificity
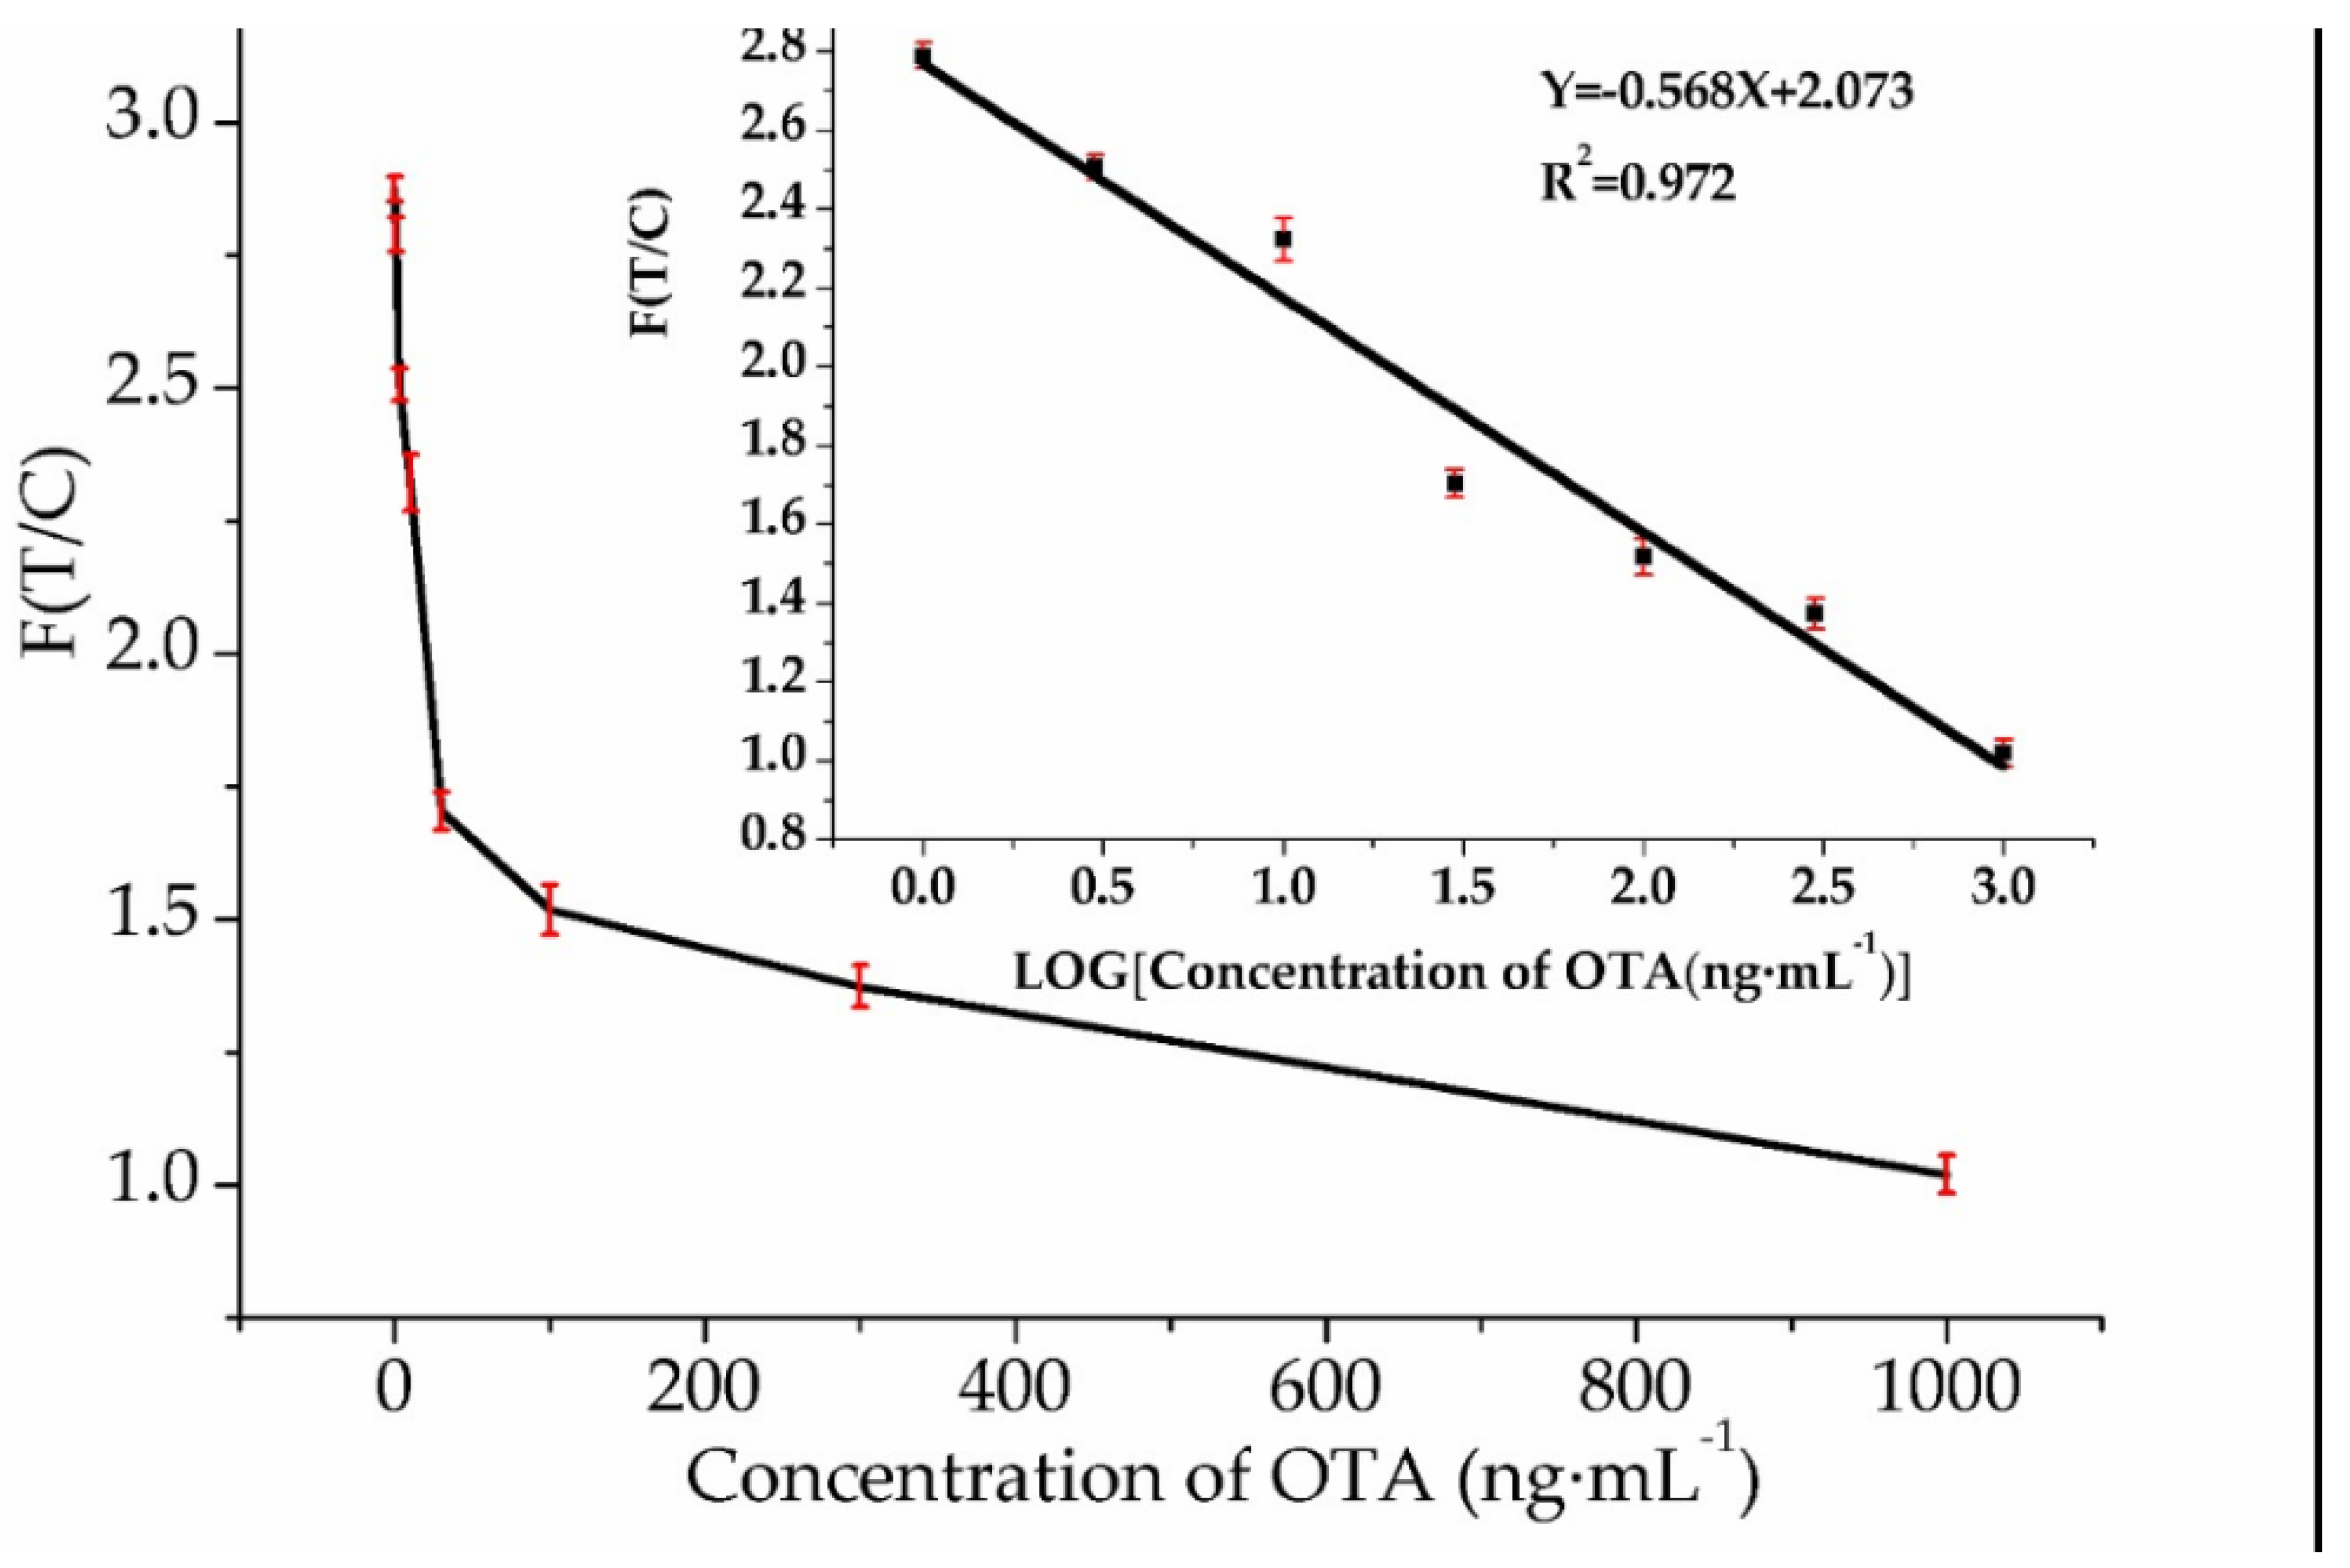
To measure the sensitivity of the developed method, OTA standard solutions at various concentrations of 0, 1, 3, 10, 30, 100, 300 and 1000 ng·mL−1 were prepared by diluting OTA stock solution (100 μg·mL−1 in methanol) with the running buffer. A total of 10 μL aptamer and 50 μL OTA solution were accurately pipetted in an EP tube and incubated at room temperature for 10 min. Then, each 50 μL portion of the mixture solution was pipetted onto the sample pad of the strip, and after another 10 min, the fluorescence intensities at both the test line and control line were obtained using Lateral Flow Studio scan strip. The detection was performed in three repeats for each concentration. The results in Figure 5 showed that the strip had high fluorescence values on both the test and control lines, and the ratio of the T/C fluorescence intensity decreased with the OTA concentration increase from 1 ng·mL−1 to 1000 ng·mL−1 (R2 = 0.972). The limit of detection (LOD) was determined to be 0.40 ng·mL−1 according to three times the standard deviation of the blank/slope. And the fifteen percent maximal inhibitory concentration (IC15) was 3.46 ng·mL−1.
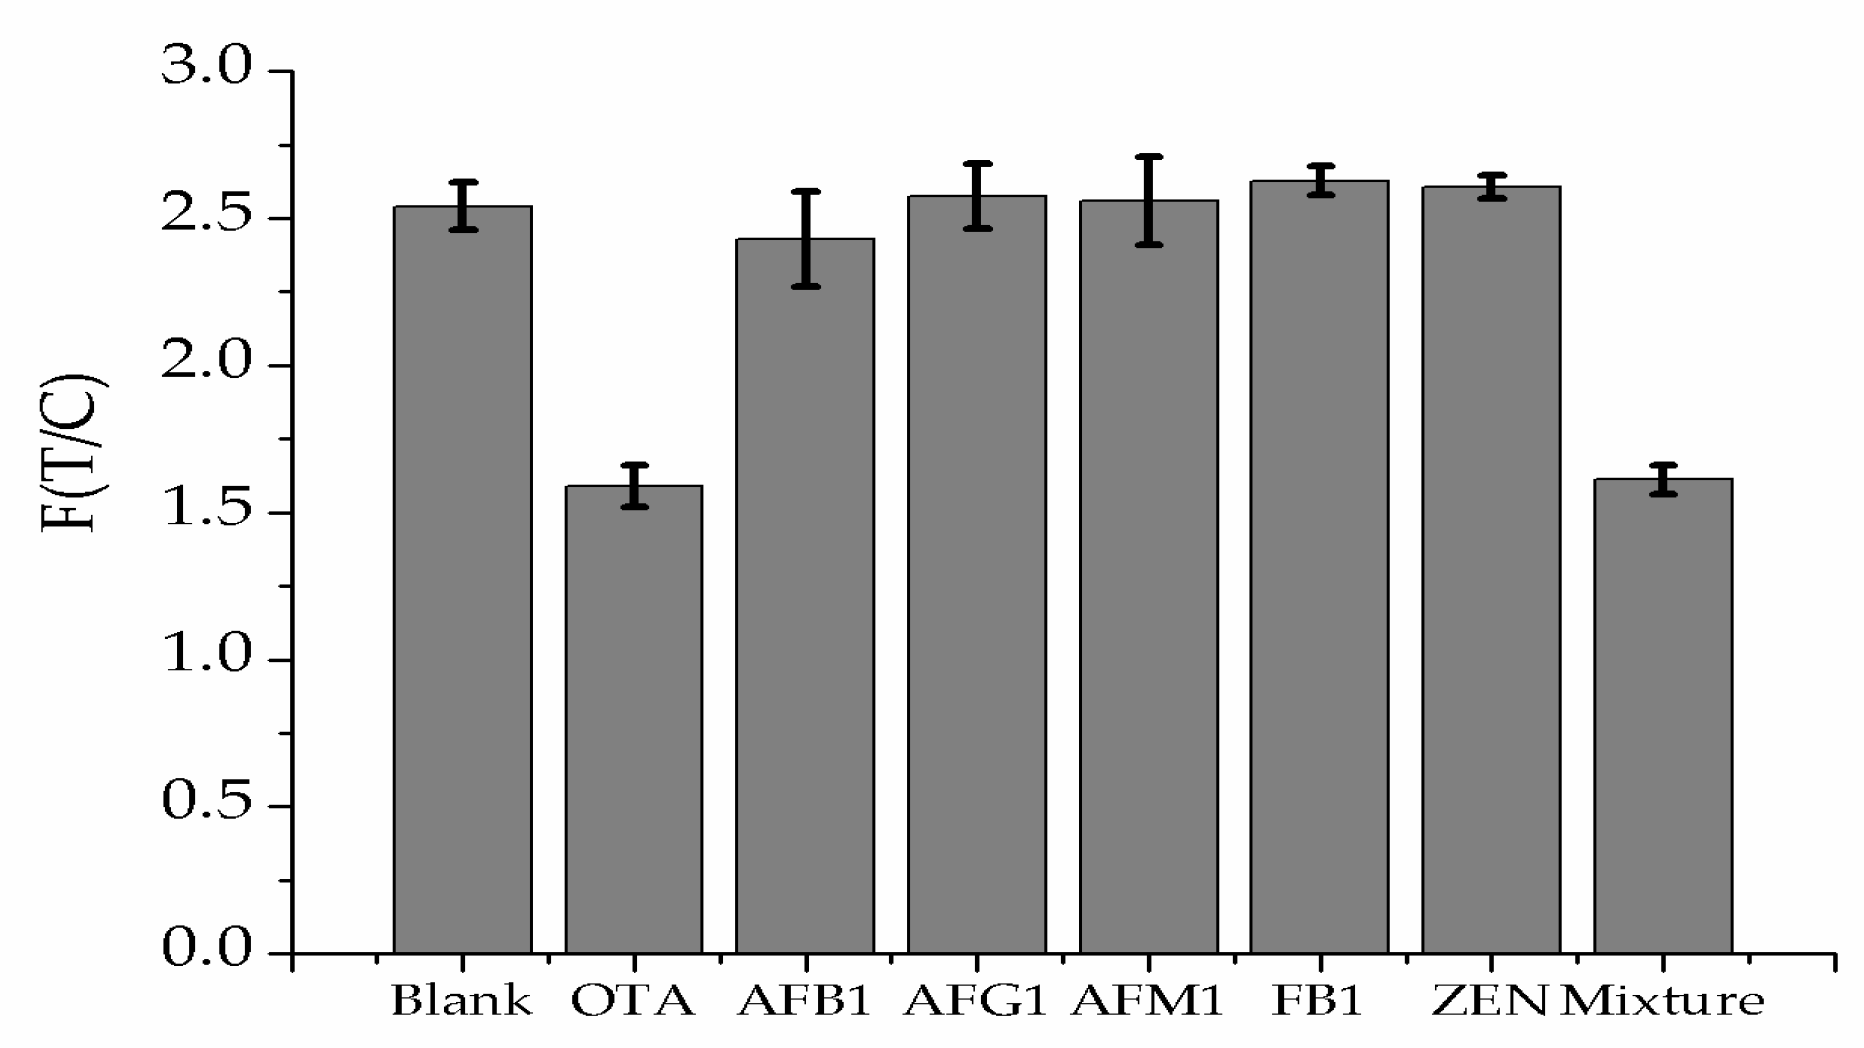
The selectivity of LFB was tested using various mycotoxins for this study. The 30 ng·mL−1 OTA standard and other similar mycotoxin standards including aflatoxin B1 (AFB1), aflatoxin G1 (AFG1), aflatoxin M1 (AFM1), zearalenone (ZEN) and fumonisin B1 (FB1) were tested by the optimized lateral flow strips. As shown in Figure 6, the other mycotoxins displayed a basic consistent level of the fluorescence intensity ratio of the test line to the control line compared with the blank solution, only the OTA-spiked corn sample gave a significant reduction, indicating good specificity and selectivity of the strip for OTA.
3.5. Practical Sample Analysis
To evaluate the practicability and accuracy of the prepared aptamer based lateral flow strip, corn samples added with OTA standard solutions at a series of concentrations were analyzed by the lateral flow strip. The samples at each concentration were repeated 3 times and the results were shown in Table 1. The recovery test showed that the fluorescent strip aptasensor exhibited a good recovery rate within the range from 96.40% to 104.67%, and our assay had excellent accuracy and stability in detecting OTA in real samples. To further verify the superior performance of the prepared lateral flow strip biosensors, the detection range, detection limit and sample matrixes were compared with those of other methods reported in the literatures. The detailed results were listed in Table 2. We could see that other strips in the published literatures mostly used for qualitative detection or half quantitative detection of OTA with a small linear range in testing wine and grape must samples. It can also be seen that the proposed sensor had a differently wide linear range and low detection limit, making it a trend to screen test samples with the advantages of easy sample treatment, short detection time, low cost and low requirements on professional skills.
4. Conclusions
In this study, simple, specific, sensitive, and easily applied Cy5-labeled aptamer based lateral flow strip biosensors in the competitive format were developed for detection of OTA. Under the optimal conditions, quantitative detection of OTA using a portable strip reader exhibited a linear relationship between the ratio of the fluorescence intensities on the test line to the control line and the logarithm of the OTA concentration in the range of 1–1000 ng·mL−1 with the detection limit of 0.40 ng·mL−1 and IC15 value of 3.46 ng·mL−1. And the entire detection process could be accomplished within 20 min. As the aptamers were not special, the strip would be applicable to any rapid onsite detection of OTA in corn samples, and the immunochromatographic strip test could be used for rapid qualitative and quantitative screening of OTA contamination in grain and foodstuff samples.
Acknowledgments
This research was supported by the National Key R&D Program of China No. 2016YFD05014071.
Author Contributions
Ailiang Chen offered the idea and research design. Guilan Zhang performed the experiments, searched the literature and wrote this paper; Chao Zhu analyzed data and revised the paper; Yafei Huang and Jiao Yan collected data, made the tables and charts and revised the paper.
Conflicts of Interest
The authors declare no conflict of interest.
References
- Scott, P.M.; Walbeek, W.V.; Kennedy, B.; Anyeti, D. Mycotoxins (ochhratoxin A, citrinin, and sterigmatocystin) and toxigenic fungi in grains and other agricultural products. J. Agric. Food Chem. 1972, 20, 1103–1109. [Google Scholar] [CrossRef] [PubMed]
- Xiong, K.; Wang, X.L.; Zhi, H.W.; Sun, B.G.; Li, X.T. Identification and safety evaluation of a product from the biodegradation of Ochratoxin A by an Aspergillus strain. J. Sci. Food Agric. 2017, 97, 434–443. [Google Scholar] [CrossRef] [PubMed]
- Solfrizzo, M.; Piemontese, L.; Gambacorta, L.; Zivoli, R.; Longobardi, F. Food Coloring Agents and Plant Food Supplements Derived from Vitis vinifera: A New Source of Human Exposure to Ochratoxin A. J. Agric. Food Chem. 2015, 63, 3609–3614. [Google Scholar] [CrossRef] [PubMed]
- Malvano, F.; Albanese, D.; Pilloton, R.; Di Matteo, M. A highly sensitive impedimetric label free immunosensor for Ochratoxin measurement in cocoa beans. Food Chem. 2016, 212, 688–694. [Google Scholar] [CrossRef] [PubMed]
- Gottschalk, C.; Biermaier, B.; Gross, M.; Schwaiger, K.; Gareis, M. Ochratoxin A in brewer’s yeast used as food supplement. Mycotoxin Res. 2016, 32, 1–5. [Google Scholar] [CrossRef] [PubMed]
- Selvaraj, J.N.; Zhou, L.; Wang, Y.; Zhao, Y.J.; Xing, F.G.; Dai, X.F.; Liu, Y. Mycotoxin detection—Recent trends at global level. J. Integr. Agric. 2015, 14, 2265–2281. [Google Scholar] [CrossRef]
- Zhang, H.Y.; Apaliya, M.T.; Mahunu, G.K.; Chen, L.L.; Li, W.H. Control of Ochratoxin A-producing fungi in grape berry by microbial antagonists: A review. Trends Food Sci. Technol. 2016, 51, 88–97. [Google Scholar] [CrossRef]
- Qi, T.Y.F.; Renaud, J.B.; McDowell, T.; Seifert, K.A.; Yeung, K.K.C.; Sumarah, M.W. Diversity of Mycotoxin-Producing Black Aspergilli in Canadian Vineyards. J. Agric. Food Chem. 2016, 64, 1583–1589. [Google Scholar] [CrossRef] [PubMed]
- Toman, J.; Malir, F.; Ostry, V.; Grosse, Y.; Dvorak, V.; Roubal, T.; Neuchlova, L. The Occurrence of Ochratoxin A in White and Parboiled Rice. Czech J. Food Sci. 2016, 34, 32–38. [Google Scholar] [CrossRef]
- Yang, X.H.; Kong, W.J.; Hu, Y.C.; Yang, M.H.; Huang, L.Q.; Zhao, M.; Ouyang, Z. Aptamer-affinity column clean-up coupled with ultra high performance liquid chromatography and fluorescence detection for the rapid determination of Ochratoxin A in ginger powder. J. Sep. Sci. 2014, 37, 853–860. [Google Scholar] [CrossRef] [PubMed]
- Rhouati, A.; Yang, C.; Hayat, A.; Marty, J.L. Aptamers: A Promising Tool for Ochratoxin A Detection in Food Analysis. Toxins 2013, 5, 1988–2008. [Google Scholar] [CrossRef] [PubMed]
- Zhang, Y.; Qi, X.Z.; Zheng, J.J.; Luo, Y.B.; Zhao, C.H.; Hao, J.R.; Li, X.H.; Huang, K.L.; Xu, W.T. Lipid Rafts Disruption Increases Ochratoxin A Cytotoxicity to Hepatocytes. J. Biochem. Mol. Toxicol. 2016, 30, 71–79. [Google Scholar] [CrossRef] [PubMed]
- Zhang, Z.Q.; Gan, F.; Xue, H.X.; Liu, Y.H.; Huang, D.; Khan, A.Z.; Chen, X.X.; Huang, K.H. Nephropathy and hepatopathy in weaned piglets provoked by natural Ochratoxin A and involved mechanisms. Exp. Toxicol. Pathol. 2016, 68, 205–213. [Google Scholar] [CrossRef] [PubMed]
- Koszegi, T.; Poor, M. Ochratoxin A: Molecular Interactions, Mechanisms of Toxicity and Prevention at the Molecular Level. Toxins 2016, 8, 111. [Google Scholar] [CrossRef] [PubMed]
- Woo, C.S.J.; El-Nezami, H. Maternal-Fetal Cancer Risk Assessment of Ochratoxin A during Pregnancy. Toxins 2016, 8, 87. [Google Scholar] [CrossRef] [PubMed]
- Selvaraj, J.N.; Wang, Y.; Zhou, L.; Zhao, Y.J.; Xing, F.G.; Dai, X.F.; Liu, Y. Recent mycotoxin survey data and advanced mycotoxin detection techniques reported from China: A review. Food Addit. Contam. A 2015, 32, 440–452. [Google Scholar] [CrossRef] [PubMed]
- Savastano, M.L.; Losito, I.; Pati, S. Rapid and automatable determination of Ochratoxin A in wine based on microextraction by packed sorbent followed by HPLC-FLD. Food Control 2016, 68, 391–398. [Google Scholar] [CrossRef]
- Gentile, F.; La Torre, G.L.; Potorti, A.G.; Saitta, M.; Alfa, M.; Dugo, G. Organic wine safety: UPLC-FLD determination of Ochratoxin A in Southern Italy wines from organic, farming and winemaking. Food Control 2016, 59, 20–26. [Google Scholar] [CrossRef]
- Yang, Y.; Wen, J.; Kong, W.J.; Liu, Q.T.; Luo, H.L.; Wang, J.; Yang, M.H. Simultaneous determination of four aflatoxins and Ochratoxin A in ginger after inoculation with fungi by ultra-fast liquid chromatography-tandem mass spectrometry. J. Sci. Food Agric. 2016, 96, 4160–4167. [Google Scholar] [CrossRef] [PubMed]
- Malir, F.; Ostry, V.; Pfohl-Leszkowicz, A.; Malir, J.; Toman, J. Ochratoxin A: 50 Years of Research. Toxins 2016, 8, 191. [Google Scholar] [CrossRef] [PubMed]
- Lim, C.W.; Yoshinari, T.; Layne, J.; Chan, S.H. Multi-Mycotoxin Screening Reveals Separate Occurrence of Aflatoxins and Ochratoxin A in Asian Rice. J. Agric. Food Chem. 2015, 63, 3104–3113. [Google Scholar] [CrossRef] [PubMed]
- Zou, X.Q.; Chen, C.C.; Huang, X.L.; Chen, X.L.; Wang, L.; Xiong, Y.H. Phage-free peptide ELISA for Ochratoxin A detection based on biotinylated mimotope as a competing antigen. Talanta 2016, 146, 394–400. [Google Scholar] [CrossRef] [PubMed]
- Kong, D.; Liu, L.; Song, S.; Suryoprabowo, S.; Li, A.; Kuang, H.; Wang, L.; Xu, C. A gold nanoparticle-based semi-quantitative and quantitative ultrasensitive paper sensor for the detection of twenty mycotoxins. Nanoscale 2016, 8, 5245–5253. [Google Scholar] [CrossRef] [PubMed]
- Soares, R.R.G.; Ramadas, D.; Chu, V.; Aires-Barros, M.R.; Conde, J.P.; Viana, A.S.; Cascalheira, A.C. An ultrarapid and regenerable microfluidic immunoassay coupled with integrated photosensors for point-of-use detection of Ochratoxin A. Sens. Actuators B Chem. 2016, 235, 554–562. [Google Scholar] [CrossRef]
- Gold, C.T.L. Systematic evolution of ligands by exponential enrichment: RNA ligands to bacteriophage T4 DNA polymerase. Science 1990, 249, 505–510. [Google Scholar]
- Ellington, A.D.; Szostak, J.W. In vitro selection of RNA molecules that bind specific ligands. Nature 1990, 346, 818–822. [Google Scholar] [CrossRef] [PubMed]
- Jayasena, S.D. Aptamers: An Emerging Class of Molecules That Rival Antibodies in Diagnostics. Clin. Chem. 1999, 45, 1628–1650. [Google Scholar] [PubMed]
- Zhuang, Y.Y.; Deng, H.P.; Su, Y.; He, L.; Wang, R.B.; Tong, G.S.; He, D.N.; Zhu, X.Y. Aptamer-Functionalized and Backbone Redox-Responsive Hyperbranched Polymer for Targeted Drug Delivery in Cancer Therapy. Biomacromolecules 2016, 17, 2050–2062. [Google Scholar] [CrossRef] [PubMed]
- Jarczewska, M.; Górski, Ł.; Malinowska, E. Electrochemical aptamer-based biosensors as potential tools for clinical diagnostics. Anal. Methods 2016, 8, 3861–3877. [Google Scholar] [CrossRef]
- Leach, J.C.; Wang, A.; Ye, K.M.; Jin, S. A RNA-DNA Hybrid Aptamer for Nanoparticle-Based Prostate Tumor Targeted Drug Delivery. Int. J. Mol. Sci. 2016, 17, 380. [Google Scholar] [CrossRef] [PubMed]
- Ilgu, M.; Ray, J.; Bendickson, L.; Wang, T.J.; Geraskin, I.M.; Kraus, G.A.; Nilsen-Hamilton, M. Light-up and FRET aptamer reporters; evaluating their applications for imaging transcription in eukaryotic cells. Methods 2016, 98, 26–33. [Google Scholar] [CrossRef] [PubMed]
- Wu, B.; Chen, N.D.; Wang, Q.; Yang, X.H.; Wang, K.M.; Li, W.S.; Li, Q.; Liu, W.J.; Fang, H.M. A simple label-free aptamer-based method for C-reactive protein detection. Anal. Methods-UK 2016, 8, 4177–4180. [Google Scholar] [CrossRef]
- Yan, M.; Zhu, C.; Huang, Y.; Yan, J.; Chen, A. Ultrasensitive detection of lead(II) using a turn-on probe based on the use of an aptamer and a water-soluble fluorescent perylene probe. Microchim. Acta 2017, 184, 2439–2444. [Google Scholar] [CrossRef]
- Yan, J.; Huang, Y.F.; Zhang, C.H.; Fang, Z.Z.; Bai, W.H.; Yan, M.M.; Zhu, C.; Chen, A.L. Aptamer based photometric assay for the antibiotic sulfadimethoxine based on the inhibition and reactivation of the peroxidase-like activity of gold nanoparticles. Microchim. Acta 2017, 184, 59–63. [Google Scholar] [CrossRef]
- Abnous, K.; Danesh, N.M.; Ramezani, M.; Alibolandi, M.; Lavaee, P.; Taghdisi, S.M. Aptamer based fluorometric acetamiprid assay using three kinds of nanoparticles for powerful signal amplification. Microchim. Acta 2017, 184, 81–90. [Google Scholar] [CrossRef]
- Yeong Won, J.; Choi, J.W.; Min, J. Micro-fluidic chip platform for the characterization of breast cancer cells using aptamer-assisted immunohistochemistry. Biosens. Bioelectron. 2013, 40, 161–166. [Google Scholar] [CrossRef] [PubMed]
- Hunniger, T.; Felbinger, C.; Wessels, H.; Mast, S.; Hoffmann, A.; Schefer, A.; Martlbauer, E.; Paschke-Kratzin, A.; Fischer, M. Food Targeting: A Real-Time PCR Assay Targeting 165 rDNA for Direct Quantification of Alicyclobacillus spp. Spores after Aptamer-Based Enrichment. J. Agric. Food Chem. 2015, 63, 4291–4296. [Google Scholar] [CrossRef] [PubMed]
- Xiao, R.P.; Wang, D.F.; Lin, Z.Y.; Qiu, B.; Liu, M.H.; Guo, L.H.; Chen, G.N. Disassembly of gold nanoparticle dimers for colorimetric detection of Ochratoxin A. Anal. Methods-UK 2015, 7, 842–845. [Google Scholar] [CrossRef]
- Citartan, M.; Gopinath, S.C.; Tominaga, J.; Tan, S.C.; Tang, T.H. Assays for aptamer-based platforms. Biosens. Bioelectron. 2012, 34, 1–11. [Google Scholar] [CrossRef] [PubMed]
- Jiang, L.; Qian, J.; Yang, X.; Yan, Y.; Liu, Q.; Wang, K.; Wang, K. Amplified impedimetric aptasensor based on gold nanoparticles covalently bound graphene sheet for the picomolar detection of Ochratoxin A. Anal. Chim. Acta 2014, 806, 128–135. [Google Scholar] [CrossRef] [PubMed]
- Catanante, G.; Mishra, R.K.; Hayat, A.; Marty, J.L. Sensitive analytical performance of folding based biosensor using methylene blue tagged aptamers. Talanta 2016, 153, 138–144. [Google Scholar] [CrossRef] [PubMed]
- Mishra, R.K.; Hayat, A.; Catanante, G.; Istamboulie, G.; Marty, J.L. Sensitive quantitation of Ochratoxin A in cocoa beans using differential pulse voltammetry based aptasensor. Food Chem. 2016, 192, 799–804. [Google Scholar] [CrossRef] [PubMed]
- Wang, C.Q.; Qian, J.; Wang, K.; Yang, X.W.; Liu, Q.; Hao, N.; Wang, C.K.; Dong, X.Y.; Huang, X.Y. Colorimetric aptasensing of Ochratoxin A using Au@Fe3O4 nanoparticles as signal indicator and magnetic separator. Biosens. Bioelectron. 2016, 77, 1183–1191. [Google Scholar] [CrossRef] [PubMed]
- Chen, J.; Fang, Z.; Liu, J.; Zeng, L. A simple and rapid biosensor for Ochratoxin A based on a structure-switching signaling aptamer. Food Control 2012, 25, 555–560. [Google Scholar] [CrossRef]
- Bueno, D.; Mishra, R.K.; Hayat, A.; Catanante, G.; Sharma, V.; Munoz, R.; Marty, J.L. Portable and low cost fluorescence set-up for in-situ screening of Ochratoxin A. Talanta 2016, 159, 395–400. [Google Scholar] [CrossRef] [PubMed]
- Shim, W.-B.; Mun, H.; Joung, H.-A.; Ofori, J.A.; Chung, D.-H.; Kim, M.-G. Chemiluminescence competitive aptamer assay for the detection of Aflatoxin B1 in corn samples. Food Control 2014, 36, 30–35. [Google Scholar] [CrossRef]
- Dai, S.; Wu, S.; Duan, N.; Wang, Z. A luminescence resonance energy transfer based aptasensor for the mycotoxin Ochratoxin A using upconversion nanoparticles and gold nanorods. Microchim. Acta 2016, 183, 1909–1916. [Google Scholar] [CrossRef]
- Sajid, M.; Kawde, A.N.; Daud, M. Designs, formats and applications of lateral flow assay: A literature review. J. Saudi Chem. Soc. 2015, 19, 689–705. [Google Scholar] [CrossRef]
- Chen, A.L.; Yang, S.M. Replacing antibodies with aptamers in lateral flow immunoassay. Biosens. Bioelectron. 2015, 71, 230–242. [Google Scholar] [CrossRef] [PubMed]
- Wu, W.; Zhao, S.M.; Mao, Y.P.; Fang, Z.Y.; Lu, X.W.; Zeng, L.W. A sensitive lateral flow biosensor for Escherichia coli O157:H7 detection based on aptamer mediated strand displacement amplification. Anal. Chim. Acta 2015, 861, 62–68. [Google Scholar] [CrossRef] [PubMed]
- Adhikari, M.; Strych, U.; Kim, J.; Goux, H.; Dhamane, S.; Poongavanam, M.V.; Hagstrom, A.E.V.; Kourentzi, K.; Conrad, J.C.; Willson, R.C. Aptamer-Phage Reporters for Ultrasensitive Lateral Flow Assays. Anal. Chem. 2015, 87, 11660–11665. [Google Scholar] [CrossRef] [PubMed]
- Qin, C.Y.; Wen, W.; Zhang, X.H.; Gu, H.S.; Wang, S.F. Visual detection of thrombin using a strip biosensor through aptamer-cleavage reaction with enzyme catalytic amplification. Analyst 2015, 140, 7710–7717. [Google Scholar] [CrossRef] [PubMed]
- Zhu, C.; Zhao, Y.; Yan, M.; Huang, Y.; Yan, J.; Bai, W.; Chen, A. A sandwich dipstick assay for ATP detection based on split aptamer fragments. Anal. Bioanal. Chem. 2016, 408, 4151–4158. [Google Scholar] [CrossRef] [PubMed]
- Lai, W.; Fung, D.Y.C.; Yang, X.; Renrong, L.; Xiong, Y. Development of a colloidal gold strip for rapid detection of Ochratoxin A with mimotope peptide. Food Control 2009, 20, 791–795. [Google Scholar] [CrossRef]
- Anfossi, L.; Giovannoli, C.; Giraudi, G.; Biagioli, F.; Passini, C.; Baggiani, C. A lateral flow immunoassay for the rapid detection of Ochratoxin A in wine and grape must. J. Agric. Food Chem. 2012, 60, 11491–11497. [Google Scholar] [CrossRef] [PubMed]
- Wang, L.; Ma, W.; Chen, W.; Liu, L.; Ma, W.; Zhu, Y.; Xu, L.; Kuang, H.; Xu, C. An aptamer-based chromatographic strip assay for sensitive toxin semi-quantitative detection. Biosens. Bioelectron. 2011, 26, 3059–3062. [Google Scholar] [CrossRef] [PubMed]
- Wang, L.; Chen, W.; Ma, W.; Liu, L.; Ma, W.; Zhao, Y.; Zhu, Y.; Xu, L.; Kuang, H.; Xu, C. Fluorescent strip sensor for rapid determination of toxins. Chem. Commun. 2011, 47, 1574–1576. [Google Scholar] [CrossRef] [PubMed]
- Moon, J.; Kim, G.; Lee, S. Development of Nanogold-Based Lateral Flow Immunoassay for the Detection of Ochratoxin A in Buffer Systems. J. Nonsci. Nanotechnol. 2013, 13, 7245–7249. [Google Scholar] [CrossRef]
- Liu, L.; Xu, L.; Suryoprabowo, S.; Song, S.; Kuang, H. Development of an immunochromatographic test strip for the detection of Ochratoxin A in red wine. Food Agric. Immunol. 2017, 1–11. [Google Scholar] [CrossRef]
- Sun, Y.N.; Xing, G.X.; Yang, J.F.; Wang, F.Y.; Deng, R.G.; Zhang, G.P.; Hu, X.F.; Zhang, Y. Development of an immunochromatographic test strip for simultaneous qualitative and quantitative detection of Ochratoxin A and zearalenone in cereal. J. Sci. Food Agric. 2016, 96, 3673–3678. [Google Scholar] [CrossRef] [PubMed]
- Zhou, W.L.; Kong, W.J.; Dou, X.W.; Zhao, M.; Ouyang, Z.; Yang, M.H. An aptamer based lateral flow strip for on-site rapid detection of Ochratoxin A in Astragalus membranaceus. J. Chromatogr. B 2016, 1022, 102–108. [Google Scholar] [CrossRef] [PubMed]
- Anfossi, L.; Di Nardo, F.; Giovannoli, C.; Passini, C.; Baggiani, C. Increased sensitivity of lateral flow immunoassay for Ochratoxin A through silver enhancement. Anal. Bioanal. Chem. 2013, 405, 9859–9867. [Google Scholar] [CrossRef] [PubMed]
- Cruz-Aguado, J.A.; Penner, G. Determination of Ochratoxin A with a DNA Aptamer. J. Agric. Food Chem. 2008, 56, 10456–10461. [Google Scholar] [CrossRef] [PubMed]
Sample Availability: Samples of the compounds are not available from the authors. |
Figure 1.
Schematic illustration of the configuration of a conventional strip biosensor. SA–biotin–cDNA and SA–biotin–probe 2 dispersed in the Test Zone (TZ) and Control Zone (CZ), respectively.
Figure 1.
Schematic illustration of the configuration of a conventional strip biosensor. SA–biotin–cDNA and SA–biotin–probe 2 dispersed in the Test Zone (TZ) and Control Zone (CZ), respectively.

Figure 2.
Schematic illustration of competitive aptamer-based lateral flow strip biosensors used for OTA quantification. (a) Strips presented before and after OTA application; (b) The changes in the fluorescence intensities in the control and test line regions quantified by estimating the intensities of the bands.

Figure 3.
Optimization of the aptamer concentration. (a) The trend of the fluorescence intensities (Test Zone (TZ) and Control Zone (CZ)) with the increase of the aptamer concentration; (b) The variation in the T/C value before (T/C Value) and after ((T/C)’ Value) the solution was spiked with 30 ng·mL−1 OTA (n = 3).

Figure 4.
Running buffer optimization. Fluorescence intensity values of TZ, CZ and T/C with different kinds of buffer applied (n = 3).
Figure 4.
Running buffer optimization. Fluorescence intensity values of TZ, CZ and T/C with different kinds of buffer applied (n = 3).
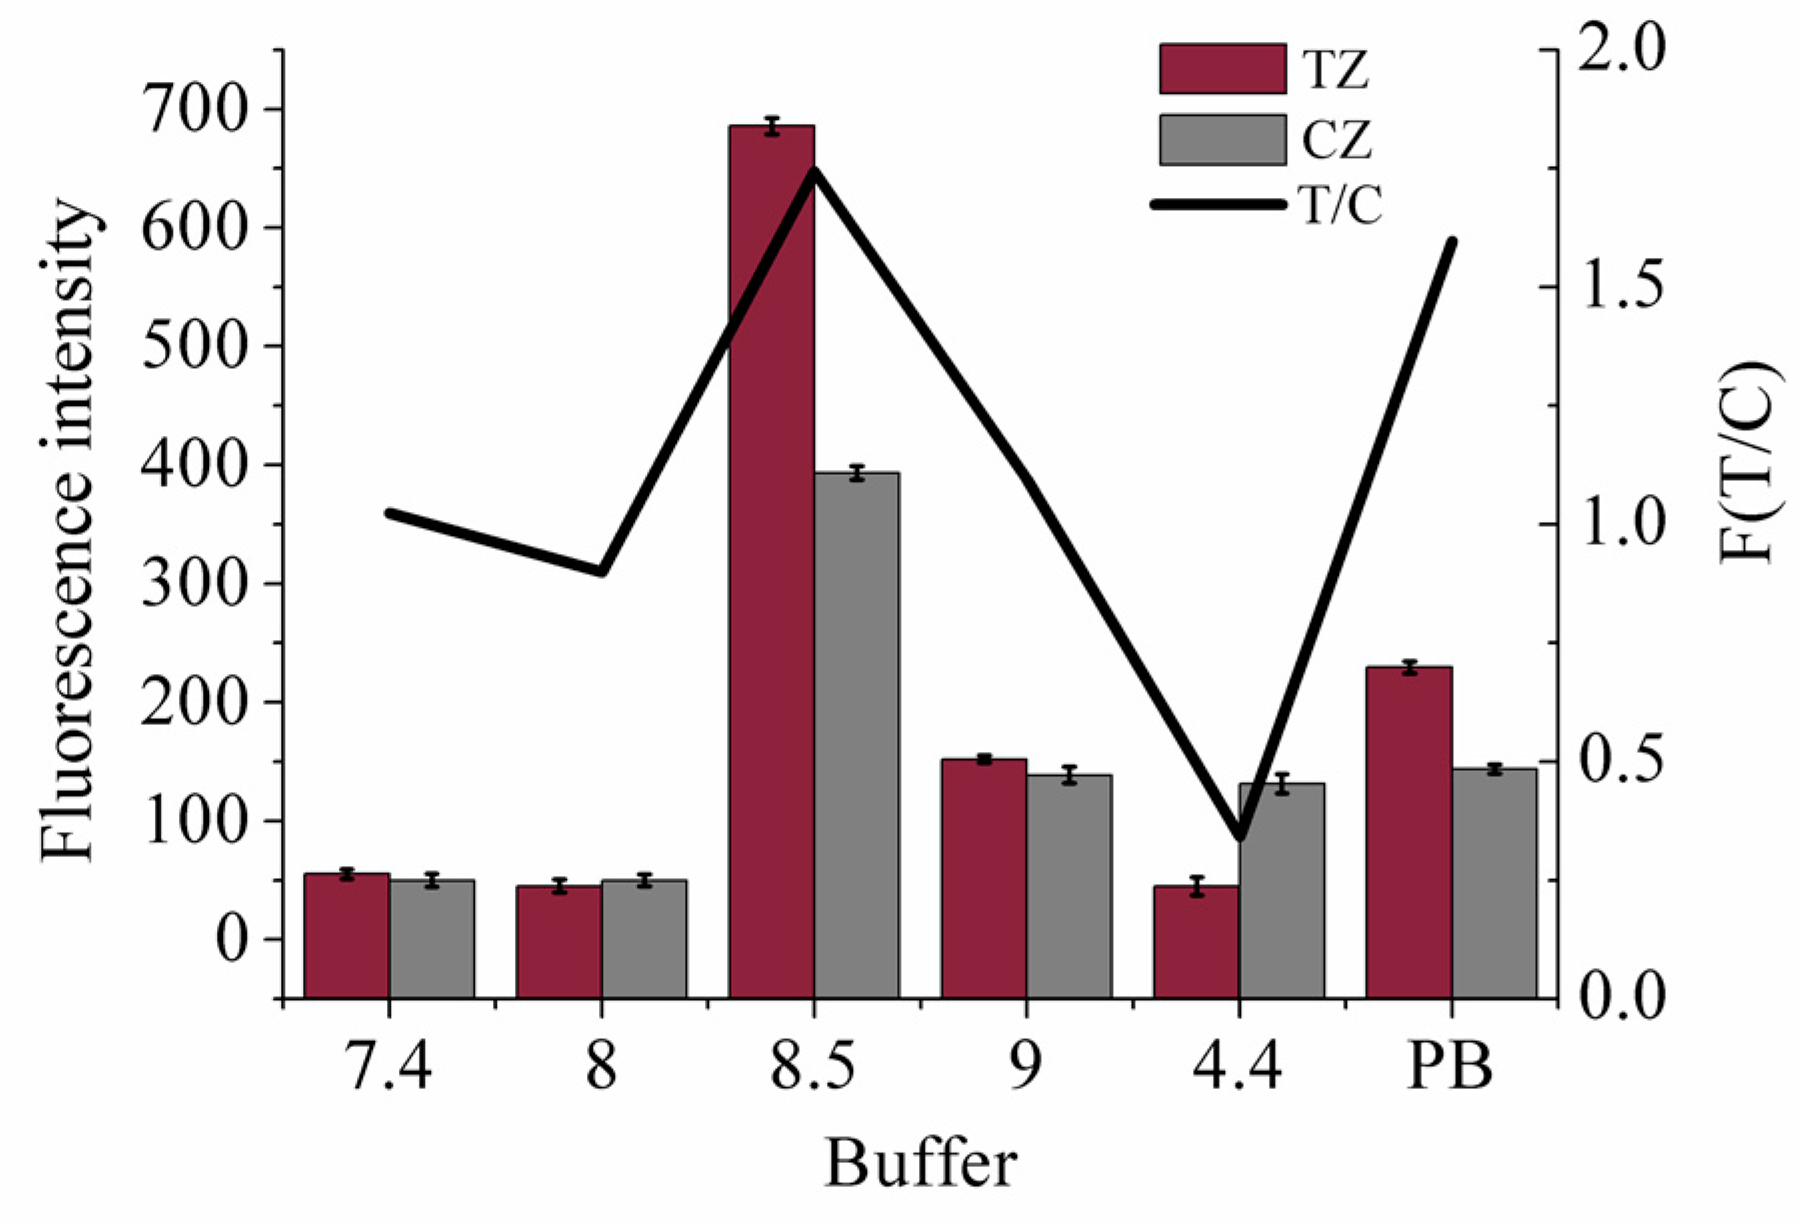
Figure 5.
Calibration curve for OTA detection. The inset shows the linear relationship between the fluorescence intensity ratio of the TZ to CZ and the OTA concentration within the range of 1–1000 ng·mL−1. Error bars represent the standard deviations of three replicates (n = 3).
Figure 5.
Calibration curve for OTA detection. The inset shows the linear relationship between the fluorescence intensity ratio of the TZ to CZ and the OTA concentration within the range of 1–1000 ng·mL−1. Error bars represent the standard deviations of three replicates (n = 3).

Figure 6.
Specificity of the method. Fluorescence intensity ratio of the TZ to CZ with OTA and other mycotoxins (n = 3).
Figure 6.
Specificity of the method. Fluorescence intensity ratio of the TZ to CZ with OTA and other mycotoxins (n = 3).

Table 1.
Detection results of the OTA levels in spiked corn samples (n = 3).
| Spiked (ng·mL−1) | Detected (ng·mL−1) | Recovery (%) | CV (%) |
|---|---|---|---|
| 3.00 | 3.14 ± 0.47 | 104.67 | 6.40 |
| 10.00 | 9.64 ± 1.15 | 96.40 | 4.80 |
| 30.00 | 29.17 ± 2.73 | 97.23 | 5.10 |
Table 2.
Comparison of the prepared sensor with other reported strip methods for OTA detection.
| Method | Range (ng·mL−1) | LOD (ng·mL−1) | Sample | Reference |
|---|---|---|---|---|
| Antibody-strip | - | 10 | PBS buffer | [58] |
| Antibody-strip | 1.00–6.00 | 0.77 | cereal | [60] |
| Antibody-strip | - | 10 | corn, wheat | [54] |
| Antibody-strip | - | 1 | wine, grape must | [55] |
| Antibody-strip | - | 0.9 | wine, grape must | [62] |
| Antibody-strip | - | 0.5 | wed wine | [59] |
| Apatamer-strip | 0.5–2.5 | 0.18 | red wine | [56] |
| Apatamer-strip | 0.5–25 | 0.5 | Astragalus membranaceus | [61] |
| Aptamer-strip | 0.10–10.00 | 1.90 | - | [57] |
| Aptamer-strip | 1.00–1000.00 | 0.40 | corn | Present |
© 2018 by the authors. Licensee MDPI, Basel, Switzerland. This article is an open access article distributed under the terms and conditions of the Creative Commons Attribution (CC BY) license (http://creativecommons.org/licenses/by/4.0/).
Share and Cite
MDPI and ACS Style
Zhang, G.; Zhu, C.; Huang, Y.; Yan, J.; Chen, A. A Lateral Flow Strip Based Aptasensor for Detection of Ochratoxin A in Corn Samples. Molecules 2018, 23, 291. https://doi.org/10.3390/molecules23020291
AMA Style
Zhang G, Zhu C, Huang Y, Yan J, Chen A. A Lateral Flow Strip Based Aptasensor for Detection of Ochratoxin A in Corn Samples. Molecules. 2018; 23(2):291. https://doi.org/10.3390/molecules23020291
Chicago/Turabian StyleZhang, Guilan, Chao Zhu, Yafei Huang, Jiao Yan, and Ailiang Chen. 2018. "A Lateral Flow Strip Based Aptasensor for Detection of Ochratoxin A in Corn Samples" Molecules 23, no. 2: 291. https://doi.org/10.3390/molecules23020291