Development of Antimicrobial Biocomposite Films to Preserve the Quality of Bread


1
Optoelectronics Group, Interdisciplinary Science Institute, Faculty of Basic Science and Technologies, Universidad del Quindío, Carrera 15 Calle 12 Norte, Armenia 630004, Colombia
2
Group of Research on Agroindustrial Processes (GIPA), Universidad Nacional de Colombia, Palmira 763533, Colombia
3
Group of Agro-industrial Sciences, Faculty of Agro-industrial Sciences, Universidad del Quindío, Carrera 15 Calle 12 Norte, Armenia 630004, Colombia
*
Author to whom correspondence should be addressed.
Molecules 2018, 23(1), 212; https://doi.org/10.3390/molecules23010212
Submission received: 12 December 2017
/
Revised: 11 January 2018
/
Accepted: 11 January 2018
/
Published: 19 January 2018
(This article belongs to the Special Issue Advances in Biodegradable Polymers)
Abstract
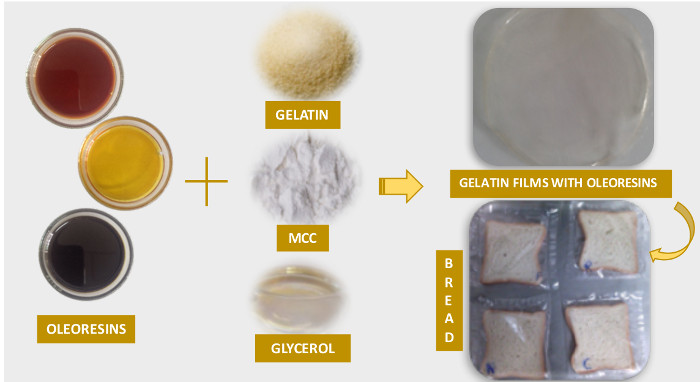
:This study focused on the development of gelatin-based films with incorporation of microcrystalline cellulose as reinforcement material. Clove (Syzygium aromaticum), nutmeg (Myristica fragrans), and black pepper (Piper nigrum) oleoresins containing antimicrobial compounds of natural origin were incorporated into the films. The mechanical, thermal, optical, and structural properties, as well as color, seal strength and permeability to water vapor, light, and oil of the films were determined. Adding oleoresins to the gelatin matrix increased the elongation of the material and significantly diminished its permeability to water vapor and oil. Evaluation of the potential use of films containing different oleoresins as bread packaging material was influenced by the film properties. The biocomposite film containing oleoresin from black pepper was the most effective packaging material for maintaining bread’s quality characteristics.

1. Introduction
Biocomposite materials are structures made up of at least one phase (matrix or reinforcement). One of these phases is obtained from a renewable source [1,2]. Proteins, polysaccharides, or a mixture of these which can provide mechanical and/or barrier properties, are some of those commonly used to make up the polymer structure [3,4]. Gelatin is one of the proteins with greatest industrial application due to its low melting point; in addition, it has a unique amino acid sequence, with high contents of proline, glycine, and hydroxyproline, which help in the formation of flexible films [5]. Gelatin is a good barrier against oxygen and carbon dioxide, but a poor barrier against water vapor [6]. To obtain materials with better flexibility, manageability, and extension ability, it is necessary to incorporate substances of low molecular weight, like plasticizers [7]. Also, compounds with antimicrobial and antioxidant activity can be incorporated, which help to improve the physical-chemical and microbiological properties of polymer materials and may improve the quality of the food they cover and/or increase its shelf life [8]. Different lipids (oleoresins and essential oils) have shown antimicrobial or antioxidant properties, which may be used for the development of biocomposite materials. Lipids are a good barrier against water vapor. Additionally, they may decrease film transparency, which is important to preserve the quality of food exposed to light [9,10]. Thus, the formation of active biocomposite materials consists of incorporating compounds with antioxidant or antimicrobial properties to the polymer matrix, which permit, through the migration of the active compounds onto the food surface, the conservation and extension of its shelf life [11,12]. Nevertheless, film properties are mainly influenced by the polymers used, active compounds, and preparation method. The use of biocomposite materials as food packaging or wrapping will depend on the mechanical properties and the permeability to water vapor [13]. The aim of this work was to investigate the effect of adding natural antimicrobial compounds (clove, nutmeg, and black pepper oleoresins) incorporated into gelatin based biocomposite films, on their moisture content, water vapor permeability, oil permeability, tensile properties, structure, optical and thermal properties. Biocomposite films were evaluated as packaging material on bread slices stored at ambient conditions (around 25 °C and 75% relative humidity). The physical-chemical, microbiology, and sensory characteristics of bread were evaluated for nine days.
2. Materials and Methods
2.1. Materials
To prepare the films, type B food-grade gelatin was used with a bloom of 220–240 g (Gelco S.A., Barranquilla, Colombia), along with pharmaceutical-grade microcrystalline cellulose, Avicel® PC 105 (FMC Biopolymer, Campinas, Brazil); 99% purity glycerol (Sigma Aldrich, St. Louis, MO, USA); Tween 80 for synthesis (Merck, Darmstadt, Germany); and clove, nutmeg, and black pepper oleoresins (TECNAS S.A., Antioquia, Colombia).
2.2. Minimum Inhibitory Concentration of the Oleoresins
The minimum inhibitory concentration (MIC) of the oleoresins against S. aureus and E. coli was determined by using the classic plate micro-dilution method by the National Committee of Laboratory Safety and Standards (NCLSS) [14]. Triplicate experiments were performed for each concentration of natural antimicrobials (4%, 2%, 1%, 0.5%, and 0.25%). The lowest concentration of the natural antimicrobial that showed growth inhibition was considered the MIC.
2.3. Physical-Chemical Analysis
Gelatin and microcrystalline cellulose (MCC) particle size were determined by using a Zetasizer nano ZS90 (Malvern Instruments, Ltd., Malvern, UK). Gelatin and MCC crystallinity were determined by using an X-ray diffractometer (Siemens, Karlsruhe, Germany) equipped with a Cu anode tube (which emits radiation of λ = 0.154 nm) with a voltage of 40 kV and current of 30 mA. The diffractograms were analyzed by using the Origin 8 program and crystallinity (% ) was determined by using Equation (1):
where I200: Maximum intensity value of the crystalline peak, Inon-cr: Intensity value that separates both diffraction peaks
Identification of the principal functional groups of the MCC and the gelatin was made through Fourier transformed infrared spectroscopy (Perkin Elmer, Waltham, MA, USA). The spectra were obtained within a range from 4000 to 400 cm−1 and analyzed by using the Origin 8 program. Thermal characterization of the MCC, the gelatin, and the oleoresins (nutmeg, black pepper, and clove) was carried out through differential scanning calorimetry (DSC 214 Polyma, Netzsch, Selb, Germany); scanning was from −20 to 140 °C at a rate of 5 °C/min.
The chemical composition of the oleoresins (nutmeg, clove, and black pepper) was determined by using a gas chromatograph AT 6890 Series Plus (Agilent Technologies, Palo Alto, CA, USA), coupled to a selective mass detector (Agilent Technologies, MSD 5973) operating in full scan mode. The column used in the analysis was DB-5MS (5%-phenylpoly(methylsiloxane), 60 m × 0.25 mm × 0.25 µm) and the injection was conducted in split mode (30:1) with Viny = 2 µL.
2.4. Preparation of Films
Films were prepared through the “casting” method following the methodology proposed by Andrade-Mahecha et al. [15] and by Mondragón et al. [16] with some modifications. The film-forming solution (FFS) was obtained from an aqueous suspension of microcrystalline cellulose (0.15 g/100 g of FFS), which was magnetically agitated for 30 min at 35 °C. Simultaneously, two aqueous suspensions were also prepared; one containing gelatin (3 g/100 g of FFS) stirred at 60 °C for 30 min and another containing glycerol (0.45 g/100 g of FFS) stirred at 35 °C for 15 min. Thereafter, all the components were mixed and kept at 60 °C for 15 min under constant stirring. Next, the respective oleoresin containing the natural antimicrobial compounds (10 g (500 µL of oleoresin/500 µL Tween 80 at 2%)/100 g FFS) was added. The FFS was kept at 45 °C for 15 min, prior to being poured into nonstick molds to be subjected to convection drying (45 °C during 4 h) on a stove with forced-air circulation (FD-53, Binder, Tuttlingen, Germany).
2.5. Film Characterization
Film thickness was measured at five different points by using a digital micrometer (Mitutoyo, Corp., Kawasaki, Japan).
2.5.1. Humidity Content
Film humidity content was determined immediately after drying and after a conditioning period (58% RH during 48 h), according to the gravimetric method by ASTM D644-99 [17].
2.5.2. Water Vapor Permeability
Water vapor permeability (WVP) was determined by following the ASTM E96-05 [18]. The films were placed on stainless steel cells subjected to external environments with different relative humidity (RH 2–33%, 33–66%, and 64–90%). Weight loss of the cells was monitored every hour for 9 h.
2.5.3. Mechanical Properties
Mechanical tests were carried out on a texture analyzer (TA-XT plus, Stable Micro Systems, Surrey, UK), at an operating rate of 1 mm/s and separation of 40 mm between clamps. The mechanical properties evaluated were: tensile strength (MPa), elongation (%), and young’s modulus (MPa), according to ASTM D882-02 [19].
2.5.4. Oil Permeability
Oil Permeability was determined by following the methodology proposed by Yan et al. (2012) [20], using the following equation:
where ∆W is the weight variation of the filter paper (g), FT is the film thickness (mm), A is the area of effective contact (m2), and T is the storage period (days).
2.5.5. Measurement of Seal Strength
Film samples (7.62 × 2.54 cm) were thermally sealed for two seconds, one on top of another with an area of 2.54 cm × 0.2 cm, using a manual thrust sealer (Hongzhan, KS-100, Wenzhou, China). Seal strength was determined through the ASTM F-88 [21], using a texture analyzer (TA-XT plus, Stable Micro Systems). Seal strength was calculated with the maximum force on the film width [22].
2.5.6. X-ray Diffraction (XRD)
Film samples (4 × 4 cm) were analyzed in an X-ray diffractometer (Bruker D8-Advance, Rheinstetten, Germany) equipped with a tube with Cu anode (radiation of λ = 0.154 nm) with voltage of 30 Kv, current of 35 Ma, filter for the Kβ line, and a scintillation detector. The diffractograms were analyzed by using the Origin 8 program.
2.5.7. Fourier Transform Infrared (FTIR) Spectroscopy
Identification of the principal functional groups was conducted via spectroscopy equipment (IR Prestige 21 Shimadzu, Kyoto, Japan). Spectra were obtained within a wave number range of 4000 to 400 cm−1 and analyzed by using the Origin 8 program.
2.5.8. UV-Vis Light Transmittance Values
Film light barrier (50 × 30 mm samples) was evaluated in wavelengths from 200 to 800 nm in a spectrophotometer (Thermo Scientific Genesys-10S-UV-Vis, Waltham, MA, USA) according to Leceta et al. [23].
2.5.9. Color
Film color was determined by using a spectrocolorimeter (Hunter Associates Laboratory, Inc., Reston, VA, USA), according to Arfat et al. [13]. The color difference (∆E*) was calculated by using the following equation:
where ∆E*, ∆a* and ∆b* corresponded to the differences between the color parameters of films containing oleoresins and the values of the reference film (without oleoresin) (L* = 2.094, a* = −1.46, b* = 4.73).
2.5.10. Thermogravimetric Analysis (TGA)
Non-isometric degradation measurements were conducted on a Thermo Microbalance (TG 209 F1 Iris, Netzsch, Selb, Germany). Tests were run from 25 °C to 600 °C at a heating rate of 10 °C/min in a nitrogen atmosphere (10 mL/min) [23].
2.6. Influence of Biocomposite Films on Bread Quality
The formulation of the artisan bread was carried out according to Colombian standard NTC 1363 [24]. Two lots of bread manufactured on different days were evaluated. In both lots, bread samples were packaged in reference films (without oleoresin) and with oleoresins (clove, nutmeg, and black pepper). The bread samples (8 cm × 8 cm) were wrapped with two sheets of the biocomposite material (10 × 10 cm), which were thermally sealed on four sides. The physical-chemical stability (humidity, pH, aw, and weight loss) was evaluated on days 1, 3, 5, and 9 of the storage period at 25 °C and 75% RH. The microbiological and sensory quality of the bread was evaluated at days 1, 4, and 9.
2.7. Physical-Chemical Evaluation of the Bread
Humidity was determined by using the Colombian standard NTC 282 [25]. Five-gram amounts of the sample were taken in a metallic capsule, which was introduced with the samples into a stove with forced-air circulation (FD-53, Binder) between 100 and 110 °C and their weight was evaluated until constant weight. The pH was determined through NTC 1363. Water activity was determined by using a portable PawKit water activity (aw) meter (Aqualab, Pullman, WA, USA). Weight loss was calculated as the difference between the initial weight and the final weight of the bread sample.
2.8. Microbiological Evaluation of the Bread
2.9. Sensory Evaluation of the Bread
A descriptive sensory analysis was conducted with 10 untrained panelists following the NTC 3925 [31]. Attributes of aroma, flavor, hardness, and general acceptability were evaluated in a scale from 1 to 5.
2.10. Statistical Analysis
Each treatment was done in triplicate and the results of the properties were evaluated with 5% significance level (p ≤ 0.05). Analysis of variance (ANOVA) and a multiple comparison test (Tukey) permitted identifying significant differences among the treatments. The results were analyzed through the SPSS Statistics 22.0 software for Windows (SPSS Statistical software, Inc., Chicago, IL, USA).
3. Results and Discussion
3.1. Physical-Chemical and Microbiological Study of the Components of the Biocomposite Material
Black pepper showed antimicrobial activity against both bacterial strains, starting at 0.5% (0.5 µL/100 µL), while clove started at 1% (1 µL/100 µL) against Staphylococcus aureus and as of 2% (2 µL/100 µL) against Escherichia coli. Likewise, nutmeg inhibited the growth of Staphylococcus aureus as of 0.5% (0.5 µL/100 µL) and as of 1% (1 µL/100 µL) against Escherichia coli.
The type B gelatin used in this research had a Bloom of 220–240 g, which is related to the gel’s mechanical elasticity, an important parameter in its capacity and gelling force, for provoking deformation at a certain concentration and temperature.
Figure 1a shows the gelatin’s particle size distribution, which had unimodal distribution with a broad range of sizes comprised between 3.8 and 1905 µm. A large peak was observed where there are most of the particles with approximate sizes of 549.5 µm with 10.58% volume, this particle diameter is close to the mean diameter (D(4.3) = 476.987 µm).
Figure 1b displays the gelatin’s X-ray diffractogram, showing a dominant peak amply widened at 20.08°, which is characteristic of amorphous materials, indicating that gelatin does not have a periodic structure, given that it comprised of proteins with different structures [32].
Figure 1c shows the gelatin’s FTIR spectrum. The type A amide band at 3425 cm−1 corresponds to stretching of N-H groups with hydrogen bonds; at 2928 cm−1 there are type B amide bands that correspond to stretching of CH2; the band at 1638 cm−1 is attributed to type I amides; at 1543 cm−1, we find the type II amides and at 1232 cm−1 the type III amides [33,34].
Figure 1d shows three thermal degradation stages. The first stage at 191 °C with 14.15% mass loss, corresponding to water elimination; the second stage at 434 °C has the highest mass loss (55.55%), which was associated to degradation of proteins of high molecular weight and a residual mass (ashes) of 22.97%.
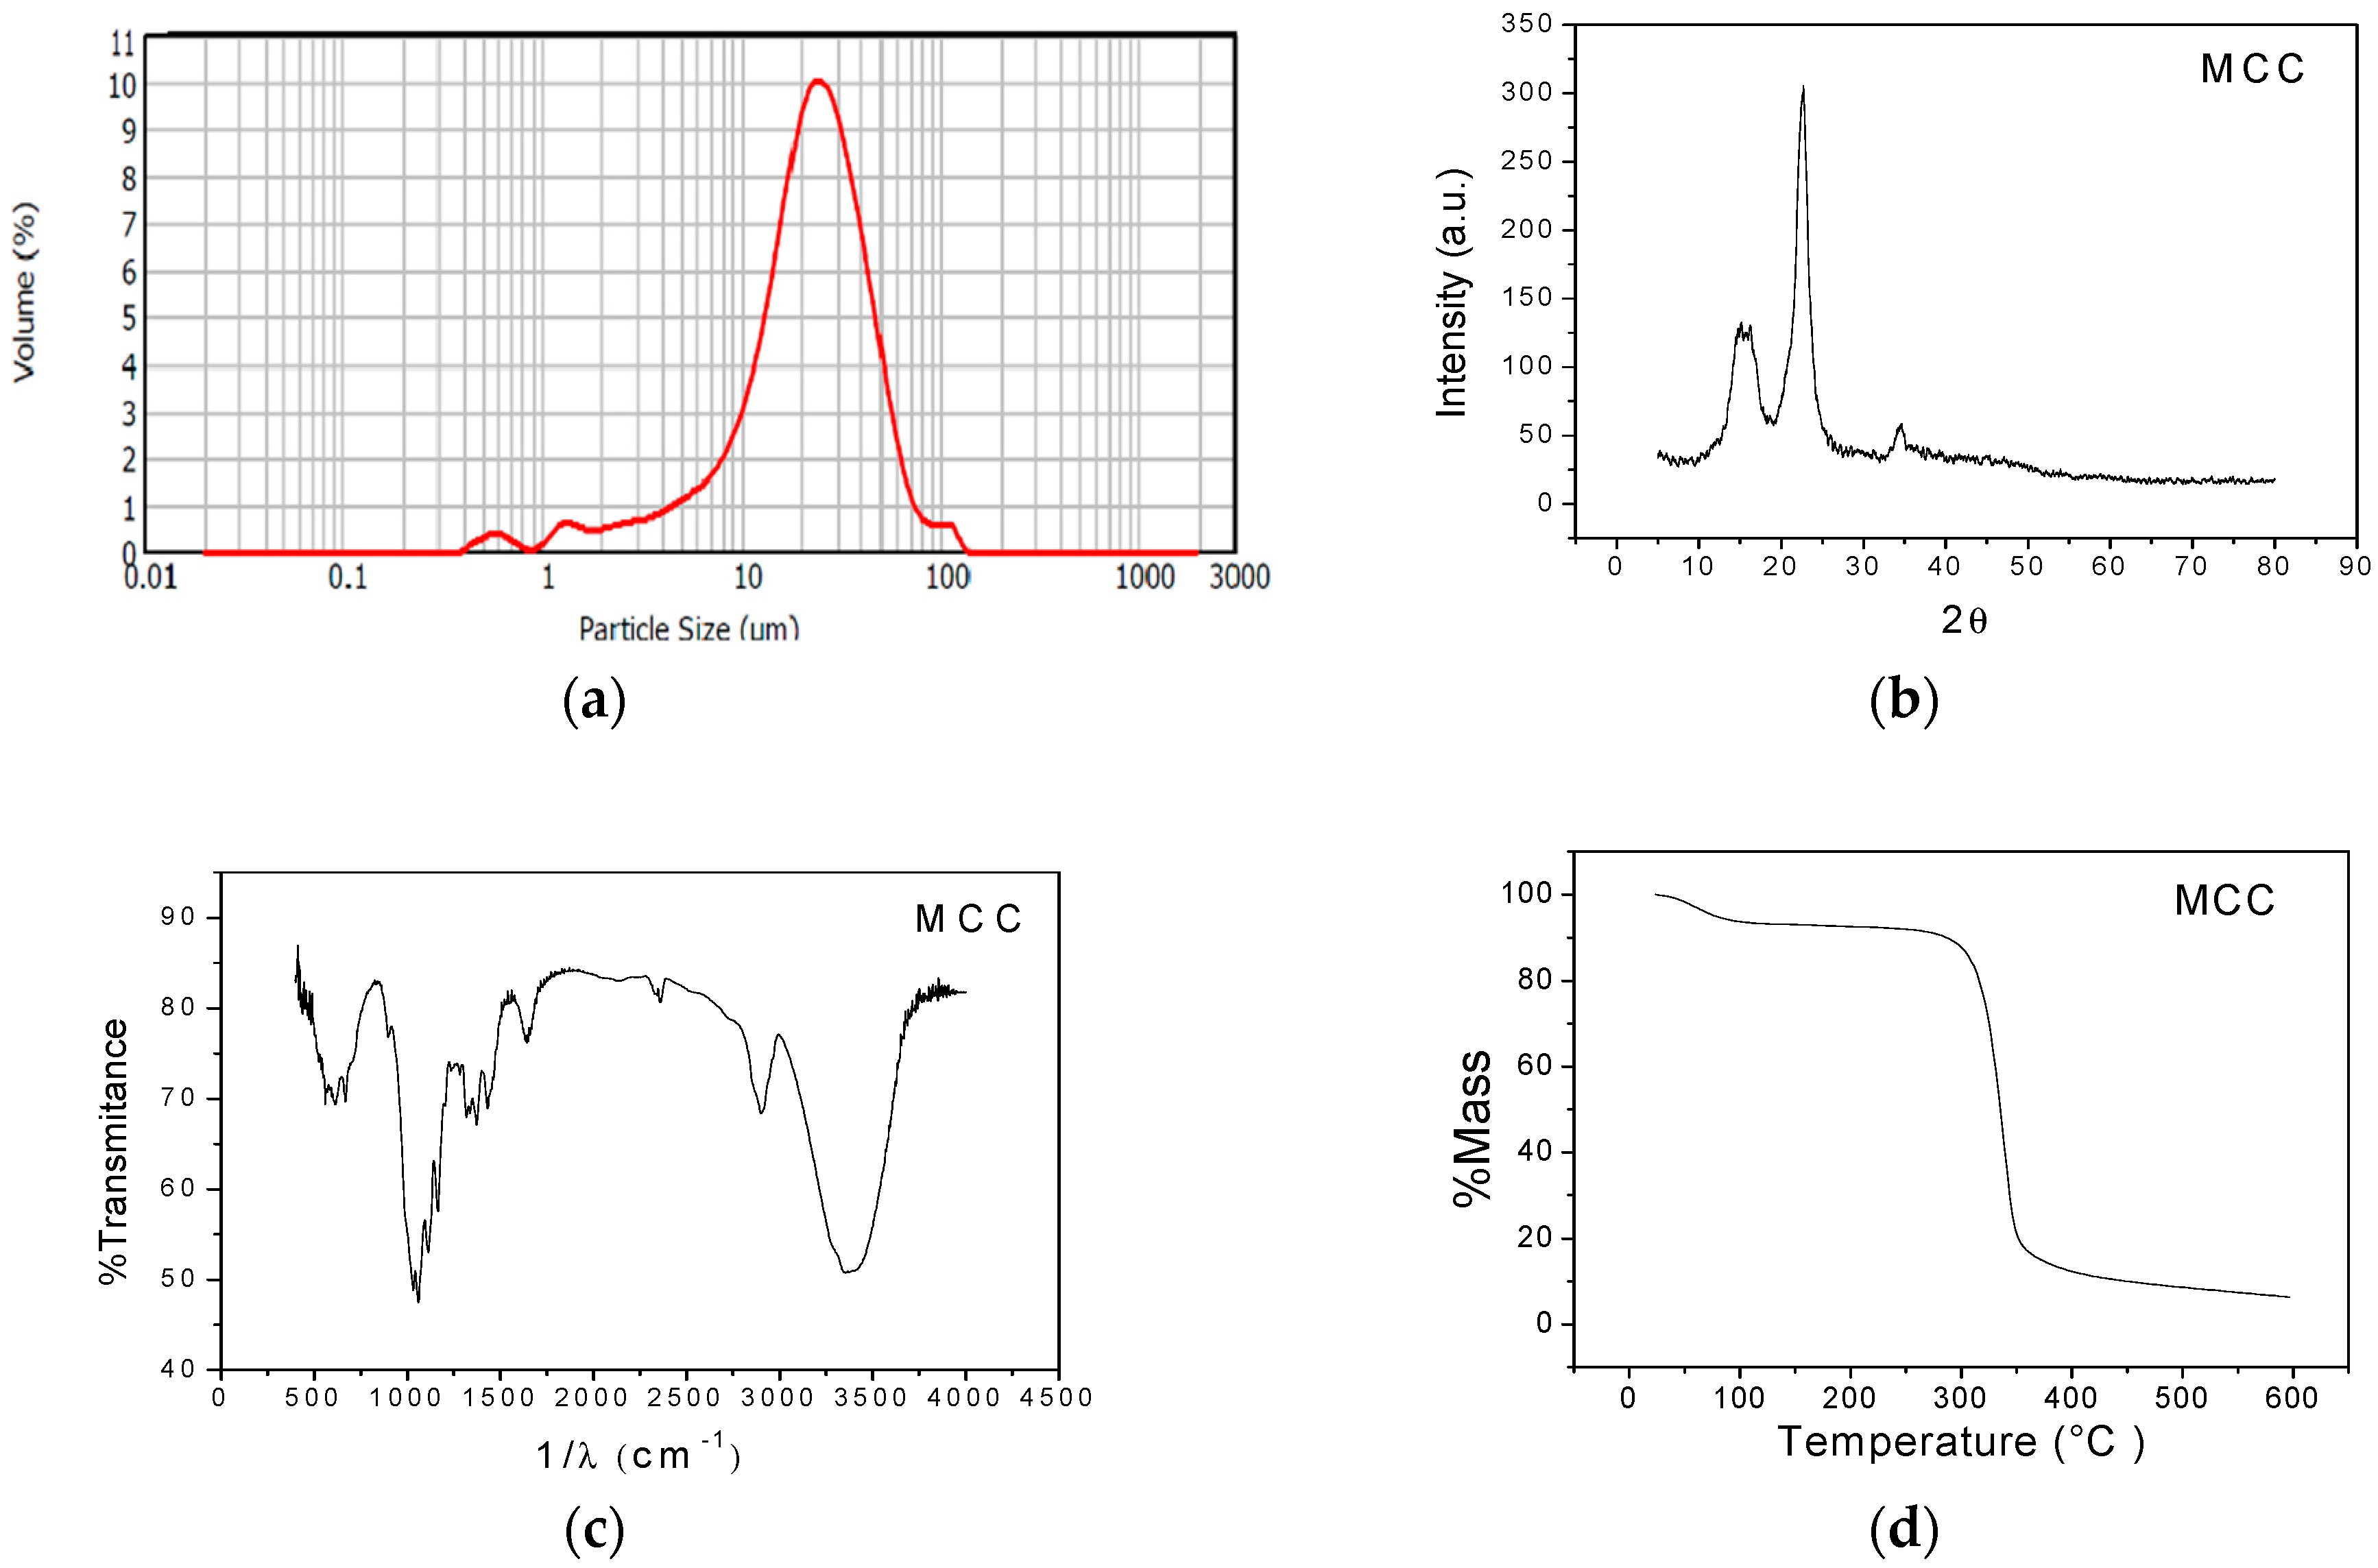
Figure 2a illustrates a unimodal distribution with size range between 0.41 and 138 µm. A large peak was observed where there is the majority of particles with approximate sizes of 26.3 µm with 9.06% volume; this particle diameter was close to the mean diameter (D(4,3) = 25.9 µm).
Figure 2b presents the microcrystalline cellulose diffractogram, with a peak in the 2θ angle at 22.59°, corresponding to the crystalline and a peak on the 2θ angle at 18.8°, corresponding to the amorphous material. The microcrystalline cellulose had 79.87% crystallinity, which coincides with the values reported in other studies [35,36,37].
Figure 2c shows the principal functional groups of the microcrystalline cellulose. At 3399 cm−1, stretching of the -OH groups was observed; the CH and CH2 groups are found at 2900 cm−1; the band at 1427 cm−1 is associated to the presence of HCH groups and OCH vibrations; the band at 1374 cm−1 is related to the vibration of CH groups; the band at 1217 cm−1 is attributed to C-C groups and at 1039 cm−1 to stretching of C-O groups [38,39].
Figure 2d shows that the first stage of thermal degradation corresponds to water elimination at 108 °C. Dehydration, decarboxylation, depolymerization, and glycosyl decomposition take place in the second stage between 363 and 589 °C [37,40,41].
The main active compounds identified in the nutmeg oleoresin were: myristic acid, miristicine, elemicine, sabinene and α-pinene. In the clove oleoresin, eugenol and eugenol acetate were identified. The black pepper oleoresin presented piperine as its main component, followed by trans-β-cariophylene and limonene. All these compounds have antimicrobial and antioxidant properties, as reported by other authors [42,43,44].
3.2. Characterization of Films
To obtain the films, 0.22 g of solution per each cm2 of support plate permitted obtaining a continuous cohesive matrix with thicknesses of 0.058 ± 0.0013 mm containing clove oleoresin, 0.06 ± 0.0021 mm containing nutmeg oleoresin, and 0.062 ± 0.0018 mm containing black pepper oleoresin.
3.2.1. Humidity
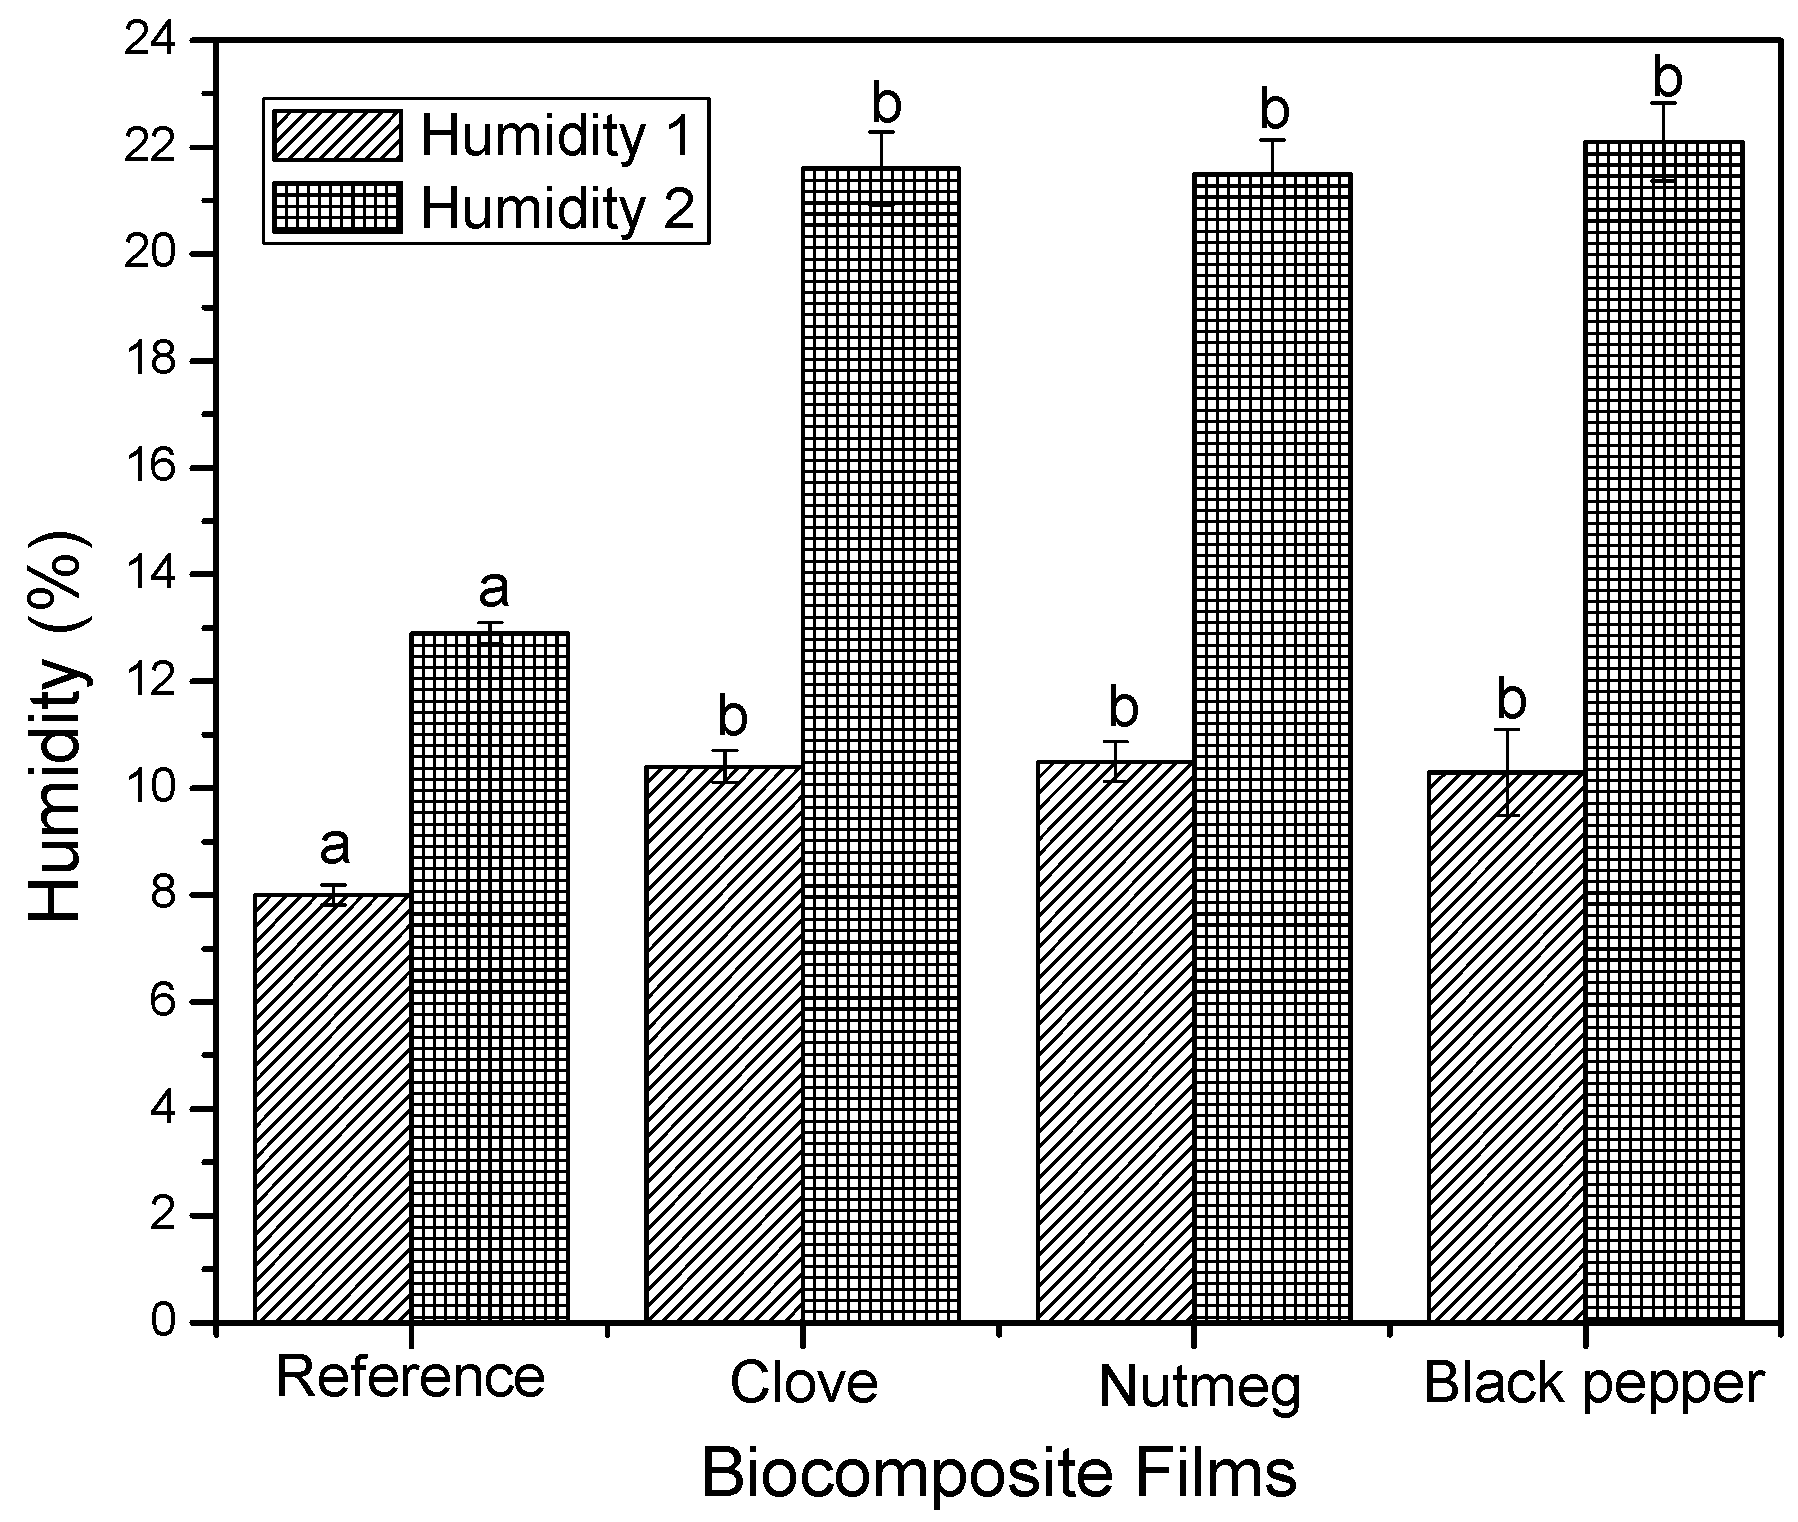
Figure 3 presents the humidity of films after drying (Humidity 1) and after the conditioning period (Humidity 2). The humidity content of the biocomposite films containing oleoresins did not have significant differences after drying, obtaining humidity values of 10.4 ± 0.1 g of water/100 g of biocomposite film. After conditioning, the films increased their humidity content to 21.73 ± 0.32 g of water/100 g of biocomposite film. Additionally, the reference films (biocomposites without added oleoresin) had humidity contents of 8 ± 0.18 g of water/100 g of biocomposed film after drying and 12.9 ± 0.19 g of water/100 g of biocomposite film upon completing the conditioning period. The reference films had low humidity after drying and after conditioning with respect to the biocomposite films with oleoresins presenting significant differences (p < 0.05), which indicates that oleoresins would be creating bonds with the OH groups of the plasticizer and its polyphenolic groups, thus, maintaining the structure hydrated [45].
3.2.2. Water Vapor Permeability
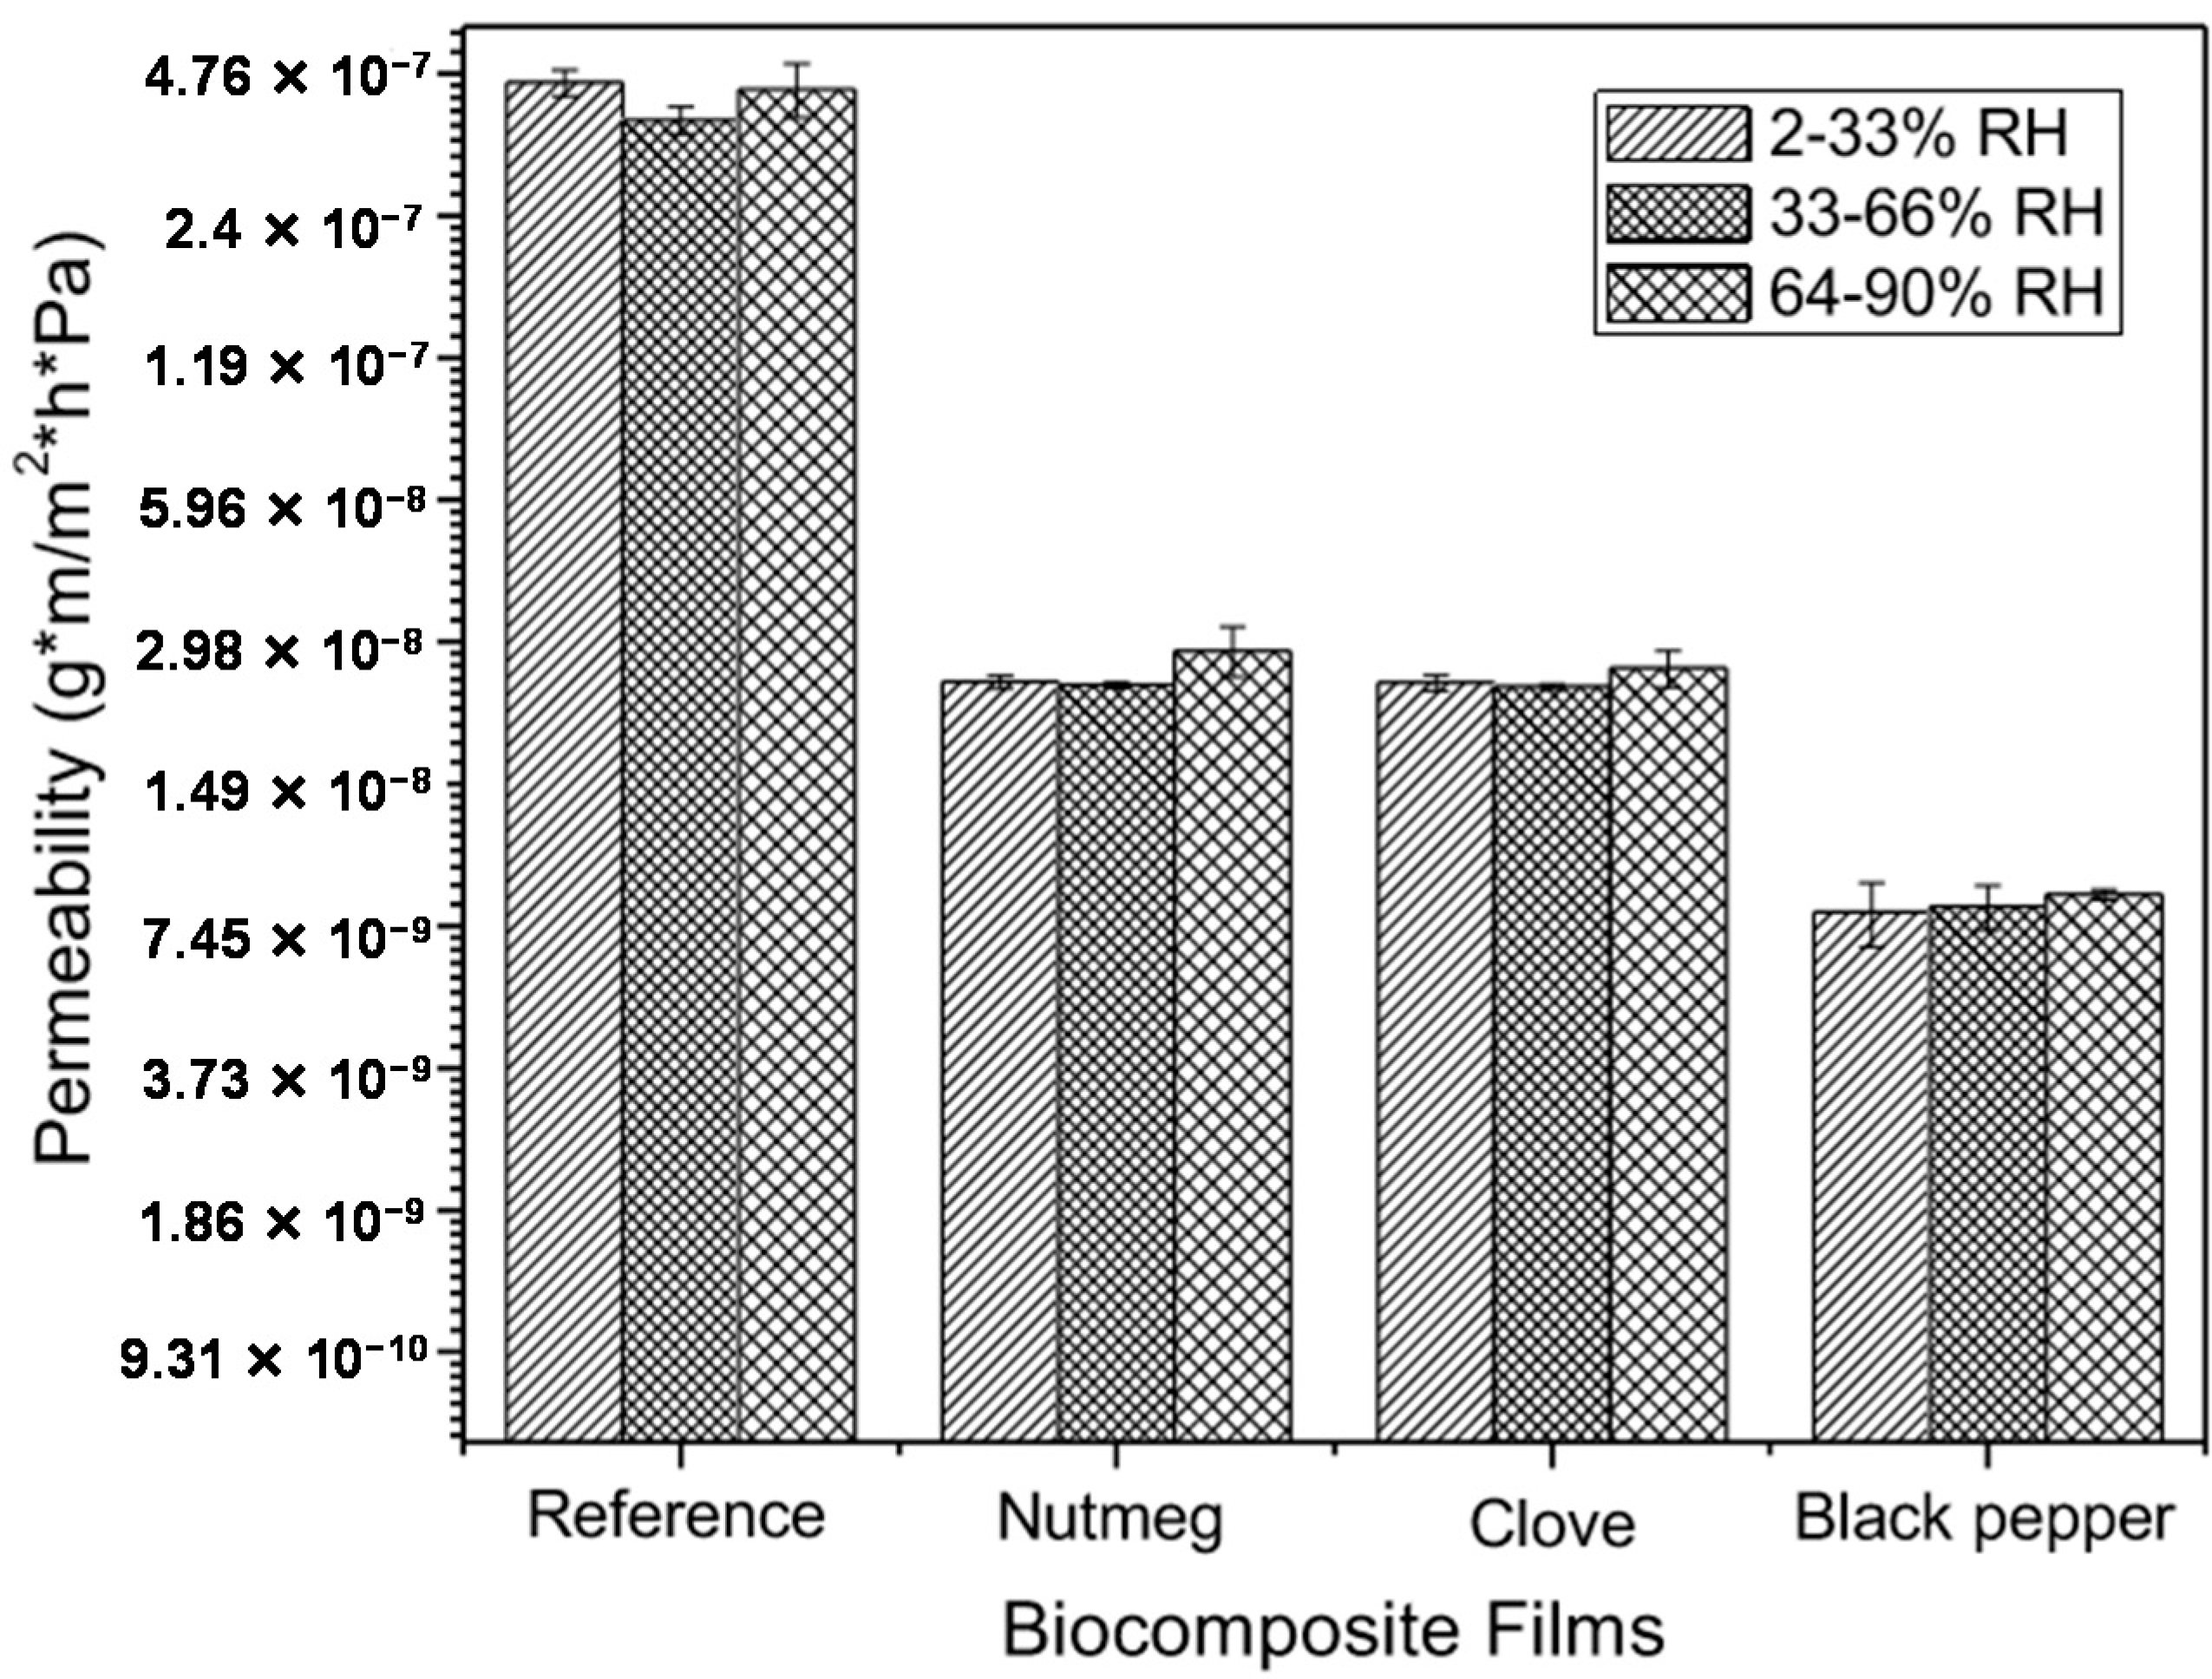
Upon adding nutmeg, clove, and black pepper oleoresins to the gelatin matrix, microcrystalline cellulose and glycerol (reference film), the permeability gradient diminished significantly, from 4 × 10⁻⁷ g·m/m2·h·Pa to 4 × 10⁻⁹ g·m/m2·h·Pa (Figure 4). Likewise, upon varying the relative humidity, slight permeability changes were observed among the same films. This permeability decrease with respect to reference films is due to the hydrophobic nature of the oleoresins, which avoids absorption and desorption of water molecules, increasing film hydrophobicity due to the interactions between the hydrophobic compounds in oleoresins and the other film components, which diminishes the availability of the hydrophilic groups. The water molecules diffuse into the continuous polymer phase, where the presence of oily molecules introduces interruptions that increase the tortuosity for transference or mobility of water molecules [46].
3.2.3. Mechanical Properties
The films without oleoresin (reference) were more rigid, possibly due to the restricted mobility of the molecules present in the structure, which could limit their manipulation when used to wrap or package foods. In comparison to these films, biocomposites containing oleoresins showed a reduction in tensile strength (TS) and elastic modulus (EM), as well as a significant increase in their elongation values (Figure 5). This typical behavior of plasticized films has been reported in several studies regarding the addition of lipid components to the biocomposite films. This is attributed to the inability of lipids to form continuous and cohesive matrices when incorporated to biocomposite films [47,48]. As noted in Figure 5, when adding black pepper oleoresin, higher elongation values were obtained. Some authors have indicated that the addition of oily substances such as essential oils (added to the matrix) has a plasticizing role, which gives the material greater flexibility [6,49,50]. Thus, the incorporation of black pepper oleoresin to the polymer gelatin matrix broadens the potential use of this material as food packaging.
3.2.4. Oil Permeability
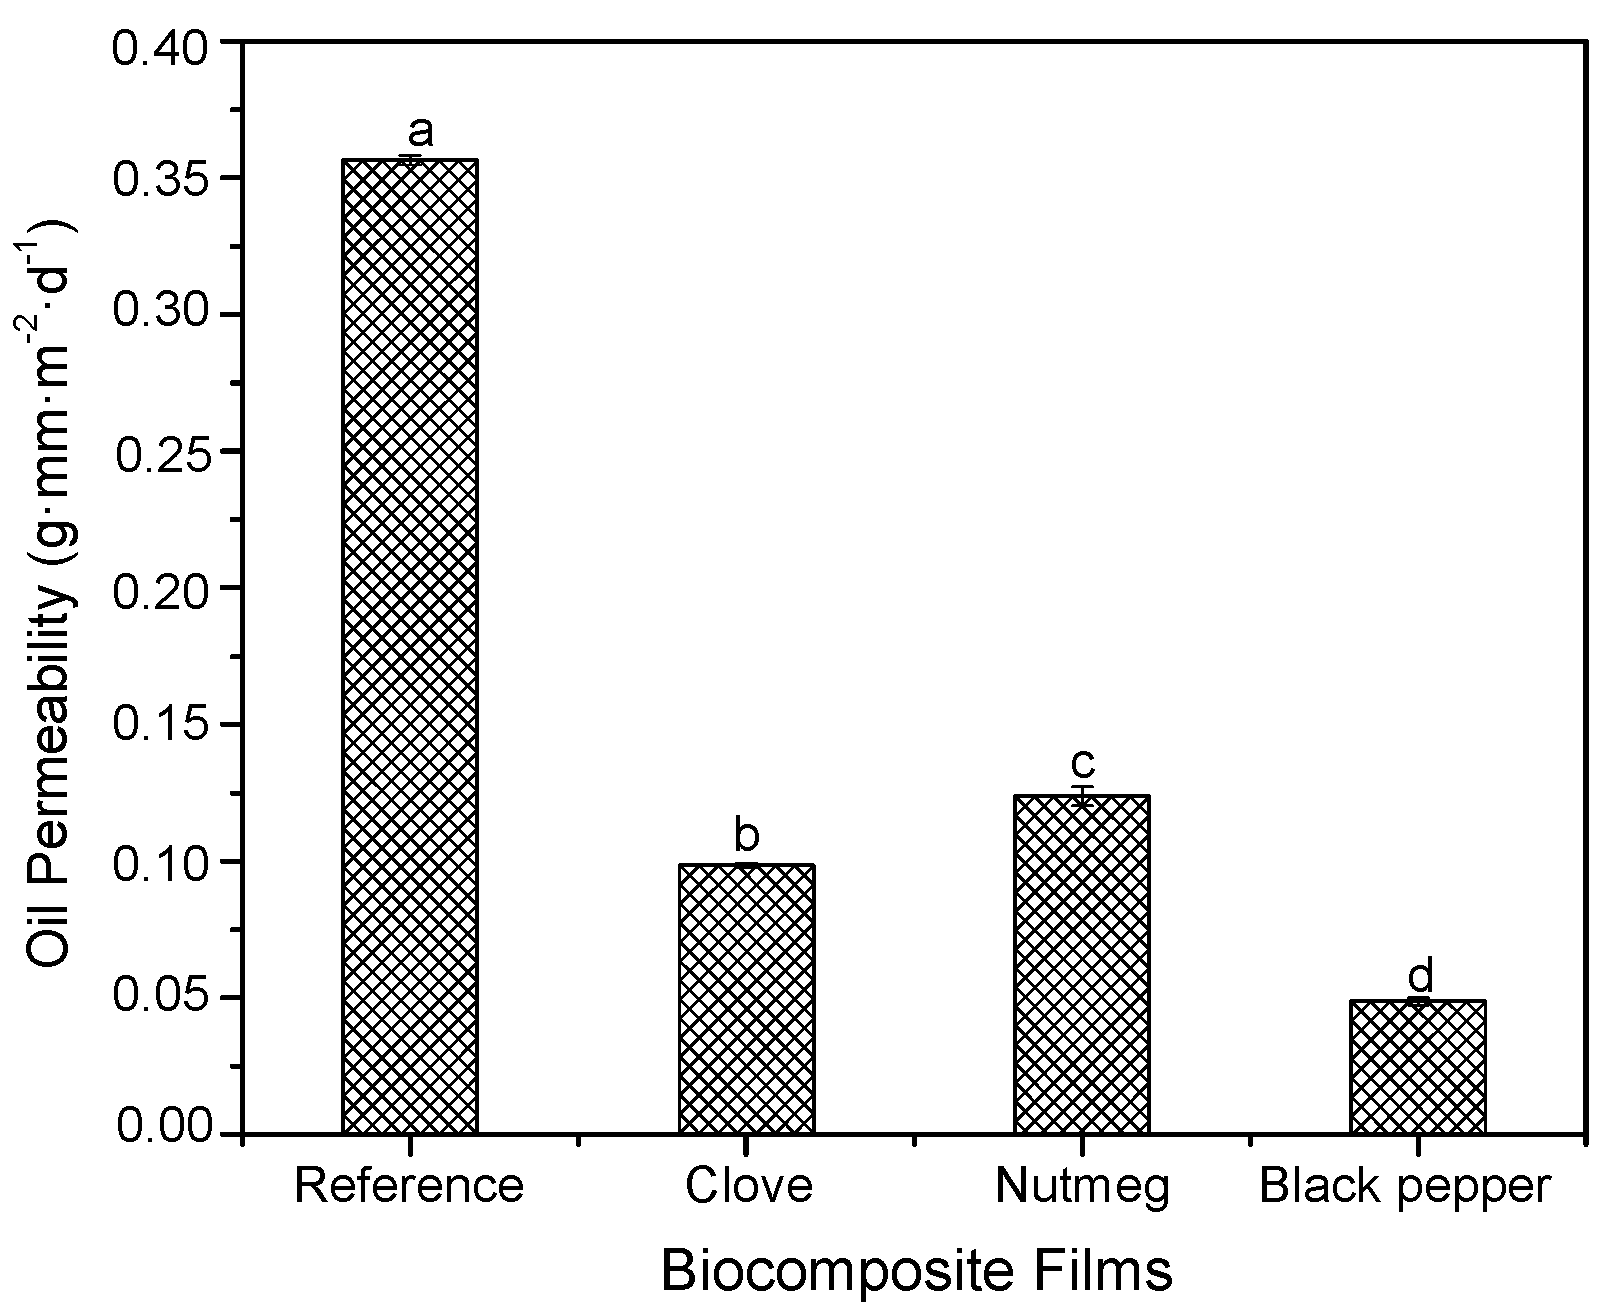
As shown in Figure 6, oil permeability values of biocomposite films containing oleoresins (clove, nutmeg or black pepper) were between 25% and 30%, smaller in comparison with the reference film (0.36 ± 0.0017 g·mm·m−2·d−1). This result may be due to a greater final humidity content in films containinig oleoresin (Section 3.2.1) increased the total number of hydroxyl groups (oleophobic) in the film network, which could prevent the passage of oil molecules through the film as reported by [22,51]. Oil permeability values varied significantly in function of the differences in oleoresin composition.
3.2.5. UV-Vis Light Transmittance Values
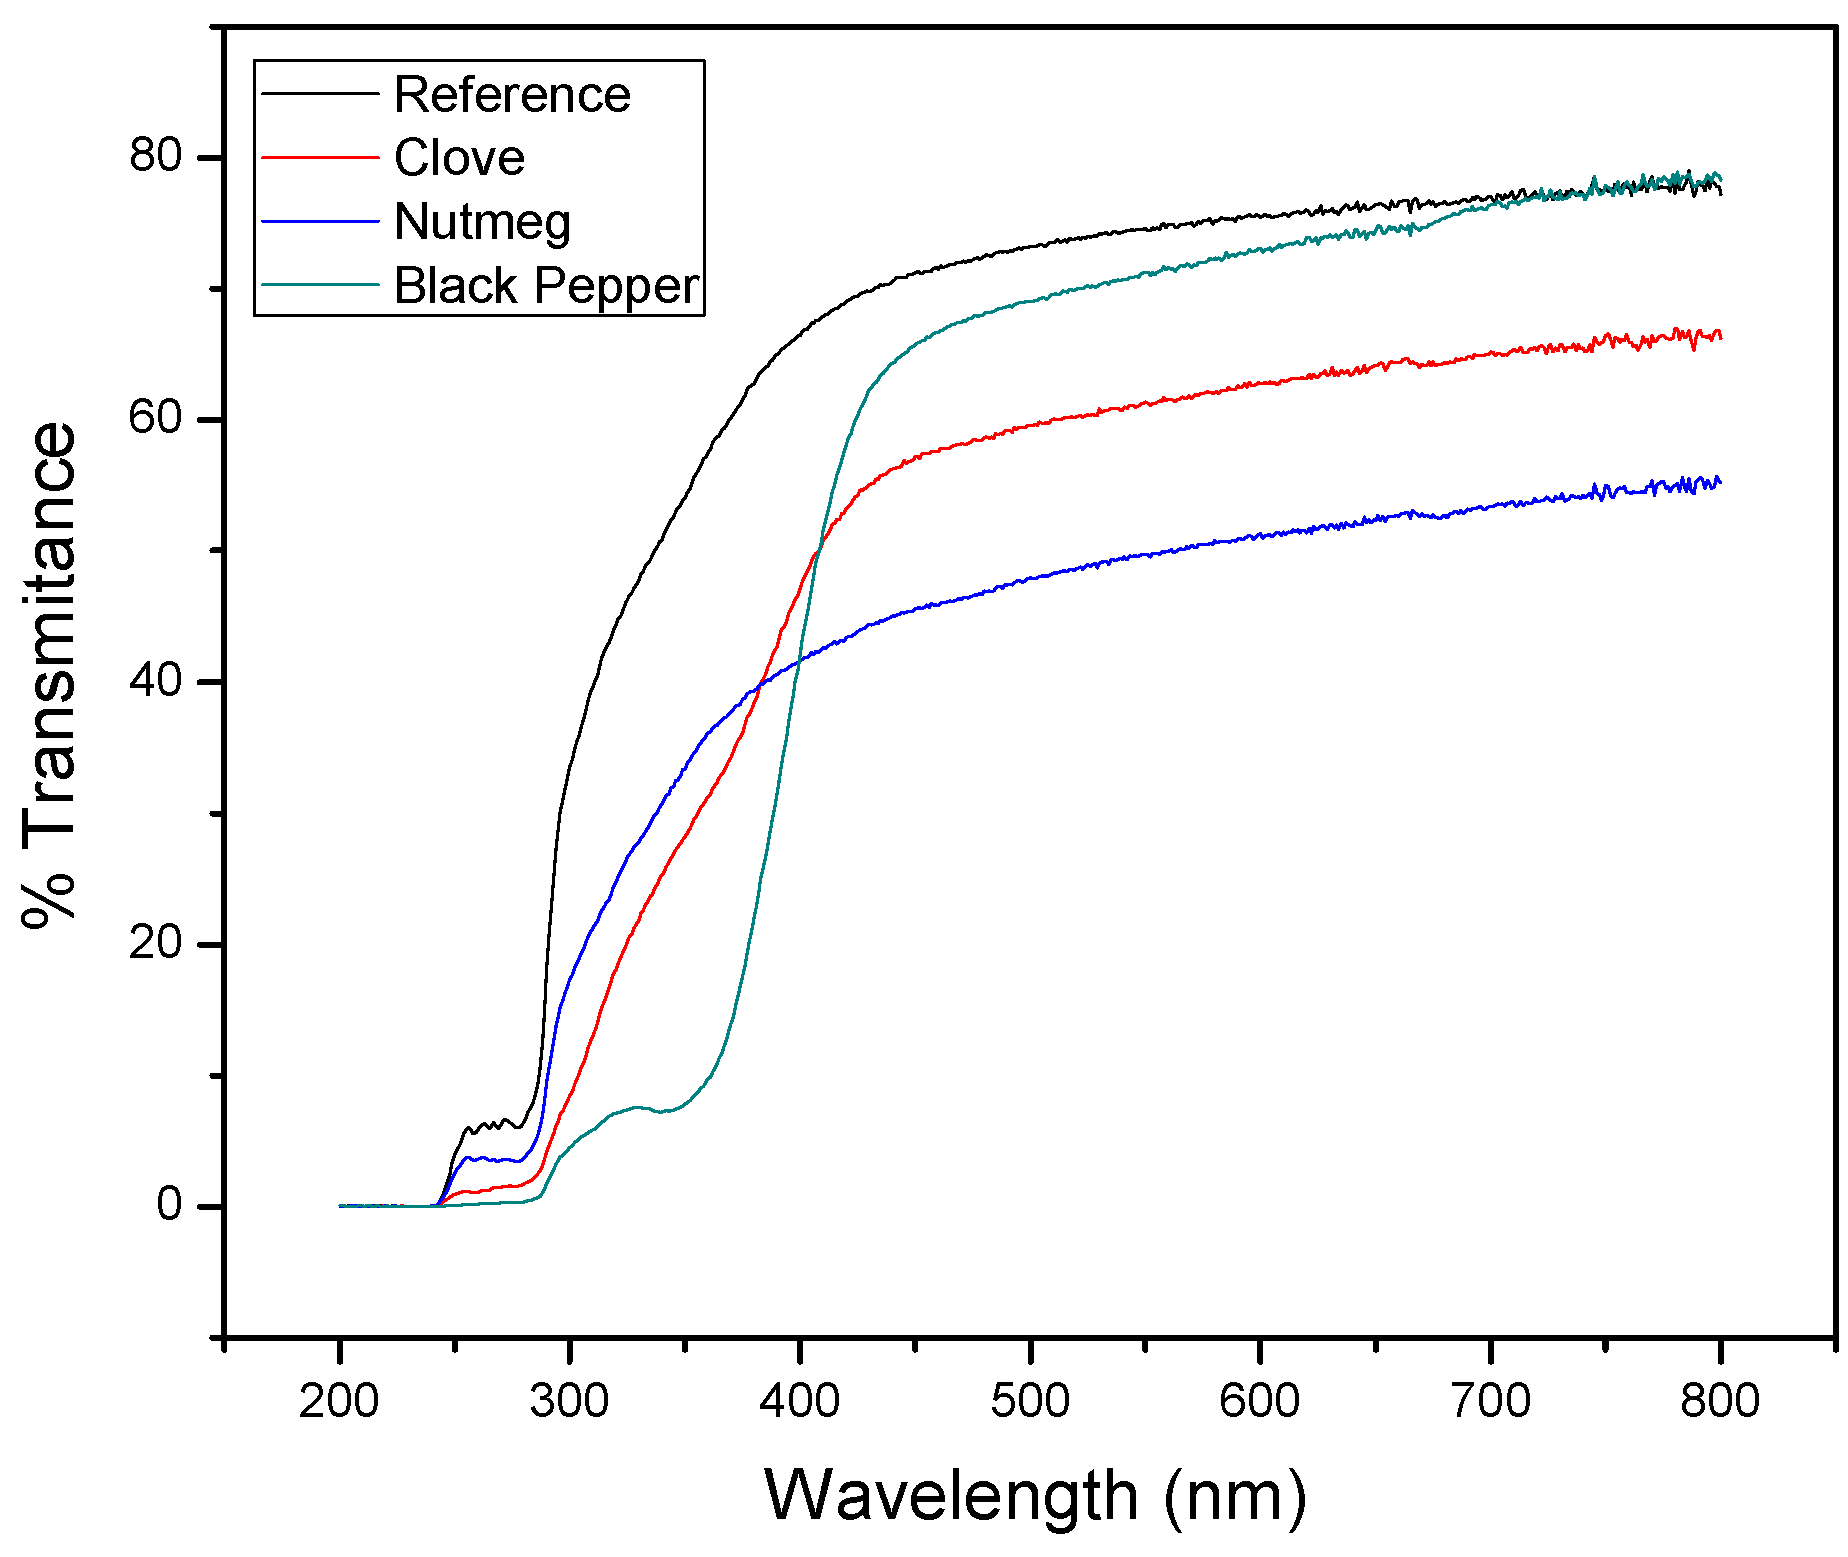
As noted in Figure 7, the capacity UV-Vis light transmission of the gelatin films was significantly reduced with the incorporation of oleoresins (p < 0.05). This indicated that biocomposite films containing oleoresins (clove, nutmeg or black pepper) enhance their light barrier properties. The reference film had a higher transmittance value at 600 nm (75.39%), followed by the films containing black pepper (73.04%), clove (62.81%), and nutmeg (51.34%) oleoresins. This result could be attributed to light scattering due to the presence of oleoresin in the form of tiny drops dispersed into polymeric matrix. Thus, the light barrier property of the biocomposites is important for food preservation, given that it can avoid photo-oxidation of organic compounds and degradation of vitamins and pigments [9,10].
3.2.6. Measurement of Seal Strength
As shown in Figure 8, films containing oleoresins had significant changes with respect to the reference films (without oleoresin) (p < 0.05). The reference films had a resistance of 4.93 ± 0.05 MPa. On average, oleoresins increased seal strength by 8% with respect to that of the reference film, achieving greater fusion between the components when heat was applied through the sealer.
3.2.7. X-ray Diffraction (XRD)
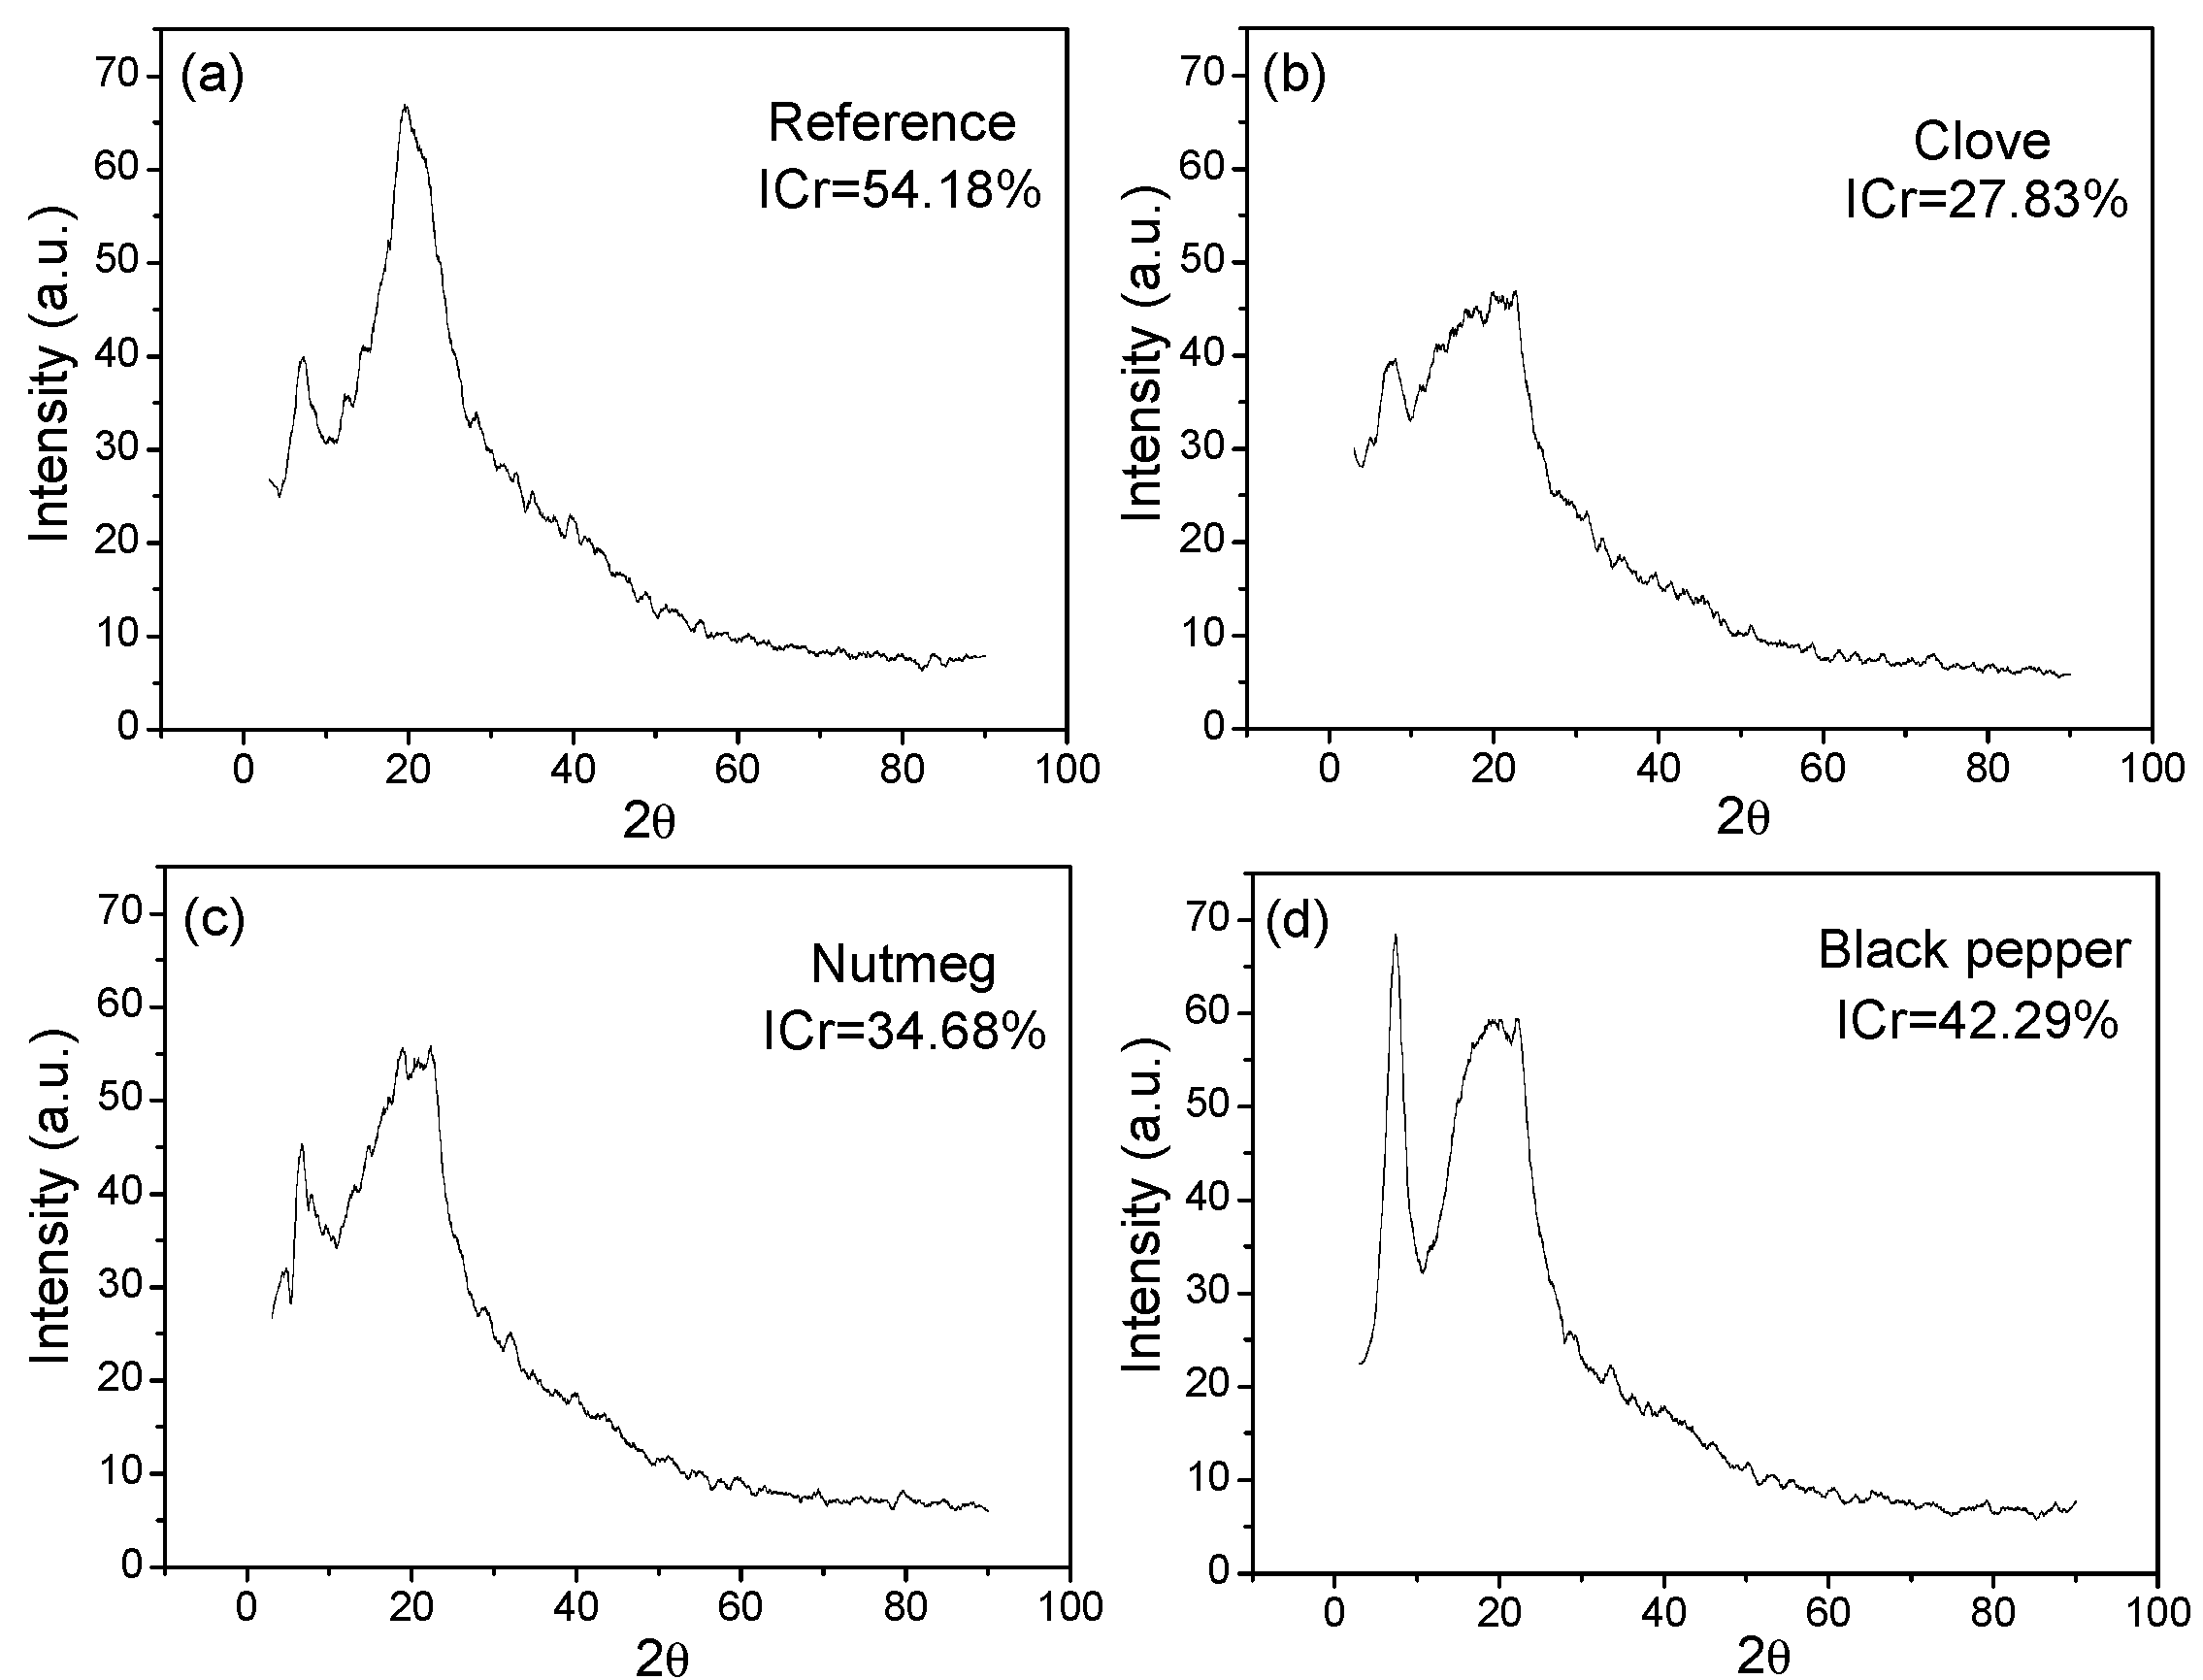
Figure 9a shows the diffractogram of the reference film, which in the 2θ angle presented two peaks at 19.61° and 7.09°, with 54.18% crystallinity. The diffractogram (Figure 9b), which corresponds to the biocomposite film with clove oleoresin presented two peaks in the 2θ angle at 21.33° and 7.76°, with 27.83% crystallinity. The diffractogram (Figure 9c), corresponding to the biocomposite film with nutmeg oleoresin had two peaks in the 2θ angle at 20.28° and 6.71°, with 34.68% crystallinity. The diffractogram (Figure 9d), corresponding to the biocomposite film with black pepper oleoresin had two peaks in the 2θ angle at 19.95° and 7.09°, with crystallinity of 42.29%. When oleoresins were added to the polymeric matrix, crystallinity diminished with respect to the reference film. This result could be attributed to the fact that the intermolecular interactions among the components of the biocomposite containing oleoresin limited the movements of the molecular chain segments and restrained the crystallisation process [52]. In the present work, the value of the crystallinity obtained for the film containing black pepper oleoresin could indicate good compatibility and interaction with the other components.
3.2.8. Fourier Transformed Infrared (FTIR) Spectroscopy
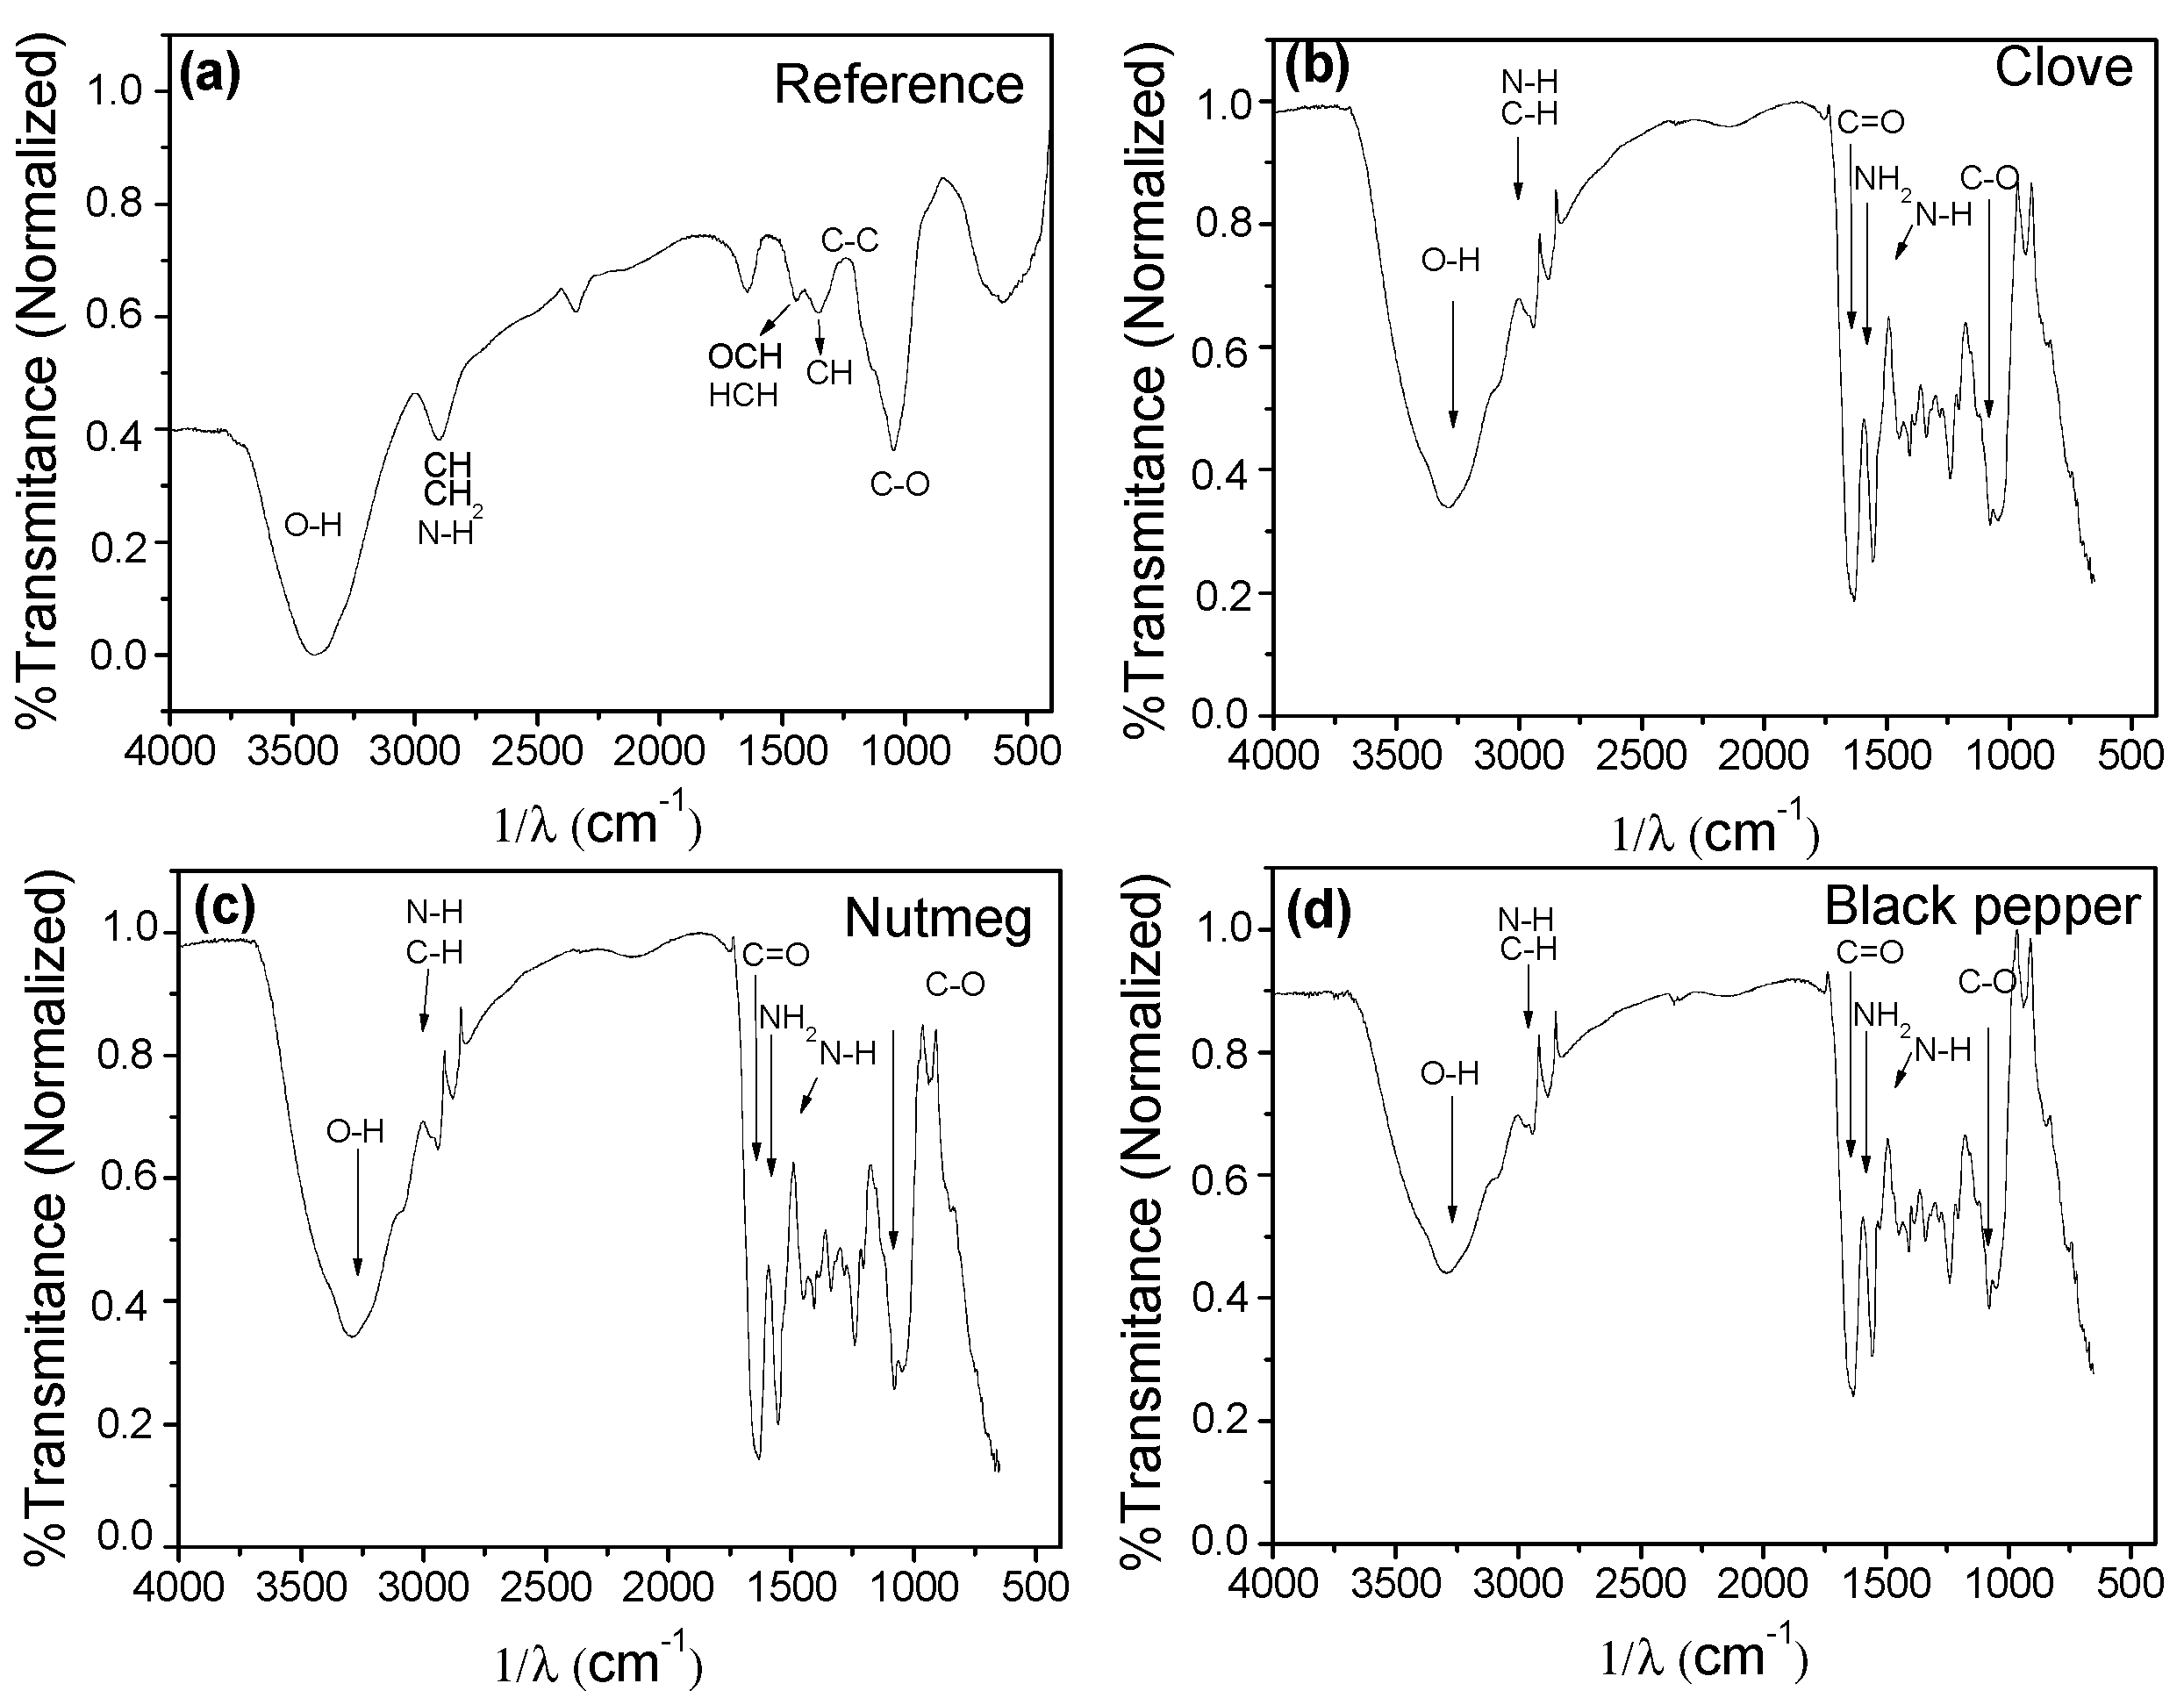
In the IR spectrum obtained for the reference films (Figure 10a), it can be noted that the band at 3422 cm−1 has OH and N-H groups characteristic of glycerol and gelatin (type A amide), respectively. At 2887 cm−1, there are CH and CH2 groups; the band at 1428 cm−1 has the HCH groups and OCH vibrations; the band at 1347 cm−1 is related to the vibration of CH groups; the band at 1219 cm−1 is attributed to C-C groups; and at 1045 cm−1 to C-O group stretching. Most of the functional groups coincide with that reported for microcrystalline cellulose and gelatin. The spectra in Figure 10b–d corresponding to films with clove, nutmeg, and black pepper oleoresins, respectively, were quite similar amongst themselves, but different from the reference film.
Hydrogen bonds of O-H and N-H groups gave way to a broad band at 3383 and 3199 cm−1 because of the compounds in the polymer matrix (gelatin, cellulose, and glycerol); C-H groups were found at 2946 cm−1. The band at 1638 cm−1 is attributed to C=O bonds; at 1597 and 1479 cm−1 NH2 primary amines and N-H secondary amines, respectively, and at 1065 cm−1 C-O groups. These results indicate that adding oily molecules propitiated a structural change of the polymer matrix material.
3.2.9. Color
The color parameters of the biocomposite films are shown in Table 1. Visually, the films had a slightly yellow aspect and their transparency was reduced upon incorporating the oleoresins. The films containing clove, nutmeg, and black pepper oleoresins had ΔE of 4.66, 1.05, and 2.65, respectively, with respect to the reference film.
3.2.10. Thermogravimetric Analysis (TGA)
All the thermograms (not shown) detected four changes of temperature and mass; the first stage revealed a weight loss from 12.73% to 14.37% at temperatures ranging from 150 to 161 °C for all films: This change is related to the loss of free water present in the films and volatile compounds of the oleoresins. On the second stage, the reference biocomposite films and clove films, at temperatures from 273 and 276 °C lost 15.52% and 16.75% mass, respectively; while the films with nutmeg and black pepper at temperatures from 284 and 274 °C lost 20.42% and 20.61% mass, respectively. Within these temperature ranges, degradation occurred of low molecular weight proteins of the polymer (gelatin) and other compounds present in the plasticizer (glycerol). During the third stage, the temperature changes for the biocomposite films ranged between 386 and 402 °C with weight loss between 42.44% and 46.45%, where decomposition took place of high molecular weight proteins present in the gelatin, as well as the degradation of the microcrystalline cellulose due to the rupture of the glycosidic bonds. On the fourth stage, the temperature changes occurred between 598.5 and 598.7 °C for all the films with weight loss between 15.73% and 16.81%, where degradation possibly occurred of the nonvolatile phase of the oleoresins and other compounds of high molecular weight present in the films.
3.3. Physical-Chemical Evaluation of the Bread
3.3.1. Moisture
Table 2 shows that, during the first three days of storage, the bread samples packaged in films containing oleoresins maintained desirable moisture contents according to the norm, while the bread samples without film and those packaged in reference films (without oleoresin) had a significant decrease (p < 0.05) in moisture content. After the nine-day storage period, it was noted that the bread samples packaged in films containing black pepper oleoresin achieved a lower loss of moisture compared to the rest, which is desirable to preserve the product’s texture characteristics.
3.3.2. pH
The pH values obtained for all the samples evaluated during the storage period remained within the quality range established by the norm [24]. At nine days of storage, the bread samples packaged in reference films had higher pH values compared to those packaged in films containing oleoresins (Table 2). This result was associated to the presence of acid compounds in the oleoresins. Additionally, bread samples stored without film had the lowest pH values, which could be caused by enzymatic and microbiological reactions catalyzed by the product’s exposure to the environment.
3.3.3. Water Activity (aw)
On the third day of storage, the bread samples packaged in films containing oleoresins maintained a higher water activity as compared to the samples without film and those packaged in reference films. The latter had the lowest values of aw due to the direct exposure of the product to the environment (Table 2). Among the bread samples packaged in films containing oleoresins, those containing black pepper had the highest values of aw. This behavior coincides with the results on humidity content of the bread and permeability to water vapor of said films.
3.3.4. Weight Loss (%wl)
After three days of storage, the bread samples stored in films containing oleoresins had the lowest weight loss values (20–28%). Upon completing the storage period, the bread samples packaged with films containing clove and nutmeg oleoresins had statistically similar weight loss values, while the samples packaged in films containing black pepper oleoresin had the lowest weight loss values (13%). These results confirm the greatest water vapor barrier exerted by the films when incorporating black pepper oleoresin in their formulation.
3.4. Microbiological Evaluation of the Bread
Table 3 presents the microbiological quality of bread samples packaged in biocomposite films on days 1, 4, and 9 of storage. Upon completing the storage period evaluated, higher growth of mold and yeast occurred on bread samples without film (2440 CFU/g) and in those packaged in reference films (460 CFU/g). Similar behavior occurred in the S. aureus count (440 and 50 CFU/g, respectively). In addition, the microbiological analyses evidenced no growth of S. aureus and lower growth of mold and yeast occurred in the bread samples packaged in films containing oleoresins. During the storage period, it was noted that using biocomposite films containing black pepper oleoresin was the most effective packaging material in terms of the product’s microbiological quality.
3.5. Sensory Analysis of the Bread
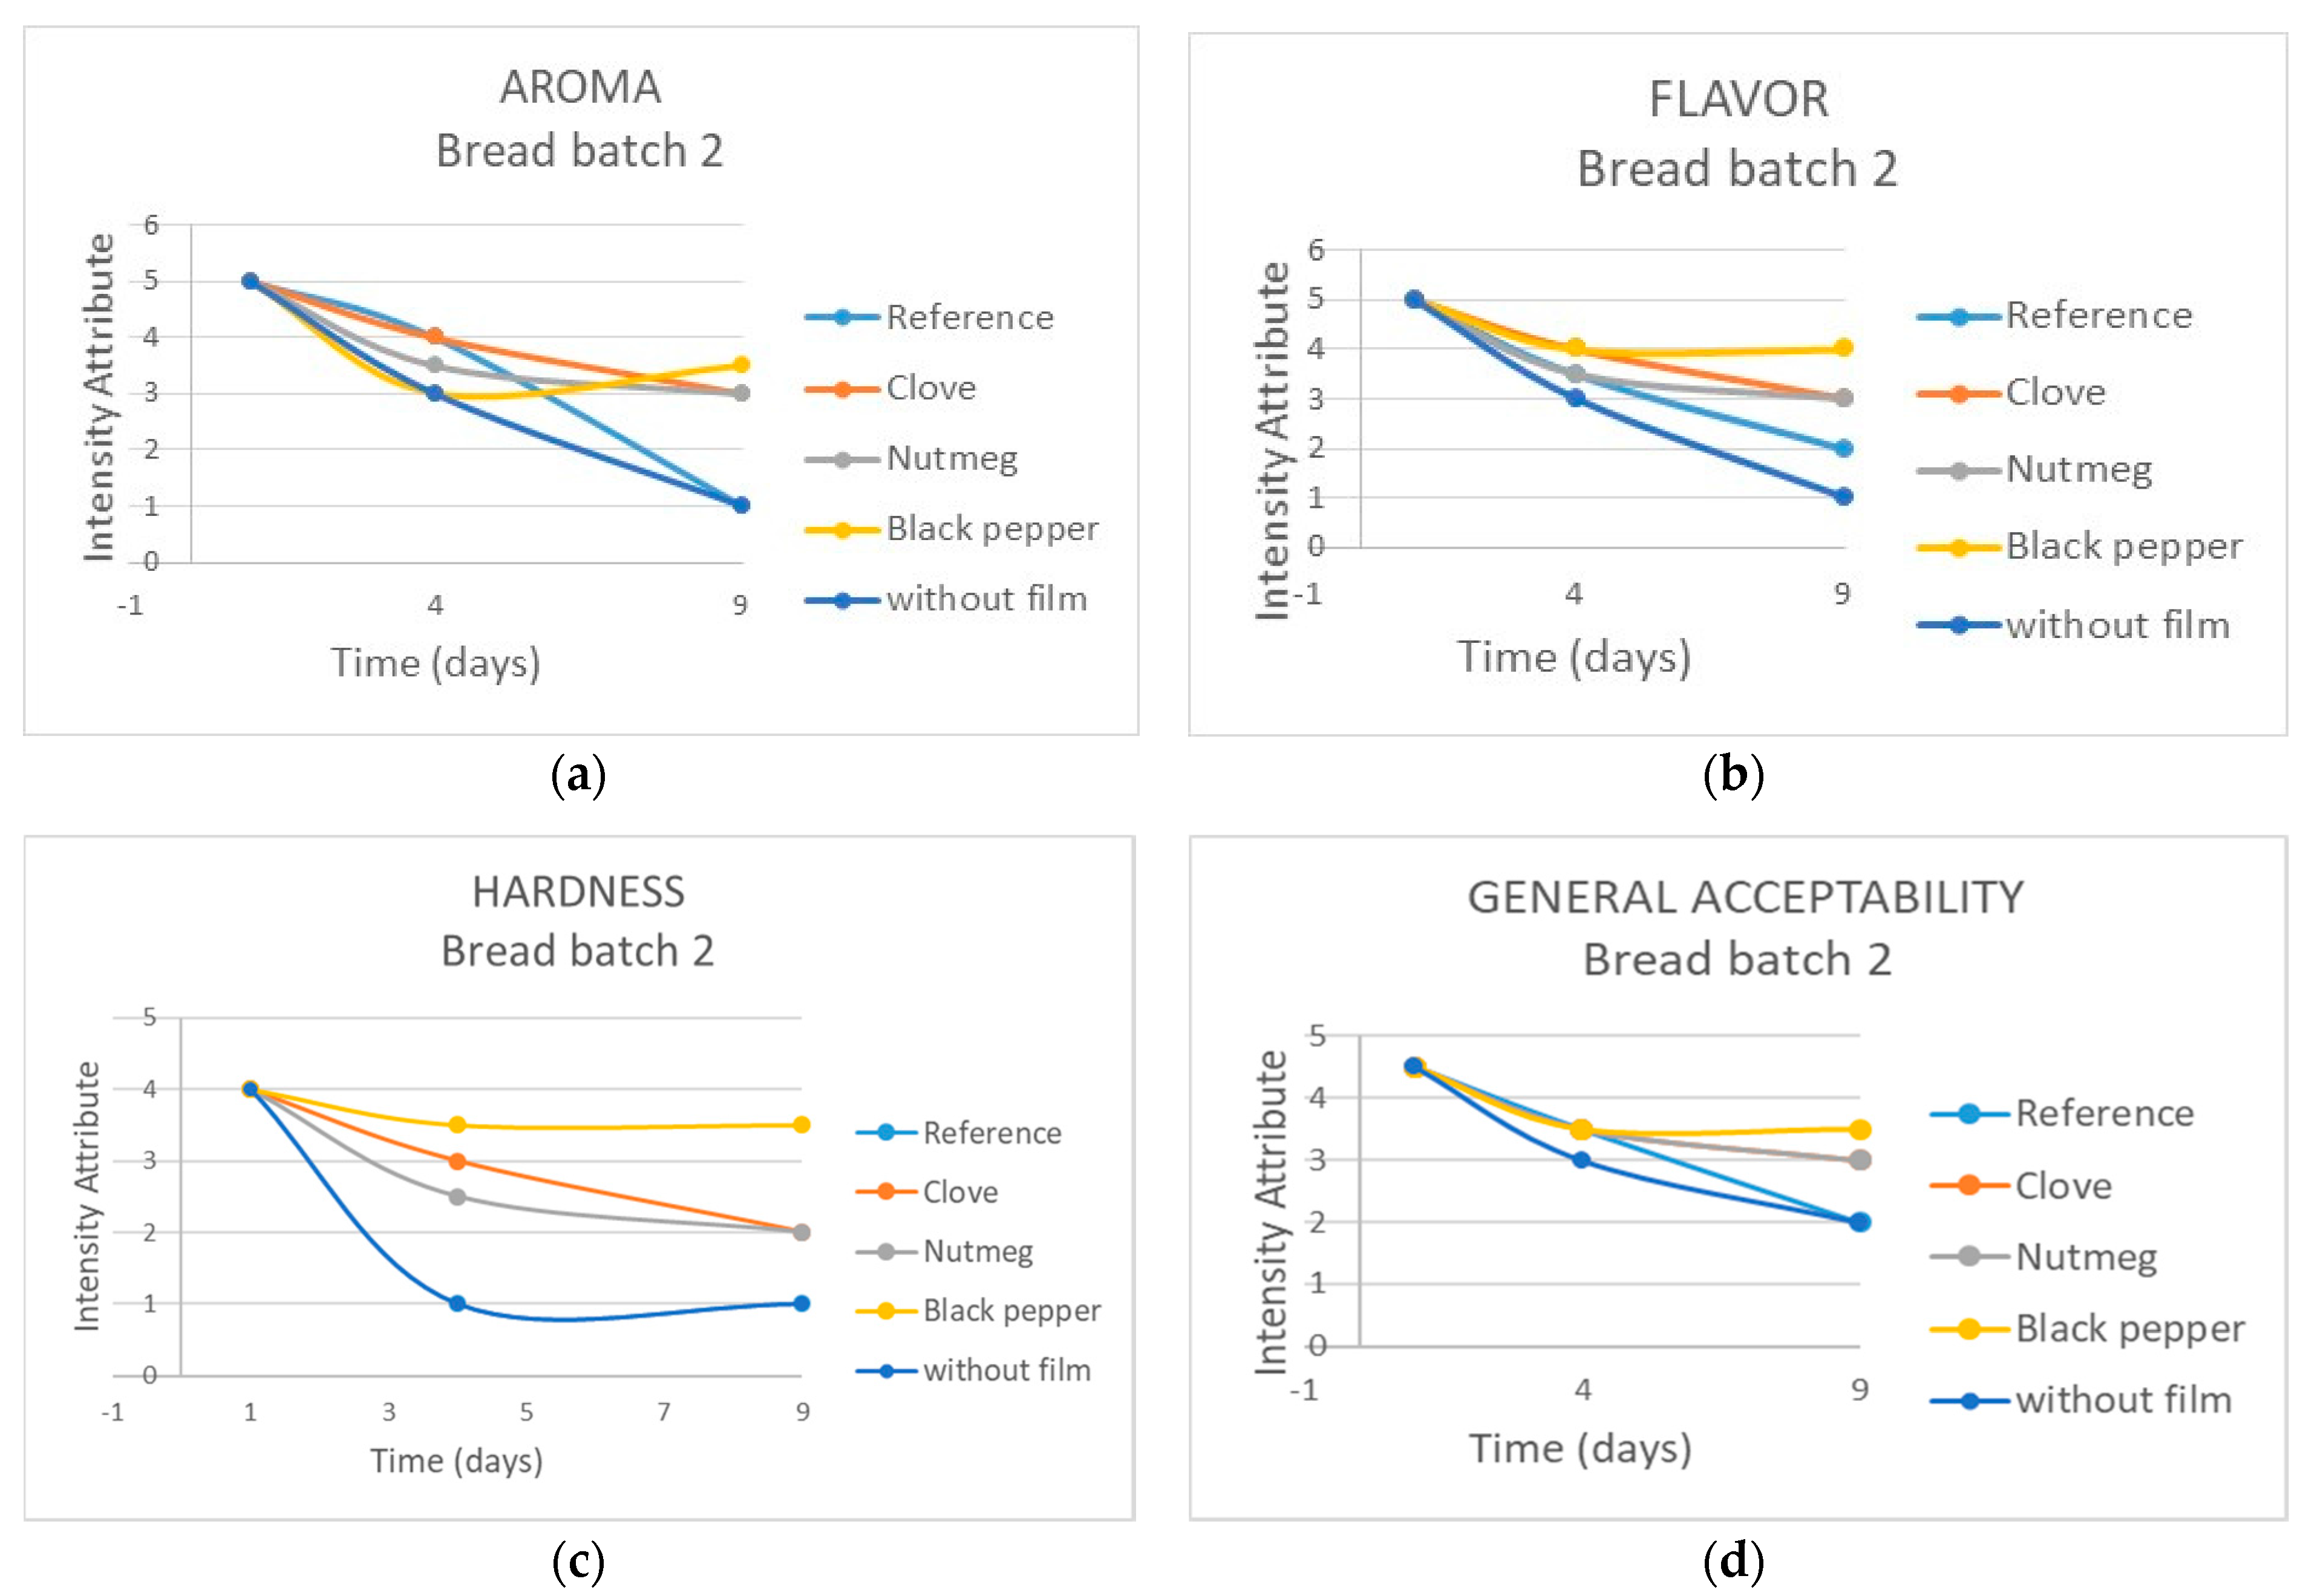
Figure 11a displays the evolution of the aroma attribute of bread in Lot 2 during storage time. Note that on day 1, the maximum score was obtained (I like it a lot) for all the bread samples. On day 4, perceptions were different where the highest score was obtained by the sample packaged in the film with clove and reference (I like it) and the lowest scores were obtained by the samples packaged in films with black pepper and without film (I neither like or dislike it). Figure 11b presents the flavor evolution of the bread packaged in biocomposite films through nine days of storage. It was observed that on day 1 the samples had the same score (I like it a lot); on day 4, the samples packaged in films with clove and black pepper were better perceived (I like it) than those packaged in films with nutmeg, reference, and without film (I neither like or dislike it). Figure 11c shows the hardness evolution of the bread packaged in biocomposite films during the storage period evaluated. On day 1, the panelists assigned the same score to all the bread samples (soft). On day 4, the samples packaged in films with black pepper were scored as soft; the samples packaged in films with nutmeg and clove were perceived as firm and the bread samples packaged in reference films and without film were perceived as very hard. The general acceptability of the bread packaged in biocomposite films is shown in Figure 11d. The sample with the highest acceptability during the storage period was that packaged in films containing black pepper, followed by those packaged in films containing clove or nutmeg. The samples with the best acceptability were those packaged in reference films and without film.
4. Conclusions
This study showed that clove, nutmeg, and black pepper oleoresins inhibited S. aureus and E. coli. Black pepper oleoresin inhibited both strains evaluated, at the lowest concentration studied (0.5 g/100 g of film-forming solution). Incorporation of the aforementioned oleoresins into biocomposite films based on gelatin and microcrystalline cellulose managed to decrease the oil and water vapor permeability values by 20 to 30%. Furthermore, the elasticity and seal strength of the polymeric matrix were increased by 5%. Upon exploring the potential use of films containing the different oleoresins, it was evident that the incorporation of black pepper oleoresin was the most effective packaging material for maintaining the physical-chemical, microbiological, and sensory quality of bread without adding preservatives during nine days of storage.
Acknowledgments
The authors thank the Administrative Department on Science, Technology, and Innovation (COLCIENCIAS) for funding the project ‘Biodegradable, intelligent, and active packaging for the preservation of beef loins “Longissimus dorsi” with code (111366945140). Gratitude is also expressed to the Interdisciplinary Science Institute at Universidad del Quindío and to the Faculty of Engineering and Administration at Universidad Nacional de Colombia (at Palmira) for the different contributions during the development of this research.
Author Contributions
Kelly J. Figueroa-Lopez, Margarita María Andrade-Mahecha and Olga Lucía Torres-Vargas conceived and designed the experiments; Kelly J. Figueroa-Lopez developed the experimental analysis and wrote the manuscript; Margarita María Andrade-Mahecha supervised the data analyses and co-wrote the manuscript. All authors reviewed the manuscript.
Conflicts of Interest
The authors declare no conflict of interest.
References
- Fowler, P.A.; Hughes, J.M.; Elias, R.M. Review Biocomposites: Technology, environmental credentials and market forces. J. Sci. Food Agric. 2006, 86, 1781–1789. [Google Scholar] [CrossRef]
- Zini, E.; Scandola, M. Green composites: An overview. Polym. Compos. 2011, 32, 1905–1915. [Google Scholar] [CrossRef]
- Yates, M.; Barlow, C. Life cycle assessments of biodegradable, commercial biopolymers—A critical review. Resour. Conserv. Recycl. 2013, 78, 54–66. [Google Scholar] [CrossRef]
- Andrade, R.; Skurtys, O.; Osorio, F. Drop impact of gelatin coating for mulated with cellulose nanofibers on banana and eggplant epicarps. LWT-Food Sci. Technol. 2015, 61, 422–429. [Google Scholar] [CrossRef]
- Clarke, D.; Molinaro, S.; Tyuftin, A.; Bolton, D.; Fanning, S.; Kerry, J.P. Incorporation of commercially-derived antimicrobials into gelatin-based films and assessment of their antimicrobial activity and impact on physical film properties. Food Control 2016, 64, 202–211. [Google Scholar] [CrossRef]
- Hosseini, S.F.; Rezaei, M.; Zandi, M.; Farahmandghavi, F. Development of bioactive fish gelatin/chitosan nanoparticles composite films with antimicrobial properties. Food Chem. 2016, 194, 1266–1274. [Google Scholar] [CrossRef] [PubMed]
- Isotton, F.; Bernardo, G.; Baldasso, C.; Rosa, L.; Zeni, M. The plasticizer effect on preparation and properties of etherified corn starchs films. Ind. Crop. Prod. 2015, 76, 717–724. [Google Scholar] [CrossRef]
- Alves, J.; dos Reis, K.; Menezes, E.; Pereira, F.; Pereira, J. Effect of cellulose nanocrystals and gelatin in corn starch plasticized films. Carbohydr. Polym. 2015, 115, 215–222. [Google Scholar] [CrossRef] [PubMed]
- Alexandre, E.M.C.; Lourenço, R.V.; Habittante, A.M.Q.B.; Moraes, I.C.F.; Sobral, P.J.A. Gelatin-based films reinforced with montmorillonite and activated with nanoemulsion of ginger essential oil for food packaging applications. Food Packag. Shelf Life 2016, 10, 87–96. [Google Scholar] [CrossRef]
- Farris, S.; Introzzi, L.; Piergiovanni, L. Evaluation of a Bio-coating as a Solution to Improve Barrier, Friction and Optical Properties of Plastic Films. Packag. Technol. Sci. 2009, 22, 69–83. [Google Scholar] [CrossRef]
- Kechichian, V.; Ditchfield, C.; Veiga-Santos, P.; Tadini, C. Natural antimicrobial ingredients incorporated in biodegradable films based on cassava starch. LWT-Food Sci. Technol. 2010, 43, 1088–1094. [Google Scholar] [CrossRef]
- Woranuch, S.; Yoksan, R.; Akashi, M. Ferulic acid-coupled chitosan: Thermal stability and utilization as an antioxidant for biodegradable active packaging film. Carbohydr. Polym. 2015, 115, 744–751. [Google Scholar] [CrossRef] [PubMed]
- Arfat, Y.A.; Ahmed, J.; Hiremath, N.; Auras, R.; Joseph, A. Thermo-mechanical, rheological, structural and antimicrobial properties of bionanocomposite films based on fish skin gelatin and silver-copper nanoparticles. Food Hydrocoll. 2017, 62, 191–202. [Google Scholar] [CrossRef]
- Lorian, V. Antibiotics in Laboratory Medicine; Williams and Wilkins: Amsterdam, The Netherlands, 1996. [Google Scholar]
- Andrade-Mahecha, M.M.; Tapia-Blácido, D.R.; Menegalli, F.C. Development and optimization of biodegradable film based on achira flour. Carbohydr. Polym. 2012, 88, 449–458. [Google Scholar] [CrossRef]
- Mondragon, G.; Peña-Rodriguez, C.; González, A.; Eceiza, A.; Arbelaiz, A. Bionanocomposites based on gelatin matrix and nanocellulose. Eur. Polym. J. 2015, 62, 1–9. [Google Scholar] [CrossRef]
- ASTM. Designation D 644-99: Standard Test Method for Moisture Content of Paper and Paperboard by Oven Drying. In Annual Book of ASTM Standards; American Society for Testing and Materials: West Conshohocken, PA, USA, 1999; p. 2. [Google Scholar]
- ASTM. Designation E 96-05: Standard Test Methods for Water Vapor Transmission of Materials. In Annual Book of ASTM Standards; American Society for Testing and Materials: West Conshohocken, PA, USA, 2005. [Google Scholar]
- ASTM. Designation D 882-02: Standard test method for tensile properties of thin plastic sheeting. In Annual Book of ASTM Standards; American Society for Testing and Materials: West Conshohocken, PA, USA, 2002. [Google Scholar]
- Yan, Q.; Hou, H.; Guo, P.; Dong, H. Effects of extrusion and glycerol content on properties of oxidized and acetylated corn starch-based films. Carbohydr. Polym. 2012, 87, 707–712. [Google Scholar] [CrossRef]
- ASTM. Designation F88M-15: Standard Test Method for Seal Strength of Flexible Barrier Materials. In Annual Book of ASTM Standards; American Society for Testing and Materials: West Conshohocken, PA, USA, 2015; p. 11. [Google Scholar]
- Farhan, A.; Hani, N.M. Characterization of edible packaging films based on semi-refined kappa-carrageenan plasticized with glycerol and sorbitol. Food Hydrocoll. 2017, 64, 48–58. [Google Scholar] [CrossRef]
- Leceta, I.; Peñalba, M.; Arana, P.; Guerrero, P.; de la Caba, K. Ageing of chitosan films: Effect of storage time on structure and optical, barrier and mechanical properties. Eur. Polym. J. 2015, 66, 170–179. [Google Scholar] [CrossRef]
- ICONTEC. Pan. Requisitos Generales. Norma Técnica Colombiana 1363; ICONTEC: Bogotá, Colombia, 2005; p. 11. [Google Scholar]
- ICONTEC. Industrias Alimentarias. Harina de Trigo. Métodos de ensayo. Normas Técnicas Colombianas 282; ICONTEC: Bogotá, Colombia, 1986; p. 28. [Google Scholar]
- ICONTEC. Microbiología de Alimentos y de Alimentos Para Animales. Método Horizontal Para el Recuento de Coliformes o Escherichia coli o Ambos. Técnica de Recuento de Colonias Utilizando Medios Fluorogénicos o Cromogénicos. Normas Tecnicas Colombianas 4458; ICONTEC: Bogotá, Colombia, 2007; p. 12. [Google Scholar]
- ICONTEC. Microbiología de Alimentos y Alimentos Para Animales. Método Horizontal Para el Recuento de Estafilococos Coagulasa Positiva (Staphylococcus aureus y otras Especies). Normas Tecnicas Colombianas 4779; ICONTEC: Bogotá, Colombia, 2007; p. 21. [Google Scholar]
- ICONTEC. Microbiología. Método Horizontal Para el Recuento de Bacillus Cereus. Técnica de Recuento de Colonias. Normas Tecnicas Colombianas 4679; ICONTEC: Bogotá, Colombia, 2006; p. 27. [Google Scholar]
- ICONTEC. Microbiología de Alimentos y de Alimentos Para Animales. Método Horizontal Para la Detección de Salmonella spp. Normas Tecnicas Colombianas 4574; ICONTEC: Bogotá, Colombia, 2007; p. 26. [Google Scholar]
- ICONTEC. Microbiología. Guia General Para el Recuento de Mohos y Levaduras. Técnica de Recuento de Colonias a 25 °C. Normas Tecnicas Colombianas 4132; ICONTEC: Bogotá, Colombia, 1997; p. 12. [Google Scholar]
- ICONTEC. Análisis sensorial. Metodología. Guía General. Normas Tecnicas Colombianas 3925; ICONTEC: Bogotá, Colombia, 1996; p. 25. [Google Scholar]
- Jayabrata, M.; Ray, S.K. Removal of Cu (II) ion from water using sugar cane bagasse cellulose and gelatin based composite hydrogels. Int. J. Biol. Macromol. 2017, 97, 238–248. [Google Scholar] [CrossRef]
- Li, Z.-R.; Wang, B.; Chi, C.-F.; Zhang, Q.-H.; Gong, Y.-D.; Tang, J.-J.; Luo, H.-Y.; Ding, G.-F. Isolation and characterization of acid soluble collagens and pepsin soluble collagens from the skin and bone of Spanish mackerel (Scomberomorous niphonius). Food Hydrocoll. 2013, 31, 103–113. [Google Scholar] [CrossRef]
- Yuan, Y.-Y.; Fan, D.-D. Coordination study of recombinant human-like collagen and zinc (II). Spectrochim. Acta Part A 2011, 81, 412–416. [Google Scholar] [CrossRef]
- Nada, A.-A.M.A.; El Kady, M.Y.; El Sayed, E.S.A.; Amine, F.H. Preparation and characterizacion of microcrystalline cellulose (MCC). BioResources 2009, 4, 1359–1371. [Google Scholar]
- García-García, L.; Bordallo-López, E.; Dopico-Ramírez, D.; Cordero-Fernández, D. Obtención de celulosa microcristalina a partir del bagazo de la caña de azúcar. ICIDCA Sobre los Derivados de la Caña de Azúcar 2013, 47, 57–63. [Google Scholar]
- Trache, D.; Hussin, M.H.; Chuin, C.T.H.; Sabar, S.; Fazita, M.R.N.; Taiwo, O.F.A.; Hassan, T.M.; Haafiz, M.K.M. Microcrystalline cellulose: Isolation, characterization and bio-composites application—A review. Int. J. Biol. Macromol. 2016, 93, 789–804. [Google Scholar] [CrossRef] [PubMed]
- Shankar, S.; Rhim, J.-W. Preparation of nanocellulose from micro-crystalline cellulose: The effect on the performance and properties of agar-based composite films. Carbohydr. Polym. 2016, 135, 18–26. [Google Scholar] [CrossRef] [PubMed]
- Zhang, M.-F.; Qin, Y.-H.; Ma, J.-Y.; Yang, L.; Wu, Z.-K.; Wang, T.-L.; Wang, W.-G.; Wang, C.-W. Depolymerization of microcrystalline cellulose by the combination of ultrasound and Fenton reagent. Ultrason. Sonochem. 2016, 31, 404–408. [Google Scholar] [CrossRef] [PubMed]
- Kim, U.-J.; Eom, S.H.; Wada, M. Thermal decomposition of native cellulose: Influence on crystallite size. Polym. Degrad. Stab. 2010, 95, 778–781. [Google Scholar] [CrossRef]
- Trache, D.; Donnot, A.; Khimeche, K.; Benelmir, R.; Brosse, N. Physico-chemical properties and thermal stability of microcrystalline cellulose isolated from Alfa fibres. Carbohydr. Polym. 2014, 104, 223–230. [Google Scholar] [CrossRef] [PubMed]
- Rodianawati, I.; Hastuti, P.; Nur Cahyanto, M. Nutmeg’s (Myristica fragrans Houtt) Oleoresin: Effect of Heating to Chemical Compositions and Antifungal Properties. Procedia Food Sci. 2015, 3, 244–254. [Google Scholar] [CrossRef]
- Chaieb, I.; Hajlaoui, H.; Zmantar, T.; Kahla-Nakbi, A.; Rouabhia, M.; Mahdouani, K.; Bakhrouf, A. The chemical composition and biological activity of clove essential oil, Eugenia caryophyllata (Syzigium aromaticum L. Myrtaceae): A short review. Phytother. Res. 2007, 21, 501–506. [Google Scholar] [CrossRef] [PubMed]
- Dutta, S.; Bhattacharjee, P. Enzyme-assisted supercritical carbon dioxide extraction of black pepper oleoresin for enhanced yield of piperine-rich extract. J. Biosci. Bioeng. 2015, 120, 17–23. [Google Scholar] [CrossRef] [PubMed]
- Ojagh, S.M.; Rezaei, M.; Razavi, S.H.; Hosseini, S.M.H. Development and evaluation of a novel biodegradable film made from chitosan and cinnamon essential oil with low affinity toward water. Food Chem. 2010, 122, 161–166. [Google Scholar] [CrossRef]
- Acosta, S.; Chiralt, A.; Santamarina, P.; Rosello, J.; Gonzalez-Martínez, C.; Chafer, M. Antifungal films based on starch-gelatin blend, containing essential oils. Food Hydrocoll. 2016, 61, 233–240. [Google Scholar] [CrossRef]
- Pérez-Córdoba, L.J.; Norton, I.T.; Batchelor, H.K.; Gkatzionis, K.; Spyropoulos, F.; Sobral, P.J.A. Physico-chemical, antimicrobial and antioxidant properties of gelatin chitosan based films loaded with nanoemulsions encapsulating active compounds. Food Hydrocoll. 2017. [Google Scholar] [CrossRef]
- Tongnuanchan, P.; Benjakul, S.; Prodpran, T. Structural, morphological and thermal behaviour characterisations of fi sh gelatin fi lm incorporated with basil and citronella essential oils as affected by surfactants. Food Hydrocoll. 2014, 41, 33–43. [Google Scholar] [CrossRef]
- Fabra, M.J.; Talens, P.; Chiralt, A. Tensile properties and water vapor permeability of sodium caseinate films containing oleic acid–beeswax mixtures. J. Food Eng. 2008, 85, 393–400. [Google Scholar] [CrossRef]
- Tongnuanchan, P.; Benjakul, S.; Prodpran, T. Properties and antioxidant activity of fish skin gelatin film incorporated with citrus essential oils. Food Chem. 2012, 134, 1571–1579. [Google Scholar] [CrossRef] [PubMed]
- Hu, G.; Chen, J.; Gao, J. Preparation and characteristics of oxidized potato starch films. Carbohydr. Polym. 2009, 76, 291–298. [Google Scholar] [CrossRef]
- Valenzuela, C.; Abugoch, L.; Tapia, C. Quinoa protein-chitosan-sunflower oil edible film: Mechanical, barrier and structural properties. LWT-Food Sci. Technol. 2013, 50, 531–537. [Google Scholar] [CrossRef]
Figure 1.
Structural and thermal characterization of type B gelatin. (a) Particle size distribution; (b) X-ray diffractogram; (c) FTIR spectrum; and (d) TGA thermogram.
Figure 1.
Structural and thermal characterization of type B gelatin. (a) Particle size distribution; (b) X-ray diffractogram; (c) FTIR spectrum; and (d) TGA thermogram.
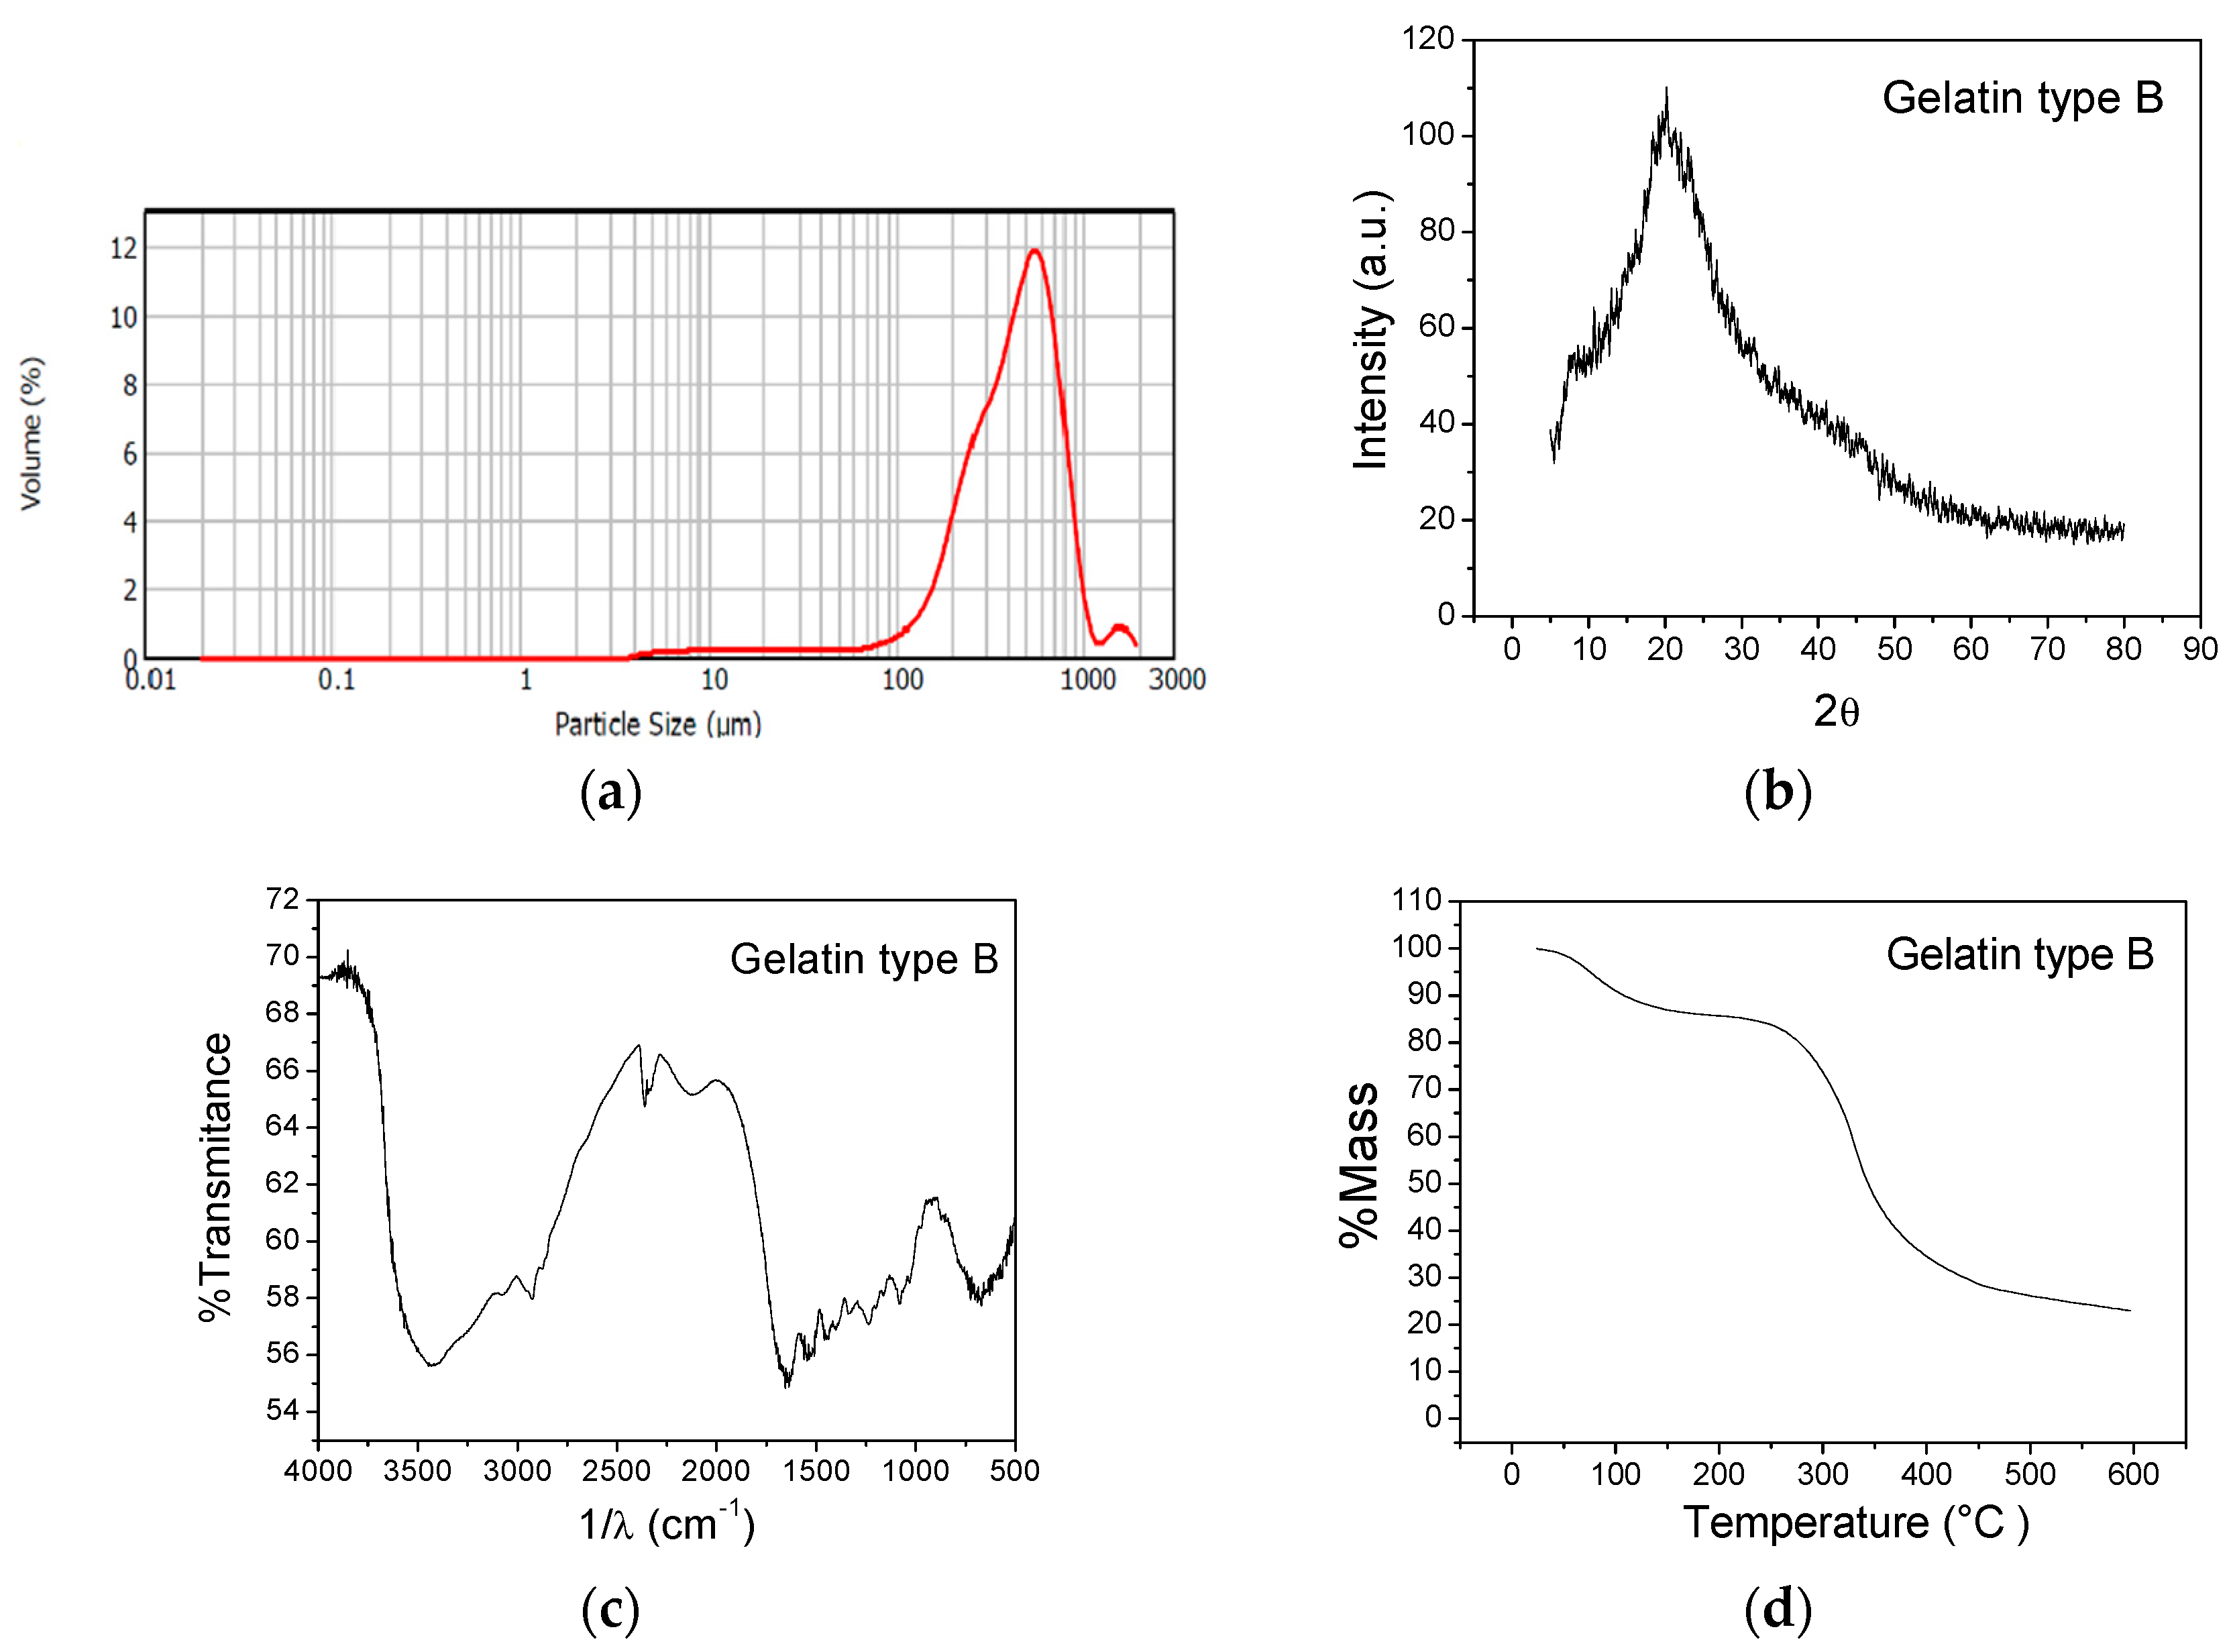
Figure 2.
Structural and thermal characterization of MCC. (a) Particle size distribution; (b) X-ray diffractogram; (c) FTIR spectrum; and (d) TGA thermogram.
Figure 2.
Structural and thermal characterization of MCC. (a) Particle size distribution; (b) X-ray diffractogram; (c) FTIR spectrum; and (d) TGA thermogram.

Figure 3.
Humidity content of biocomposite films with oleoresins and reference before and after conditioning. Different letters in the same column indicate significant differences (p < 0.05).
Figure 3.
Humidity content of biocomposite films with oleoresins and reference before and after conditioning. Different letters in the same column indicate significant differences (p < 0.05).

Figure 4.
Water vapor permeability of biocomposite films containing oleoresins and reference (without oleoresin). Different letters in the same column indicate significant differences (p < 0.05).
Figure 4.
Water vapor permeability of biocomposite films containing oleoresins and reference (without oleoresin). Different letters in the same column indicate significant differences (p < 0.05).

Figure 5.
Mechanical properties of biocomposite films with oleoresins and reference. Different letters in the same column indicate significant differences (p < 0.05).
Figure 5.
Mechanical properties of biocomposite films with oleoresins and reference. Different letters in the same column indicate significant differences (p < 0.05).

Figure 6.
Oil permeability of biocomposite films with oleoresins and reference. Different letters in the same column indicate significant differences (p < 0.05).
Figure 6.
Oil permeability of biocomposite films with oleoresins and reference. Different letters in the same column indicate significant differences (p < 0.05).

Figure 7.
Light transmission of biocomposite films with clove, nutmeg, and black pepper oleoresins and reference (without oleoresin).
Figure 7.
Light transmission of biocomposite films with clove, nutmeg, and black pepper oleoresins and reference (without oleoresin).

Figure 8.
Seal strength of biocomposite films with oleoresins and reference. Different letters in the same column indicate significant differences (p < 0.05).
Figure 8.
Seal strength of biocomposite films with oleoresins and reference. Different letters in the same column indicate significant differences (p < 0.05).
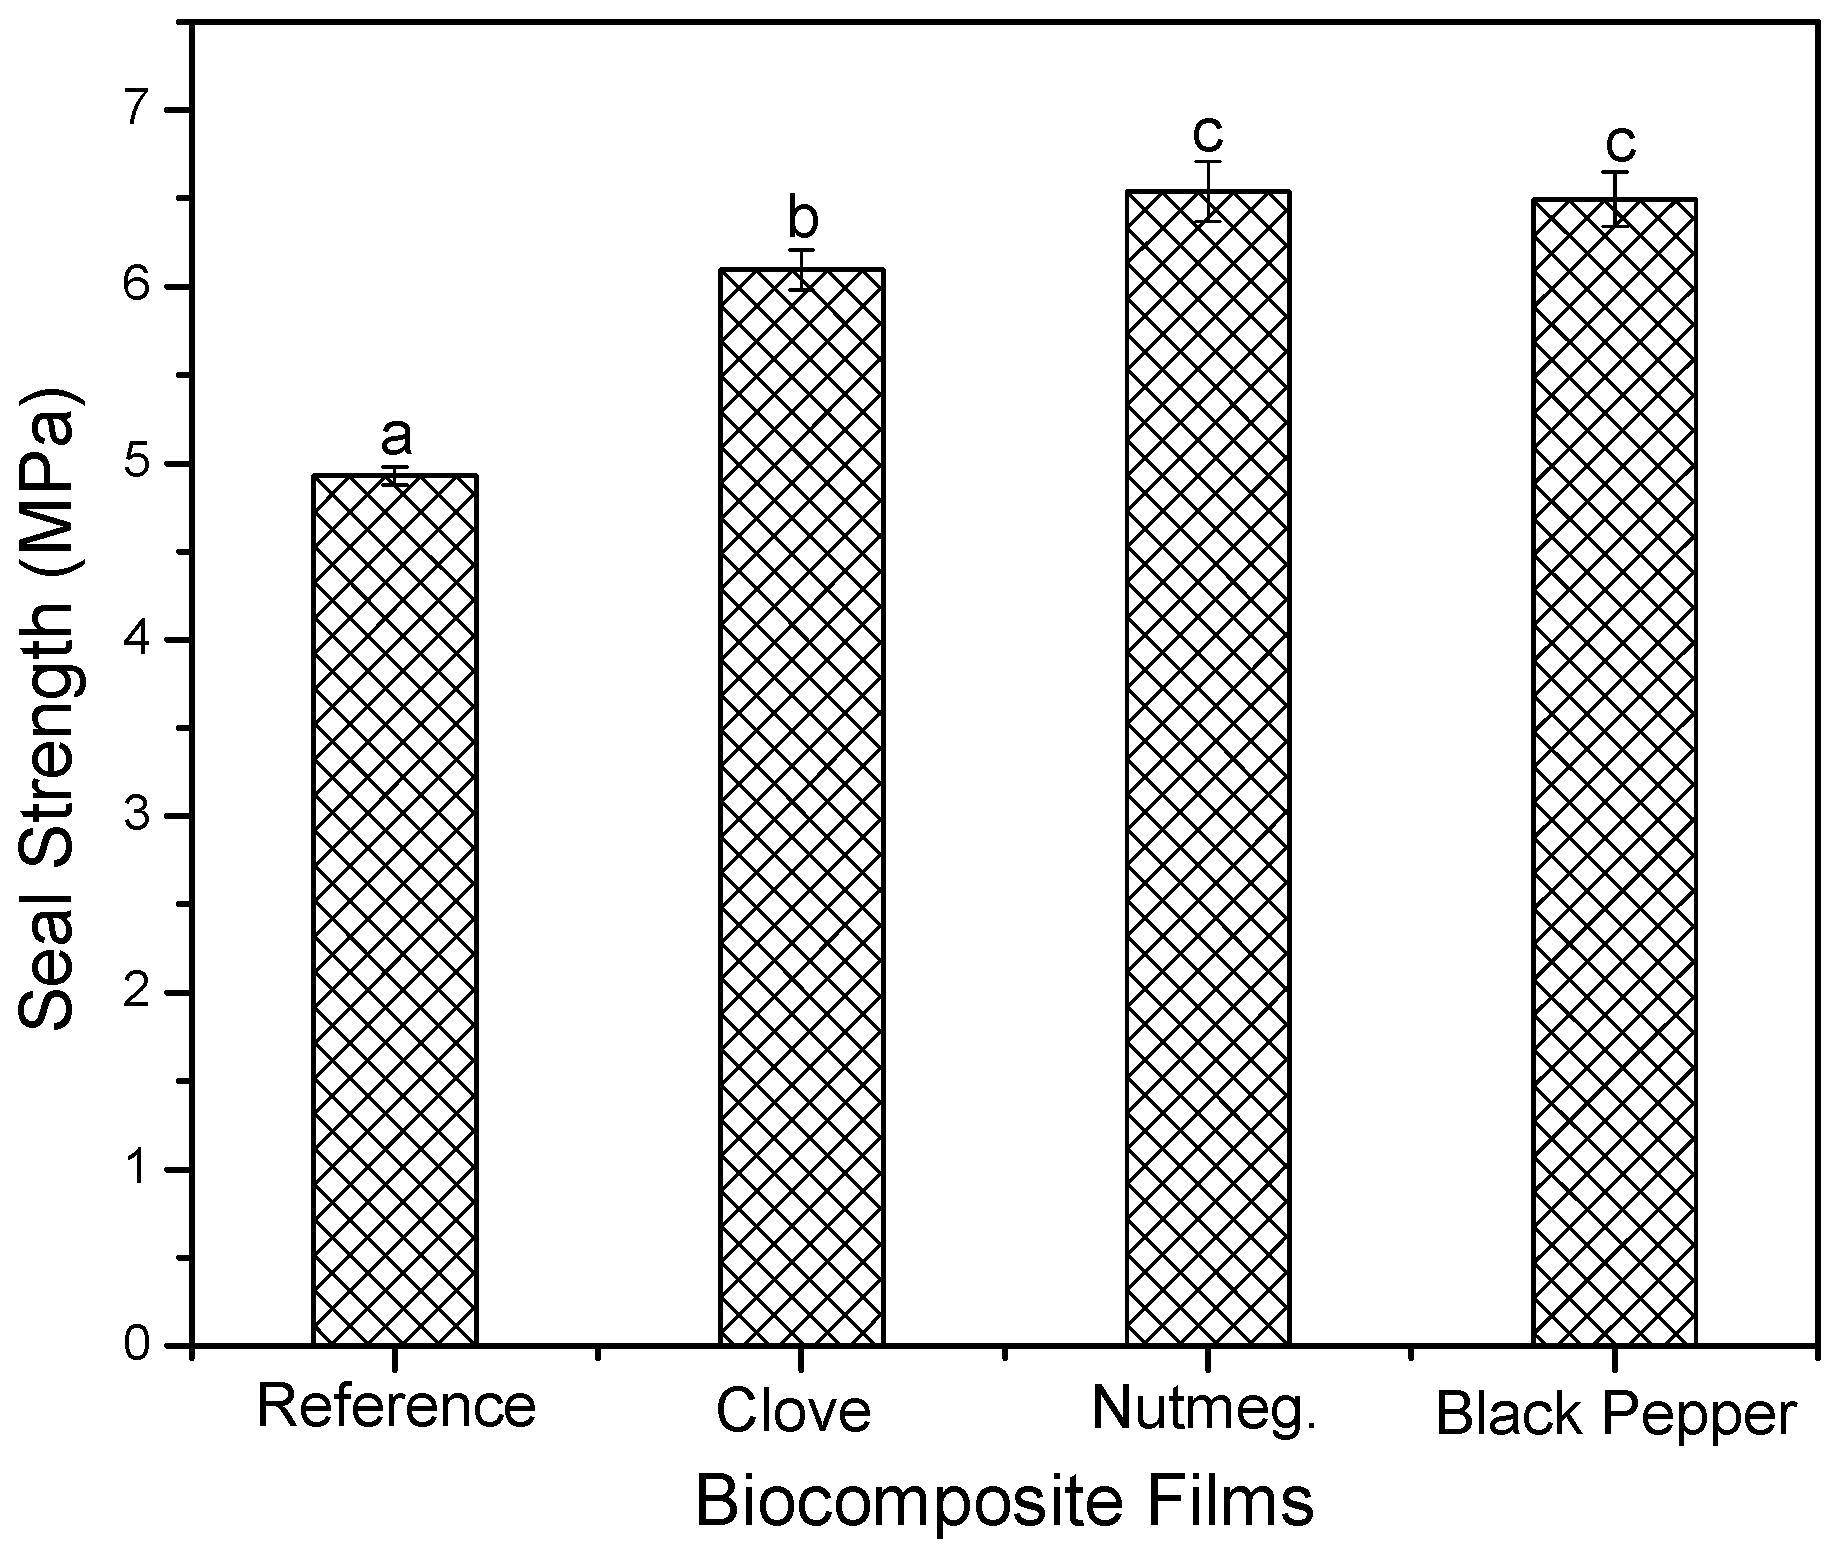
Figure 9.
Diffractogram biocomposite films (a) Reference (without oleoresin); (b) with clove oleoresin; (c) with nutmeg oleoresin; (d) with black pepper oleoresin.
Figure 9.
Diffractogram biocomposite films (a) Reference (without oleoresin); (b) with clove oleoresin; (c) with nutmeg oleoresin; (d) with black pepper oleoresin.

Figure 10.
FTIR spectra of biocomposite films. (a) Reference (without oleoresin); (b) with clove oleoresin; (c) with nutmeg oleoresin and (d) with black pepper oleoresin.
Figure 10.
FTIR spectra of biocomposite films. (a) Reference (without oleoresin); (b) with clove oleoresin; (c) with nutmeg oleoresin and (d) with black pepper oleoresin.

Figure 11.
Evolution of sensory attributes during nine days of storage (25 °C and 75% RH) of bread packaged in biocomposite films. (a) Aroma; (b) flavor; (c) hardness; (d) general acceptability.
Figure 11.
Evolution of sensory attributes during nine days of storage (25 °C and 75% RH) of bread packaged in biocomposite films. (a) Aroma; (b) flavor; (c) hardness; (d) general acceptability.


Table 1.
CIELab color parameters obtained for biocomposite films.
| Biocomposite Films | Color Parameters | |||
|---|---|---|---|---|
| L * | a * | b * | ΔE * | |
| Reference | 92.09 ± 0.094 a | −1.46 ± 0.029 a | 4.73 ± 0.33 a | --- |
| Clove | 89.59 ± 0.22 b | −1.16 ± 0.039 a | 8.65 ± 0.47 b | 4.66 ± 0.51 a |
| Nutmeg | 91.30 ± 0.099 a | −1.42 ± 0.014 a | 5.44 ± 0.12 a | 1.05 ± 0.15 b |
| Black pepper | 90.45 ± 0.77 b | −1.91 ± 0.10 a | 6.73 ± 0.79 c | 2.65 ± 0.99 c |
Reported values correspond to the mean ± standard deviation. Different letters in the same column indicate significant differences (p < 0.05). ΔE * calculated on the basis of the L *, a *, b * values of the reference film.
Table 2.
Physical-chemical characteristics of bread packaged in biocomposite films and stored during nine days at 25 °C and 75% RH.
Table 2.
Physical-chemical characteristics of bread packaged in biocomposite films and stored during nine days at 25 °C and 75% RH.
| Bread Packed in Biocomposite Films | Humidity | pH | aw | % Weight loss | |||||||||||
|---|---|---|---|---|---|---|---|---|---|---|---|---|---|---|---|
| Day 1 | Day 3 | Day 5 | Day 9 | Day 1 | Day 3 | Day 5 | Day 9 | Day 1 | Day 3 | Day 5 | Day 9 | Day 3 | Day 5 | Day 9 | |
| Reference | 26.34 ± 0.79 a | 17.94 ± 0.55 a | 9.61 ± 0.29 a | 7.11 ± 0.2 a | 5.73 ± 0.03 a | 5.71 ± 0.02 a | 5.67 ± 0.02 a | 5.64 ± 0.02 a | 0.84 ± 0.006 a | 0.75 ± 0.006 a | 0.58 ± 0.01 a | 0.44 ± 0.01 a | 45 ± 1.4 a | 54 ± 1.5 a | 34 ± 1.5 a |
| Clove | 25.69 ± 0.95 b | 21.09 ± 0.21 b | 11.61 ± 0.9 b | 8.86 ± 0.39 b | 5.73 ± 0.03 a | 5.65 ± 0.02 a | 5.63 ± 0.02 a | 5.59 ± 0.01 a | 0.84 ± 0.006 a | 0.79 ± 0.005 a | 0.63 ± 0 a | 0.54 ± 0.006 b | 27 ± 1.3 b | 29 ± 1.5 b | 17 ± 0.9 b |
| Nutmeg | 26.00 ± 0.55 a | 21.05 ± 0.53 b | 12.47 ± 0.9 c | 8.55 ± 0.59 b | 5.73 ± 0.03 a | 5.63 ± 0.02 a | 5.61 ± 0.02 a | 5.57 ± 0.02 a | 0.84 ± 0.006 a | 0.79 ± 0.01 a | 0.67 ± 0.047 a | 0.51 ± 0.01 a | 28 ± 1.5 b | 32 ± 1.5 b | 23 ± 1.7 b |
| Black pepper | 25.33 ± 0.49 b | 22.21 ± 0.85 c | 11.37 ± 0.67 b | 9.77 ± 0.45 c | 5.73 ± 0.03 a | 5.64 ± 0.02 a | 5.62 ± 0.02 a | 5.57 ± 0.02 a | 0.84 ± 0.006 a | 0.8 ± 0.01 a | 0.67 ± 0.01 a | 0.59 ± 0.006 b | 20 ± 0.8 c | 17 ± 0.9 c | 13 ± 1.3 c |
| Without film | 25.59 ± 0.3 b | 8.45 ± 0.69 d | 5.87 ± 0.25 d | 4.71 ± 0.81 d | 5.73 ± 0.03 a | 5.59 ± 0.02 a | 5.56 ± 0.01 a | 5.55 ± 0.04 a | 0.84 ± 0.006 a | 0.52 ± 0.01 b | 0.52 ± 0.006 b | 0.4 ± 0.01 c | 69 ± 1.8 d | 41 ± 1.5 d | 24 ± 1.8 b |
Reported values correspond to the mean ± standard deviation. Different letters in the same column indicate significant differences (p < 0.05).
Table 3.
Microbiological analysis of the bread packaged in biocomposite films and stored during nine days at 25 °C and 75% RH.
Table 3.
Microbiological analysis of the bread packaged in biocomposite films and stored during nine days at 25 °C and 75% RH.
| Bread Packed in Biocomposite Films | Count S. aureus (CFU/g) * | Count Molds and Yeasts (CFU/g) * | ||||
|---|---|---|---|---|---|---|
| Day 1 | Day 4 | Day 9 | Day 1 | Day 4 | Day 9 | |
| Reference | <10 | <10 | 50 | <10 | 100 | 460 |
| Clove | <10 | <10 | <10 | <10 | 10 | 50 |
| Nutmeg | <10 | <10 | <10 | <10 | 10 | 40 |
| Black pepper | <10 | <10 | <10 | <10 | <10 | 20 |
| Without film | <10 | <10 | 440 | <10 | 80 | 2440 |
* Colony-forming units per gram of sample.
© 2018 by the authors. Licensee MDPI, Basel, Switzerland. This article is an open access article distributed under the terms and conditions of the Creative Commons Attribution (CC BY) license (http://creativecommons.org/licenses/by/4.0/).
Share and Cite
MDPI and ACS Style
Figueroa-Lopez, K.J.; Andrade-Mahecha, M.M.; Torres-Vargas, O.L. Development of Antimicrobial Biocomposite Films to Preserve the Quality of Bread. Molecules 2018, 23, 212. https://doi.org/10.3390/molecules23010212
AMA Style
Figueroa-Lopez KJ, Andrade-Mahecha MM, Torres-Vargas OL. Development of Antimicrobial Biocomposite Films to Preserve the Quality of Bread. Molecules. 2018; 23(1):212. https://doi.org/10.3390/molecules23010212
Chicago/Turabian StyleFigueroa-Lopez, Kelly J., Margarita María Andrade-Mahecha, and Olga Lucía Torres-Vargas. 2018. "Development of Antimicrobial Biocomposite Films to Preserve the Quality of Bread" Molecules 23, no. 1: 212. https://doi.org/10.3390/molecules23010212