
In Silico Exploration of 1,7-Diazacarbazole Analogs as Checkpoint Kinase 1 Inhibitors by Using 3D QSAR, Molecular Docking Study, and Molecular Dynamics Simulations


Abstract
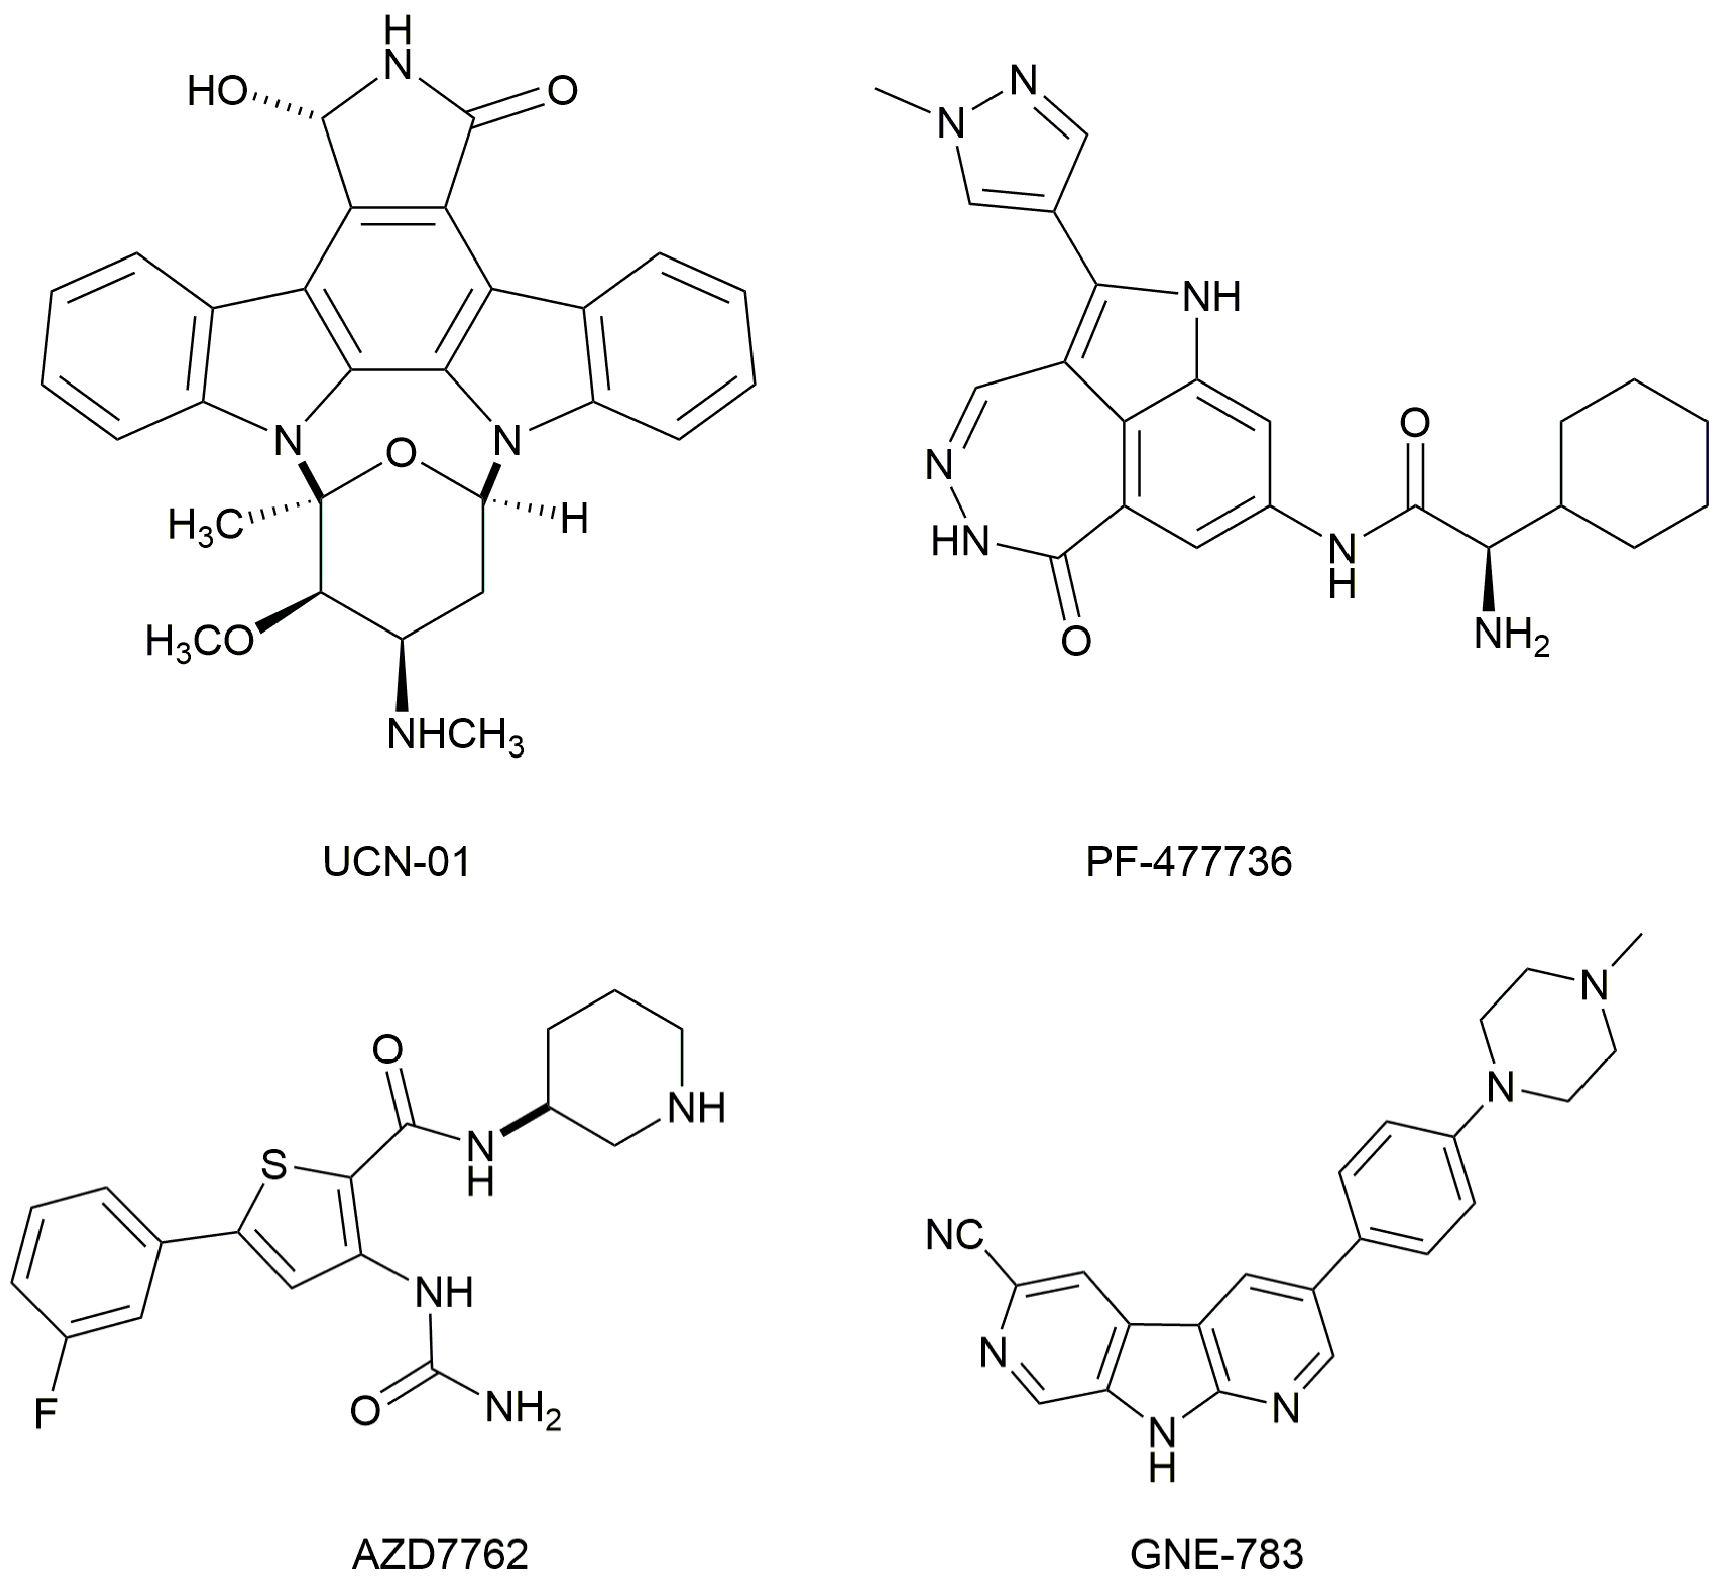
:1. Introduction
2. Materials and Methods
2.1. Dataset
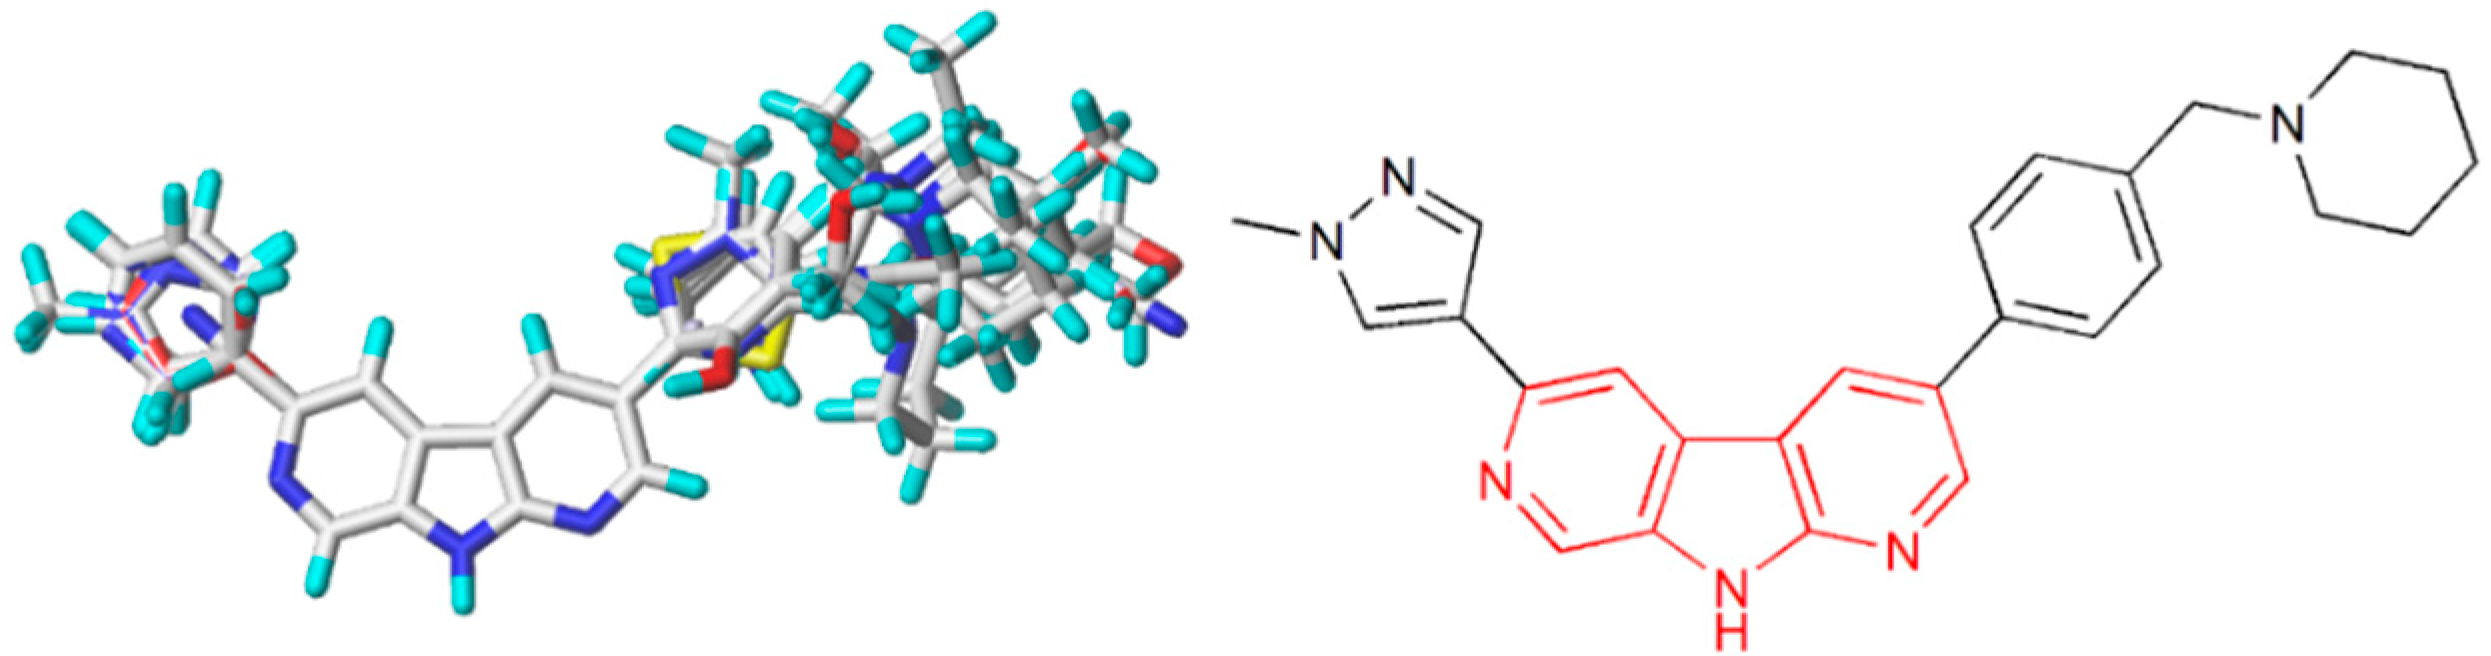
2.2. Energy Minimization and Modeling Alignment
2.3. Generation of the QSAR Model
2.4. Partial Least Squares (PLS) Analysis and Validation of the QSAR Models
2.5. Molecular Docking Simulations
3. Results and Discussions
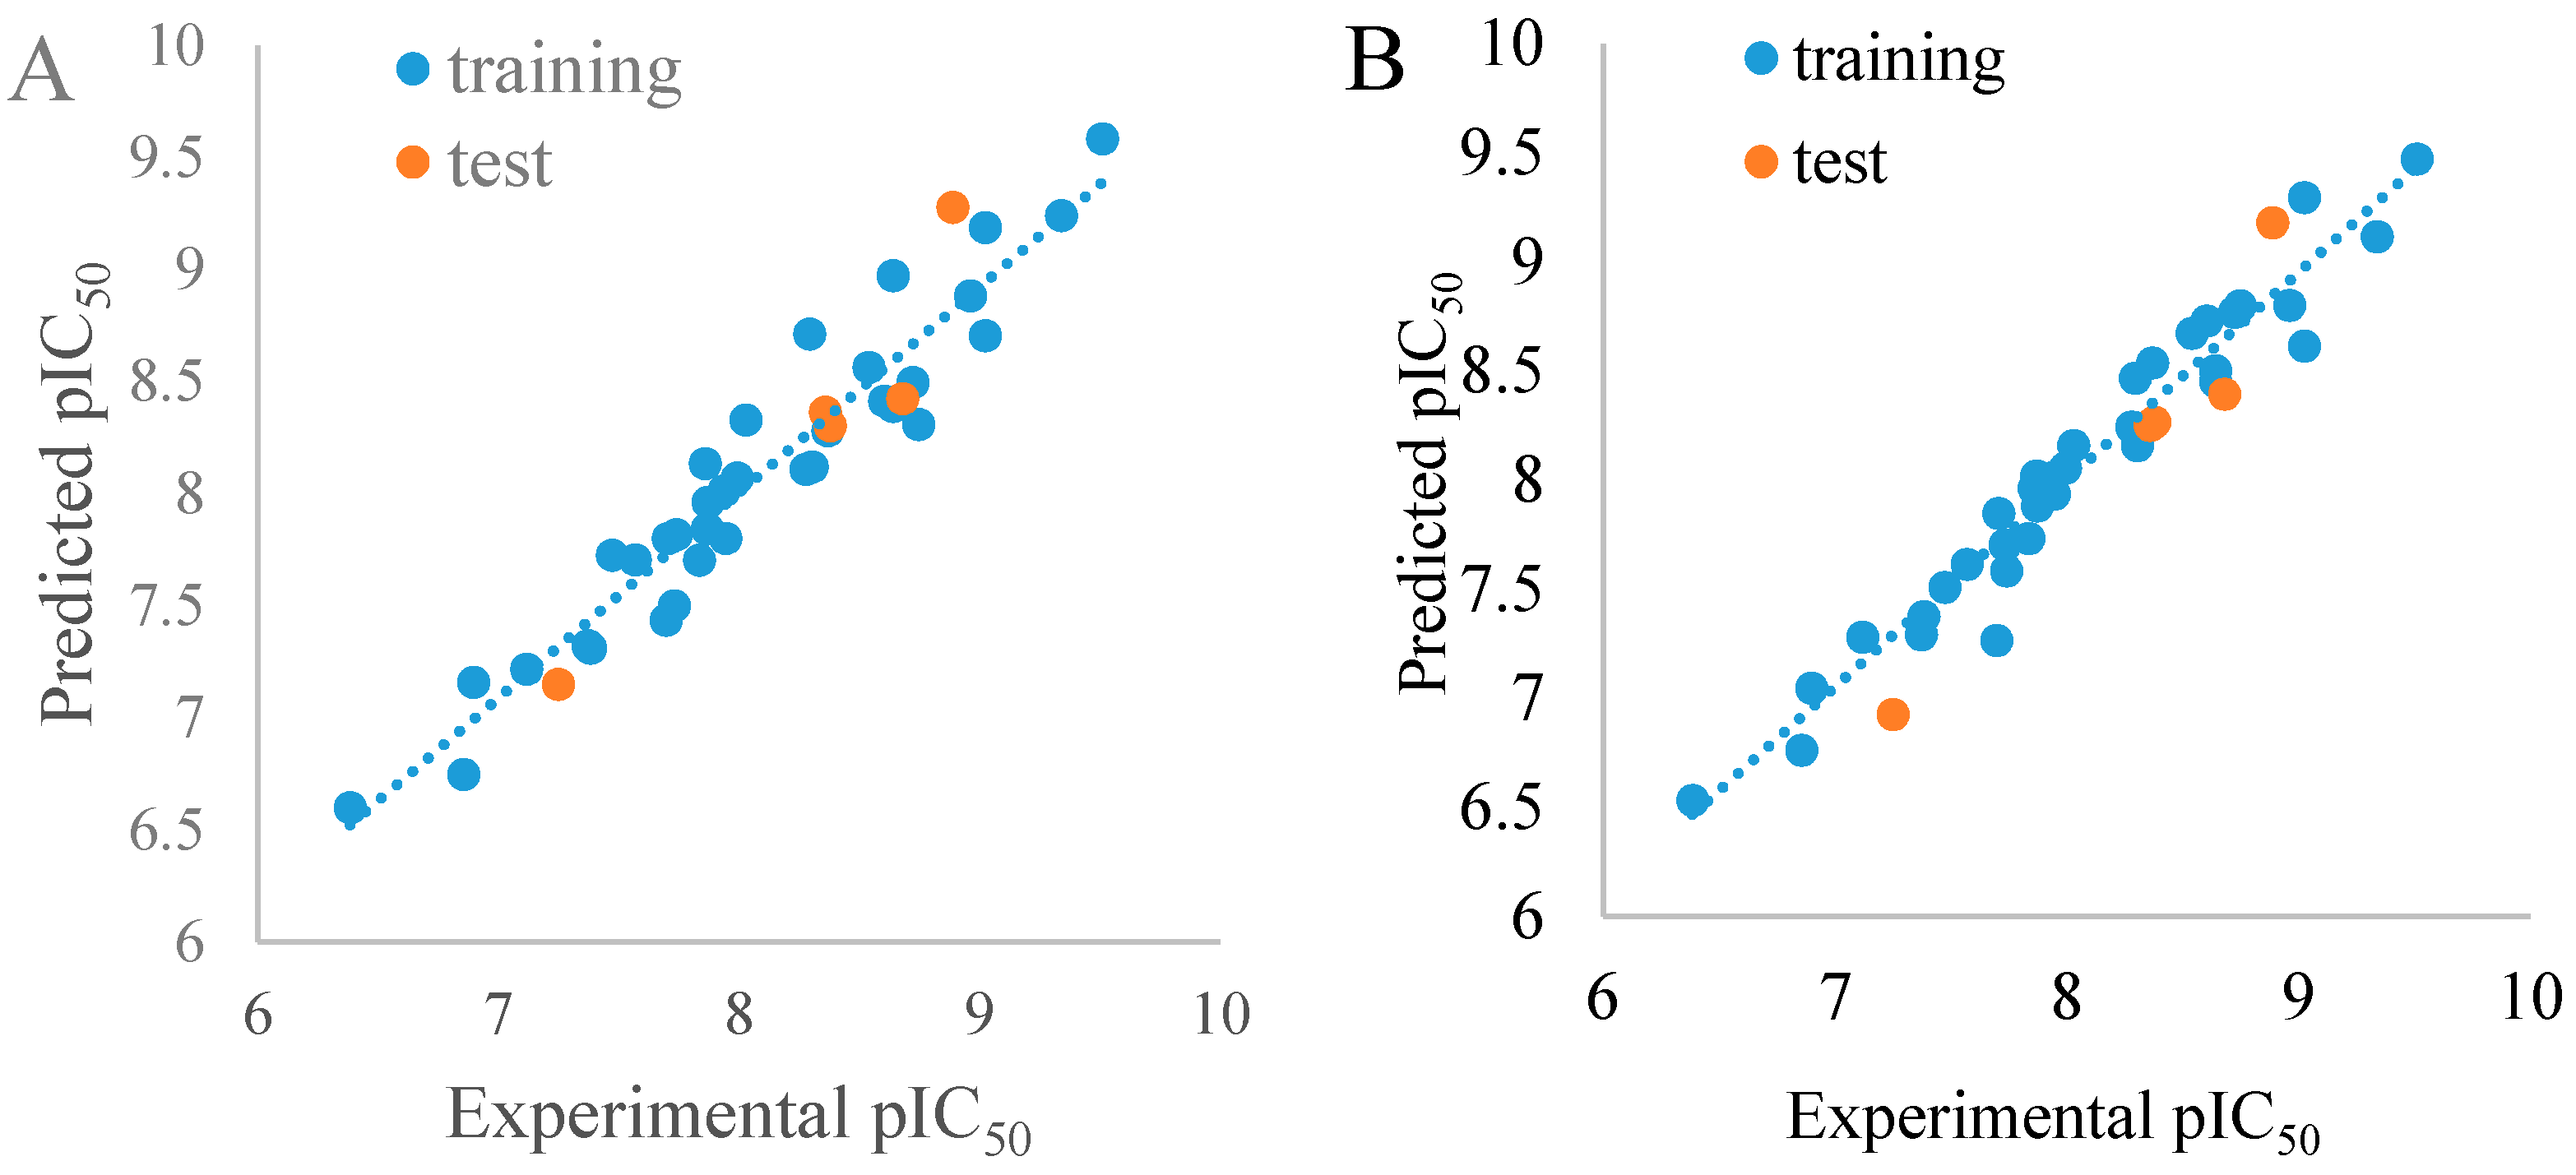
3.1. Statistical Analysis and Validation
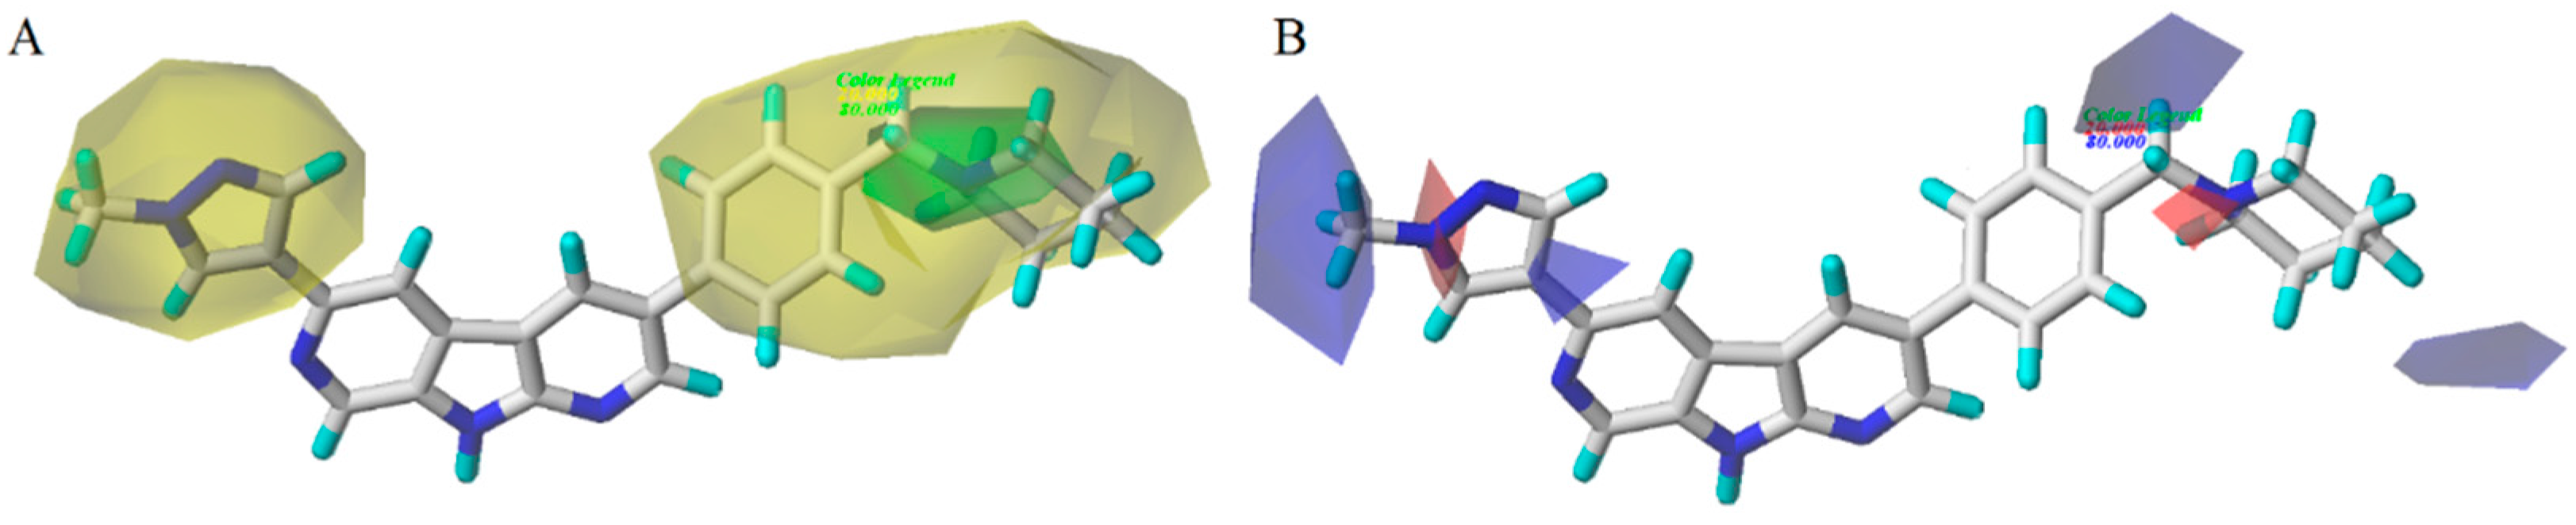
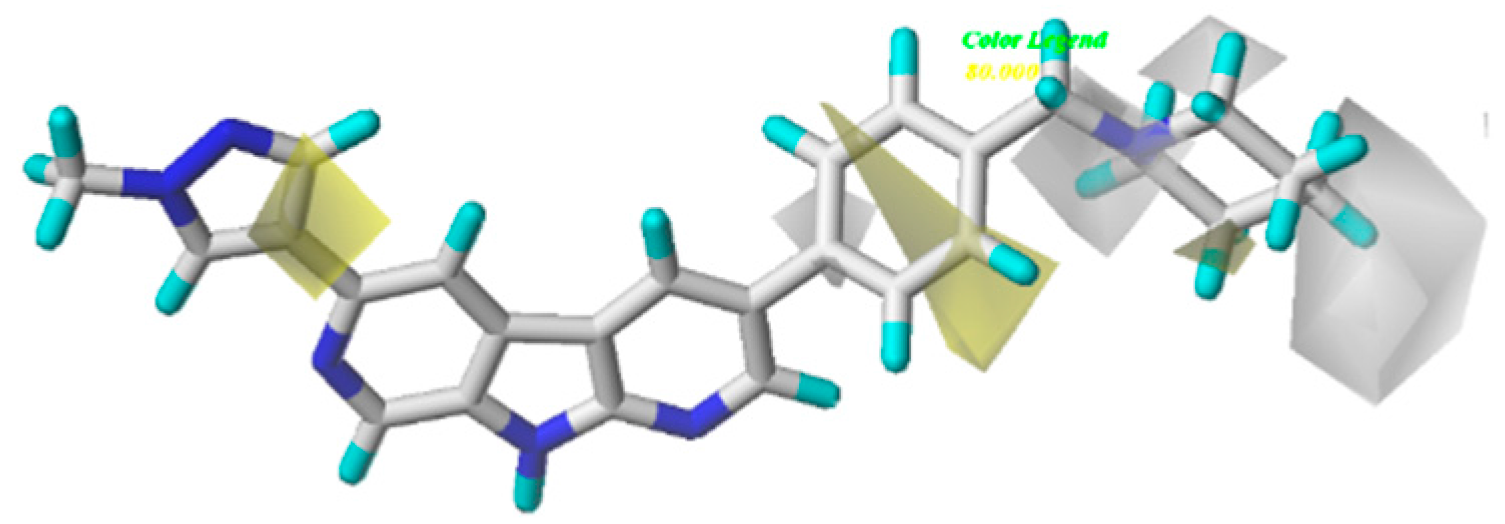
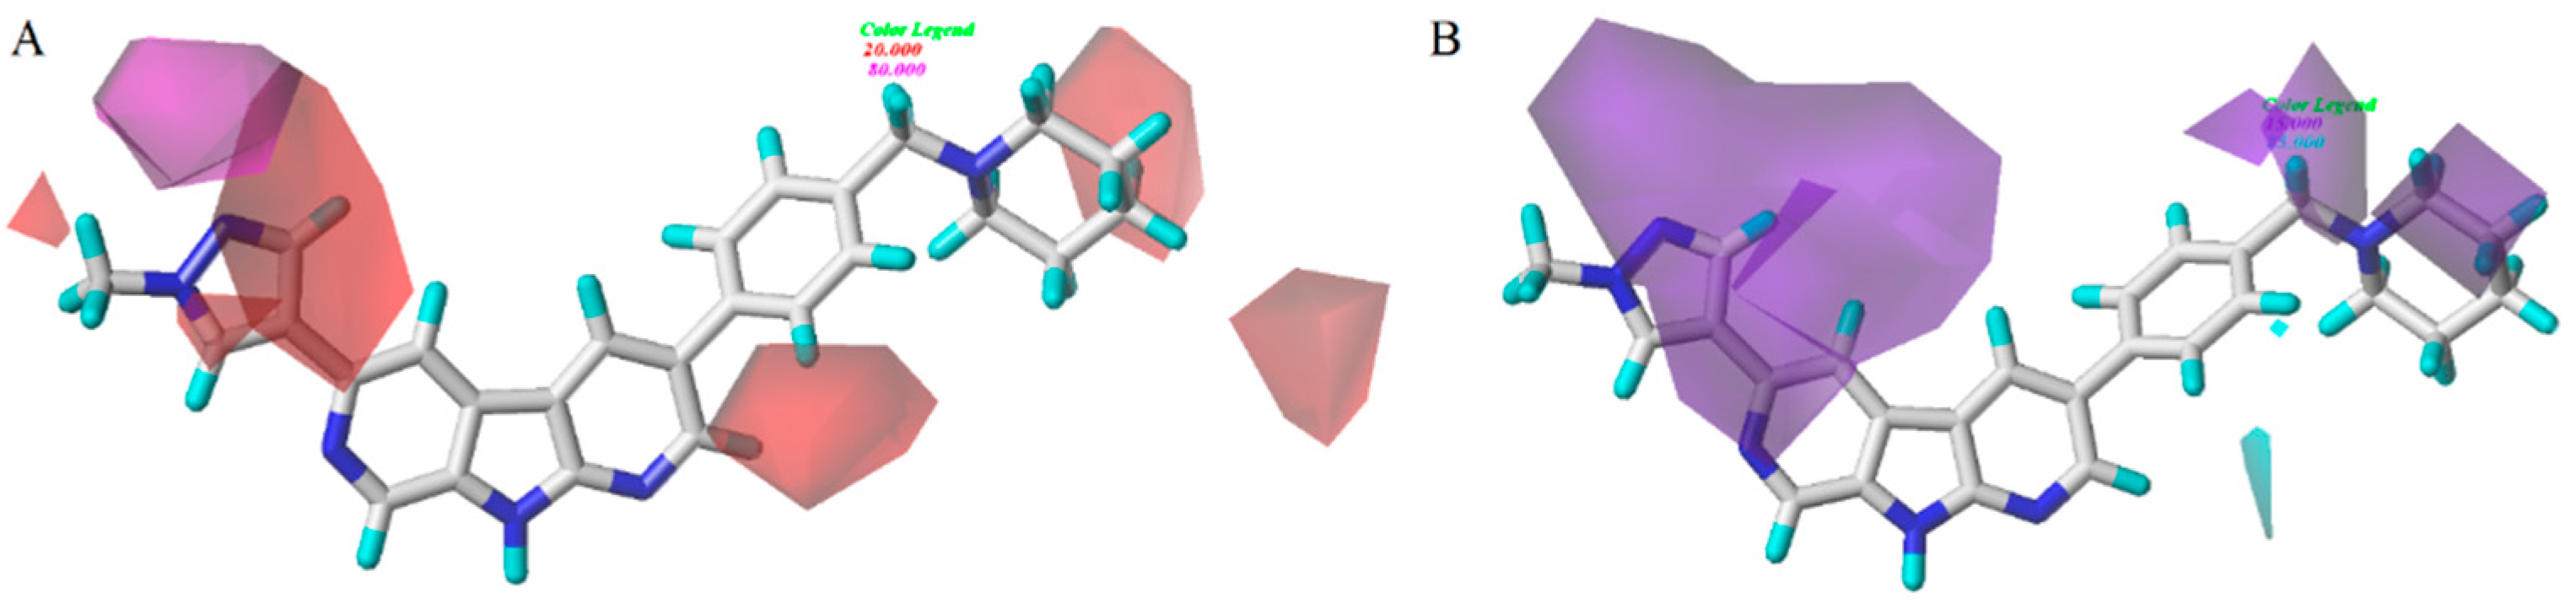
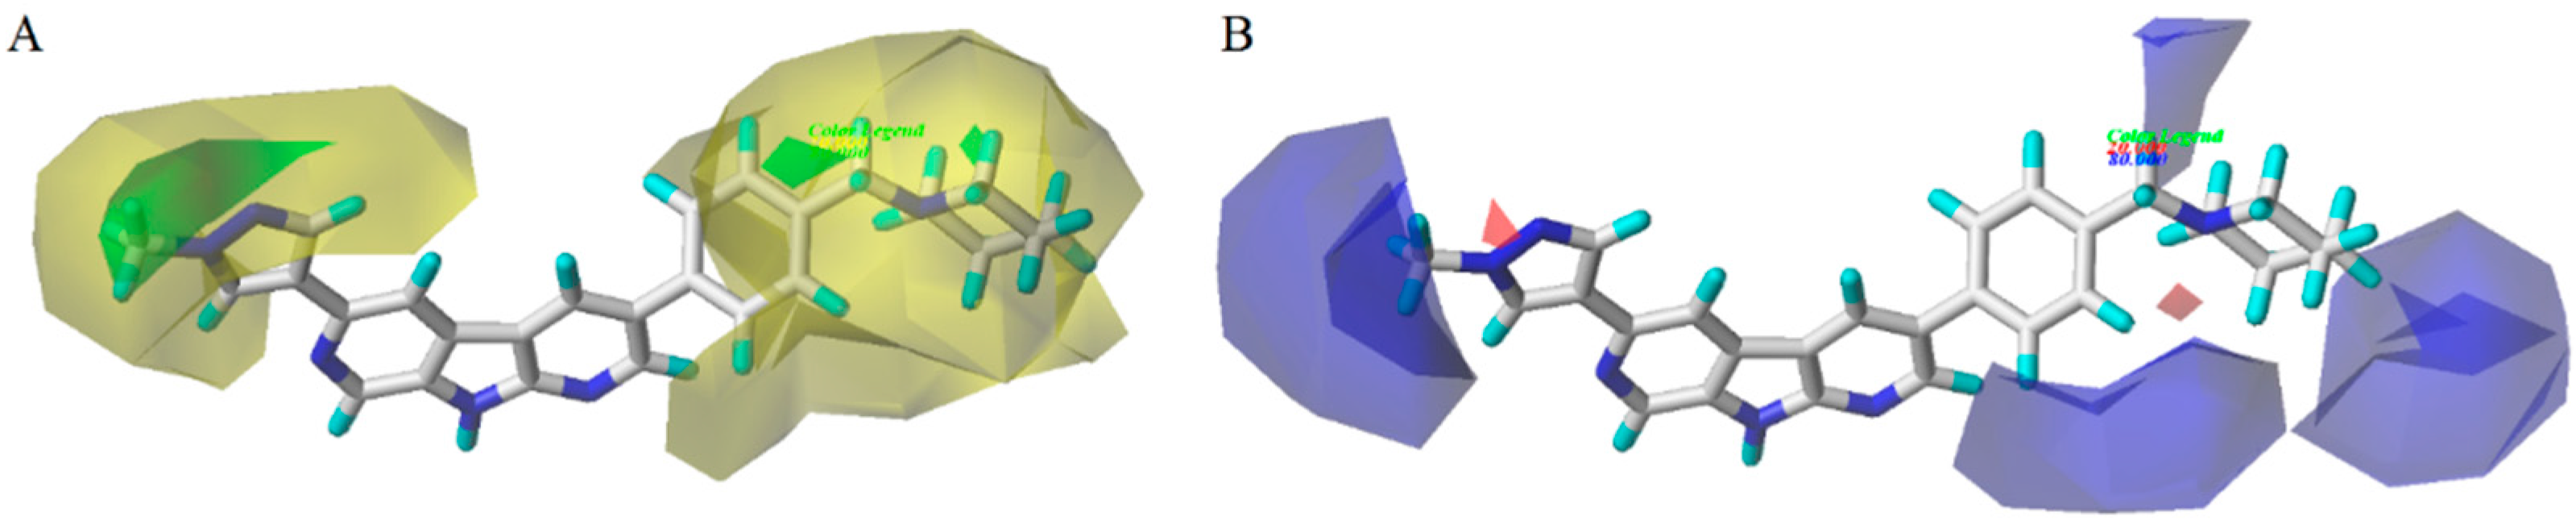
3.2. CoMFA/CoMSIA Contour Map Analysis
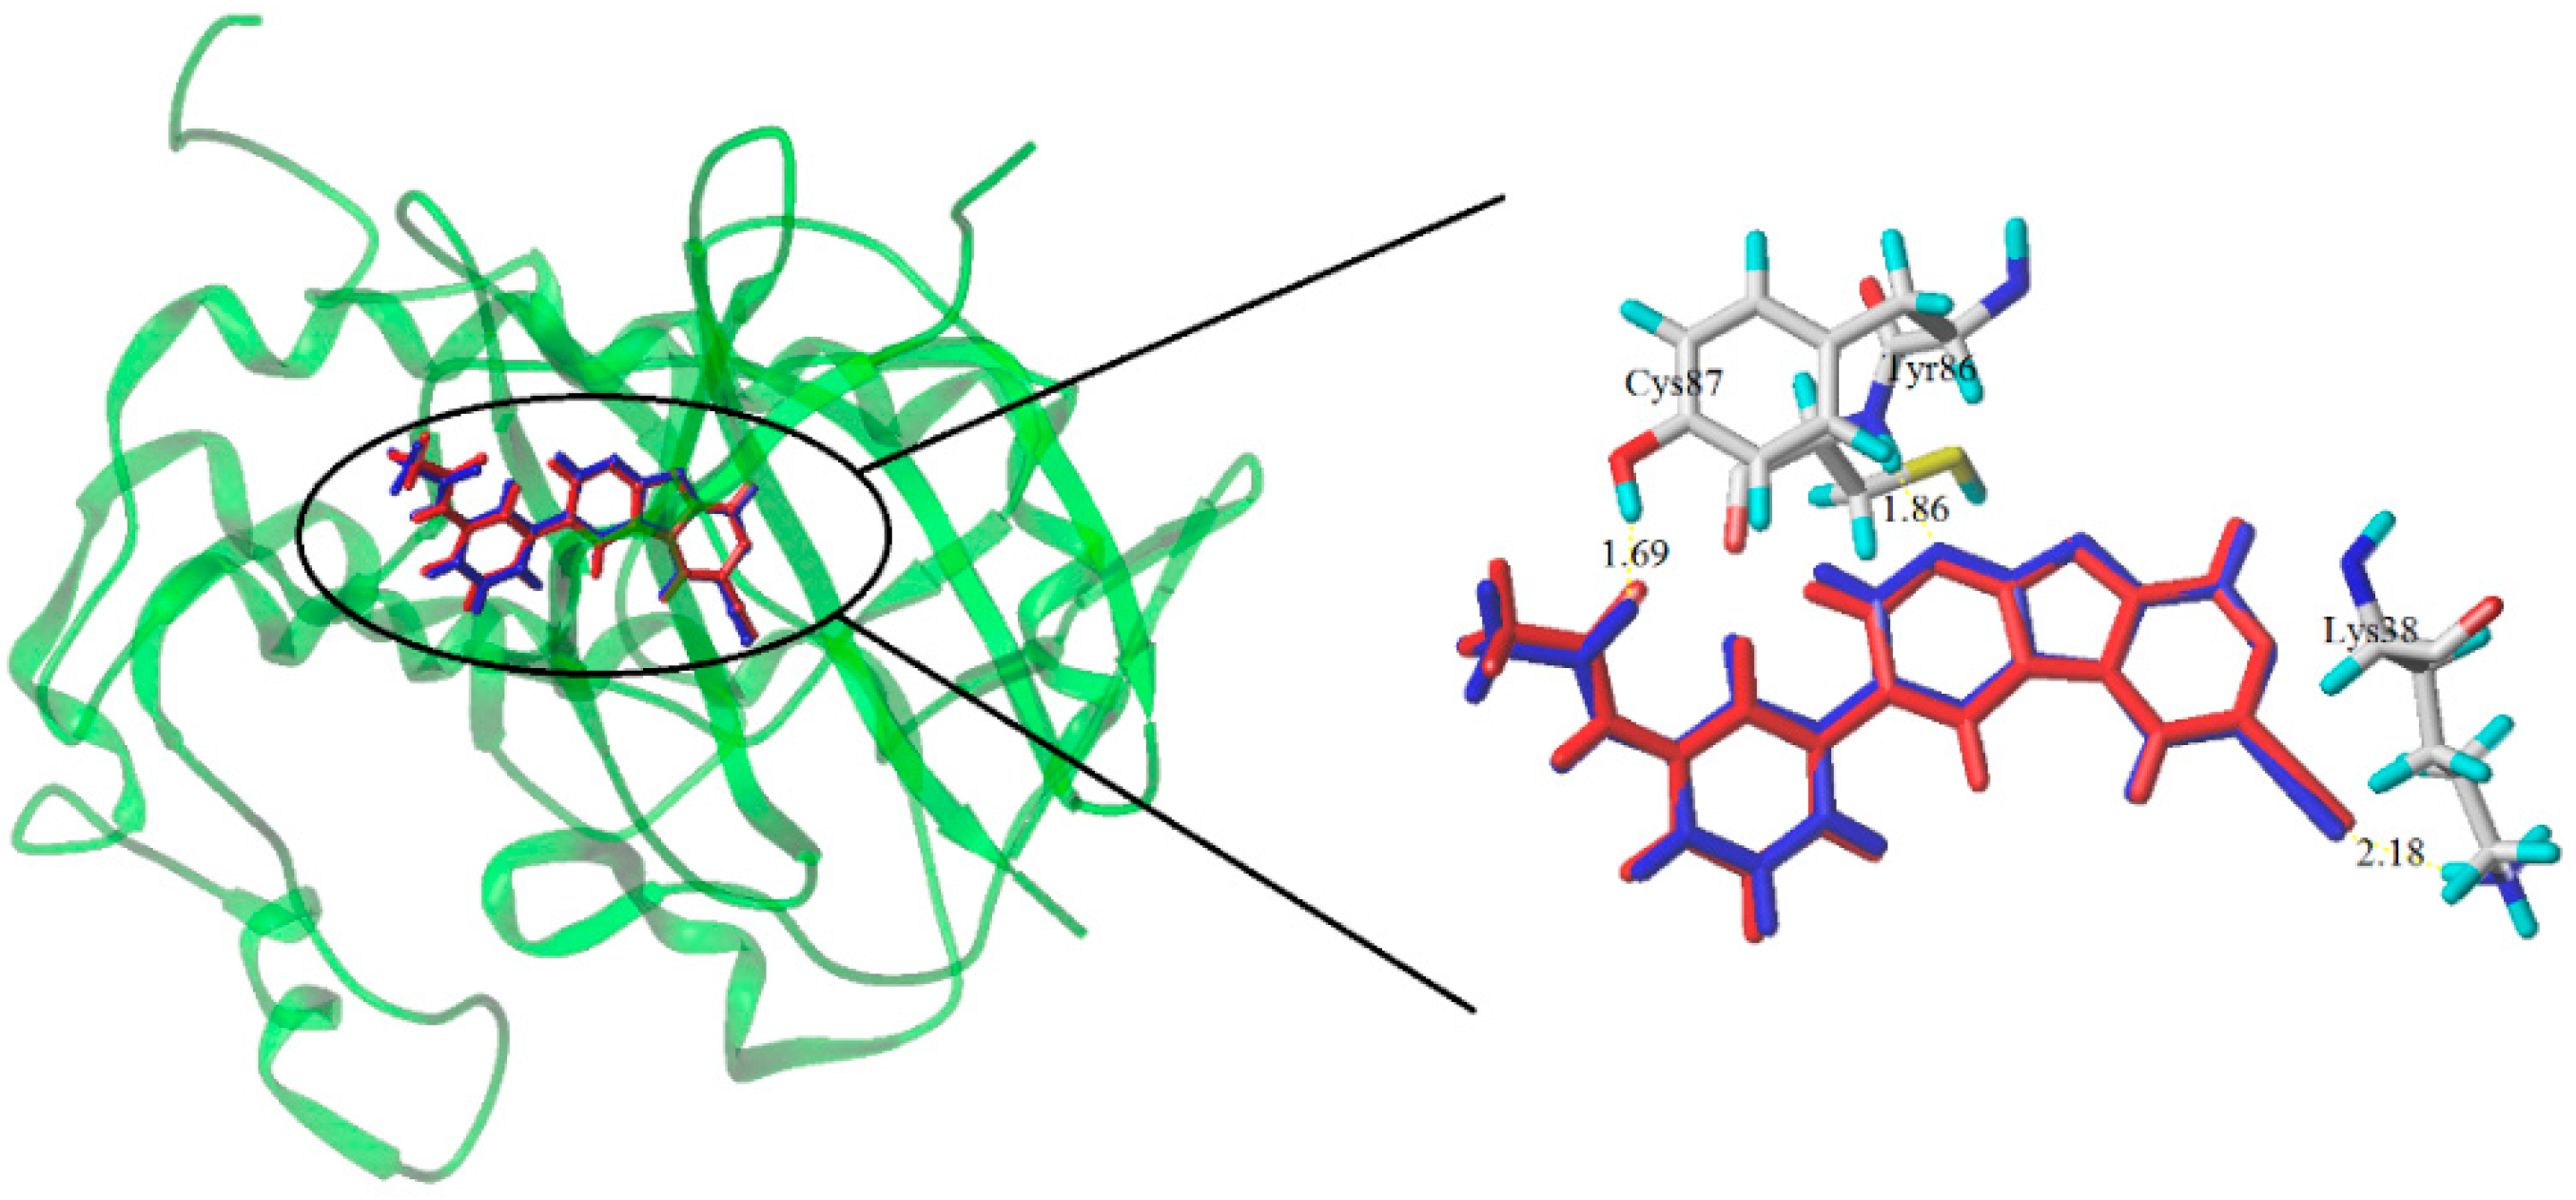
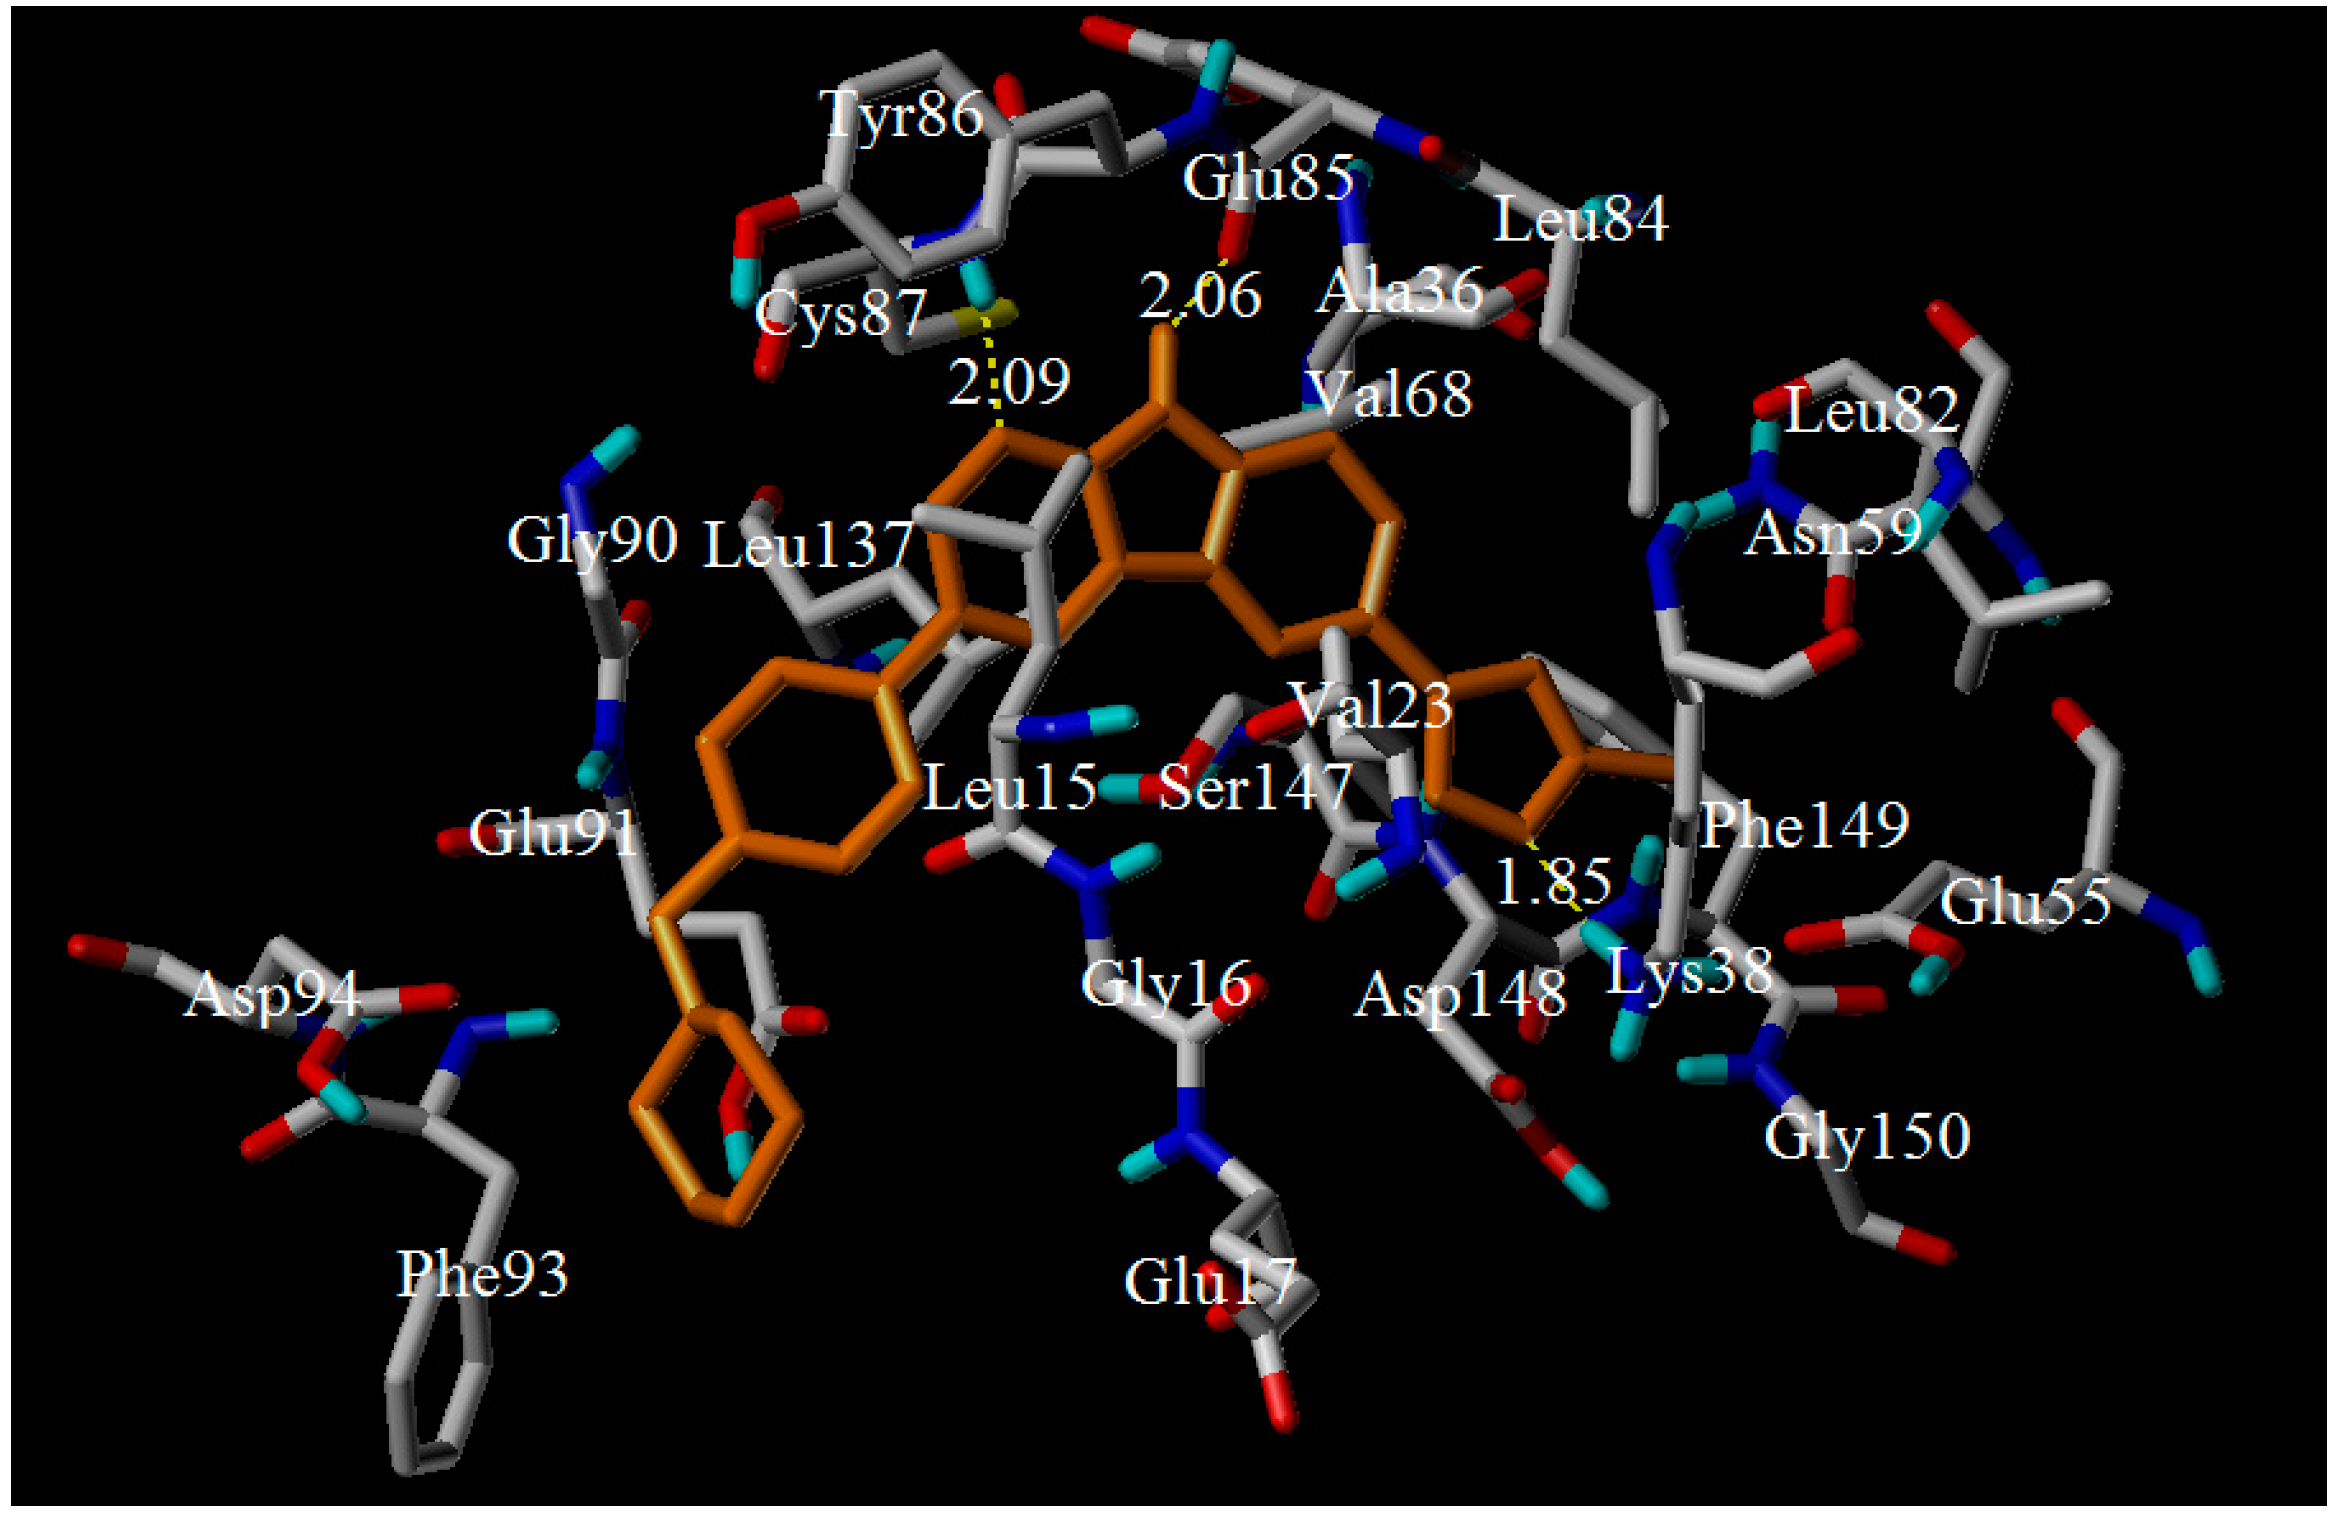
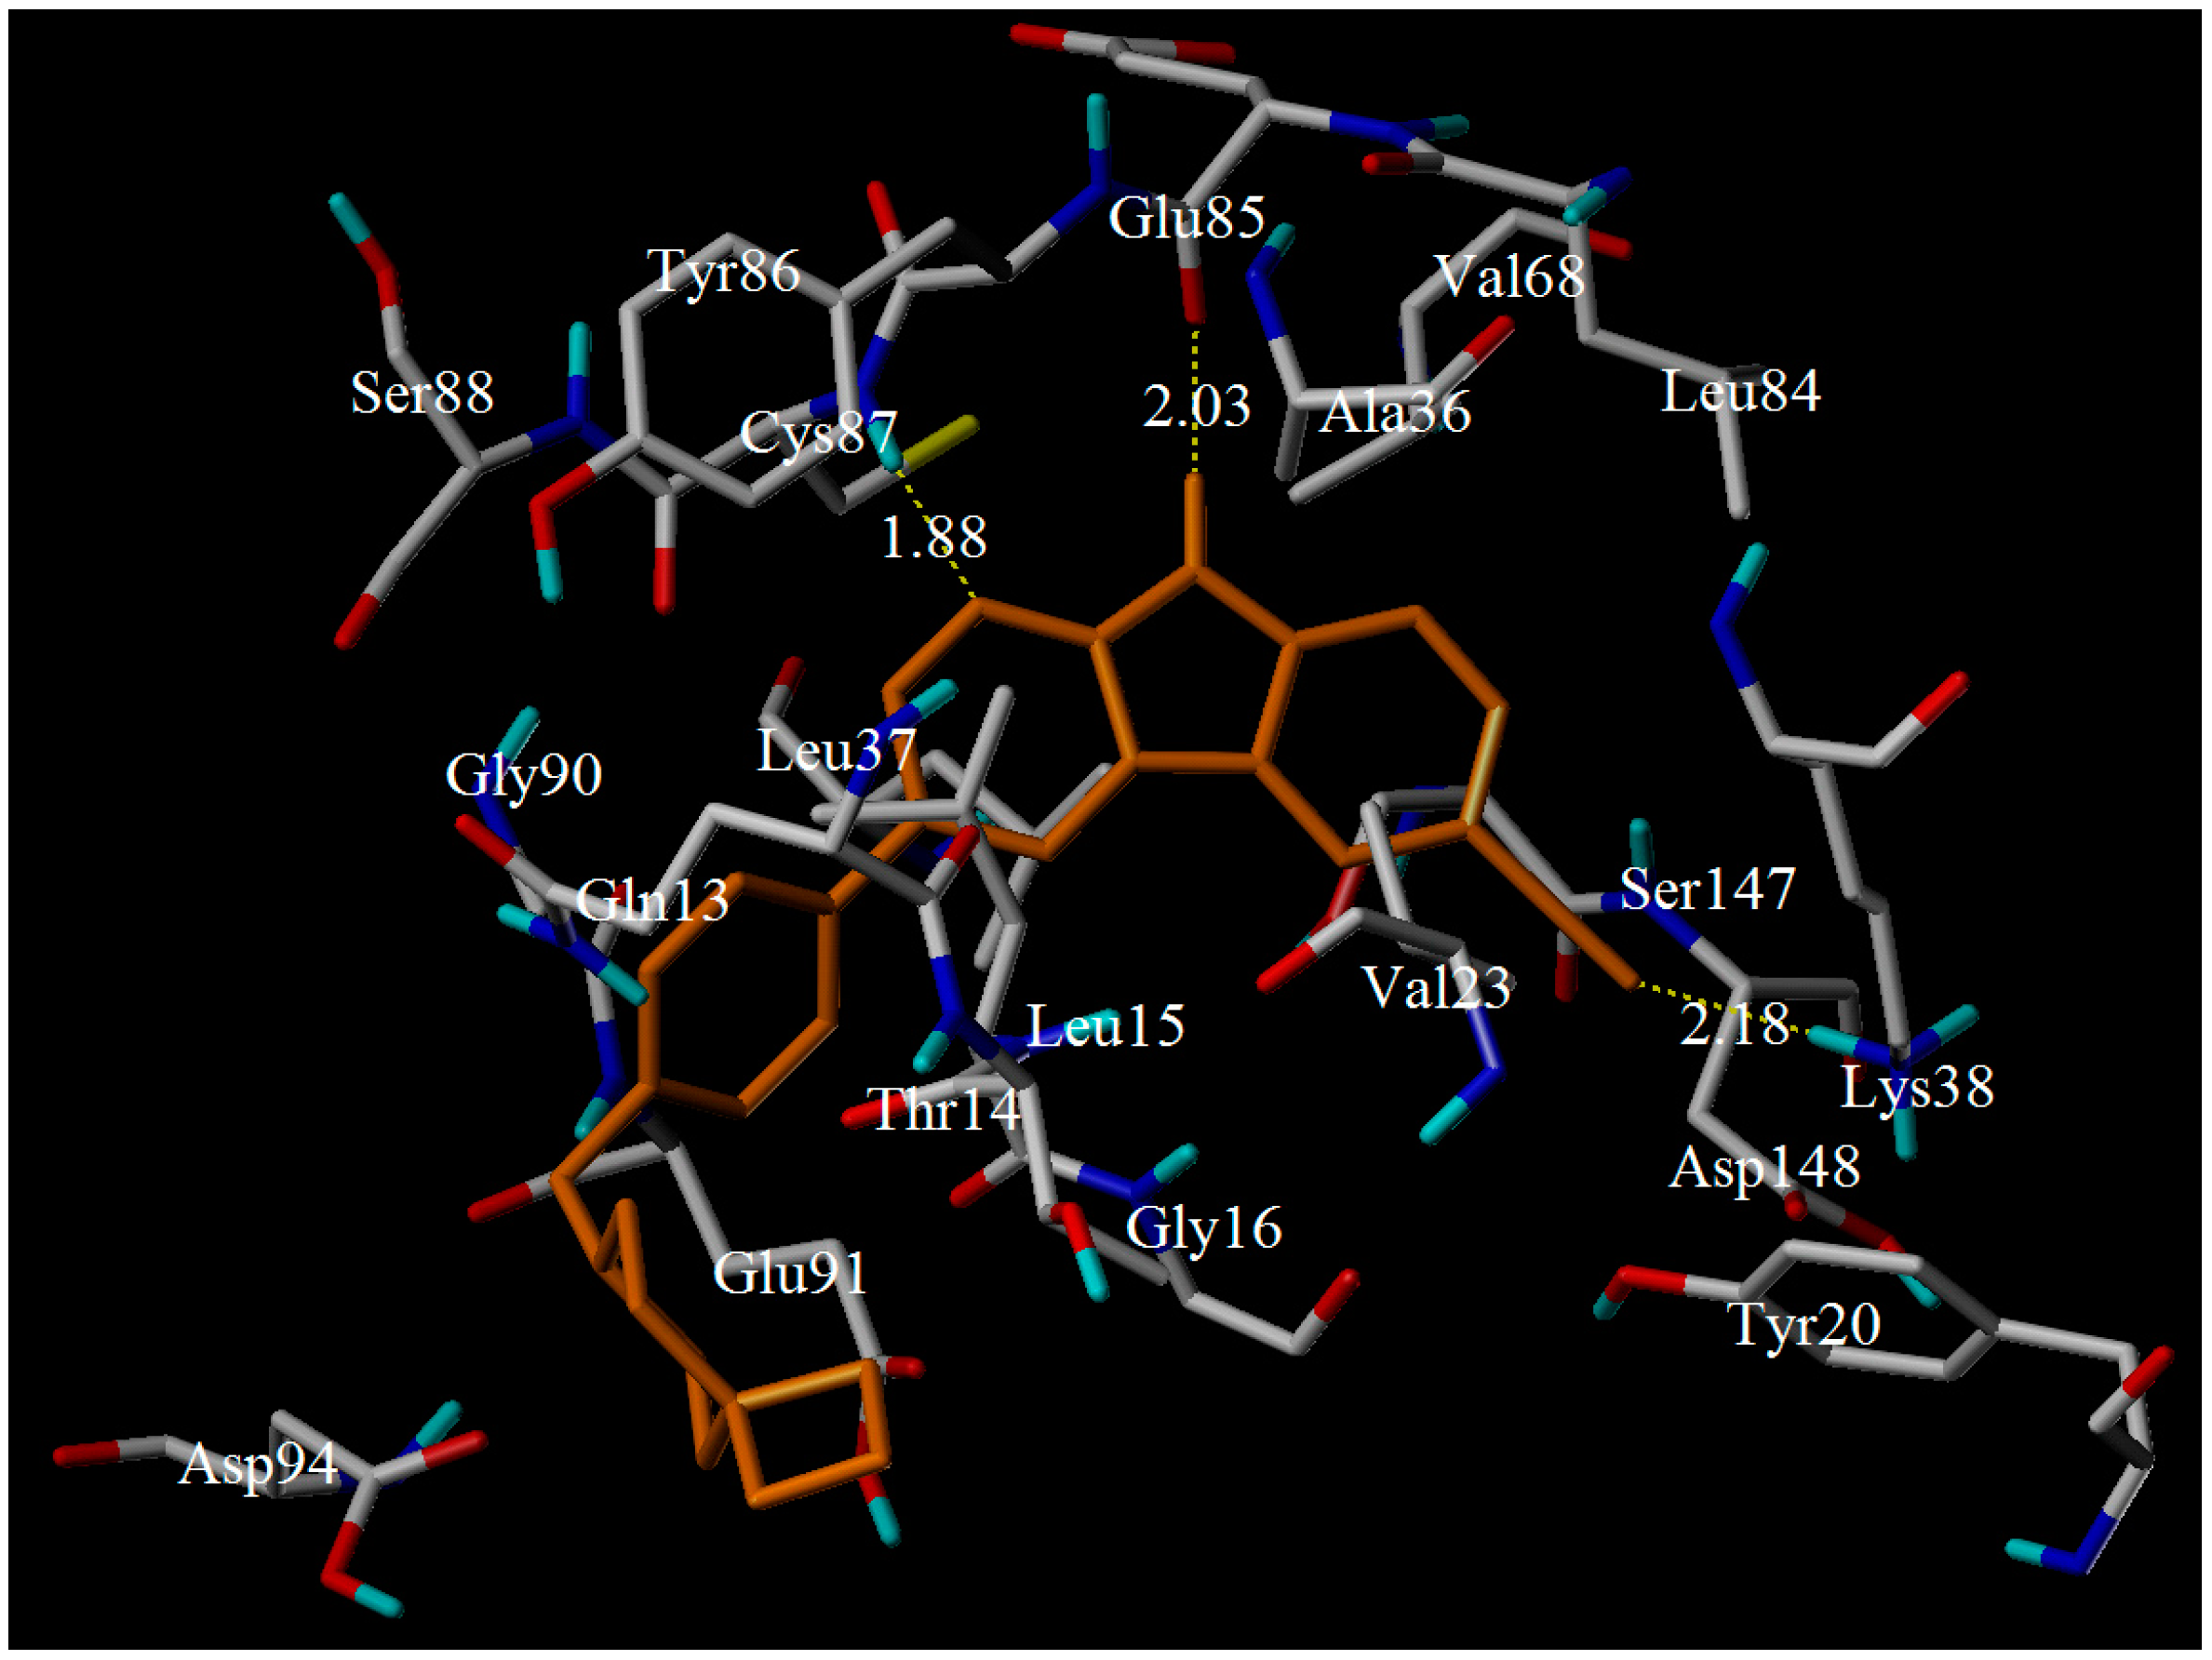
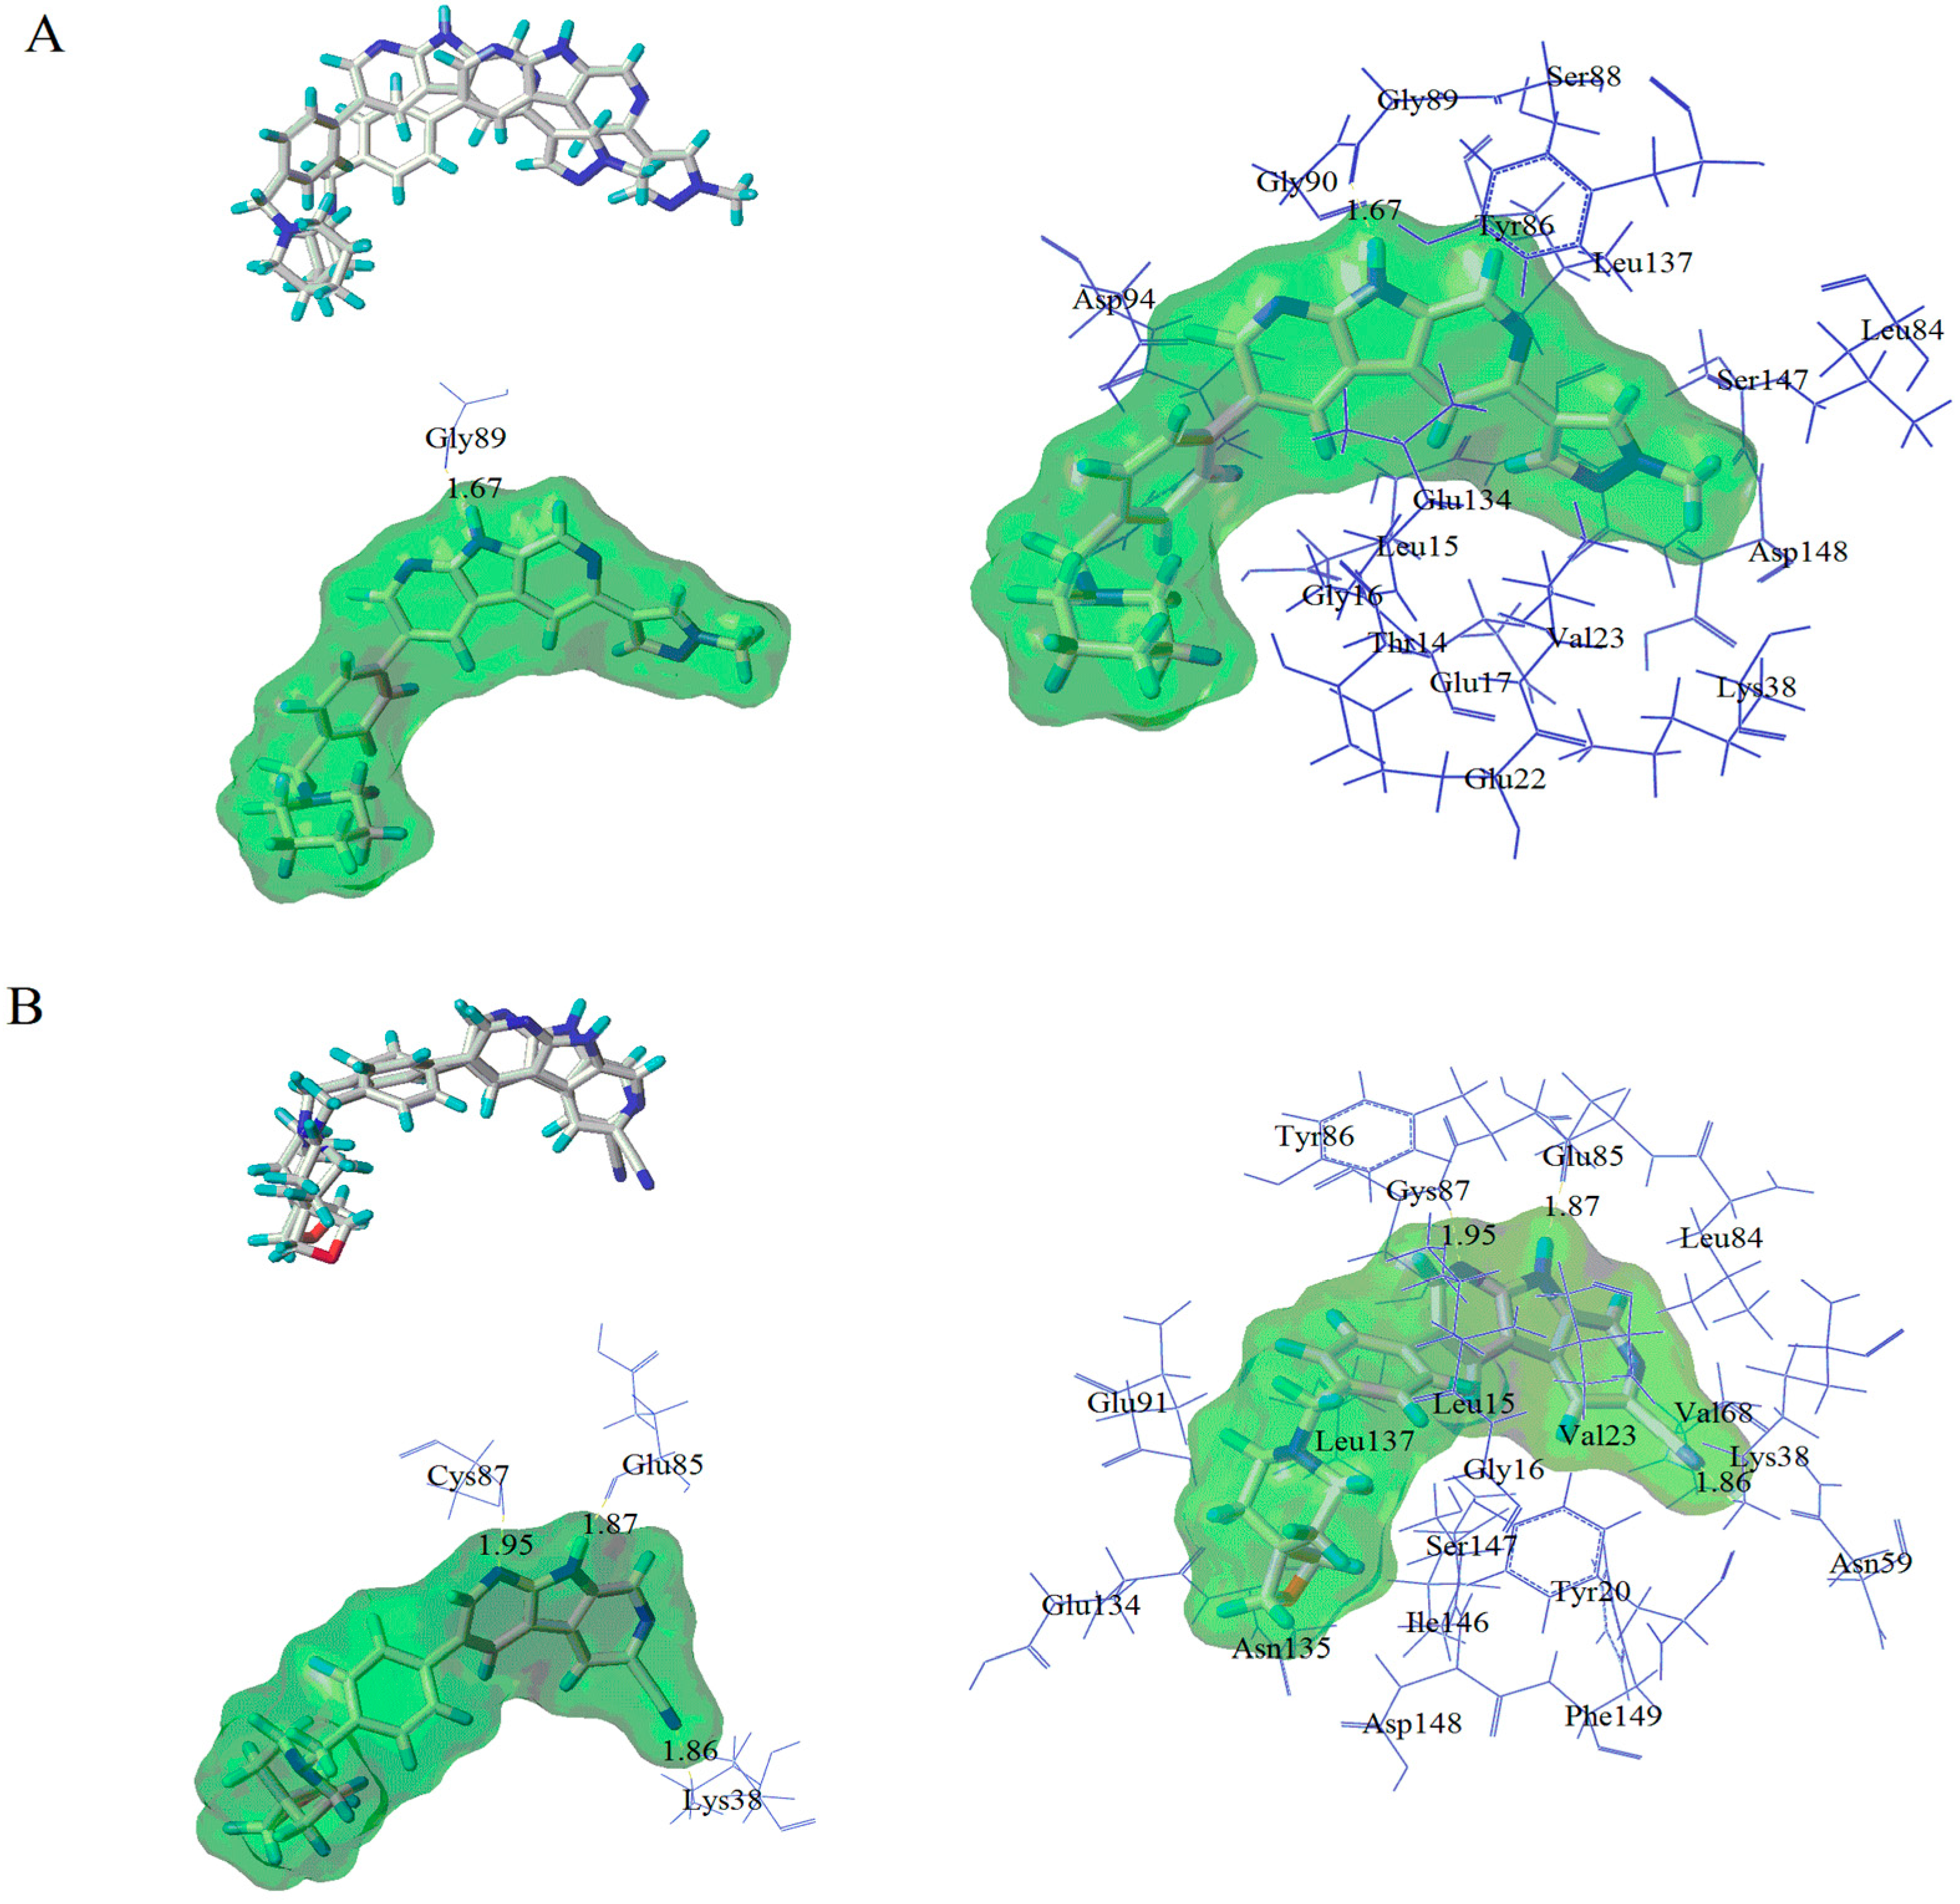
3.3. Molecular Docking
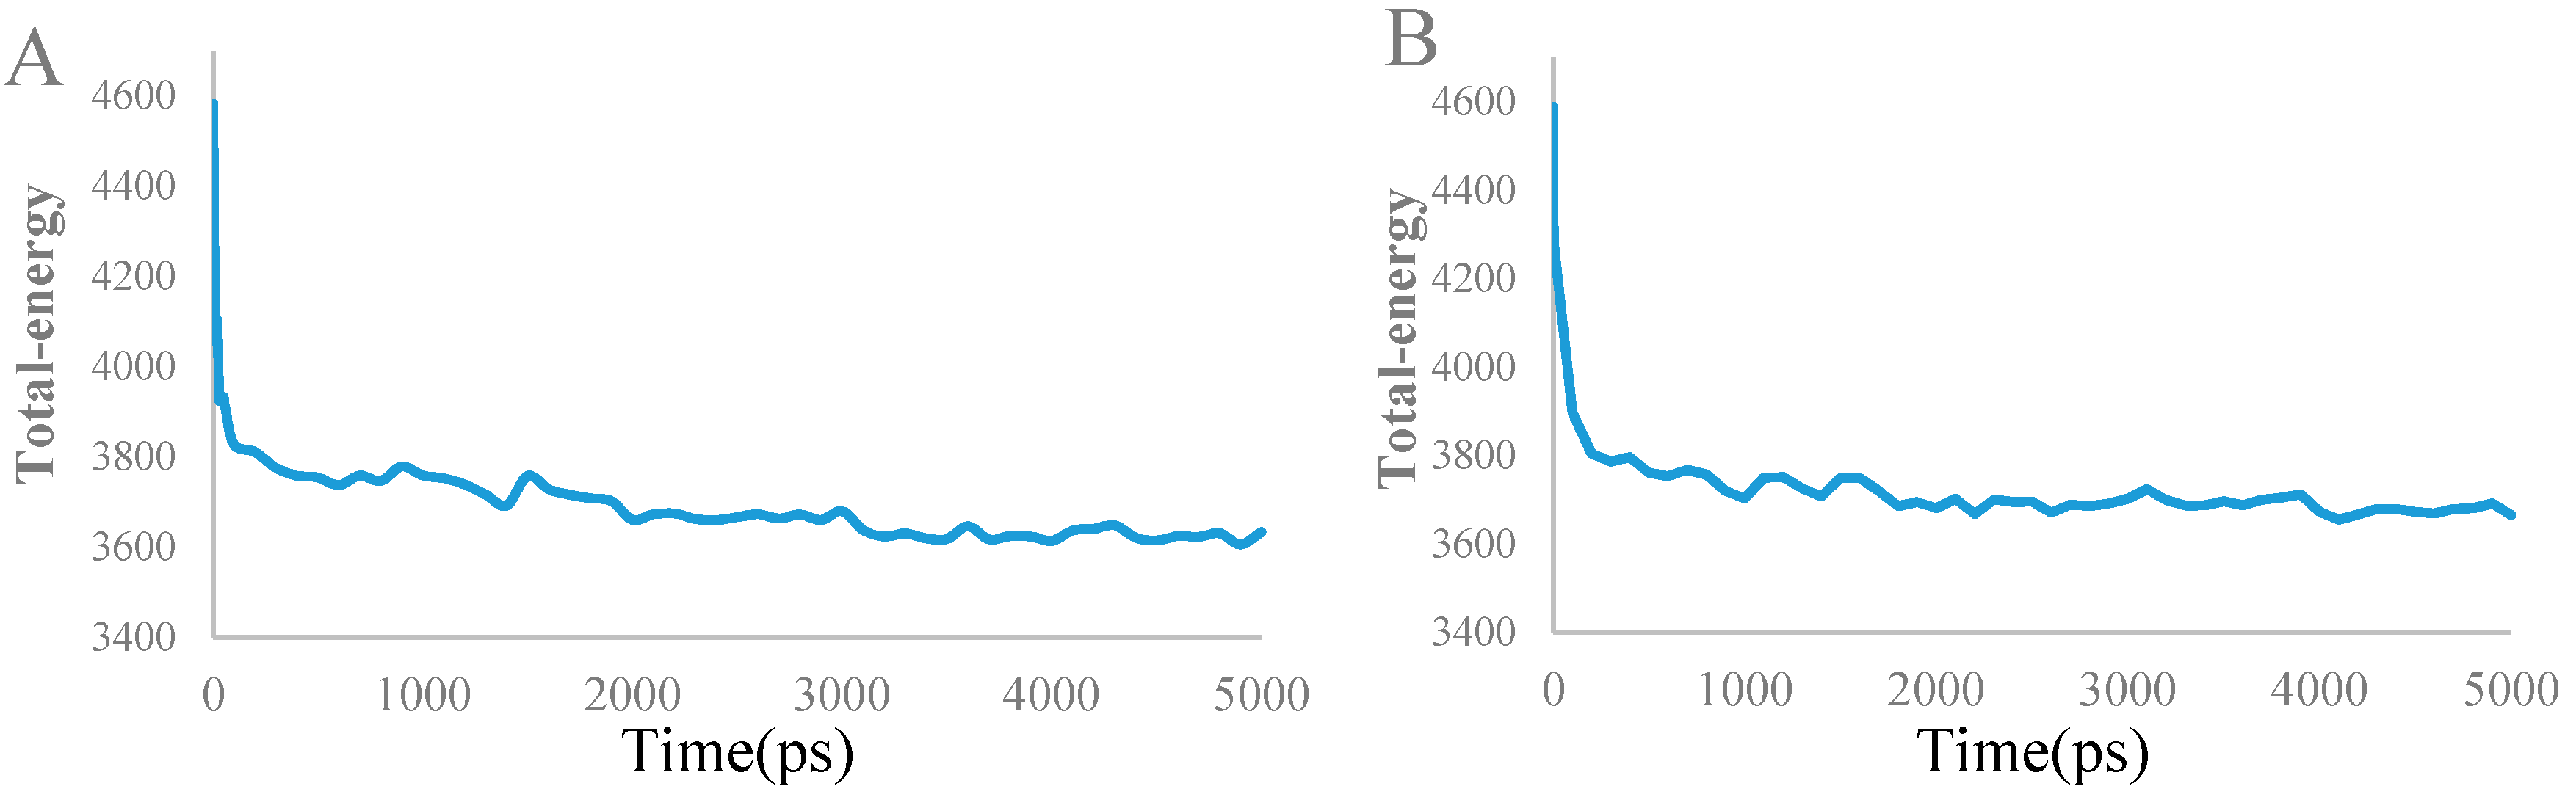
3.4. Molecular Dynamics Simulations
4. Conclusions
Supplementary Materials
Acknowledgments
Author Contributions
Conflicts of Interest
References
- Dan, L.L. Tumor heterogeneity and personalized medicine. N. Engl. J. Med. 2012, 366, 956–957. [Google Scholar]
- Bucher, N.; Britten, C.D. G2 checkpoint abrogation and checkpoint kinase-1 targeting in the treatment of cancer. Br. J. Cancer 2008, 98, 523–528. [Google Scholar] [CrossRef] [PubMed]
- Musk, S.R.; Steel, G.G. Override of the Radiation-induced Mitotic Block in Human Tumour Cells by Methylxanthines and Its Relationship to the Potentiation of Cytotoxicity. Int. J. Radiat. Biol. 1990, 57, 1105–1112. [Google Scholar] [CrossRef] [PubMed]
- Yan, L.; Leverson, J.D. New opportunities in chemosensitization and radiosensitization: Modulating the DNA-damage response. Expert. Rev. Anticancer 2005, 5, 333–342. [Google Scholar]
- Anderson, D.F.; Chapman, S.; Inman, F.; Smith, W.W. Targeting Chk1 in p53-deficient triple-negative breast cancer is therapeutically beneficial in human-in-mouse tumor models. J. Clin. Investig. 2012, 122, 1541–1552. [Google Scholar]
- Wang, J.; Han, X.; Zhang, Y. Autoregulatory mechanisms of phosphorylation of checkpoint kinase 1. Cancer Res. 2012, 72, 3786–3794. [Google Scholar] [CrossRef] [PubMed]
- Li, T.; Christensen, S.D.; Frankel, P.H.; Margolin, K.A.; Agarwala, S.S.; Luu, T.; Mack, P.C.; Lara, P.N., Jr.; Gandara, D.R. A phase II study of cell cycle inhibitor UCN-01 in patients with metastatic melanoma: A California Cancer Consortium trial. Investig. New Drugs 2010, 30, 741–748. [Google Scholar] [CrossRef] [PubMed]
- Blasina, A.; Hallin, J.; Chen, E.; Arango, M.E.; Kraynov, E.; Register, J.; Grant, S.; Ninkovic, S.; Chen, P.; Nichols, T.; et al. Breaching the DNA damage checkpoint via PF-00477736, a novel small-molecule inhibitor of checkpoint kinase 1. Mol. Cancer Ther. 2008, 7, 2394–2404. [Google Scholar] [CrossRef] [PubMed]
- Ma, Z.; Yao, G.; Zhou, B. The Chk1 inhibitor AZD7762 sensitises p53 mutant breast cancer cells to radiation in vitro and in vivo. Mol. Med. Rep. 2012, 6, 897–903. [Google Scholar] [PubMed]
- Mitchell, J.B.; Choudhuri, R.; Fabre, K. In vitro and in vivo radiation sensitization of human tumor cells by a novel checkpoint kinase inhibitor, AZD7762. Clin. Cancer Res. 2010, 16, 2076–2084. [Google Scholar] [CrossRef] [PubMed]
- Gazzard, L.; Appleton, B.; Chapman, K. Discovery of the 1, 7-diazacarbazole class of inhibitors of checkpoint kinase 1. Bioorg. Med. Chem. Lett. 2014, 24, 5704–5709. [Google Scholar] [CrossRef] [PubMed]
- Nagro, C.J.D.; Jonathan, C.; Yang, X.; Linda, R.; Sankar, M.; Ajay, P.; Zha, J.P.; Jackson, P.K.; O’Brien, T. Chk1 inhibition in p53-deficient cell lines drives rapid chromosome fragmentation followed by caspase-independent cell death. Cell Cycle 2014, 13, 303–314. [Google Scholar]
- Xiao, Y.; Ramiscal, J.; Kowanetz, K.; Del Nagro, C.; Malek, S.; Evangelista, M.; Blackwood, E.; Jackson, P.K.; O’Brien, T. Identification of Preferred Chemotherapeutics for Combining with a CHK1 Inhibitor. Mol. Cancer Ther. 2013, 12, 2285–2295. [Google Scholar] [CrossRef] [PubMed]
- Gazzard, L.; Williams, K.; Chen, H. Mitigation of Acetylcholine Esterase Activity in the 1,7-Diazacarbazole Series of Inhibitors of Checkpoint Kinase 1. J. Med. Chem. 2015, 58, 5053–5074. [Google Scholar] [CrossRef] [PubMed]
- Zhong, Z.; Liu, L.J.; Dong, Z.Q.; Lu, L.; Wang, M.; Leung, C.H.; Ma, D.L.; Wang, Y. Structure-based discovery of an immunomodulatory inhibitor of TLR1-TLR2 heterodimerization from a natural product-like database. Chem. Commun. 2015, 51, 11178–11181. [Google Scholar] [CrossRef] [PubMed]
- Ma, D.L.; Chan, S.H.; Wei, G.; Zhong, H.J.; Yang, H.; Leung, L.T.; Gullen, E.A.; Chiu, P.; Cheng, Y.C.; Leung, C.H. Virtual screening and optimization of Type II inhibitors of JAK2 from a natural product library. Chem. Commun. 2014, 50, 13885–13888. [Google Scholar] [CrossRef] [PubMed]
- Liu, L.J.; Leung, K.H.; Chan, S.H.; Wang, Y.T.; Ma, D.L.; Leung, C.H. Identification of a natural product-like STAT3 dimerization inhibitor by structure-based virtual screening. Cell Death Dis. 2015, 5, 96–104. [Google Scholar] [CrossRef] [PubMed]
- Ma, D.L.; Chan, S.H.; Leung, C.H. Drug repositioning by structure-based virtual screening. Chem. Soc. Rev. 2013, 42, 2130–2141. [Google Scholar] [CrossRef] [PubMed]
- Yang, H.; Zhong, H.J.; Leung, K.H.; Chan, S.H.; Ma, P.Y.; Fu, W.C.; Nanjunda, R.; Wilson, W.D.; Ma, D.L.; Leung, C.H. Structure-based design of flavone derivatives as c- myc oncogene down-regulators. Eur. J. Pharm. Sci. 2013, 48, 130–141. [Google Scholar] [CrossRef] [PubMed]
- Ma, D.L.; Chan, S.H.; Leung, C.H. Molecular docking for virtual screening of natural product databases. Chem. Sci. 2011, 2, 1656–1665. [Google Scholar] [CrossRef]
- Veselinović, J.B.; Nikolić, G.M.; Trutić, N.V. Monte Carlo QSAR models for predicting organophosphate inhibition of acetylcholinesterase. SAR QSAR Environ. Res. 2015, 26, 449–460. [Google Scholar] [CrossRef] [PubMed]
- Caballero, J.; Zilocchi, S.; Tiznado, W. Docking and quantitative structure–activity relationship studies for imidazo[1,2-a]pyrazines as inhibitors of checkpoint kinase-1. Med. Chem. Res. 2012, 21, 1912–1920. [Google Scholar] [CrossRef]
- Cruzz, V.L.; Martinez, S.; Ramos, J. 3D-QSAR as a Tool for Understanding and Improving Single-Site Polymerization Catalysts. A Review. Organometallics 2014, 33, 2944–2959. [Google Scholar] [CrossRef]
- Gasteiger, J.; Marsili, M. Iterative partial equalization of orbital electronegativity: A rapid access to atomic charges. J. Tetrahedron. 1980, 36, 3219–3228. [Google Scholar] [CrossRef]
- Chebib, M.; Johnston, G.A.R. GABA-activated ligand gated ion channels: medicinal chemistry and molecular biology. J. Med. Chem. 2000, 43, 1427–1447. [Google Scholar] [CrossRef] [PubMed]
- Head, J.D.; Zerner, M.C. A Broyden-Fletcher-Goldfarb-Shanno optimization procedure for molecular geometries. J. Chem. Phys. Lett. 1985, 3, 264–270. [Google Scholar] [CrossRef]
- Cramer, R.D.; Patterson, D.E.; Bunce, J.D. Comparative molecular field analysis (CoMFA). 1. Effect of shape on binding of steroids to carrier proteins. J. Am. Chem. Soc. 1988, 110, 5959–5967. [Google Scholar] [PubMed]
- Klebe, G.; Abraham, U. Comparative molecular similarity index analysis (CoMSIA) to study hydrogen-bonding properties and to score combinatorial libraries. Comput. Aid. Mol. Des. 1999, 13, 1–10. [Google Scholar] [CrossRef]
- Wold, S.; Ruhe, A.; Wold, H. The collinearity problem in linear regression. The partial least squares (PLS) approach to generalized inverses. SIAM J. Sci. Comput. 1984, 5, 735–743. [Google Scholar] [CrossRef]
- Aparoy, P.; Suresh, G.K.; Reddy, K.K. CoMFA and CoMSIA studies on 5-hydroxyindole-3-carboxylate derivatives as 5-lipoxygenase inhibitors: Generation of homology model and docking studies. Bioorg. Med. Chem. Lett. 2011, 21, 456–462. [Google Scholar] [CrossRef] [PubMed]
- Khd, S.; Naveena, Q.; Karthikeyan, M. Jak2 inhibitor-a jackpot for pharmaceutical industries: A comprehensive computational method in the discovery of new potent Jak2 inhibitors. Mol. Biosyst. 2014, 10, 2146–2159. [Google Scholar]
- Yu, Z.; Li, X.-C.; Ge, C.-Z.; Si, H.-Z.; Cui, L.-H.; Gao, H.; Duan, Y.-B.; Zhai, H.-B. 3D-QSAR modeling and molecular docking study on Mer kinase inhibitors of pyridine-substituted pyrimidines. Mol. Divers. 2015, 19, 135–147. [Google Scholar] [CrossRef] [PubMed]
- Golbraikh, A.; Tropsha, A. Beware of Q2. J. Mol. Graph. Model. 2002, 20, 269–276. [Google Scholar] [CrossRef]
- Wang, Z.; Cheng, L.; Kai, Z.; Wu, F.; Liu, Z.; Cai, M. Molecular modeling studies of atorvastatin analogues as HMGR inhibitors using 3D-QSAR, molecular docking and molecular dynamics simulations. Bioorg. Med. Chem. Lett. 2014, 24, 3869–3876. [Google Scholar] [CrossRef] [PubMed]
- Xu, C.; Ren, Y. Molecular modeling studies of [6,6,5] Tricyclic Fused Oxazolidinones as FXa inhibitors using 3D-QSAR, Topomer CoMFA, molecular docking and molecular dynamics simulations. Bioorg. Med. Chem. Lett. 2015, 25, 4522–4528. [Google Scholar] [CrossRef] [PubMed]
- Cheng, L.P.; Huang, X.Y.; Wang, Z.; Kai, Z.P.; Wu, F.H. Combined 3D-QSAR, molecular docking, and molecular dynamics study on potent cyclohexene-based influenza neuraminidase inhibitors. Monatshefte Chem. 2014, 145, 9–22. [Google Scholar] [CrossRef]
- Sample Availability: Not Available.


| NO. | R1 | R2 | Actual pIC50 | CoMFA | CoMSIA | ||
|---|---|---|---|---|---|---|---|
| pIC50 | Residual | pIC50 | Residual | ||||
| 1 |  |  | 7.567 | 7.706 | −0.139 | 7.614 | −0.047 |
| 2 | |  | 7.695 | 7.437 | 0.258 | 7.266 | 0.429 |
| 3 | |  | 7.471 | 7.726 | −0.255 | 7.509 | −0.038 |
| 4 | |  | 7.833 | 7.705 | 0.128 | 7.732 | 0.101 |
| 5 | |  | 6.896 | 7.160 | −0.264 | 7.046 | -0.150 |
| 6 | |  | 7.116 | 7.219 | -0.103 | 7.280 | −0.164 |
| 7 | |  | 7.370 | 7.323 | 0.047 | 7.292 | 0.078 |
| 8 | | H | 6.383 | 6.600 | −0.217 | 6.532 | −0.149 |
| 9 | |  | 8.027 | 8.330 | −0.303 | 8.158 | −0.131 |
| 10 | |  | 7.991 | 8.072 | −0.081 | 8.055 | −0.064 |
| 11 | |  | 8.745 | 8.310 | 0.435 | 8.799 | −0.054 |
| 12 | |  | 8.721 | 8.497 | 0.224 | 8.769 | −0.048 |
| 13 | |  | 8.301 | 8.121 | 0.180 | 8.159 | 0.142 |
| 14 | |  | 7.936 | 8.014 | −0.078 | 8.012 | −0.076 |
| 15 | |  | 7.857 | 8.136 | −0.279 | 7.962 | −0.105 |
| 16 | | Br | 6.854 | 6.748 | 0.106 | 6.762 | 0.092 |
| 17 | |  | 8.602 | 8.414 | 0.188 | 8.729 | −0.127 |
| 18 | |  | 8.276 | 8.110 | 0.166 | 8.244 | 0.032 |
| 19 | |  | 7.866 | 7.843 | 0.023 | 8.019 | −0.153 |
| 20 | |  | 8.638 | 8.390 | 0.248 | 8.502 | 0.136 |
| 21 | H |  | 7.730 | 7.500 | 0.230 | 7.703 | 0.027 |
| 22 |  | | 8.367 | 8.283 | 0.084 | 8.537 | −0.170 |
| 23 |  | | 7.703 | 7.802 | −0.099 | 7.847 | −0.144 |
| 24 |  | | 7.738 | 7.818 | −0.080 | 7.583 | 0.155 |
| 25 |  | | 9.337 | 9.241 | 0.096 | 9.116 | 0.221 |
| 26 |  | | 9.022 | 9.189 | −0.167 | 9.295 | −0.273 |
| 27 |  | | 8.959 | 8.883 | 0.076 | 8.800 | 0.159 |
| 28 |  | | 9.509 | 9.585 | −0.076 | 9.471 | 0.038 |
| 29 |  | | 9.022 | 8.706 | 0.316 | 8.615 | 0.407 |
| 30 |  | | 8.638 | 8.974 | −0.336 | 8.452 | 0.186 |
| 31 |  | | 8.538 | 8.565 | −0.027 | 8.672 | −0.134 |
| 32 |  | | 8.292 | 8.713 | −0.421 | 8.468 | −0.176 |
| 33 | |  | 7.380 | 7.311 | 0.069 | 7.374 | 0.006 |
| 34 | |  | 7.870 | 7.963 | −0.093 | 7.882 | −0.012 |
| 35 | |  | 7.943 | 7.802 | 0.141 | 7.937 | 0.006 |
| Test1 |  | | 8.886 | 9.278 | −0.392 | 9.180 | −0.294 |
| Test2 | |  | 8.678 | 8.425 | 0.253 | 8.393 | 0.285 |
| Test3 | |  | 8.377 | 8.304 | 0.073 | 8.266 | 0.111 |
| Test4 | |  | 8.357 | 8.364 | −0.007 | 8.251 | 0.106 |
| Test5 | | NHEt | 7.247 | 7.151 | 0.096 | 6.927 | 0.320 |
| PLS Statistics | CoMFA | CoMSIA |
|---|---|---|
| q2 a | 0.726 | 0.531 |
| NOC b | 3 | 4 |
| r2 c | 0.918 | 0.950 |
| SEE d | 0.215 | 0.171 |
| F e | 115.292 | 141.412 |
| r2pred f | 0.878 | 0.846 |
| Steric | 0.509 | 0.199 |
| Electrostatic | 0.491 | 0.283 |
| H-acceptor | - | 0.238 |
| H-donor | - | 0.099 |
| Hydrophobic | - | 0.182 |

| No. | R1 | Predicted pIC50 by CoMFA | Predicted pIC50 by CoMSIA |
|---|---|---|---|
| 2a |  | 9.570 | 9.682 |
| 2b |  | 9.654 | 9.504 |
| 2c |  | 9.412 | 9.483 |
| 2d |  | 9.411 | 9.400 |
| 2f |  | 9.619 | 9.297 |
| 2g |  | 9.424 | 9.201 |
© 2016 by the authors. Licensee MDPI, Basel, Switzerland. This article is an open access article distributed under the terms and conditions of the Creative Commons Attribution (CC-BY) license ( http://creativecommons.org/licenses/by/4.0/).
Share and Cite
Gao, X.; Han, L.; Ren, Y. In Silico Exploration of 1,7-Diazacarbazole Analogs as Checkpoint Kinase 1 Inhibitors by Using 3D QSAR, Molecular Docking Study, and Molecular Dynamics Simulations. Molecules 2016, 21, 591. https://doi.org/10.3390/molecules21050591
Gao X, Han L, Ren Y. In Silico Exploration of 1,7-Diazacarbazole Analogs as Checkpoint Kinase 1 Inhibitors by Using 3D QSAR, Molecular Docking Study, and Molecular Dynamics Simulations. Molecules. 2016; 21(5):591. https://doi.org/10.3390/molecules21050591
Chicago/Turabian StyleGao, Xiaodong, Liping Han, and Yujie Ren. 2016. "In Silico Exploration of 1,7-Diazacarbazole Analogs as Checkpoint Kinase 1 Inhibitors by Using 3D QSAR, Molecular Docking Study, and Molecular Dynamics Simulations" Molecules 21, no. 5: 591. https://doi.org/10.3390/molecules21050591