Article

Growing and Etching MoS2 on Carbon Nanotube Film for Enhanced Electrochemical Performance

National Synchrotron Radiation Laboratory, CAS Center for Excellence in Nanoscience, University of Science and Technology of China, Hefei 230029, China
*
Author to whom correspondence should be addressed.
These authors contributed equally to this paper.
Molecules 2016, 21(10), 1318; https://doi.org/10.3390/molecules21101318
Submission received: 5 September 2016 / Revised: 25 September 2016 / Accepted: 28 September 2016 / Published: 30 September 2016
(This article belongs to the Special Issue Carbon Nanotubes: Advances and Applications)

Abstract

:
In this work we directly synthesized molybdenum disulfide (MoS2) nanosheets on carbon nanotube film (MoS2@CNT) via a two-step chemical vapor deposition method (CVD). By etching the obtained MoS2@CNT into 10% wt HNO3, the morphology of MoS2 decorated on CNT bundles was modulated, resulting in more catalytic active MoS2 edges being exposed for significantly enhanced electrochemical performance. Our results revealed that an 8 h acid etching sample exhibited the best performance for the oxygen evolution reaction, i.e., the current density reached 10 mA/cm2 under 375 mV over-potential, and the tafel slope was as low as 94 mV/dec. The enhanced behavior was mainly originated from the more catalytic sites in MoS2 induced by the acid etching treatment and the higher conductivity from the supporting CNT films. Our study provides a new route to produce two-dimensional layers on CNT films with tunable morphology, and thus may open a window for exploring its promising applications in the fields of catalytic-, electronic-, and electrochemical-related fields.

1. Introduction

Growing industrialization and the immense use of energy which is usually obtained from fossil fuels create a significant harmful impact on the climate and human health. Due to rapid exhaustion of fossil energy and environmental concerns, people are now exerting enormous efforts to develop renewable energy sources such as solar energy [1,2,3,4], wind power [5,6,7] and bioenergy [8,9,10,11,12], etc. Hydrogen generated by splitting water has a great potential as an ideal future energy source because of its high energy density and lack of toxicity features. The water splitting process can be divided into two half-processes [13], the hydrogen evolution reaction (HER) and the oxygen evolution reaction (OER). Because of the energy and dynamic barrier, to drive the reaction on, a potential higher than 1.23 V is essential. Between these two half-processes, OER is the bottleneck because of the multi-proton transfer process [14]. Introduction of a catalyst can significantly reduce this over-potential, thus resulting in improved energy conversion efficiency. Iridium oxidate is the best catalyst for OER [13] but its practical uses suffers from high price and low earth abundance, while transition metal compounds can overcome these two disadvantages and can be a good substitution to catalyze the OER reaction according to the volcano plot [13].
Molybdenum disulfide (MoS2), a typical layered transition metal dichalcogenide (TMDC), which has a 1.29 eV indirect bandgap in the bulk state and a 1.8 eV direct bandgap in the monolayer state [15], is not only the ideal candidate for future semiconductor materials [15,16,17], but also a suitable catalyst in the electrochemical catalytic field [18,19] and a lithium battery anode material [20,21,22]. There are three shortcomings which hinder the practical use of MoS2 as a catalyst in the water splitting process. First, as a typical semiconductor, MoS2 has quite poor conductivity, which causes poor electron transfer ability. Second, because of the tension strength released during the catalyzing process, catalysts are not stable. To solve these two problems, composites containing MoS2 with a substrate such as reduced graphene oxide [23], carbon nanotubes [20], or nickel foam [24], etc., have been developed and tested. Such substrates provide an excellent electron conducting network and stabilize the MoS2 in the network. Third, bulk MoS2 has few active sites. Reducing the size of the MoS2 is a feasible method to increase the active sites. There are a lot of research works focusing on the synthesis of MoS2 nano-flowers [25], nano-sheets [26] and nano-rods [27] or introducing defects such as unsaturated sulfur [28] to enhance the catalyzing performance. Most of those works are based on the hydrothermal method.
In our previous work, we synthesized a non-woven carbon nanotube film (CNT film) with a good mechanical property and high conductivity [28]. Herein, we employed such a CNT film as a supporting material, and used a developed chemical vapor deposition method to directly grow MoS2 on the CNT film for preparing hybridized structures (MoS2@CNT). As follows, an acid treatment with 10% wt HNO3 was also supposed to reduce the thickness and tune the morphology of the obtained MoS2 nanosheets in order to create more active catalytic sites in the MoS2 being exposed. Meanwhile, the entangled nanotube bundles among the CNT film can further accelerate the transport of electrons. Therefore, such deliberate processes will open up a new way for producing high-performance synergistic hybrid materials for enhanced electrochemical performance.

2. Results

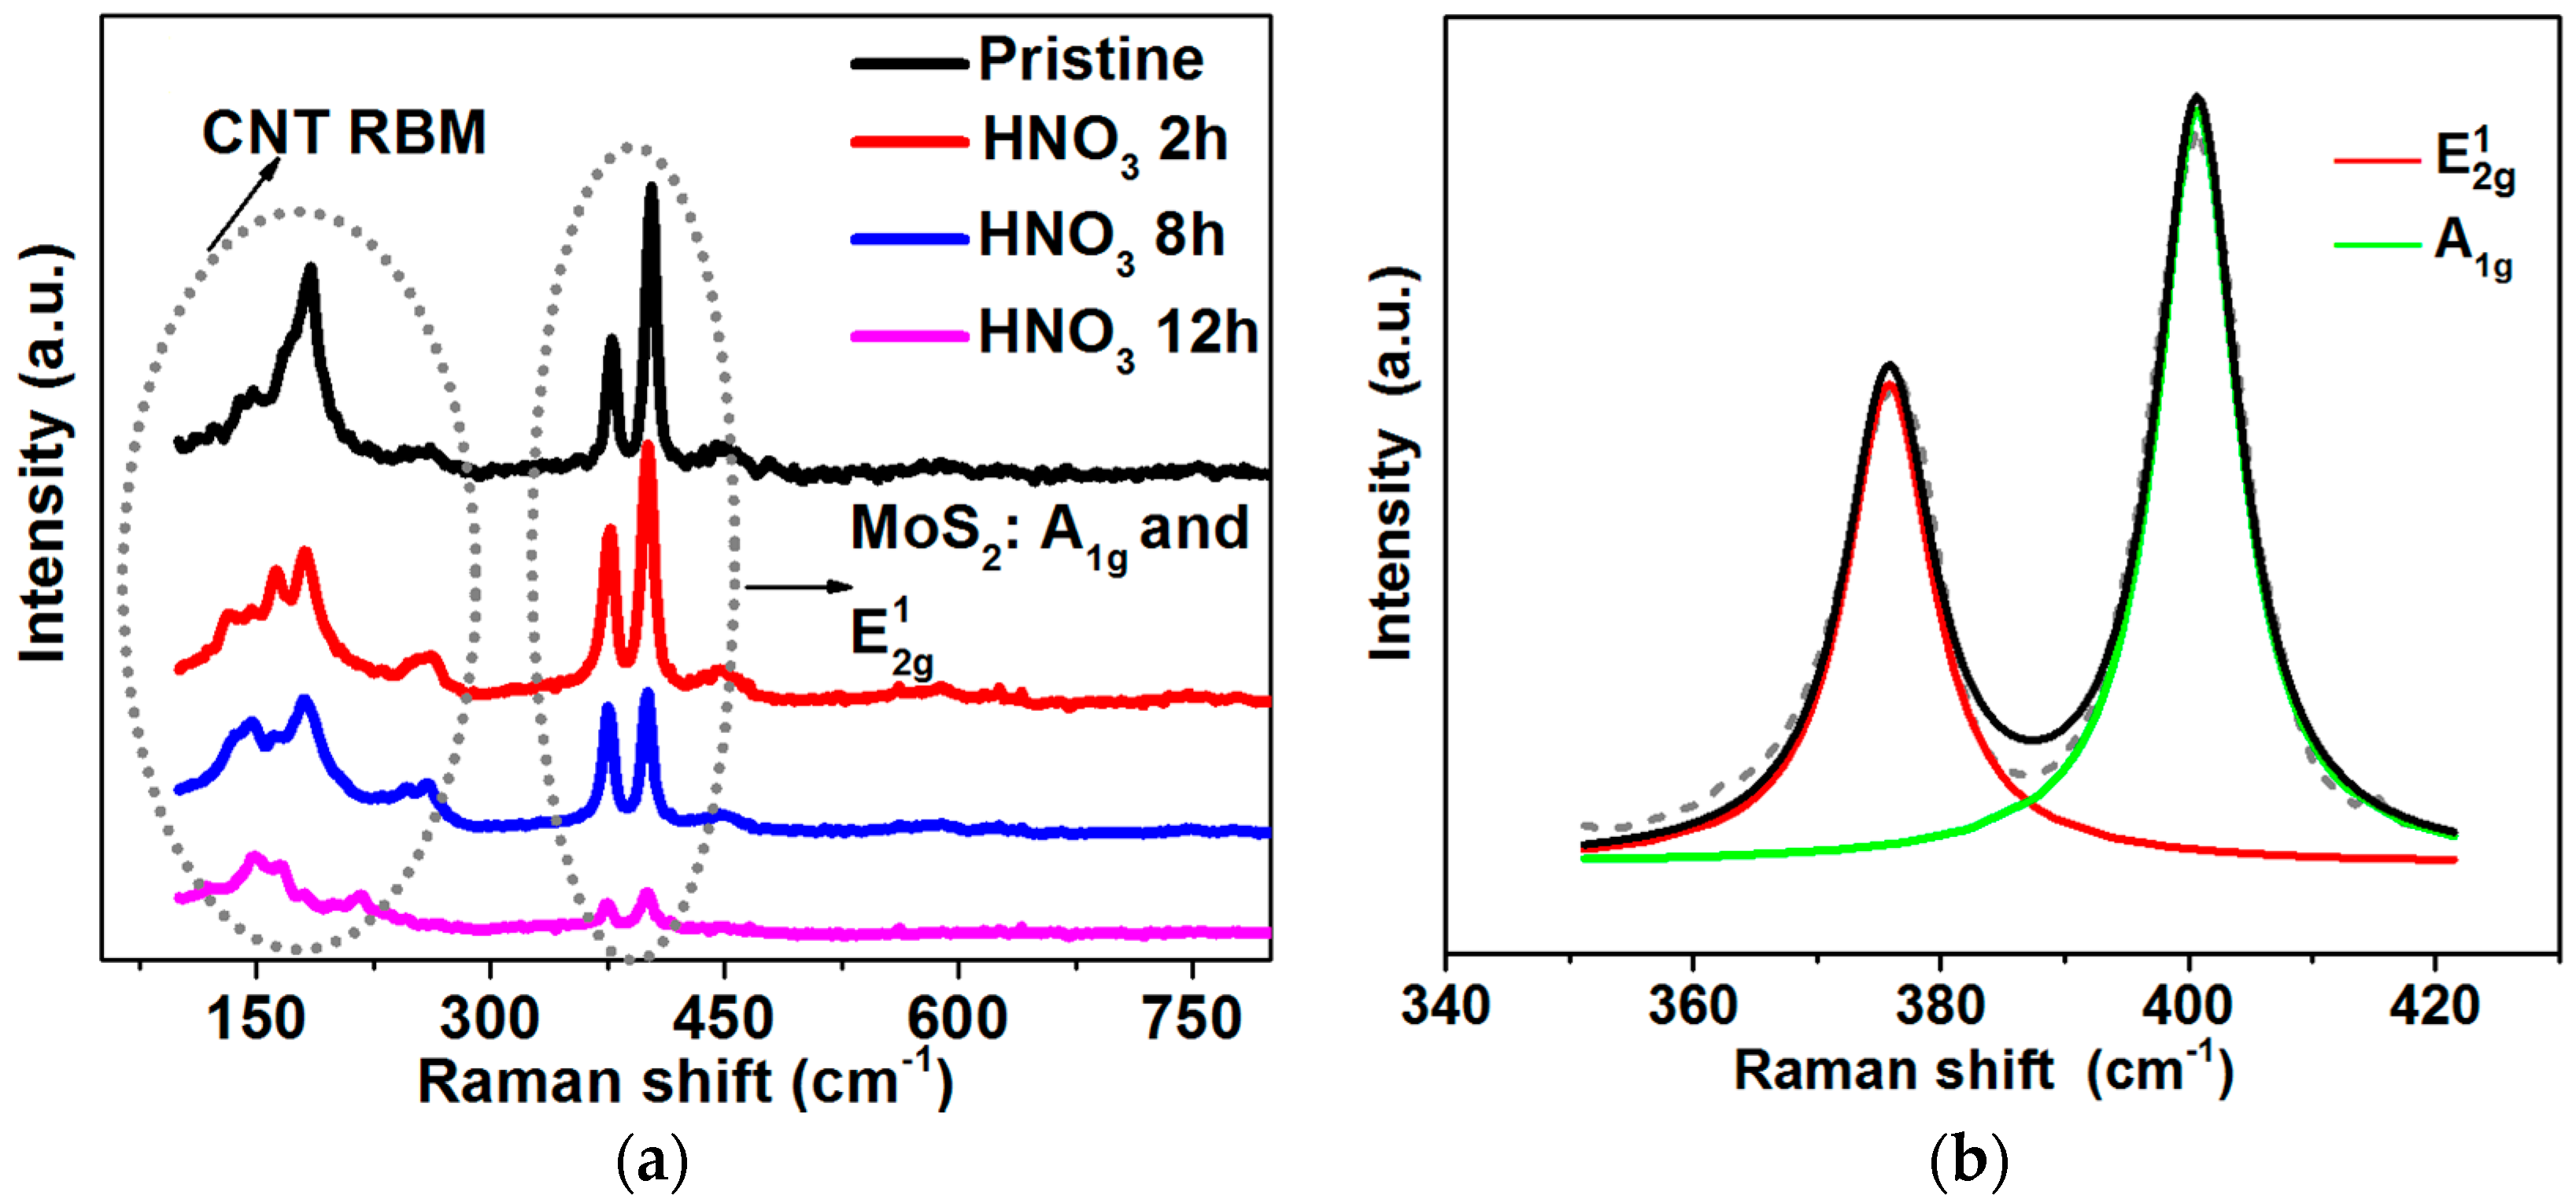
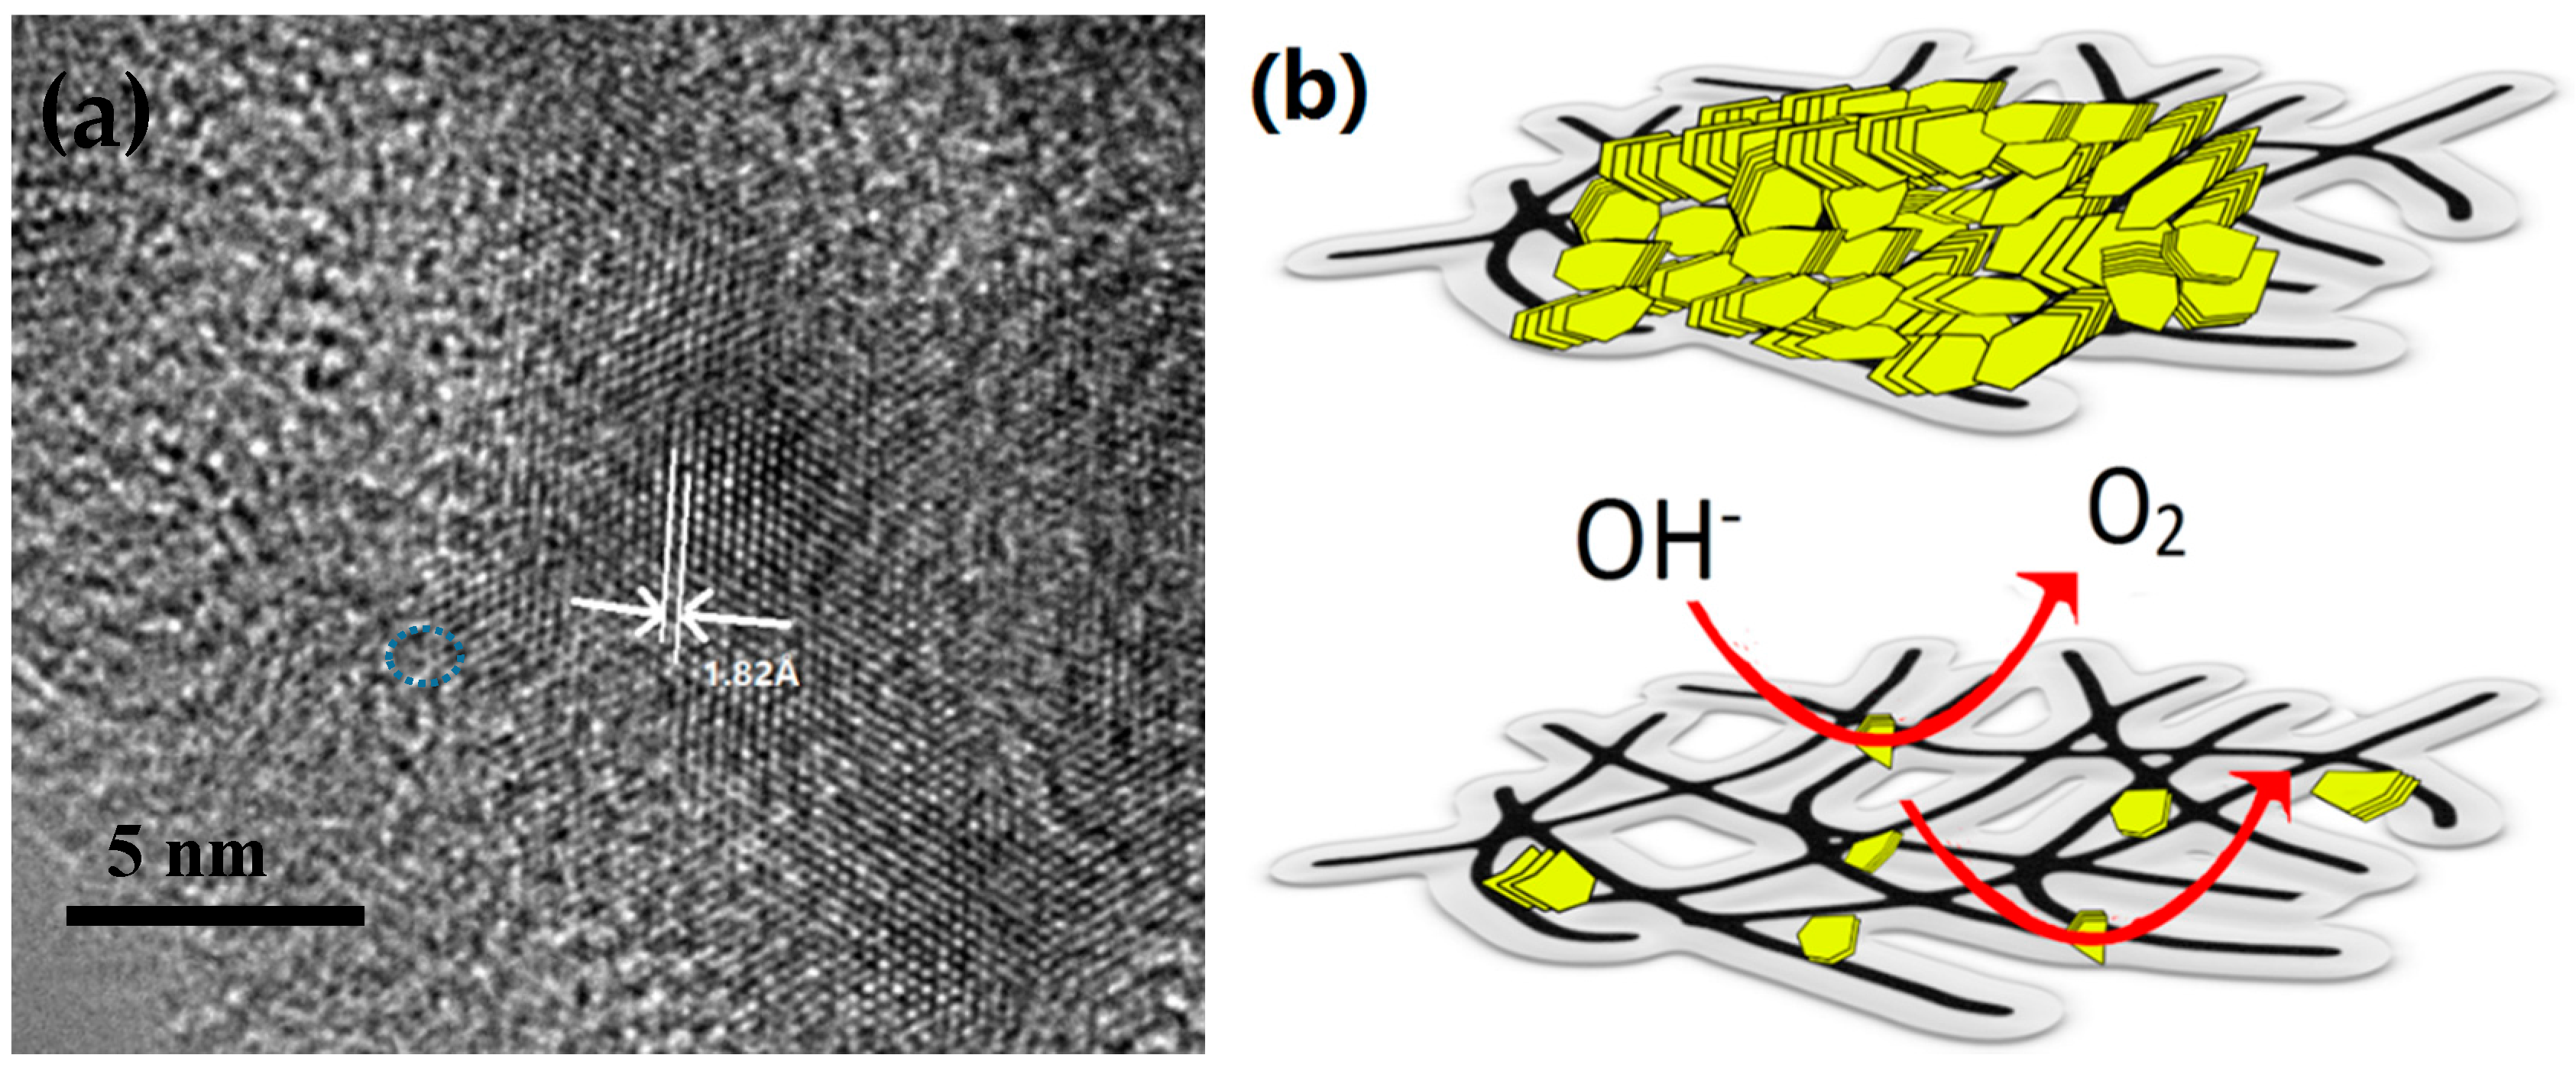
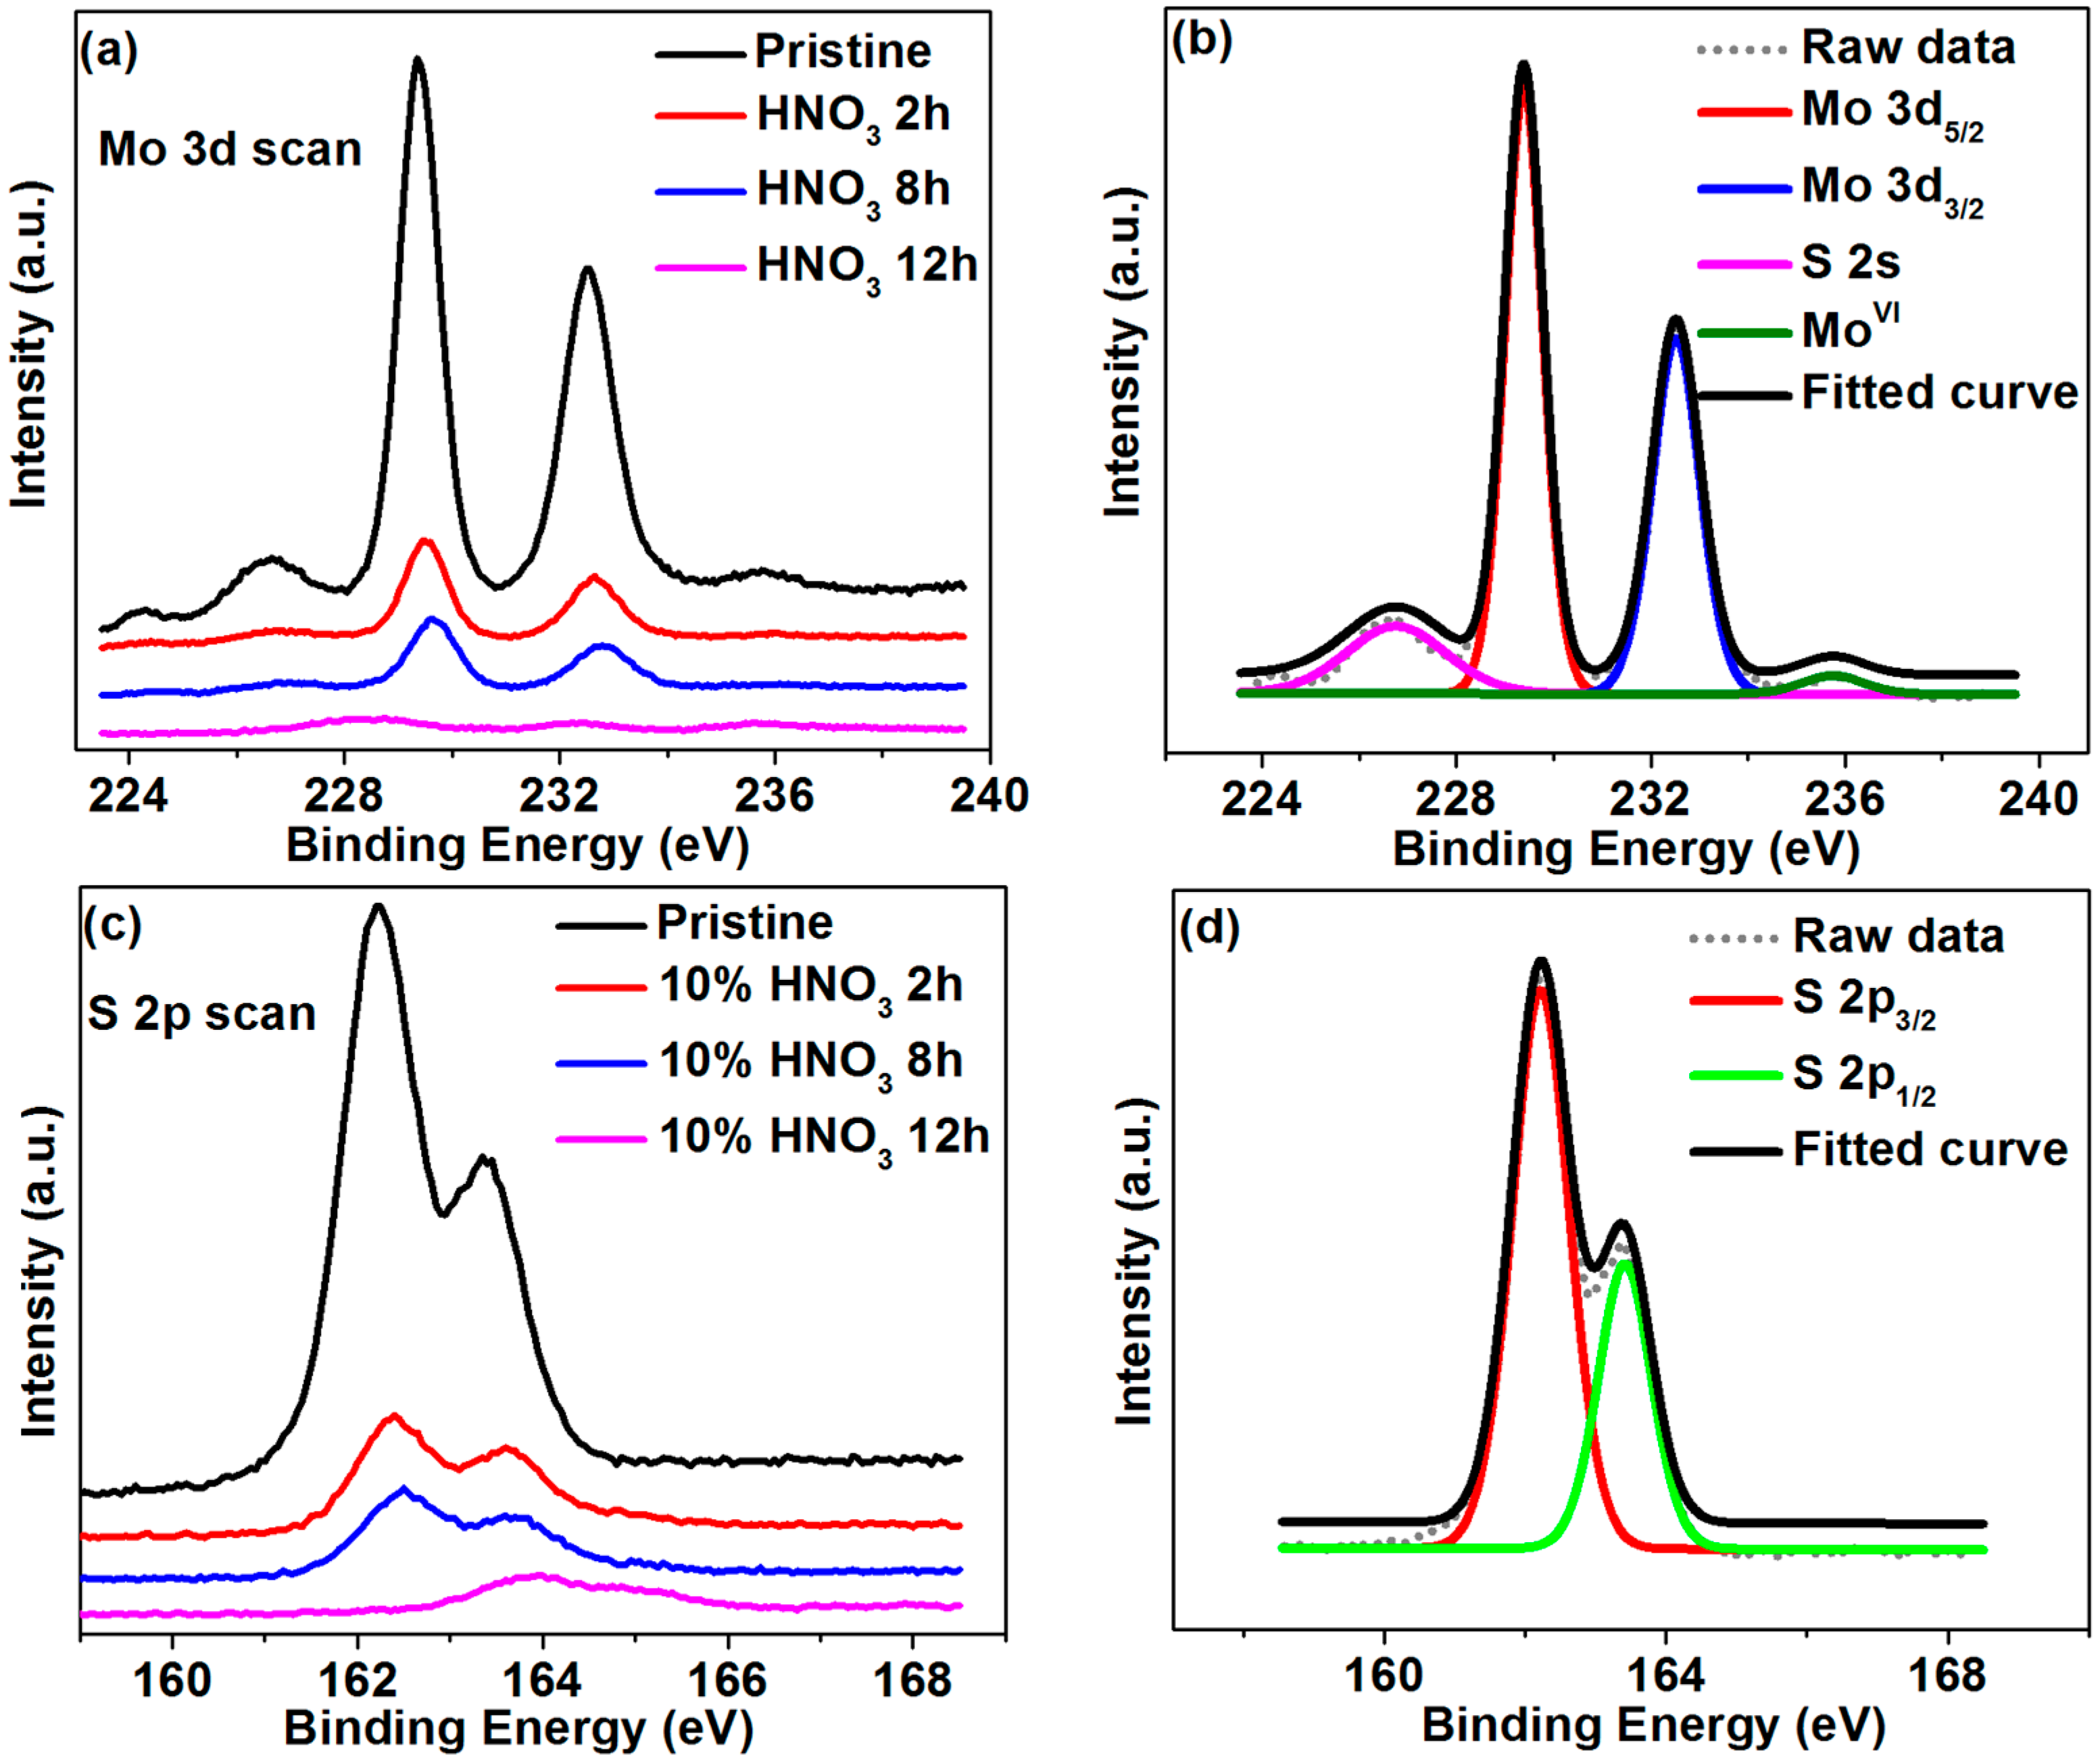
2.1. Synthesis and Characterization of MoS2@CNT Composite

Our CVD configuration that has been used to synthesize CNT film and MoS2@CNT [29] is shown in Figure 1a,b. The detailed synthesis process can be found in our previous work [30] and is also described in the following Materials and Methods section.
Scanning electronic microscopy (SEM) characterization results are shown in Figure 2a–d. In the as-grown MoS2@CNT sample, MoS2 with a pillar-like structure stacks layer by layer, thus forming thick coverage on top of the CNT film. The thick MoS2 layer has poor conductivity and fewer active sites for catalysis, which decreased the electrochemical performance. To reduce the thickness of the MoS2 cover, as-grown MoS2@CNT samples were treated with 10% wt. HNO3 for different durations. By controlling the treatment duration, we suggest that the thickness and morphology of MoS2 can be selectively modulated; hence, the electrochemical catalysis performance will be subsequently optimized. The experimental results for different durations of acid etching are shown in Figure 2b–d. After 2 h treatment the MoS2 layer thickness has been significantly reduced, thus exposing the network structure of the CNT film which is illustrated in Figure 2b. By extending the acid etching duration to 8 h (Figure 2c), the pillar structure can be further dissolved and the MoS2 coverage area is considerably diminished. When we increased the acid etching duration to 12 h, most of the MoS2 coverage was removed from the CNT film surface and the clear nanotube network structure remained, as shown in Figure 2d. In fact, there is still MoS2 retention detected from the Raman spectroscopy in Figure 3a and the X-ray photoelectron spectrum (XPS) in Figure 4a,c.
The Raman spectrum is a very useful tool to identify the existence of MoS2 [31]. Figure 3a shows the typical Raman spectra of pristine MoS2@CNT and acid-treated MoS2@CNT with different treatment durations. From the Raman spectra it can be observed that there are two main peak regions; one is at around 100–300 cm−1 which corresponds to the radial breathing mode (RBM) of single-wall carbon nanotubes [30], while the other is at 300–450 cm−1 and is related to the MoS2. The zoom-in and deconvolution results in Figure 3b clearly show two distinguishable vibration modes of MoS2, the in-plane vibration mode E 2 g 1 (~383 cm−1 for bulk MoS2) and the out-of-plane vibration mode A 1 g (~405 cm−1 for bulk MoS2). The intensity of the E 2 g 1 and A 1 g peaks was decreased with the increase of the HNO3 etching duration. Although the intensity of those two vibration modes was significantly decreased for samples treated for 12 h, their detection in the spectra reveals the existence of MoS2 at the CNT surface which is also confirmed by the following XPS results.
Figure 4 shows the XPS characterization of different-acid-etching-duration samples. The calibration was done by referencing all XPS spectra to the C (1s) peak in Figure S3. In the as-grown MoS2@CNT samples, typical Mo 3d5/2 (at 229.4 eV), Mo 3d3/2 (at 232.5 eV), together with highly oxidized Mo (MoO3 at 235.8 eV), can be seen in the deconvoluted curves [24,28]. It is worth noting that the atomic ratio of Mo and S in the as-grown MoS2@CNT is 1:2.14, calculated from Figure 4b,d.
With the increase of the HNO3 etching duration, Mo 3d and S 2p bonding became smaller and broadened, which means that the atomic ratios of these atoms were decreased. Meanwhile, the highly oxidized Mo peak disappeared, referring to the fact that MoO3 was reacted and dissolved in the HNO3 solution. Those phenomena showed that MoS2 has been etched away during acid treatment, which was also proved by the above SEM characterization (Figure 2b–d).
The surface Molybdenum (Mo) and carbon (C) atomic ratio calculated from Figure 4a and Figure S3 with an integrated peak surface area and sensitive factor correlation [32] can refer to the relative MoS2 component on the CNT film substrate surface, as shown in Table 1. With the increase of the HNO3 etching duration, MoS2 on the CNT film surface reduces significantly.

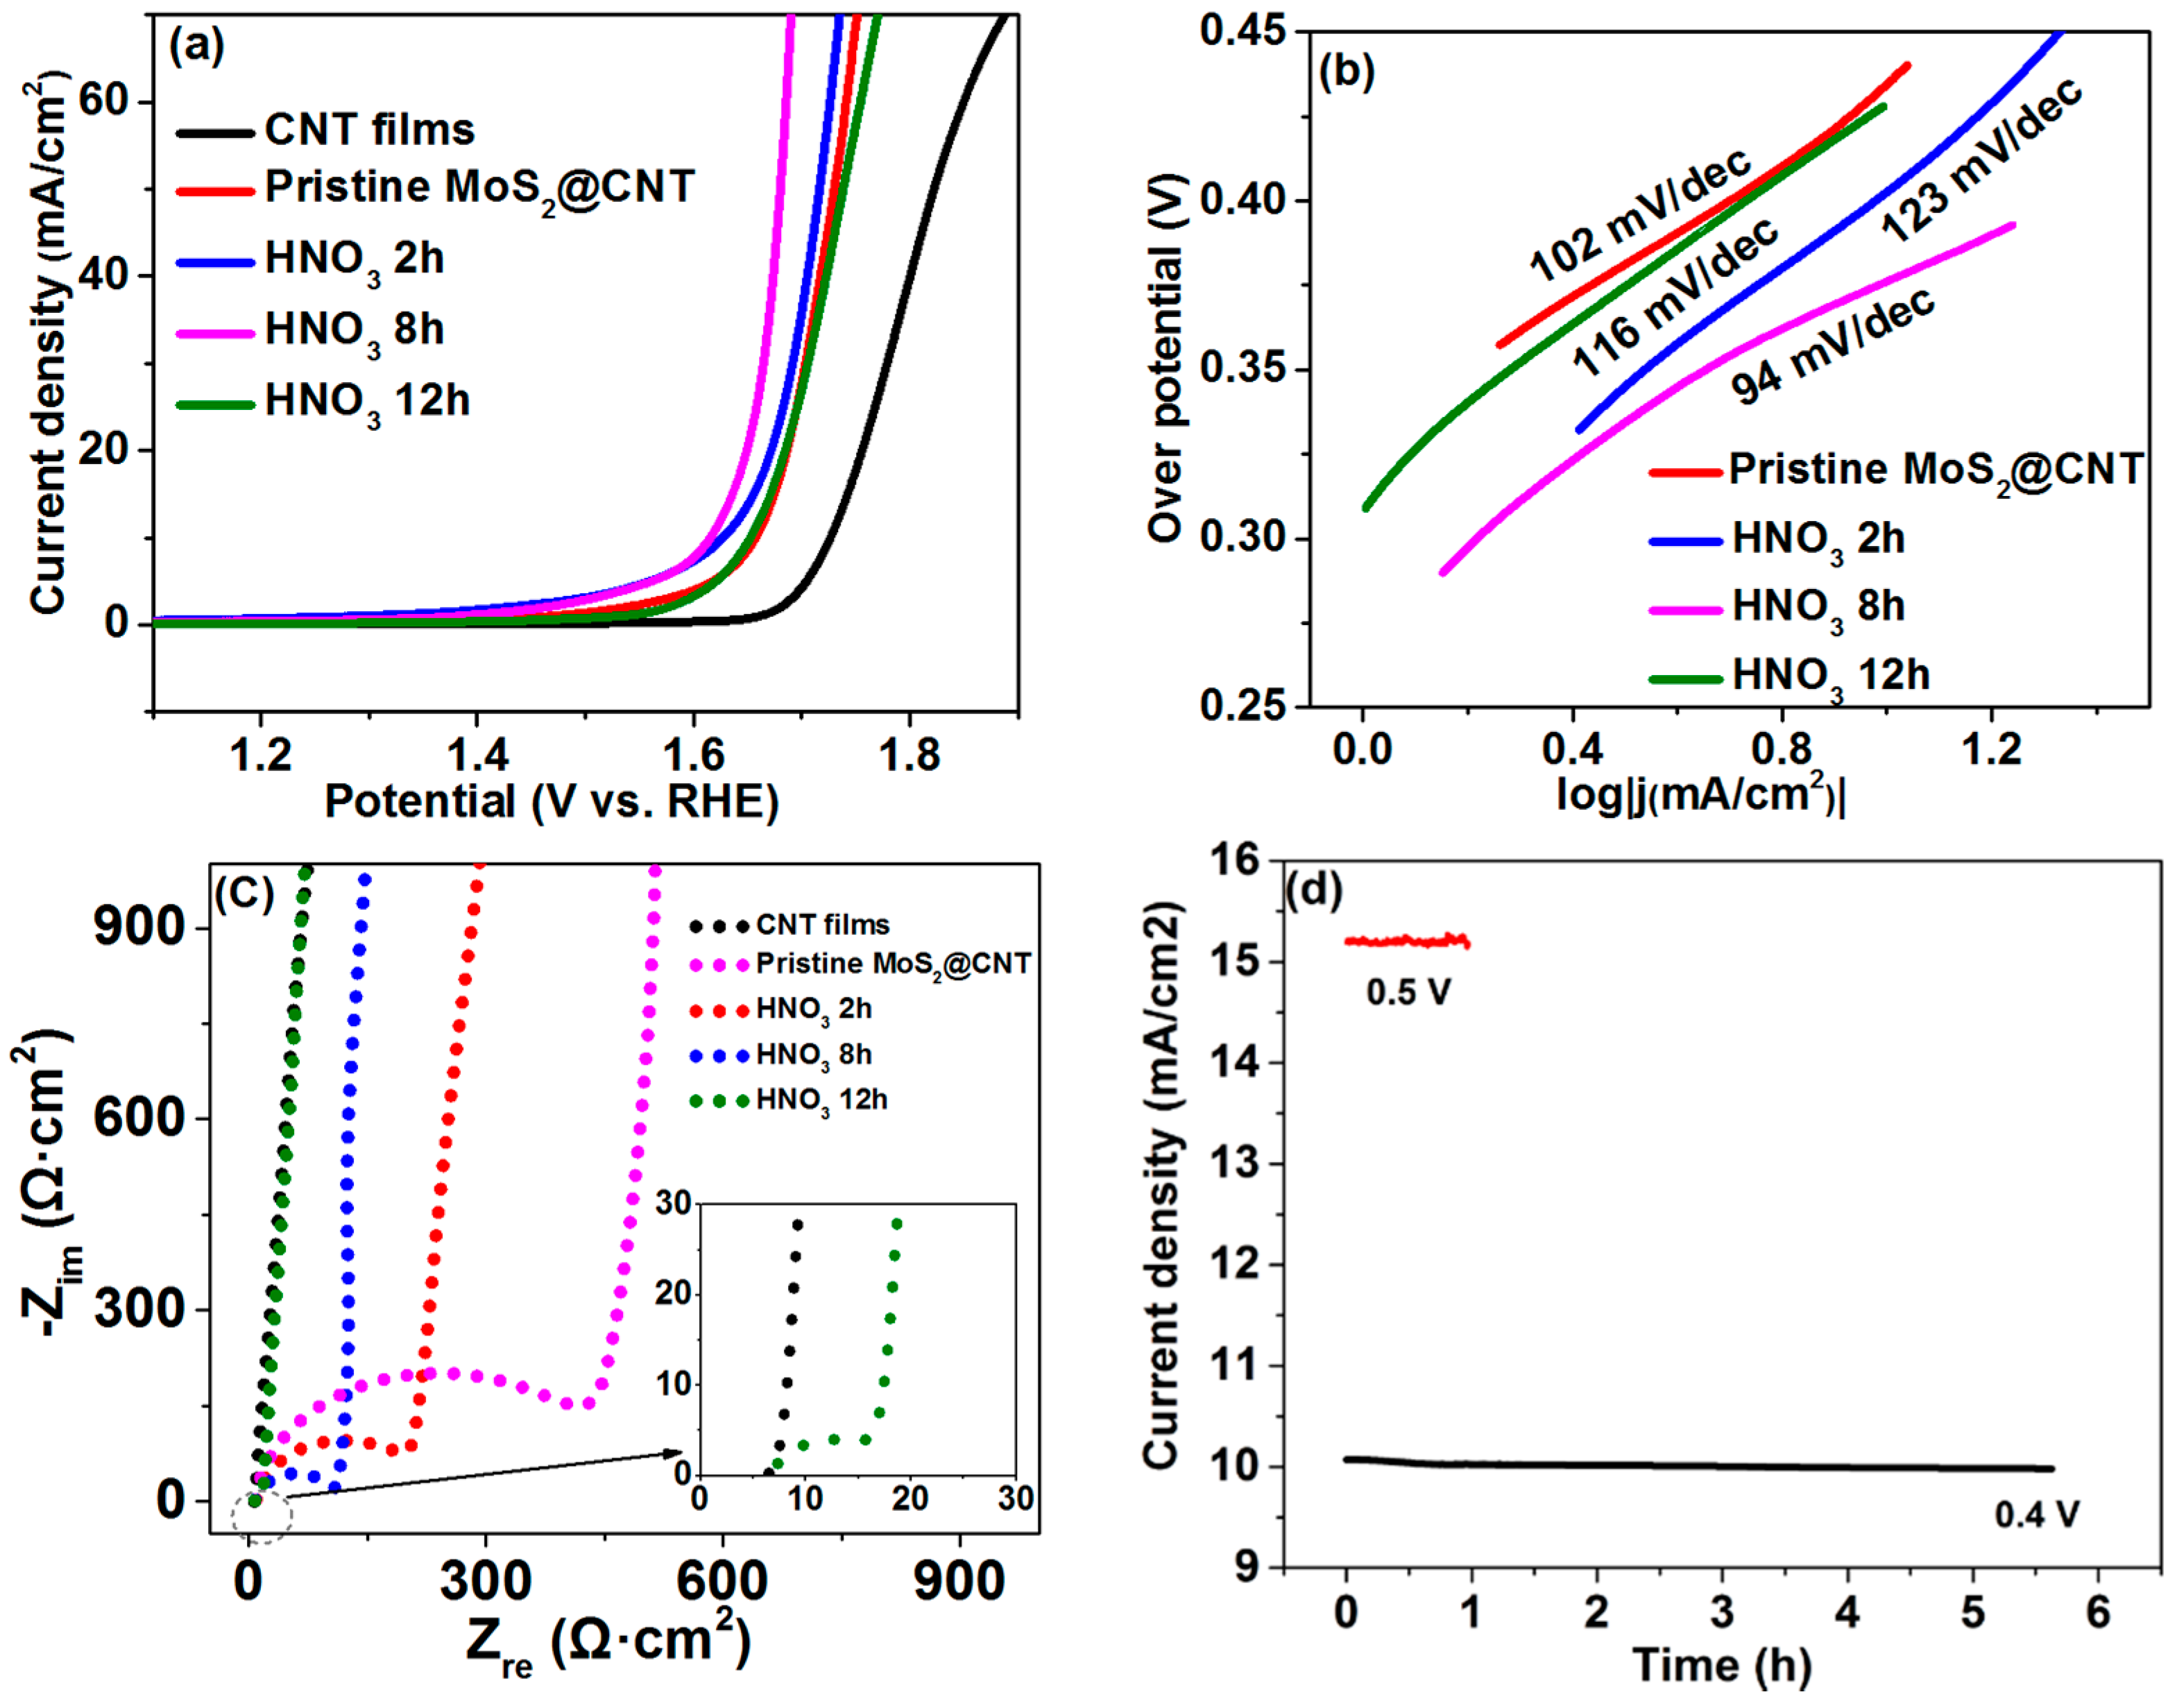
2.2. Electrochemical Performance Test of MoS2@CNT Composite

The electrochemical measurements of MoS2@CNT have been carried out with 1 M NaOH as an electrolyte and Hg/HgO as a reference electrode. Our results are shown in Figure 5. All data has been converted to a reversible hydrogen electrode (RHE). As shown in Figure 5a, the linear sweep voltammetry (LSV) results have been corrected by IR compensate.
Obviously, the MoS2@CNT exhibited a better OER catalyzing performance as compared to the CNT film. With the increase of the HNO3 etching duration, the MoS2@CNT catalyzing performance showed significant improvement, but after a certain point, the performance was decreased. The required over-potential when the current density reaches 10 mA/cm2 is 504 mV, 435 mV, 404 mV, 375 mV and 428 mV for CNT film, pristine MoS2@CNT, and MoS2@CNT treated with HNO3 for 2 h, 8 h and 12 h.
From Figure 5b, with the increase of the acid etching duration, the tafel slope of MoS2@CNT showed clear changes. In particular, the 8 h acid-treated sample had the smallest tafel slope, suggesting the best dynamic process among those etching samples. Impedance tests were performed on the samples, as shown in Figure 5c. Pristine MoS2@CNT showed a 400 Ω electron transfer resistance (Rct). With the increase of the acid etching duration, Rct decreased gradually, as expected. The inserted curve of Figure 5c revealed that the CNT film has a very small Rct (~5 Ω), which can promote the catalyzing performance. Based on the above data, Figure 5d showed the catalytic performance stability of the HNO3 etching duration MoS2@CNT samples. The catalytic performance showed a slight decrease after a 6 h test under a 0.4 V over-potential. When increasing this over-potential to 0.5 V, the current density can reach 15 mA/cm. However, after a 1 h test, the current density dropped rapidly, which means the catalytic stability decreased.

3. Discussion

The pristine MoS2@CNT has a fairly thick MoS2 layer, thus it has fewer active sites (Figure 2a) and poor electron transfer ability (Figure 5c). When treated with 10% wt. HNO3, the MoS2 reacted with HNO3 and formed MoO3, and then MoO3 further reacted with HNO3 and was dissolved into the solution. The possible mechanism can be elucidated with the following chemical process [33].
MoS 2   HNO 3   MoO 3 + SO 2
MoO 3   HNO 3   H 2 MoO 4
After etching with acid for different time durations, the MoS2 layer was etched gradually; also the layer integrity was destroyed, as shown in the SEM results (Figure 2b,c), which was further proved by the transmission electron microscopy (TEM) results (Figure 6a). More MoS2 edges were exposed which resulted in more active sites (Figure 6b). Meanwhile, the reduction of the layer thickness can guarantee sufficient contact between the MoS2 and CNT film; hence, the electron conductivity could be greatly improved. In fact, a further increased acid etching duration (more than 8 h) can further enhance the electron transfer ability, but the active sites decreased significantly, resulting in a poor catalyzing performance (Figure 2d and Figure 5a).

4. Materials and Methods

MoO3 (99.5%) was purchased from Alfa Aesar (Yingong RD No. 229, Fengxian Chemical District, Shanghai, China), The other reagents were purchased from Sinopharm Chemical Reagent Co. Ltd. (Ningbo RD No. 22, Shanghai, China): Sulfur (99.999%), Ferrocene (98%), Ethanol (AR), HCl (37%, AR), and HNO3 (66%, AR). All chemical reagents have been purchased from company and used without further purification.

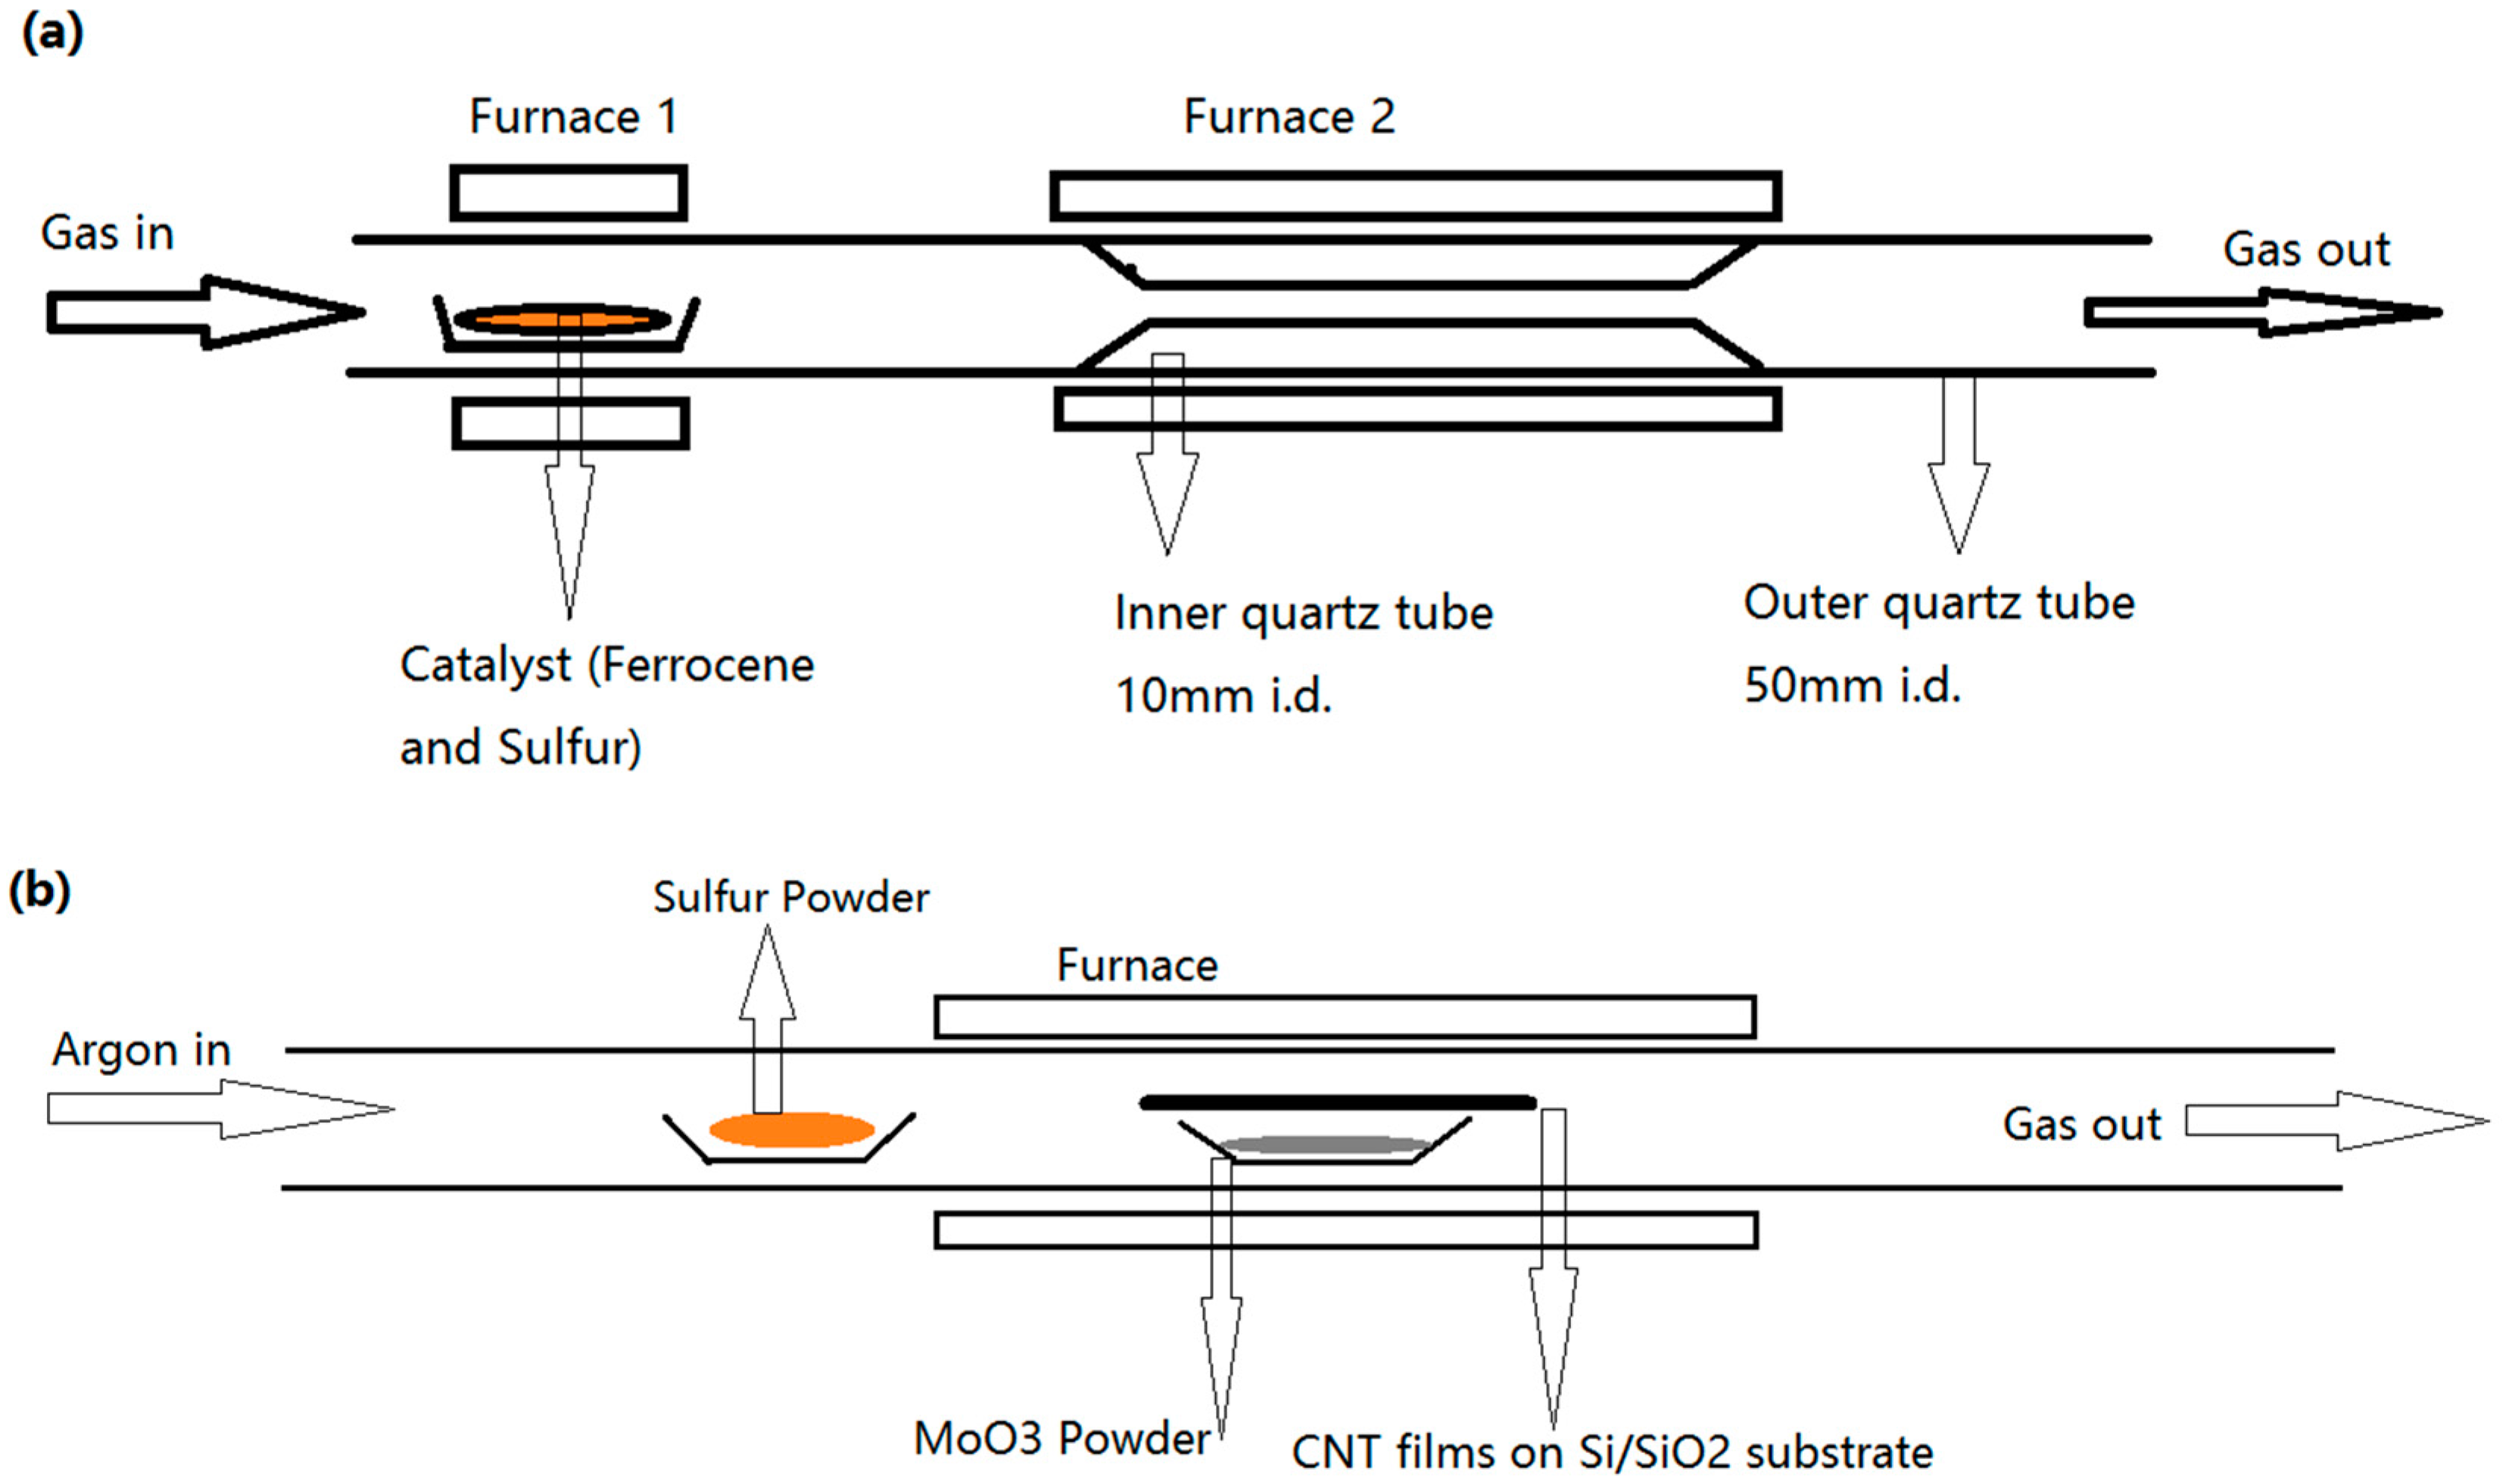
4.1. Synthesis of CNT Film

Carbon nanotube film was synthesized by a floating CVD method as reported before [30]. The configuration is shown in Figure 1a. A special designed 50 mm diameter quartz tube with a 10 mm diameter inner tube was placed in furnace (MTK Co. Ltd., Hefei, China) and extra heating belt was set to heat the catalyst (16:1 molar ratio Ferrocene:S).
CNT film has been prepared by the following temperature process: main heating zone was heated to 1000 °C with a 30 °C/min ramping rate and a 200 sccm argon airflow was introduced as protective atmosphere. Next, temperature was increased to 1100 °C with 10 °C/min rate and at the same time second furnace was set to heat the catalyst at 90 °C. On reaching to 1100 °C, argon flow was increased to 1000 sccm and mixed with 3 sccm methane flow. After two hours of growth time, furnace was stopped and cooled to room temperature naturally. The as prepared CNT film has a high stretchable big size as shown in Figure S1.
The as-grown CNT film was first oxidized at 300~400 °C for 12~24 h to remove amorphous carbon, then immersed in 37% HCl for seven days to get rid of iron particles induced by ferrocene. After these purification steps, a clean random carbon nanotube network could be seen as shown in Figure S2. The purified CNT film was stored in ethanol.

4.2. Synthesis of MoS2@CNT

To get a uniform MoS2 layer on CNT film, first extended CNT film in Distilled Water and then transfer on Si/SiO2 substrate. After drying in oven at 90 °C, CNT film was placed upside down on a ceramic boat where deposed 14 mg MoO3. As shown in Figure 1b, ceramic boat was place in the middle of furnace, and at the edge of furnace hot zone, another boat with 120 mg sulfur powder was placed.
The growing process can be described as following steps. First 1000 sccm argon flow was introduced to get rid of air remaining in quartz tube. After 10 min argon rinsing, increased temperature to 750 °C with a 50 °C/min ramping rate, and MoS2 growth time lasted for 2 min at this temperature. After growing process was finished, to ensure good MoS2 structure, furnace has been opened to cool the quartz tube rapidly.
As-grown MoS2@CNT was treated in 10% wt. HNO3 for different times to etch MoS2 layer. After treated with HNO3, MoS2@CNT can be peeled off from Si/SiO2 substrate for next characterizations and testing steps.

4.3. Characterizations

Scanning Electron Microscopy (SEM). A field emission scanning electron microscope (SEM 15 kV, JEOL, JSM-6700F, Tokyo, Japan).
X-ray Photoelectron Spectroscopy (XPS, AXIS-HIS, Kratos Analytical, Hadano, Japan). The Photoemission Endstation at the BL10B beamline in the National Synchrotron Radiation Laboratory (NSRL) in Hefei, China.
Transmission electron microscopy (TEM). A field emission transmission electron microscope (TEM 200 kV, JEOL, JEM-2100F, Tokyo, Japan).
X-ray Diffraction (XRD, Japanese Rigaku Company, Tokyo, Japan). A D8-Advance power diffractometer with a Cu-Kα radiation source (λ = 1.54178 Å).
Raman Spectra. A Horiba microscopic Raman spectrometer (XploRA, HORIBA, Ltd., Tokyo, Japan). The laser having wavelength 532 nm (~2.5 mW/cm2) over a range of 70–3000 cm−1.

4.4. Electrochemical Measurements

All the electrochemical measurements were carried out with an electrochemical workstation (CHI660D electrochemical workstation) in a standard three-electrode cell with Hg/HgO and Pt mesh as the reference electrode and counter electrode, respectively. A glassy carbon (GC) electrode (3 mm in diameter) acted as the working electrode. OER measurements were conducted in 1 M NaOH as the electrolyte, which was saturated with oxygen during the experiments. The LSVs were performed at a scanning rate of 5 mV/s. The EIS spectrum was carried out with a 5 mV perturbative potential. The amperometric i-t curve was carried out with the same test condition as LSV scan.

5. Conclusions

In summary, we have employed a purified non-woven CNT film as a supporting material for directly growing MoS2 on it with the CVD method. The obtained samples showed hybridized structures with thick MoS2 nanosheets decorated on the CNT bundles. By etching the obtained MoS2@CNT with 10% wt. HNO3, the morphology of MoS2 has been tuned to expose more catalytic active sites. Meanwhile, the contact between the MoS2 and CNT film became tighter; hence, the electron transfer ability has been improved. The synergistic effect subsequently enhanced the electrochemical performance for OER catalysis. This work shows a possibility to directly prepare CNT-based hybrids and provides a way to tune the electron structure of the hybrids with acid treatment. Considering the fact that CVD method can be easily conducted for industrial producing, this study with the CVD growth and acid-etching process may be quite essential for future CNT-based electrochemical and electronic applications.

Supplementary Materials

Supplementary materials can be accessed at: https://www.mdpi.com/1420-3049/21/10/1318/s1.

Acknowledgments

We acknowledge the financial support from the National Basic Research Program of China (2014CB848900), NSF (U1232131, U1532112, 11375198, 11574280), CUSF (WK2310000053), User with Potential from CAS Hefei Science Center (2015HSC-UP020). L.S. thanks the recruitment program of global experts, the CAS Hundred Talent Program. We also thank the Hefei Synchrotron Radiation Facility (MCD, photoemission and Catalysis/Surface Science Endstations, NSRL), and the USTC Center for Micro and Nanoscale Research and Fabrication for help in characterizations and fabrications.

Author Contributions

Weiyu Xu and Qi Fang conceived and designed the experiments; Qi Fang performed the experiments; Weiyu Xu analyzed the data and wrote the paper; Daobin Liu and Ke Zhang contributed analysis tools and guidance; Chuanqiang Wu contributed TEM characterization; Muhammad Habib contributed materials; Xusheng Zheng and Shuangming Chen contributed XPS experiment and analysis. Henjie Liu contributed electrochemical test help; Song Li is the designer and supervisor of the project. All authors discussed and wrote the manuscript.

Conflicts of Interest

The authors declare no conflict of interest.

References

  1. Green, M.A.; Emery, K.; Hishikawa, Y.; Warta, W.; Dunlop, E.D. Solar cell efficiency tables (Version 45). Prog. Photovolt. Res. Appl. 2015, 23. [Google Scholar] [CrossRef]
  2. Lenert, A.; Wang, E.N. Optimization of nanofluid volumetric receivers for solar thermal energy conversion. Sol. Energy 2012, 86, 253–265. [Google Scholar]
  3. Mei, A.; Li, X.; Liu, L.; Ku, Z.; Liu, T.; Rong, Y.G.; Xu, M.; Chen, J.Z.; Yang, Y. A hole-conductor-free, fully printable mesoscopic perovskite solar cell with high stability. Science 2014, 345, 295–298. [Google Scholar] [CrossRef] [PubMed]
  4. You, J.; Dou, L.; Yoshimura, K.; Kato, T.; Ohya, K.; Moriarty, T.; Emery, K.; Chen, C.C.; Gao, J.; Li, G.; et al. A polymer tandem solar cell with 10.6% power conversion efficiency. Nat. Commun. 2013, 4. [Google Scholar] [CrossRef] [PubMed]
  5. Díaz-González, F.; Sumper, A.; Gomis-Bellmunt, O.; Villafáfila-Robles, R. A review of energy storage technologies for wind power applications. Renew. Sustain. Energy Rev. 2012, 16, 2154–2171. [Google Scholar] [CrossRef]
  6. Hirth, L. The market value of variable renewables. Energy Econ. 2013, 38, 218–236. [Google Scholar] [CrossRef]
  7. Zhao, H.; Wu, Q.; Hu, S.; Xu, H.; Rasmussen, C.N. Review of energy storage system for wind power integration support. Appl. Energy 2015, 137, 545–553. [Google Scholar] [CrossRef]
  8. Follett, R.F.; Vogel, K.P.; Varvel, G.E.; Mitchell, R.B.; Kimble, J. Soil Carbon Sequestration by Switchgrass and No-Till Maize Grown for Bioenergy. BioEnergy Res. 2012, 5, 866–875. [Google Scholar] [CrossRef]
  9. Gelfand, I.; Saphajpal, R.; Zhang, X.; Izaurralde, R.C.; Fross, K.L.; Robertson, G.P. Sustainable bioenergy production from marginal lands in the US Midwest. Nature 2013, 493, 514–517. [Google Scholar] [CrossRef] [PubMed]
  10. Jones, C.S.; Mayfield, S.P. Algae biofuels: Versatility for the future of bioenergy. Curr. Opin. Biotechnol. 2012, 23, 346–351. [Google Scholar] [CrossRef] [PubMed]
  11. Meier, D.; Beld, D.V.B.; Bridgwater, A.V.; Elliott, D.C.; Oasmaa, A.; Preto, F. State-of-the-art of fast pyrolysis in IEA bioenergy member countries. Renew. Sustain. Energy Rev. 2013, 20, 619–641. [Google Scholar] [CrossRef]
  12. Mullet, J.; Morishige, D.; McCormick, R.; Truong, S.; Hilley, H.; McKinley, B.; Anderson, R.; Olson, S.; Rooney, W. Energy sorghum—A genetic model for the design of C4 grass bioenergy crops. J. Exp. Bot. 2014, 65, 3479–3489. [Google Scholar] [CrossRef] [PubMed]
  13. Greeley, J.; Markovic, N.M. The road from animal electricity to green energy: Combining experiment and theory in electrocatalysis. Energy Environ. Sci. 2012, 5. [Google Scholar] [CrossRef]
  14. Diaz-Morales, O.; Ledezma-Yanez, I.; Koper, M.T.M.; Calle-Vallejo, F. Guidelines for the Rational Design of Ni-Based Double Hydroxide Electrocatalysts for the Oxygen Evolution Reaction. ACS Catalysis 2015, 5, 5380–5387. [Google Scholar] [CrossRef]
  15. Buscema, M.; Barkelid, M.; Zwiller, V.; Zant, H.S.; Steele, G.A.; Castellanos-Gomez, A. Large and tunable photothermoelectric effect in single-layer MoS2. Nano Lett. 2013, 13, 358–363. [Google Scholar] [CrossRef] [PubMed]
  16. Castellanos-Gomez, A.; Cappelluti, E.; Roldán, R.; Agrait, N.; Guinea, F.; Rubio-Bollinger, G. Electric-field screening in atomically thin layers of MoS2: The role of interlayer coupling. Adv. Mater. 2013, 25, 899–903. [Google Scholar] [CrossRef] [PubMed]
  17. Chuang, S.; Battaglia, C.; Azcatl, A.; McDonnell, S.; Kang, J.S.; Yin, X.; Tosun, M.; Kapadia, R.; Fang, H.; Mallace, R.M.; et al. MoS2 P-type transistors and diodes enabled by high work function MoOx contacts. Nano Lett. 2014, 14, 1337–1342. [Google Scholar] [CrossRef] [PubMed]
  18. Chen, Z.; Cummins, D.; Reinecke, B.N.; Clark, E.; Sunkara, M.K.; Jaramillo, T.F. Core-shell MoO3-MoS2 nanowires for hydrogen evolution: A functional design for electrocatalytic materials. Nano Lett. 2011, 11, 4168–4175. [Google Scholar] [CrossRef] [PubMed]
  19. Drescher, T.; Niefind, F.; Bensch, W.; Grunert, W. Sulfide catalysis without coordinatively unsaturated sites: Hydrogenation, cis-trans isomerization, and H2/D2 scrambling over MoS2 and WS2. J. Am. Chem. Soc. 2012, 134, 18896–18899. [Google Scholar] [CrossRef] [PubMed]
  20. Bindumadhavan, K.; Srivastava, S.K.; Mahanty, S. MoS2-MWCNT hybrids as a superior anode in lithium-ion batteries. Chem. Commun. 2013, 49, 1823–1825. [Google Scholar] [CrossRef] [PubMed]
  21. Chang, K.; Chen, W. In situ synthesis of MoS2/graphene nanosheet composites with extraordinarily high electrochemical performance for lithium ion batteries. Chem Commun. 2011, 47, 4252–4254. [Google Scholar] [CrossRef] [PubMed]
  22. Chang, K.; Geng, D.; Li, X.; Yang, J.; Tang, Y.; Cai, M.; Li, R.; Sun, X. Ultrathin MoS2/Nitrogen-Doped Graphene Nanosheets with Highly Reversible Lithium Storage. Adv. Energy Mater. 2013, 3, 839–844. [Google Scholar] [CrossRef]
  23. Li, Y.; Wang, H.; Xie, L.; Liang, Y.; Hong, G.; Dai, H. MoS2 nanoparticles grown on graphene: An advanced catalyst for the hydrogen evolution reaction. J. Am. Chem. Soc. 2011, 133, 7296–7299. [Google Scholar] [CrossRef] [PubMed]
  24. Yan, K.; Lu, Y. Direct Growth of MoS2 Microspheres on Ni Foam as a Hybrid Nanocomposite Efficient for Oxygen Evolution Reaction. Small 2016, 12, 2975–2981. [Google Scholar] [CrossRef] [PubMed]
  25. Hu, S.; Chen, W.; Zhou, J.; Yin, F.; Uchaker, E.; Zhang, Q.; Cao, G. Preparation of carbon coated MoS2 flower-like nanostructure with self-assembled nanosheets as high-performance lithium-ion battery anodes. J. Mater. Chem. A 2014, 2. [Google Scholar] [CrossRef]
  26. Voiry, D.; Salehi, M.; Silva, R.; Fujita, T.; Chen, M.; Asefa, T.; Shenoy, V.B.; Eda, G.; Chhowalla, M. Conducting MoS2 nanosheets as catalysts for hydrogen evolution reaction. Nano Lett. 2013, 13, 6222–6227. [Google Scholar] [CrossRef] [PubMed]
  27. Tian, Y.; Zhao, J.; Fu, W.; Liu, Y.; Zhu, Y.; Wang, Z. A facile route to synthesis of MoS2 nanorods. Mater. Lett. 2005, 59, 3452–3455. [Google Scholar] [CrossRef]
  28. Liu, D.; Xu, W.; Liu, Q.; He, Q.; Haleem, Y.A.; Xiang, T.; Zou, C.; Chu, W.; Zhong, J.; Niu, Z.; et al. Unsaturated-sulfur-rich MoS2 nanosheets decorated on free-standing SWNT film: Synthesis, characterization and electrocatalytic application. Nano Res. 2016, 9, 2079–2087. [Google Scholar] [CrossRef]
  29. Shi, Y.; Li, H.; Li, L.J. Recent advances in controlled synthesis of two-dimensional transition metal dichalcogenides via vapour deposition techniques. Chem. Soc. Rev. 2015, 44, 2744–2756. [Google Scholar] [CrossRef] [PubMed]
  30. Song, L.; Ci, L.; Lv, L.; Zhou, Z.; Yan, X.; Liu, D.; Yuan, H.; Gao, Y.; Wang, J.; Liu, L. Direct synthesis of a macroscale single-walled carbon nanotube non-woven material. Adv. Mater. 2004, 16. [Google Scholar] [CrossRef]
  31. Li, H.; Zhang, Q.; Yap, C.C.; Tay, B.K.; Edwin, T.H.; Olivier, A.; Baillargeat, D. From Bulk to Monolayer MoS2: Evolution of Raman Scattering. Adv. Funct. Mater. 2012, 22, 1385–1390. [Google Scholar] [CrossRef]
  32. Burrow, B.J. A correlation of Auger electron spectroscopy, X-ray photoelectron spectroscopy, and Rutherford backscattering spectrometry measurements on sputter-deposited titanium nitride thin films. J. Vac. Sci. Technol. A 1986, 4. [Google Scholar] [CrossRef]
  33. Amara, K.K.; Chu, L.; Kumar, R.; Toh, M.; Eda, G. Wet chemical thinning of molybdenum disulfide down to its monolayer. APL Mater. 2014, 2. [Google Scholar] [CrossRef]
  34. Shariza, S.; Anand, T.J.S. Effect of Deposition Time on the Structural and Optical Properties of Molybdenum Chalcogenides Thin Films. Chalcogenide Lett. 2011, 8, 529–539. [Google Scholar]
  • Sample Availability: Samples of the compounds are available from the authors.
Figure 1. Schematic route of the CVD configuration used to grow: (a) CNT film; and (b) MoS2@CNT hybrids.
Molecules 21 01318 g001
Figure 2. SEM surface morphology of MoS2@CNT composite: (a) pristine sample and (bd) treated with 10% wt. HNO3 for 2 h, 8 h, and 12 h.
Molecules 21 01318 g002
Figure 3. Raman spectrum of MoS2@CNT: (a) Pristine and treated samples with HNO3 for 2 h, 8 h and 12 h. (b) Deconvolution results of pristine MoS2@CNT for E 2 g 1 and A 1 g modes.
Molecules 21 01318 g003
Figure 4. XPS results of different samples: (a,c) Mo 3d and S 2p curve comparison among different durations of acid-treated (pristine, 2 h, 8 h, 12 h) MoS2@CNT, and (b,d) pristine MoS2@CNT Mo 3d and S 2p deconvolution.
Molecules 21 01318 g004
Figure 5. Electrochemical performances of different acid etching MoS2@CNT: (a) LSV curves of CNT film, pristine MoS2@CNT, MoS2@CNT treated with HNO3 for 2 h, 8 h and 12 h; and (b) corresponding tafel slope; (c) Impedance curves of pristine MoS2@CNT, MoS2@CNT treated with HNO3 for 2 h, 8 h and 12 h; (d) Current-time plot of the 8 h HNO3 etching duration MoS2@CNT.
Molecules 21 01318 g005
Figure 6. TEM images of MoS2@CNT: (a) high magnification image of MoS2@CNT and 1.82 Å is referred to the 2H-MoS2 (105) plane [34]. (b) Schematic illustration of: top, pristine MoS2@CNT and bottom, etching MoS2@CNT OER process. Black network refers to CNT film and yellow sheets refer to MoS2.
Molecules 21 01318 g006
Table 1. Surface Mo and C atomic ratio of different HNO3 etching duration samples.
Atomic RatioPristine10% wt HNO3 2 h10% wt HNO3 8 h10% wt HNO3 12 h
Surface Mo and C atomic ratio1.5550.0730.0470.009

